Diagnostics and contacting Technical Support
If you are unable to configure Kaspersky IoT Secure Gateway 100 and cannot find a resolution to your issue in the documentation, you can run diagnostics yourself and then contact Technical Support with the diagnostic information that you obtained.
The Kaspersky IoT Secure Gateway 100 diagnostics scenario consists of the following steps:
- Checking the connection to the MQTT broker
Perform the following checks on the
side:- Check the gateway status (online or offline).
- If the MQTT broker is maintaining an event log, check the diagnostic messages regarding the transmission of data from the gateway.
- Check the regularity of MQTT messages.
- If there is a limit on inbound traffic, make sure that this limit is not being exceeded.
- Inspecting the device
Conduct an inspection of hardware components. You will need to assess the following:
- state of the LED indicators for PWR, SD, and OC;
- proper connection of the power adapter and network cable connectors;
- proper connection of Ethernet cables and the statuses of indicators for RJ45 connectors (PN/IE LAN X1 P1 and PN/IE LAN X2 P1);
- absence of thermal or mechanical damage to the chassis, circuit board and electronic components.
- Searching for errors in the diagnostics log
Connect to the gateway via USB-UART adapter and use PuTTY to obtain a diagnostics log. In the obtained diagnostics log, check the following:
- absence of errors at the hardware level;
- startup of the kernel and successful initialization of components;
- startup of the OPC UA Client, MQTT Publisher and Navigation services;
- connection to the OPC UA server based on the
OPC UA Client has established connectionmessage; - connection to the MQTT broker based on the
MQTT Publisher established connectionmessage; - receipt of messages over the OPC UA protocol and their transmission over the MQTT protocol.
If you encounter errors establishing a secure connection, you should first verify that the date and time are set correctly. If the date and time are correctly set on the gateway but a certificate validation error occurs, you should check the format and validity dates of the certificates and make sure that the important fields have been completed correctly.
To search for errors, you can also use the health log files stored on the microSD memory card.
- Contacting Technical Support
If you are not able to restore the correct operation of the gateway on your own, please contact Technical Support by emailing your query to support@aprotech.ru.
- detailed description of the issue;
- settings of network interfaces (
dhcpcd.conffiles); - OPC UA settings (
OpcUaClientSettings-0.jsonfile); - MQTT settings (
MqttPublisherSettings-0.jsonfile); - diagnostics log and/or health log files;
- settings of the OPC UA server and MQTT broker.
Please attach the following to your query:
Diagnostics using PuTTY
This section provides instructions on using the PuTTY application to obtain diagnostic information about gateway operation. PuTTY is a freely distributed client for remote access protocols, including SSH, Telnet and rlogin. PuTTY can also connect to devices via serial port.
For additional information on configuring and using PuTTY, please refer to the documentation on the PuTTY application.
Connecting a computer to the gateway via USB-UART adapter
To use PuTTY for diagnostics of Kaspersky IoT Secure Gateway 100,
Use the USB-UART adapter available in the distribution kit to connect a computer to the UART diagnostic connector located under the right-side cover of the device (see the figure below).
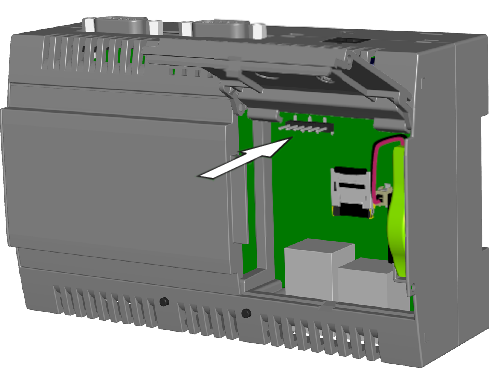
Location of the UART diagnostic connector
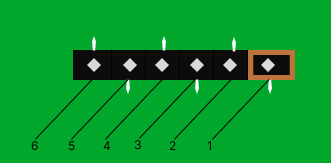
UART diagnostic connector contacts
When connecting the USB-UART adapter to the UART diagnostic connector, make sure you match the proper contacts of the diagnostic connector (see the table below).
Purpose of UART diagnostic connector contacts
Number of the contact |
Purpose of the contact |
USB-UART adapter wire |
|---|---|---|
1 |
GND |
Ground (black) |
2 |
RTS_N |
– |
3 |
n. c. |
– |
4 |
TXD |
Send data (green) |
5 |
RXD |
Receive data (white) |
6 |
CTS_N |
– |
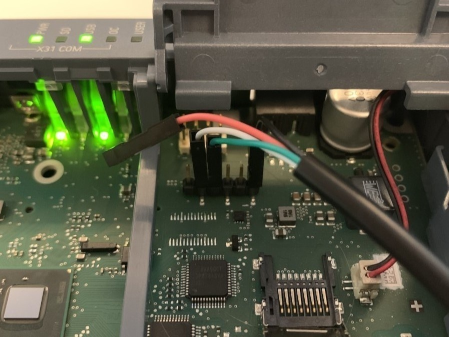
Example of connecting a USB-UART cable to a UART diagnostic connector
If the colors of the adapter wires differ from those presented in the table and in the figure, refer to the text label on the connectors or circuit board of the USB-UART adapter.
Page topConfiguring a connection to the gateway in PuTTY
To configure a connection in PuTTY:
- Run the PuTTY application.
The PuTTY Configuration dialog box is displayed at startup. The Session option is selected by default in the Category panel of the dialog box.
- In the Specify the destination you want to connect to → Connection type settings block, select the Serial option.
- In the Serial line field, specify the name of the serial port corresponding to the connected USB-UART adapter (for example,
/dev/ttyUSB0in Linux orCOM8in Windows).In Linux, you can identify the port name by running the
ls /dev/ttyUSB*command. If this command returns multiple names, you can run it again with the USB-UART adapter connected and then disconnected. The name that appears when the adapter is connected will be the one you're looking for.In Windows, you can identify the port name by running Device Manager. In the console tree, open the Ports (COM and LPT) folder and find the object corresponding to the connected USB-UART adapter. The object name will contain the name of the port in parentheses. For example, Prolific USB-to-Serial Comm Port (COM8).
- In the Speed field, set the data transfer speed value at
115200baud/sec. - In the Category panel, select Session → Logging.
- In the Session logging settings group, select the All session output option.
- In the Log file name field, specify the path to the event log file.
You can specify the file name in the following format:
KISG100LOG_&Y_&M_&D_&T.log. In this case, a new log file will be created for each new PuTTY connection session, and the date and time of the session start will be automatically added to the file name. - In the Category panel, select Session.
- In the Load, save or delete a stored session settings block, in the Saved Sessions field, specify the name of the connection with the gateway (for example:
KISG100). - Click Save.
Obtaining diagnostic information in PuTTY
To obtain a log file containing diagnostic information:
- Connect a computer to the gateway via USB-UART adapter.
- Run the PuTTY application.
- In the Load, save or delete a stored session settings block, select a previously saved connection with the gateway (for example:
KISG100). - Click Load.
As a result, the previously saved values for the gateway connection settings will be loaded.
- Click Open.
PuTTY will open a terminal window that displays the diagnostic information received from the gateway. The displayed information is also written to the event log file that was specified in the Log file name field when configuring the connection with the gateway.
The table below lists possible problems with PuTTY when receiving diagnostic information in Linux, and the ways to resolve these problems.
Potential problems with PuTTY when working in Linux
Error message |
Solution |
|---|---|
|
Make sure that you specified the correct port name when configuring the connection with the gateway. If the port name was indicated correctly but the error persists, run PuTTY under the superuser at step 2:
|
|
After completing step 4, in the Category panel, select Window → Fonts. In the Font used for ordinary text field, replace |
Verifying information from the diagnostics log
This section provides instructions on performing diagnostics for Kaspersky IoT Secure Gateway 100 based on information from the diagnostics log file. To obtain the diagnostics log file, connect the gateway to a computer via the USB-UART adapter and use the PuTTY application.
Diagnostics of KasperskyOS startup
Open the diagnostics log file. Successful startup of KasperskyOS is indicated by the following messages:
Info: [BLKDEVSR] Port 'mmc0' successfully registered.
Info: [BLKDEVSR] Port 'mmc0_p0' successfully registered.
Info: [BLKDEVSR] Port 'mmc0_p0ro' successfully registered.
Info: [BLKDEVSR] Port 'mmc0_p1' successfully registered.
Info: [BLKDEVSR] Port 'mmc0_p1ro' successfully registered.
Info: [BLKDEVSR] Port 'mmc0_p2' successfully registered.
Info: [BLKDEVSR] Port 'mmc0_p2ro' successfully registered.
Info: [BLKDEVSR] Port 'mmc0_p3' successfully registered.
Info: [BLKDEVSR] Port 'mmc0_p3ro' successfully registered.
Info: [BLKDEVSR] Port 'mmc0_p4' successfully registered.
Info: [BLKDEVSR] Port 'mmc0_p4ro' successfully registered.
Diagnostics of OPC UA operation
The
client settings are assumed to be correct if the diagnostics log contains the following messages:Info: Starting the OPC UA Client Manager Server service
Info: The OPC UA Client Manager Server service has been started
Info: Starting the OPC UA Client Manager service
Info: Loading all OpcUaClientSettings
Info: All OpcUaClientSettings has been loaded
Info: The OPC UA Client Manager service has been started
If these messages are absent from the event log file or are different from the messages listed above, the OPC UA client is likely experiencing operational problems.
Diagnostics of MQTT client operation
The
client settings are assumed to be correct if the diagnostics log contains the following messages:Info: Starting the MQTT Publisher Manager Server service
Info: The MQTT Publisher Manager Server service has been started
Info: Starting the MQTT Publisher Manager service
Info: Starting the MQTT Publisher service
Info: The MQTT Publisher service has been started
Info: The MQTT Publisher Manager service has been started
If these messages are absent from the event log file or are different from the messages listed above, the MQTT client is likely experiencing operational problems.
Diagnostics of the navigation (routing) service for transmitted data
The routing service was successfully started if the diagnostics log contains the following messages:
Info: Starting the Navigation Service service
Info: Loading all GuideSettings
Info: All GuideSettings has been loaded
Info: The Navigation Service service has been started
If these messages are absent from the event log file or are different from the messages listed above, the OPC UA client is likely experiencing operational problems.
Page topChecking and configuring the date and time
You can check the date, time and time zone set on the hardware clock of the gateway based on the following message in the diagnostics log:
[2022-10-18 15:26:40.139 (UTC+0000)]
If the date on the gateway hardware clock is incorrect or exceeds the validity date of
, certificate verification will result in an error and the gateway will not be able to establish a secure connection.If the date and time do not match the current exact time according to UTC, it is recommended to configure the date and time and set the time zone. Prior to changing the date, time or time zone, you should extract the microSD card from the device.
The time is configured in the terminal window of the PuTTY application.
To configure the time,
Run the command time hh:mm:ss, where hh refers to hours, mm refers to minutes, and ss refers to seconds.
To configure the time zone,
Run the command timezone -s hh:mm, where hh:mm refers to the UTC offset in hours and minutes.
To display the current time,
Run the command time.
To configure the date,
Run the command date mm/dd/yyyy, where mm refers to the month, dd refers to the day, yyyy refers to the year.
To display the current date,
Run the command date.
Health log
Kaspersky IoT Secure Gateway 100 lets you configure the settings of the system health log. System health logs are saved in the directory /logs located on the TGW-HW-LOG partition of the microSD card.
To configure the health log settings:
- Use a text editor to open the
/logs/.logfile located on theTGW-HW-LOGpartition of the microSD card.The
.logfile is hidden because the file name begins with a dot. If the file is not displayed in the file manager, enable the display of hidden files. - In the
LogFileSizeLimitparameter value, enter the maximum size (in bytes) of one system health log file. For example,LogFileSizeLimit=100000000. - In the
DirectorySizeLimitparameter value, enter the maximum size (in bytes) of the directory containing all system health log files. For example,DirectorySizeLimit=1500000000.Kaspersky IoT Secure Gateway 100 does not process disk space overflow events. For this reason, make sure that the size of the log storage directory does not exceed the available disk space of the partition.
- Save the changes in the
.logfile.
Sample configuration file:
.log
LogFileSizeLimit=100000000
DirectorySizeLimit=1500000000
If the .log file is absent, the log will not be written.
Log files writing and rotating rules
Log files are written and rotated according to the following rules:
- If the size limit of one log file is exceeded during data write operations, a new file is created and the data is written to the new file.
- If a data string could not be completely written due to the size limit of one log file, a new file is created, the data string is written to this new file, and subsequent data will be written to the new file.
- If the size limits of one log file and all log files are exceeded when writing a data string, the old log file is deleted, a new file is created, and subsequent data will be written to this new file.
- If the limit for all log files is exceeded when writing a data string, the old file is deleted and the data string is written to the current file.
- Old log files are deleted in such a way to ensure that there is sufficient memory for writing a data string.
- A new file for log writing is created each time the gateway is loaded or restarted.
Information written to log files
The following information is recorded to log files:
- Initialization status of hardware components
- KasperskyOS loading status
- Initialization status of system components
- Initialization and operating status of:
- Transmitted data elements
- Initialization and loading errors