Contents
- Kaspersky Unified Monitoring and Analysis Platform Help
- About Kaspersky Unified Monitoring and Analysis Platform
- Program architecture
- Program licensing
- About the End User License Agreement
- About the license
- About the License Certificate
- About the license key
- About the key file
- About the license code
- Data provision in Kaspersky Unified Monitoring and Analysis Platform
- Adding a license key to the program web interface
- Viewing information about an added license key in the program web interface
- Removing a license key in the program web interface
- Administrator's guide
- Installing and removing KUMA
- Program installation requirements
- Ports used by KUMA during installation
- Downloading CA certificates
- Reissuing internal CA certificates
- Modifying the self-signed web console certificate
- Synchronizing time on servers
- About the inventory file
- Installation on a single server
- Distributed installation
- Distributed installation in a high availability configuration
- KUMA backup
- Modifying the configuration of KUMA
- Updating previous versions of KUMA
- Troubleshooting update errors
- Delete KUMA
- Working with tenants
- Managing users
- KUMA services
- Services tools
- Service resource sets
- Creating a storage
- Creating a correlator
- Creating an event router
- Creating a collector
- Predefined collectors
- Creating an agent
- Creating a set of resources for an agent
- Managing connections for an agent
- Creating an agent service in the KUMA web interface
- Installing an agent in a KUMA network infrastructure
- Automatically created agents
- Update agents
- Transferring events from isolated network segments to KUMA
- Transferring events from Windows machines to KUMA
- AI services
- Configuring event sources
- Configuring receipt of Auditd events
- Configuring receipt of KATA/EDR events
- Configuring the export of Kaspersky Security Center events to the KUMA SIEM system
- Configuring receiving Kaspersky Security Center event from MS SQL
- Creating an account in the MS SQL database
- Configuring the SQL Server Browser service
- Creating a secret in KUMA
- Configuring a connector
- Configuring the KUMA Collector for receiving Kaspersky Security Center events from an MS SQL database
- Installing the KUMA Collector for receiving Kaspersky Security Center events from the MS SQL database
- Configuring receipt of events from Windows devices using KUMA Agent (WEC)
- Configuring audit of events from Windows devices
- Configuring centralized receipt of events from Windows devices using the Windows Event Collector service
- Granting permissions to view Windows events
- Granting permissions to log on as a service
- Configuring the KUMA Collector for receiving events from Windows devices
- Installing the KUMA Collector for receiving events from Windows devices
- Configuring forwarding of events from Windows devices to KUMA using KUMA Agent (WEC)
- Configuring receipt of events from Windows devices using KUMA Agent (WMI)
- Configuring receipt of DNS server events using the ETW agent
- Configuring receipt of PostgreSQL events
- Configuring receipt of IVK Kolchuga-K events
- Configuring receipt of CryptoPro NGate events
- Configuring receipt of Ideco UTM events
- Configuring receipt of KWTS events
- Configuring receipt of KLMS events
- Configuring receipt of KSMG events
- Configuring the receipt of KICS for Networks events
- Configuring receipt of PT NAD events
- Configuring receipt of events using the MariaDB Audit Plugin
- Configuring receipt of Apache Cassandra events
- Configuring receipt of FreeIPA events
- Configuring receipt of VipNet TIAS events
- Configuring receipt of Nextcloud events
- Configuring receipt of Snort events
- Configuring receipt of Suricata events
- Configuring receipt of FreeRADIUS events
- Configuring receipt of VMware vCenter events
- Configuring receipt of zVirt events
- Configuring receipt of Zeek IDS events
- Configuring Windows event reception using Kaspersky Endpoint Security for Windows
- Configuring receipt of Codemaster Mirada events
- Configuring receipt of Postfix events
- Configuring receipt of CommuniGate Pro events
- Configuring receipt of Yandex Cloud events
- Configuring receipt of Microsoft 365 events
- Configuring receipt of the Kontinent encryption system events
- Configuring receipt of VK WorkSpace Mail events
- Monitoring event sources
- Managing assets
- Adding an asset category
- Configuring the table of assets
- Searching assets
- Exporting asset data
- Viewing asset details
- Adding assets
- Assigning a category to an asset
- Editing the parameters of assets
- Archiving assets
- Deleting assets
- Bulk deletion of assets
- Updating third-party applications and fixing vulnerabilities on Kaspersky Security Center assets
- Moving assets to a selected administration group
- Asset audit
- Custom asset fields
- Critical information infrastructure assets
- Integration with other solutions
- Integration with Kaspersky Security Center
- Configuring Kaspersky Security Center integration settings
- Adding a tenant to the list for Kaspersky Security Center integration
- Creating Kaspersky Security Center connection
- Editing Kaspersky Security Center connection
- Deleting Kaspersky Security Center connection
- Importing events from the Kaspersky Security Center database
- Kaspersky Endpoint Detection and Response integration
- Integration with Kaspersky CyberTrace
- Integration with Kaspersky Threat Intelligence Portal
- Integration with R-Vision Security Orchestration, Automation and Response
- Integration with Active Directory, Active Directory Federation Services and FreeIPA
- Connecting over LDAP
- Enabling and disabling LDAP integration
- Adding a tenant to the LDAP server integration list
- Creating an LDAP server connection
- Creating a copy of an LDAP server connection
- Changing an LDAP server connection
- Changing the data update frequency
- Changing the data storage period
- Starting account data update tasks
- Deleting an LDAP server connection
- Authentication using domain accounts
- Connecting over LDAP
- NCIRCC integration
- Integration with the Security Orchestration Automation and Response Platform (SOAR)
- Integration with KICS/KATA
- Integration with NeuroDAT SIEM IM
- Kaspersky Automated Security Awareness Platform
- Sending notifications to Telegram
- UserGate integration
- Integration with Kaspersky Web Traffic Security
- Integration with Kaspersky Secure Mail Gateway
- Importing asset information from RedCheck
- Configuring receipt of Sendmail events
- Integration with Kaspersky Security Center
- Managing KUMA
- Working with geographic data
- Installing and removing KUMA
- User guide
- KUMA resources
- Operations with resources
- Creating, renaming, moving, and deleting resource folders
- Creating, duplicating, moving, editing, and deleting resources
- Bulk deletion of resources
- Link correlators to a correlation rule
- Updating resources
- Exporting resources
- Importing resources
- Resource search
- Tag management
- Resource usage tracing
- Resource versioning
- Destinations
- Normalizers
- Aggregation rules
- Enrichment rules
- Data collection and analysis rules
- Correlation rules
- Filters
- Active lists
- Viewing the table of active lists
- Adding active list
- Viewing the settings of an active list
- Changing the settings of an active list
- Duplicating the settings of an active list
- Deleting an active list
- Viewing records in the active list
- Searching for records in the active list
- Adding a record to an active list
- Duplicating records in the active list
- Changing a record in the active list
- Deleting records from the active list
- Import data to an active list
- Exporting data from the active list
- Predefined active lists
- Proxies
- Dictionaries
- Response rules
- Notification templates
- Connectors
- Viewing connector settings
- Adding a connector
- Connector settings
- Connector, internal type
- Connector, tcp type
- Connector, udp type
- Connector, netflow type
- Connector, sflow type
- Connector, nats-jetstream type
- Connector, kafka type
- Connector, http type
- Connector, sql type
- Connector, file type
- Connector, 1c-log type
- Connector, 1c-xml type
- Connector, diode type
- Connector, ftp type
- Connector, nfs type
- Connector, wmi type
- Connector, wec type
- Connector, etw type
- Connector, snmp type
- Connector, snmp-trap type
- Connector, kata/edr type
- Connector, vmware type
- Connector, elastic type
- Connector, office365 type
- Predefined connectors
- Secrets
- Segmentation rules
- Context tables
- Viewing the list of context tables
- Adding a context table
- Viewing context table settings
- Editing context table settings
- Duplicating context table settings
- Deleting a context table
- Viewing context table records
- Searching context table records
- Adding a context table record
- Editing a context table record
- Deleting a context table record
- Importing data into a context table
- Exporting data from a context table
- Operations with resources
- Example of incident investigation with KUMA
- Incident conditions
- Step 1. Preliminary steps
- Step 2. Assigning an alert to a user
- Step 3. Check if the triggered correlation rule matches the data of the alert events
- Step 4. Analyzing alert information
- Step 5. False positive check
- Step 6. Determining alert severity
- Step 7. Incident creation
- Step 8. Investigation
- Step 9. Searching for related assets
- Step 10. Searching for related events
- Step 11. Recording the causes of the incident
- Step 12. Incident response
- Step 13. Restoring assets operability
- Step 14. Closing the incident
- Analytics
- Working with events
- Filtering and searching events
- Selecting Storage
- Generating an SQL query using a builder
- Manually creating an SQL query
- Saving query history
- Managing saved search queries
- Filtering events by period
- Grouping events
- Displaying names instead of IDs
- Presets
- Limiting the complexity of queries in alert investigation mode
- Saving and selecting events filter configuration
- Deleting event filter configurations
- Supported ClickHouse functions
- Viewing event detail areas
- Exporting events
- Configuring the table of events
- Refreshing events table
- Getting events table statistics
- Viewing correlation event details
- Generating an SQL query using KUMA SQL functions
- Event route tracing
- Categorization of events
- Granular access to events
- Filtering and searching events
- Dashboard
- Reports
- Widgets
- Working with alerts
- Working with incidents
- About the incidents table
- Saving and selecting incident filter configuration
- Deleting incident filter configurations
- Viewing information about an incident
- Incident creation
- Incident processing
- Changing incidents
- Automatic linking of alerts to incidents
- Categories and types of incidents
- Interaction with NCIRCC
- Retroscan
- Working with events
- KUMA resources
- Contacting Technical Support
- REST API
- Creating a token
- Configuring permissions to access the API
- Authorizing API requests
- Standard error
- REST API v1 operations
- Viewing a list of active lists on the correlator
- Import entries to an active list
- Searching alerts
- Closing alerts
- Searching assets
- Importing assets
- Deleting assets
- Searching events
- Viewing information about the cluster
- Resource search
- Loading resource file
- Viewing the contents of a resource file
- Importing resources
- Exporting resources
- Downloading the resource file
- Search for services
- Tenant search
- View token bearer information
- Dictionary updating in services
- Dictionary retrieval
- Viewing custom fields of the assets
- Creating a backup of the KUMA Core
- Restoring the KUMA Core from the backup
- Viewing the list of context tables in the correlator
- Importing records into a context table
- Exporting records from a context table
- REST API v2 operations
- Viewing a list of active lists on the correlator
- Import entries to an active list
- Searching alerts
- Closing alerts
- Searching assets
- Importing assets
- Deleting assets
- Searching events
- Viewing information about the cluster
- Resource search
- Loading resource file
- Viewing the contents of a resource file
- Importing resources
- Exporting resources
- Downloading the resource file
- Search for services
- Tenant search
- View token bearer information
- Dictionary updating in services
- Dictionary retrieval
- Viewing custom fields of the assets
- Creating a backup of the KUMA Core
- Restoring the KUMA Core from the backup
- Viewing the list of context tables in the correlator
- Importing records into a context table
- Exporting records from a context table
- REST API v2.1 operations
- REST API v3 operations
- Appendices
- Commands for components manual starting and installing
- Integrity check of KUMA files
- Normalized event data model
- Configuring the data model of a normalized event from KATA EDR
- Alert data model
- Asset data model
- User account data model
- KUMA audit events
- Event fields with general information
- User was successfully signed in or failed to sign in
- User login successfully changed
- User role was successfully changed
- Other data of the user was successfully changed
- User successfully logged out
- User password was successfully changed
- User was successfully created
- User role was successfully assigned
- User role was successfully revoked
- The user has successfully edited the set of fields settings to define sources
- User access token was successfully changed
- Changed the set of spaces to differentiate access to events
- Service was successfully created
- Service was successfully deleted
- Service was successfully reloaded
- Service was successfully restarted
- Service was successfully started
- Service was successfully paired
- Service status was changed
- Storage partition was deleted by user
- Storage partition was deleted automatically due to expiration
- Storage partition was deleted automatically or moved due to exceeding the storage capacity.
- Active list was successfully cleared or operation failed
- Active list item was successfully changed, or operation was unsuccessful
- Active list item was successfully deleted or operation was unsuccessful
- Active list was successfully imported or operation failed
- Active list was exported successfully
- Resource was successfully added
- Resource was successfully deleted
- Resource was successfully updated
- Asset was successfully created
- Asset was successfully deleted
- Asset category was successfully added
- Asset category was deleted successfully
- Settings were updated successfully
- Tenant was successfully created
- Tenant was successfully enabled
- Tenant was successfully disabled
- Other tenant data was successfully changed
- Updated data retention policy after changing drives
- The dictionary was successfully updated on the service or operation was unsuccessful
- Response in Active Directory
- Query sent to KIRA
- KICS/KATA response
- Kaspersky Automated Security Awareness Platform response
- KEDR response
- Correlation rules
- Sending test events to KUMA
- Time format
- Mapping fields of predefined normalizers
- Deprecated resources
- Generating events for testing a normalizer
- Information about third-party code
- Trademark notices
- Glossary
Kaspersky Unified Monitoring and Analysis Platform Help
 New features
 Hardware and software requirements
 Getting started
 Managing the KUMA web interface
 Additional features
 Licensing
 Contacting Technical Support
Page top
About Kaspersky Unified Monitoring and Analysis Platform
Kaspersky Unified Monitoring and Analysis Platform (hereinafter KUMA or "application") is an integrated software solution that combines the following functionality:
- Receiving, processing, and storing information security events
- Analyzing and correlating incoming data
- Searching in received events
- Creating notifications about detected indicators of information security threats
The application is built on a microservice architecture. This means that you can create and configure only those microservices (hereinafter also "services") that you need, which lets you use KUMA as a log management system or as a full-fledged SIEM system. In addition, flexible routing of data feeds lets you use third-party services for additional event processing.
The update functionality (including anti-virus signature updates and code base updates) may not be available in the application in the territory of the USA.
What's new
Kaspersky Unified Monitoring and Analysis Platform introduces the following features and improvements:
- Corrections and improvements in KUMA 3.4.2:
- The issue of SQLite database maintenance taking too long has been resolved.
- Storage of resource version history is now optimized, which avoids increasing the size of the database.
- What's new in KUMA 3.4.2:
- Enrichment of events with assets has been moved to the end of the enrichment chain.
- In the metrics of the KUMA Core, there is a new Alerts queue metric, the number of alerts in the queue for insertion into the database.
- In the storage, buffer size calculation is now automated. Metrics of the storage now include a new metric: Insert interval 5min Q1, first quartile of ClickHouse insertion intervals over a 5-minute period.
- If NCIRCC integration is configured, you can exchange files in incidents received from the regulator.
- KUMA now supports the following additional operating systems:
- Astra Linux 1.7.6
- In KUMA 3.4.1, enrichment rules of the DNS type have the Recursion desired parameter. You can use the Recursion desired toggle switch to make a KUMA collector send recursive queries to authoritative DNS servers for the purposes of enrichment. The default value is Disabled.
- KUMA 3.4.1 can receive and process incidents from NCIRCC. After upgrading to version 3.4.1, at each startup, KUMA Core sends a request to get new incident cards to the address specified in the URL field in KUMA's NCIRCC integration settings, and then continues sending requests every 10 minutes. If a new incident appears in the NCIRCC user account dashboard, KUMA registers the incident with the ALRT* prefix and further interaction with NCIRCC is carried out in context of the created incident.
Interaction with NCIRCC is available even if the incident in KUMA has the Closed status: you can edit the value of the NCIRCC status field and chat with NCIRCC.
- KUMA 3.4.1 introduces new predefined dashboard layouts.
- Starting with KUMA 3.4.1 and Kaspersky Endpoint Security 12.9, EDR actions are supported when responding to threats.
- Now you can visualize the dependencies of resources on each other and on other objects on an interactive graph. Now, when editing resources, you can find out to which linked resources the change will be applied. You can display certain types of resources on the graph and save the resulting graph in SVG format.
- Now you can add tags to resources, which makes it easier to search for resources that have the same tag.
- The Access to shared resources role is retired and the following new user roles replace it:
- Read shared resources
- Manage shared resources The General administrator and users with the Manage shared resources can now edit resources in the Shared tenant.
- Resource versioning (except dictionaries and tables) allows storing change history for resources.
When you save changes in resource settings, a new version of the resource is created. You can restore a previous version of a resource, for example, to recover its functionality; you can also compare resource versions to keep track of the changes.
After upgrading KUMA to version 3.4, existing resources will acquire versions only after these resources are changed and the changes are saved.
- Now you can find resources by their content using full-text search. You can find resources in which at least one field contains a specific word; this can be useful, for example, if you need to find rules with a certain word in a condition.
- The new type of KUMA resource, Data collection and analysis rules, allows you to schedule SQL queries to the storage and perform correlation based on the received data.
- Now you can pass the values of unique fields to the fields of correlation events when creating correlation rules of the standard type.
- New SQL function sets, enrich and lookup, allow using the attributes of assets and accounts, as well as data from dictionaries and tables, in search queries to filter events, generate reports and widgets (graph type: table). You can use the enrich and lookup function sets in an SQL query in data collection and analysis rules.
- Now you can save search history. You can refer to the history of search queries and quickly find a query that you have used before.
- Now you can organize saved queries in a folder tree for structured storage and quick search of queries. Now you can edit previously saved queries, rename them, hierarchically arrange queries in groups (folders), and find previously saved queries using the search bar. You can also edit queries and create links to frequently used queries by adding them to favorites.
- Now you can create a temporary list of exclusions (for example, you can create exclusions for false positives when managing alerts or incidents). You can create a list of exclusions for each correlation rule.
- When creating a collector, at the Event parsing step, you now can pass the name or path of the file being processed by the collector to the KUMA event field.
- The following settings have been added to the connector of the file type:
- The Update timeout, sec field. If a file is not updated for this time, KUMA applies the action specified in the Timeout action drop-down list to the file: delete, add suffix, leave unchanged.
- The Timeout action drop-down list. In this drop-down list, you can specify the action that KUMA applies to the file after the time specified in the Update timeout, sec field expires.
- Connectors of the file, 1с-xml, and 1c-log types get the following new settings:
- The File/folder polling mode drop-down list. This drop-down list lets you specify the mode in which the connector rereads files in the directory.
- Poll interval, ms. This field lets you specify the interval in milliseconds at which the connector rereads files in the directory.
- The event cold storage period is determined in a new way: now you can specify event storage conditions in the ClickHouse cluster as an amount of disk space (absolute in GB or a percentage) when creating the storage or space. The new Event retention time setting lets you configure the total retention time of events in KUMA, counting from the time when the event is received. This setting replaces the Cold retention period.
When upgrading KUMA to version 3.4, if you have previously configured cold storage disks, the Event retention time setting is calculated as the sum of the old Retention period and Cold retention period settings.
- Now you can make the storage more stable by flexibly configuring event storage conditions in the ClickHouse cluster using the Event storage options setting: by storage period, storage size in GB, or the ratio of the storage size to the total disk space available to it. When a specified condition is triggered, events are moved to a cold storage disk or deleted.
You can configure storage conditions for the whole storage or for each storage space individually. The Event storage options setting replaces the Retention period setting.
- Users with different rights can have granular access to events. Access to events is controlled at the level of storage spaces. After upgrading KUMA to version 3.4, the 'All spaces' space set is assigned to all existing users, that is, access to all spaces is unrestricted. To differentiate access, you must configure space sets, and adjust access permissions. Also, after the update, all available storage spaces become selected in all widgets where storages had been selected. If a new space is created, this space is not automatically selected in widget settings. You must select the new space manually in the widget settings.
- Now you can manage extended event schema fields in the Settings → Extended event schema fields section. You can view existing extended event schema fields and the resources in which they are used, edit fields, create new fields manually or import them from a file, and export fields and information about fields.
When upgrading KUMA to version 3.4, the previously created extended event schema fields are automatically migrated and displayed in the Settings → Extended event schema fields section, with the following special considerations:
- If you had multiple fields of the same type with the same name, only one such field is migrated to KUMA 3.4.
- All fields with the
KLprefix in the name are migrated to KUMA 3.4 with the Enabled status. If any of these fields become service fields, you will not be able to delete, edit, disable, or export them. - Extended event schema fields that do not satisfy the requirements that version 3.4 imposes on fields, are migrated to KUMA 3.4 with the Disabled status.
After the upgrade, we recommend checking such fields and manually fixing any problems or changing the configurations of resources that use such fields.
- Now you can filter and display data for a relative time range.
This functionality is available for filtering events by period and for customizing the display of data in reports, the dashboard layout, and in widgets. You can use this functionality to display events or other data for which the selected filtering option has been updated within a time span relative to the current time.
For data filtering, the time is specified as UTC time, and then converted in the KUMA interface to the local time zone set in the browser.
- Added support for autocomplete when typing functions of variables in correlators and correlation rules.
Now, when describing a local or global variable, when you start typing the name of a function, a list of possible options is displayed in the input field, and to the left of it, a window is displayed with the description of the function and usage examples. You can select a function from the list and insert it together with arguments into the input field.
- Now you can apply multiple monitoring policies to multiple event sources or disable monitoring policies for multiple sources at the same time.
- Monitoring policies get a new Schedule setting that allows you to configure how often you want to apply monitoring policies to event sources.
- Now you can manage connections created for an agent, which improves ease of use. You can rename connections (which lets you know from which connection and from which agent the event arrived) duplicate connections to create new connections based on existing ones, and delete connections. The functionality that allows using one agent to read multiple files has also been restored.
- KUMA agents now have the ability to trace event route if at least one internal destination is specified in the agent connection and if a connector of the internal type is configured in the collector that receives events from the agent. After configuring the agent, information about the event route is added to the event card, the alert card, and the correlation event card in the Event tracing log section. For events with route tracing, the Event tracing log section displays information about the services through which the event passes; the information is displayed in converted form. Service names are displayed as clickable links. Clicking a link with the service name opens the service card in a new browser tab. If you rename the service, the new name of the service is displayed in the cards of new events and in the cards of already processed events. If you delete a service in the Active services section, the Event tracing log section displays Deleted instead of the link. The rest of the event route data is not deleted and continues to be displayed.
- The Sigma rule converter converts rules to a filter selector, an SQL query for event search, or a KUMA correlation rule of the 'simple' type. Available under the LGPL 2.1 license.
- Now you can install the AI score and asset status service if your license covers the AI module.
The AI service helps with precisely assessing the severity of correlation events generated by triggered correlation rules. The AI service gets correlation events that connect linked assets from the available storage clusters, constructs the expected sequence of events, and trains the AI model. Based on the chain of triggered correlation rules, the AI service calculates whether such a sequence of events is typical for this infrastructure. Non-typical patterns increase the score of the asset. The AI service calculates the AI score and the Status, which are displayed in the asset card. You can apply a filter by the Score AI and Status fields when searching for assets. You can also set up proactive categorization of assets by the Score AI and Status fields, which moves the asset to the category corresponding to the risk level as soon as the AI service assigns a score to the asset. You can also track asset category changes and the distribution of assets by status on the dashboard.
- In the RU region, if you have the AI license module, you can use the Kaspersky Investigation & Response Assistant (KIRA) to analyze the command that triggered the correlation rule. This analysis helps with the investigation of alerts and incidents by offering an easy to understand description of the command line options.
You can send a query to KIRA from the card of the event or correlation event. If the command is obfuscated, KIRA deobfuscates it and displays the result: the conclusion, summary, and detailed analysis. Query results are stored in the cache for 14 days and are can be viewed in the event card on the KIRA analysis tab by all users with access rights. You can also view the result in the properties of the Query in KIRA task, or restart the task and perform the analysis from scratch.
- Now you can categorize assets by a relative time range.
You can set up active categorization of assets to have assets moved to a category from the moment whenever a categorization condition has been satisfied for a certain period of time defined relative to the current time.
For categorization, the time is specified as UTC time, and then converted in the KUMA interface to the local time zone set in the browser.
- New types of custom notification templates.
In previous versions, notification templates were available only for alert notifications. Now you can also create the following types of notification templates:
- Report generated.
- Task finished (only one template of this type can exist).
- Sources monitoring alert.
- KASAP group changed.
All types of templates are available when creating a template for the Shared tenant. For all other tenants, the following notification template types are available: Alert created and Sources monitoring alert.
- A new graph type: Stacked Bar chart.
You can use the new graph type when creating Events and Assets widgets to visualize the relative quantities or percentages for selected parameters. Values of individual parameters values are displayed in each bar in a different color.
- Now you can select multiple assets using a filter and delete all selected assets. You can also select all assets in a category, link them to a category, or unlink assets from a category.
- Now you can select multiple resources and delete them. You can delete all resources or specific types of resources.
- New predefined widgets are available in the Assets group, as well as a new type, Custom widget, which lets you get custom analytics for assets.
- Improved export of widgets to PDF. Now, if the data displayed in a widget continues beyond the visible area, when such a widget is exported to PDF, it is split into multiple widgets, and vertical bar charts are converted to horizontal bar charts.
- New unified normalizer for different versions of NetFlow (NetFlow v5, NetFlow v9, IPFIX/NetFlow v10) lets you replace several normalizers with just one. The NetFlow v5, NetFlow v9, and IPFIX (NetFlow v10) normalizers remain available.
In addition, the last NetFlow template is now saved to disk for each event source, which allows immediately parsing the netflow from an already known event source when the collector is restarted.
- The End User License Agreement can now be accepted automatically when installing the KUMA agent on Linux devices and Windows devices using the
--accept-eulaoption. Also, for the Windows agent, you can now use the command line to set the password for the agent's user account. - In the Resources → Active services section, a new column of the table of services, UUID, displays the unique identifier of the service.
This column is hidden by default. Identifying KUMA services by UUID can facilitate troubleshooting at the operating system level.
- KUMA supports the UNION operator for connections to an Oracle database as an event source.
- To optimize asset management, the process of importing information about assets from Kaspersky Security Center has been split into two tasks:
- Importing information about the basic parameters of assets (protection status, versions of anti-virus databases, hardware information), which takes less time and is presumed to be performed more frequently.
- Importing information about other assets parameters (vulnerabilities, software, owners), which can involve downloading a large amount of data and which takes a longer time to complete.
Each of the import tasks can be started independently of the other, and you can configure a separate schedule for each task when configuring the integration with Kaspersky Security Center.
- Now you can display separate incoming events graphs for multiple event sources at the same time, as well as create an incoming events chart based on graphs for multiple event sources, which lets you compare the amount of events received from multiple event sources and how this figure changes in time.
- New filtering criteria added to the conditions for active categorization and search of assets: Software version, KSC group, CVSS (severity level of CVE vulnerability on the asset), CVE count (number of unique vulnerabilities with the CVE attribute on the asset), as well as filtering by custom fields of assets.
- Now you can receive resource updates through a proxy server.
- Now you can generate resource utilization reports (CPU, RAM, etc) in the form of dumps at the request of Technical Support.
- For resources, the table displays the number of resources from the tenants available to you in the table: the total number or the number with the filter or search applied, as well as the number of selected resources.
- The new connector for office365 lets you configure the reception of events from the Microsoft 365 (Office 365) solution using the API.
- Certain obsolete resources are no longer supported or provided:
- [OOTB] Linux audit and iptables syslog
- [OOTB] Linux audit.log file
- [OOTB] Checkpoint Syslog CEF by CheckPoint
- [OOTB] Eltex MES Switches
- [OOTB] PTsecurity NAD
- [OOTB][AD] Granted TGS without TGT (Golden Ticket)
- [OOTB][AD] Possible Kerberoasting attack
- [OOTB][AD][Technical] 4768. TGT Requested
- [OOTB][AD] List of requested TGT. EventID 4768
Distribution kit
The distribution kit includes the following files:
- kuma-ansible-installer-<build number>.tar.gz is used to install KUMA components without the option of deployment in a high availability configuration
- kuma-ansible-installer-ha-<build number>.tar.gz is used to install KUMA components with the option of deployment in a high availability configuration
- Files containing information about the version (release notes) in Russian and English
Hardware and software requirements
Recommended hardware
This section lists the hardware requirements for processing an incoming event stream in KUMA at various Events per Second (EPS) rates.
The table below lists the hardware and software requirements for installing the KUMA components, assuming that the ClickHouse cluster only accepts INSERT queries. Hardware requirements for SELECT queries are calculated separately for the particular database usage profile of the customer.
Recommended hardware for ClickHouse cluster storage
The configuration of the equipment must be chosen based on the system load profile. You can use the "All-in-one" configuration for an event stream of under 10,000 EPS and when using graphical panels supplied with the system.
KUMA supports Intel and AMD CPUs with SSE 4.2 and AVX instruction set support.
|
Up to 3,000 EPS |
Up to 10,000 EPS |
Up to 20,000 EPS |
Up to 50,000 EPS |
|---|---|---|---|---|
Configuration |
Installation on a single server
One device. Device characteristics: At least 16 threads or vCPUs. At least 32 GB of RAM. At least 500 GB in the /opt directory. Data storage type: SSD*. Data transfer rate: at least 100 Mbps.
|
Installation on a single server
One device. Device characteristics: At least 24 threads or vCPUs. At least 64 GB of RAM. At least 500 GB in the /opt directory. Data storage type: SSD*. Data transfer rate: at least 100 Mbps.
|
1 server for the Core + 1 server for the Collector + 1 server for the Correlator + 3 dedicated servers with the Keeper role + 2 servers for the Storage* *Recommended configuration. 2 Storage servers are used when ClickHouse is configured with 2 replicas in each shard to ensure fault tolerance and high availability of events collected in the Storage. If fault tolerance requirements do not apply to the Storage, a ClickHouse configuration with 1 replica in each shard may be used and, accordingly, 1 server may be used for the Storage. |
1 server for the Core + 2 servers for the Collector + 1 server for the Correlator + 3 dedicated servers with the Keeper role + 4 servers for the Storage* *Recommended configuration. 4 Storage servers are used when ClickHouse is configured with 2 replicas in each shard to ensure fault tolerance and high availability of events collected in the Storage. If fault tolerance requirements do not apply to the Storage, a ClickHouse configuration with 1 replica in each shard may be used and, accordingly, 2 servers may be used for the Storage. |
Requirements for the Core component |
- |
- |
One device. Device characteristics: At least 10 threads or vCPUs. At least 24 GB of RAM. At least 500 GB in the /opt directory. Data storage type: SSD. Data transfer rate: at least 100 Mbps.
|
One device. Device characteristics: At least 10 threads or vCPUs. At least 24 GB of RAM. At least 500 GB in the /opt directory. Data storage type: SSD. Data transfer rate: at least 100 Mbps.
|
Requirements for the Collector component |
- |
- |
One device. Device characteristics: At least 8 threads or vCPUs. At least 16 GB of RAM. At least 500 GB in the /opt directory. Data storage type: HDD allowed. Data transfer rate: at least 100 Mbps.
|
Two devices. Characteristics of each device: At least 8 threads or vCPUs. At least 16 GB of RAM. At least 500 GB in the /opt directory. Data storage type: HDD allowed. Data transfer rate: at least 100 Mbps.
|
Requirements for the Correlator component |
- |
- |
One device. Device characteristics: At least 8 threads or vCPUs. At least 32 GB of RAM. At least 500 GB in the /opt directory. Data storage type: HDD allowed. Data transfer rate: at least 100 Mbps.
|
One device. Device characteristics: At least 8 threads or vCPUs. At least 32 GB of RAM. At least 500 GB in the /opt directory. Data storage type: HDD allowed. Data transfer rate: at least 100 Mbps.
|
Requirements for the Keeper component |
- |
- |
Three devices. Characteristics of each device: At least 6 threads or vCPUs. At least 12 GB of RAM. At least 50 GB in the /opt directory. Data storage type: SSD. Data transfer rate: at least 100 Mbps.
|
Three devices. Characteristics of each device: At least 6 threads or vCPUs. At least 12 GB of RAM. At least 50 GB in the /opt directory. Data storage type: SSD. Data transfer rate: at least 100 Mbps.
|
Requirements for the Storage component |
- |
- |
Two devices. Characteristics of each device: At least 24 threads or vCPUs. At least 64 GB of RAM. At least 500 GB in the /opt directory. Data storage type: SSD*. The recommended transfer rate between ClickHouse nodes is at least 10 Gbps if the data stream is equal to or exceeds 20,000 EPS.
|
Four devices. Characteristics of each device: At least 24 threads or vCPUs. At least 64 GB of RAM. At least 500 GB in the /opt directory. Data storage type: SSD*. The recommended transfer rate between ClickHouse nodes is at least 10 Gbps if the data stream is equal to or exceeds 20,000 EPS.
|
Operating systems |
|
|||
TLS ciphersuites |
TLS versions 1.2 and 1.3 are supported. Integration with a server that does not support the TLS versions and ciphersuites that KUMA requires is impossible. Supported TLS 1.2 ciphersuites:
Supported TLS 1.3 ciphersuites:
|
|||
Depending on the number and complexity of database queries made by users, reports, and dashboards, a greater amount of resources may be required.
For every 50,000 assets (above the first 50,000), you must add 2 extra threads or vCPUs and 4 GB of RAM to the resources of the Core component.
For every 100 services (above the first 100) managed by the Core component, you must add 2 additional threads or vCPUs to the resources of the Core component.
ClickHouse must be deployed on solid-state drives (SSD). SSDs help improve data access speed.
* If the system usage profile does not involve running aggregation SQL queries to the Storage with a depth of over 24 hours, you can use HDD arrays (15,000-RPM SAS HDDs in RAID-10).
Hard drives can be used to store data using the HDFS technology.
Exported events are written to the drive of the Core component to the /opt/kaspersky/kuma/core/tmp/ temporary directory. The exported data is stored for 10 days and then automatically deleted. If you plan to export a large amount of events, you must allocate additional space.
Working in virtual environments
The following virtual environments are supported for installing KUMA:
- VMware 6.5 or later
- Hyper-V for Windows Server 2012 R2 or later
- QEMU-KVM 4.2 or later
- "Brest" virtualization software RDTSP.10001-02
Working in cloud environments
KUMA can work in a cloud infrastructure. The system can be installed on virtual machines following the IaaS (infrastructure-as-a-service) model.
For a cloud infrastructure, we recommend using the single-server configuration for 3000 EPS and 10,000 EPS. Virtual machines must satisfy the hardware and software requirements of a regular installation.
When choosing the disk subsystem of the server, use the "number of input/output operations (IOPS)" parameter as the reference. The recommended minimum value is 1000 IOPS.
Resource recommendations for the Collector component
Consider that for event processing efficiency, the CPU core count is more important than the clock rate. For example, eight CPU cores with a medium clock rate can process events more efficiently than four CPU cores with a high clock rate.
Consider also that the amount of RAM utilized by the collector depends on configured enrichment methods (DNS, accounts, assets, enrichment with data from Kaspersky CyberTrace) and whether aggregation is used (RAM consumption is influenced by the data aggregation window setting, the number of fields used for aggregation of data, volume of data in fields being aggregated). The utilization of computation resources by KUMA depends on the type of events being parsed and the efficiency of the normalizer.
For example, with an event stream of 1000 EPS and event enrichment disabled (event enrichment is disabled, event aggregation is disabled, 5000 accounts, 5000 assets per tenant), one collector requires the following resources:
• 1 CPU core or 1 virtual CPU
• 512 MB of RAM
• 1 GB of disk space (not counting event cache)
For example, to support 5 collectors that do not perform event enrichment, you must allocate the following resources: 5 CPU cores, 2.5 GB of RAM, and 5 GB of free disk space.
Kaspersky recommendations for storage servers
You must use high-speed protocols, such as Fibre Channel or iSCSI 10G for the connection of the data storage system to storage servers. We do not recommend using application-level protocols such as NFS or SMB to connect data storage systems.
On ClickHouse cluster servers, we recommend using the ext4 file system.
If you are using RAID arrays, we recommend using RAID 0 for high performance, or RAID 10 for high performance and high availability.
To ensure high availability and performance of the data storage subsystem, we recommend making sure that all ClickHouse nodes are deployed strictly on different disk arrays.
If you are using a virtualized infrastructure to host system components, we recommend deploying ClickHouse cluster nodes on different hypervisors. You must prevent any two virtual machines with ClickHouse from running on the same hypervisor.
For high-load KUMA installations, we recommend installing ClickHouse on physical servers.
Requirements for agent devices
You must install agents on network infrastructure devices that will send data to the KUMA collector. Device requirements are listed in the following table.
|
Windows devices |
Linux devices |
|---|---|---|
CPU |
Single-core, 1.4 GHz or higher |
Single-core, 1.4 GHz or higher |
RAM |
512 MB |
512 MB |
Free disk space |
1 GB |
1 GB |
Operating systems |
|
|
Requirements for client devices for managing the KUMA web interface
CPU: Intel Core i3 8th generation
RAM: 8 GB
Supported browsers:
- Google Chrome 110 or later
- Mozilla Firefox 115 or later
Device requirements for installing KUMA on Kubernetes
Minimum configuration of a Kubernetes cluster for deployment of a high-availability KUMA configuration:
- 1 load balancer node (not part of the cluster)
- 3 controller nodes
- 2 worker nodes
The minimum hardware requirements for devices for installing KUMA on Kubernetes are listed in the table below.
|
Balancer |
Controller |
Worker node |
|---|---|---|---|
CPU |
1 core with 2 threads or 2 vCPUs. |
1 core with 2 threads or 2 vCPUs. |
12 threads or 12 vCPUs. |
RAM |
At least 2 GB |
At least 2 GB |
At least 24 GB |
Free disk space |
At least 30 GB |
At least 30 GB |
At least 1 TB in the /opt directory.
At least 32 GB in the /var/lib directory.
|
Network bandwidth |
10 Gbps |
10 Gbps |
10 Gbps |
KUMA interface
The application is managed using the web interface.
The window of the application web interface contains the following:
- Sections in the left part of the application web interface window
- Tabs in the upper part of the application web interface window for some sections of the application
- The workspace in the lower part of the application web interface window
The workspace displays the information that you choose to view in the sections and on the tabs of the application web interface window. It also contains controls that you can use to configure the display of the information.
While managing the application web interface, you can use shortcut keys to perform the following actions:
- In all sections: close the window that opens in the right side pane—Esc.
- In the Events section:
- Switch between events in the right side pane—↑ and ↓.
- Start a search (when focused on the query field)—Ctrl/Command+Enter.
- Save a search query—Ctrl/Command+S.
Compatibility with other applications
Kaspersky Endpoint Security for Linux
If KUMA components and the Kaspersky Endpoint Security for Linux application are installed on the same server, the report.db directory may grow very large and even take up the entire drive space. In addition, Kaspersky Endpoint Security for Linux scans all KUMA files by default, including service files, which may affect performance. To avoid these problems:
- Upgrade Kaspersky Endpoint Security for Linux to version 12.0 or later.
- We do not recommend enabling the network components of Kaspersky Endpoint Security for Linux.
- Add the following directories to general exclusions and to on-demand scan exclusions:
- On the KUMA Core server:
- /opt/kaspersky/kuma/victoria-metrics/ — directory with Victoria Metrics data.
- /opt/kaspersky/kuma/mongodb — directory with MongoDB data.
- On the storage server:
- /opt/kaspersky/kuma/clickhouse/ — the ClickHouse directory.
- /opt/kaspersky/kuma/storage/<storage ID>/buffers/ — directory with storage buffers.
- On the correlator server:
- /opt/kaspersky/kuma/correlator/<correlator ID>/data/ — directories with dictionaries.
- /opt/kaspersky/kuma/correlator/<correlator ID>/lists — directories with active lists.
- /opt/kaspersky/kuma/correlator/<correlator ID>/ctxtables — directories with context tables.
- /opt/kaspersky/kuma/correlator/<correlator ID>/buffers — directory with buffers.
- On the collector server:
- /opt/kaspersky/kuma/collector/<collector ID>/buffers — directory with buffers.
- /opt/kaspersky/kuma/collector/<collector>/data/ — directory with dictionaries.
- Directories with logs for each service.
- On the KUMA Core server:
For more details on scan exclusions, please refer to the Kaspersky Endpoint Security for Linux Online Help.
Page top
Program architecture
The standard installation of the application includes the following components:
- The Core that includes a graphical user interface for monitoring and managing the settings of system components.
- Agents that are used to forward raw events from servers and workstations to KUMA destinations.
- One or more Collectors that receive messages from event sources and parse, normalize, and, if necessary, filter and/or aggregate them.
- Event routers that receive events from collectors and apply the configured filters to route the events to the configured destinations. In this way, these services balance the load on the network links.
- The Correlator that analyzes normalized events received from Collectors, performs the necessary actions with active lists, and creates alerts in accordance with the correlation rules.
- The Storage, which holds normalized events and registered alerts.
Events are transmitted between components over optionally encrypted, reliable transport protocols. You can configure load balancing to distribute load between service instances, and you can also enable automatic switchover to a backup component if the primary component becomes unavailable. If all components are unavailable, events are saved to the hard disk buffer to be sent later. The size of the buffer in the file system for temporary storage of events can be changed.
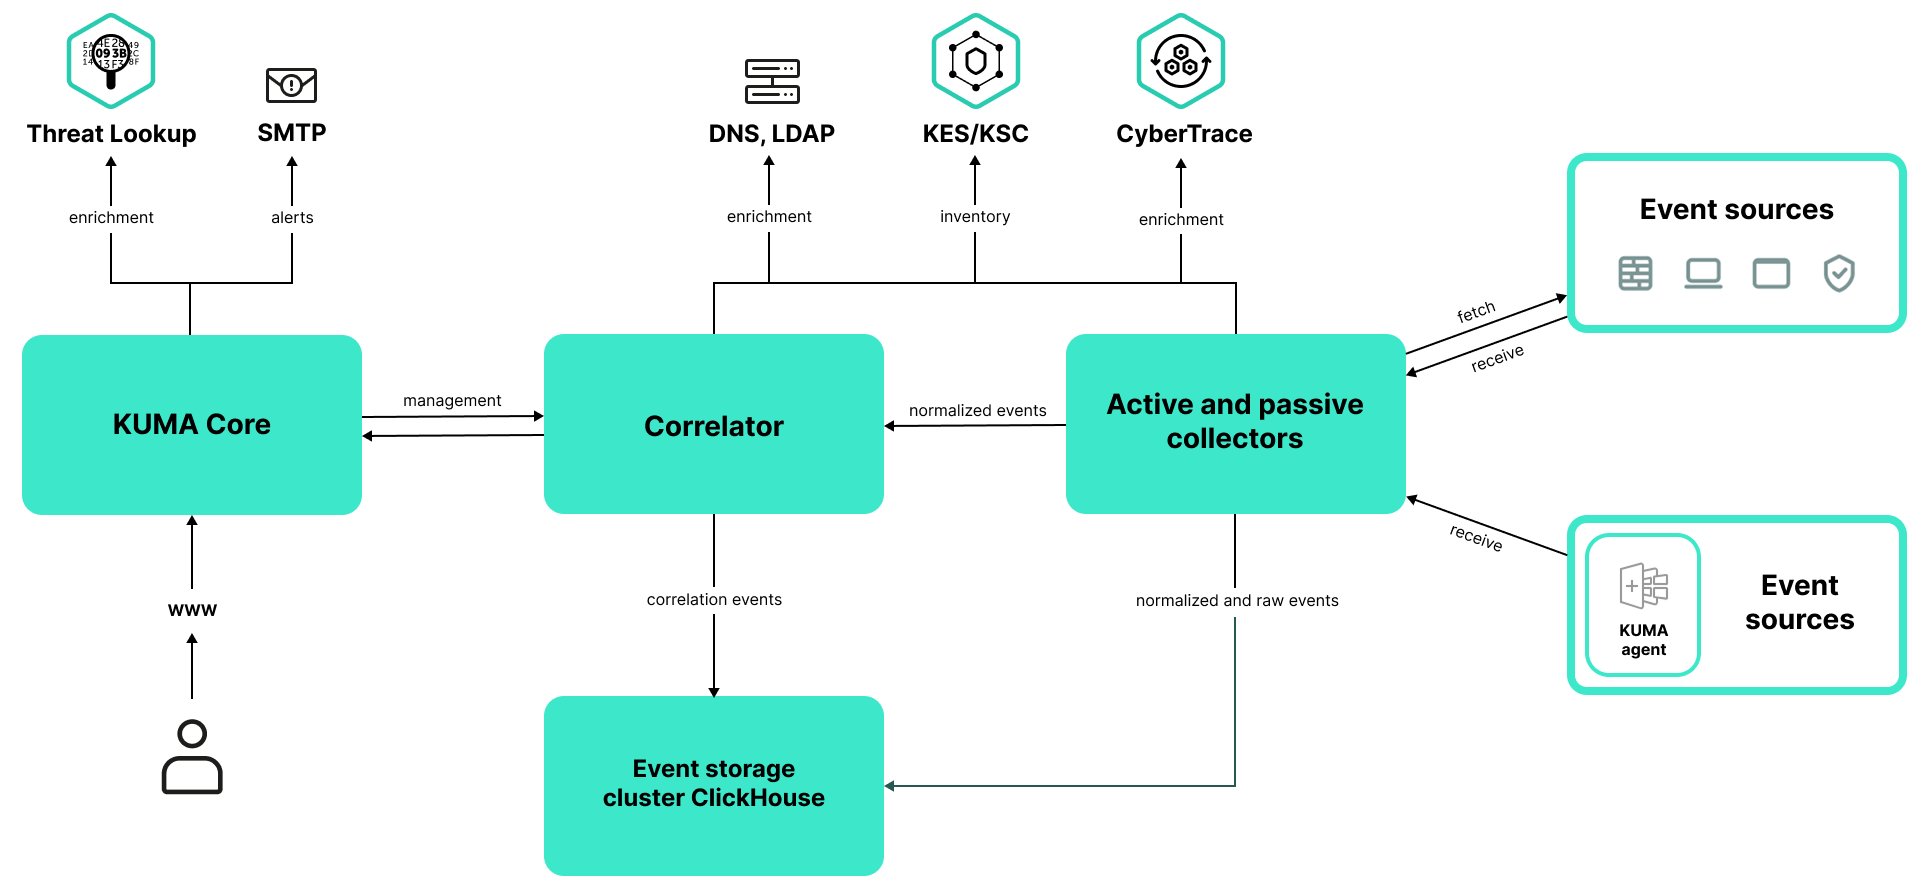
KUMA architecture
Core
The Core is the central component of KUMA that serves as the foundation upon which all other services and components are built. The Core provides a graphical user interface that is intended for everyday use as well as for configuring the system as a whole.
The Core allows you to:
- Create and configure services (or components) of the application, as well as integrate the necessary software into the system.
- Manage services and user accounts of the application in a centralized way.
- Visualize application performance statistics.
- Investigate security threats based on the received events.
Collector
A collector is an application component that receives messages from event sources, processes these messages, and sends them to a storage, correlator, and/or third-party services to identify alerts.
For each collector, one connector and one normalizer must be configured. You can also configure any number of additional normalizers, filters, enrichment rules, and aggregation rules. For the collector to send normalized events to other services, you must add destinations. Normally, two destinations are used: a storage and a correlator.
The collector iterates over the following steps:
- Receive messages from event sources
To receive messages, you must configure an active or passive connector. A passive connector only listens for messages from an event source, while an active connector actively polls an event source, such as a database management system.
Connectors can have different types. The choice of connector type depends on the transport protocol used for messaging. For example, if your event source sends messages over TCP, you must install a connector of the TCP type.
The application has the following connector types available:
- tcp
- udp
- netflow
- sflow
- nats-jetstream
- kafka
- kata/edr
- http
- sql
- file
- 1c-xml
- 1c-log
- diode
- ftp
- nfs
- vmware
- wmi
- wec
- snmp-trap
- elastic
- etw
- Parse and normalize events
Events received by the connector are processed using a normalizer and normalization rules set by the user. The choice of normalizer depends on the format of messages coming from the event source. For example, if your event source sends messages in the CEF format, you must select a normalizer of the CEF type.
The following normalizers are available in the application:
- JSON
- CEF
- Regexp
- Syslog (as per RFC3164 and RFC5424)
- CSV
- Key-value
- XML
- NetFlow (the same normalizer for NetFlow v5, NetFlow v9 and IPFIX)
- NetFlow v5
- NetFlow v9
- SQL
- IPFIX (v10)
- Filter normalized events
You can configure filters to identify events that satisfy certain conditions and only send such events for processing.
- Enrich and convert normalized events
Enrichment rules let you add supplementary information from internal and external sources to the events. The application can use the following enrichment sources:
- constants
- cybertrace
- dictionaries
- dns
- events
- ldap
- templates
- timezone data
- geographic data
Conversion rules let you convert the values of event fields in accordance with certain criteria. The application offers the following conversion methods:
- lower: convert all characters to lower case.
- upper: convert all characters to upper case.
- regexp: extract a substring using RE2 regular expressions.
- substring: extract a substring by giving its first and last characters.
- replace: replace some text with a string.
- trim: delete the specified characters.
- append: add characters to the end of the field value.
- prepend: adds characters to the beginning of the field value.
- Aggregate normalized events
You can configure aggregation rules to avoid sending many events of the same kind to the storage and/or correlator. Aggregation rules let you combine multiple events into one event. This can help reduce the load on the services responsible for further event processing, conserve storage space and the events per second (EPS) allowance of your license. For example, if you have many events for network connections between two IP addresses that use the same transport and application layer protocols, you can roll up such events for a certain period into one big event.
- Send out normalized events
Having passed through all processing steps, the event is sent to the configured destinations.
Correlator
The Correlator is an application component that analyzes normalized events. As part of the correlation process, an event can be correlated with information from active lists and/or dictionaries.
The correlation analysis produces information that can be used for the following purposes:
- Generating alerts.
- Notifying about alerts.
- Managing active list content.
- Sending correlation events to configured destinations.
Events are correlated in real time. The operating principle of the correlator is based on signature analysis of events. This means that every event is processed in accordance with the correlation rules set by the user. When the application detects a sequence of events that match the correlation rule, a correlation event is created and sent to the Storage. The correlation event can also be sent to a correlator to be analyzed again, which lets you configure correlation rules that trigger on prior analysis results. Products of one correlation rule can be used by other correlation rules.
You can distribute correlation rules and the active lists they use among correlators, thereby balancing the load on services. In this arrangement, collectors will send normalized events to all available correlators.
A correlator iterates over the following steps:
- Get an event
The correlator receives a normalized event from a collector or another service.
- Apply correlation rules
You can configure correlation rules to trigger on a single event or a sequence of events. If correlation rules do not detect an alert, the event processing ends here.
- Respond to an alert
You can configure what happens when an alert is detected. The application offers the following actions:
- Event enrichment
- Operations with active lists
- Sending notifications
- Saving a correlation event
- Send a correlation event
When a sequence of events matches a correlation rule, a correlation event is created and sent to the storage. At this point, the correlator is done processing the event.
Storage
A KUMA storage is used to store normalized events and ensure that KUMA can quickly and reliably access these events to extract analytical data. Access speed and high availability are made possible by the ClickHouse technology. This means that a storage is a ClickHouse cluster bound to a KUMA storage service. ClickHouse clusters can be supplemented with cold storage disks.
When choosing a ClickHouse cluster configuration, consider the specific event storage requirements of your organization. For more information, please refer to the ClickHouse documentation.
You can create spaces in repositories. Spaces let you structure the data in the cluster and, for example, store events of a certain type together.
Page top
About tenants
KUMA supports the multitenancy mode in which one instance of KUMA installed in the infrastructure of the main organization (main tenant) allows its branches (tenants) to receive and process their own events in isolation.
The system is managed centrally through the shared web interface, however, the tenants operate independently of each other and have access only to their own resources, services, and settings. Events of tenants are stored separately.
A user can have access to multiple tenants at the same time. You can also select which tenants' data you want to be displayed in sections of the KUMA web interface.
Two tenants are created by default in KUMA:
- The Main tenant contains resources and services that belong to the main tenant. Only the general administrator has access to these resources.
- The Shared tenant is where the general administrator can place resources, asset categories, and monitoring policies that are available to users of all tenants. Access to the Shared tenant can be restricted for individual users.
About events
Events are information security events registered on the monitored elements of the corporate IT infrastructure. For example, events include login attempts, interactions with a database, and information sent by sensors. Each individual event may appear meaningless, but taken together, they paint a bigger picture of network activity that can help you identify security threats. This is the core functionality of KUMA.
KUMA receives events from logs and restructures them by bringing data from heterogeneous sources to a uniform format (this process is called normalization). The events are then filtered, aggregated, and sent to the correlator service for analysis and to the storage service where they are retained. When KUMA recognizes a specific event or a sequence of events, it creates correlation events, which are also analyzed and retained. If an event or sequence of events indicates a potential security threat, KUMA creates an alert. An alert is a notification about the threat bundled with all related data, which is brought to the attention of a security officer and can be investigated. If the nature of the data received by KUMA or the generated correlation events and alerts indicate a possible attack or vulnerability, the symptoms of such an occurrence can be combined into an incident.
For convenience of investigating alerts and processing incidents, make sure that time is synchronized on all devices involved in the event life cycle (event sources, KUMA servers, client hosts) with the help of Network Time Protocol (NTP) servers.
Throughout their life cycle, events undergo conversions and may be named differently. The following is an outline of the life cycle of a typical event:
The first steps are carried out in a collector.
- Raw event. The original message from an event source received at a KUMA connector is called a raw event. This message is unprocessed, and KUMA cannot use it yet. To make it usable, it must be normalized to fit the KUMA data model. This happens at the next stage.
- Normalized event. A normalizer transforms the data of the raw event to make it fit the KUMA data model. After this transformation, the original message turns into a normalized event, which KUMA can analyze. From this point on, KUMA handles only normalized events. Raw events are no longer used, but they can be kept as a part of normalized events inside the
Rawfield.The application has the following normalizers:
- JSON
- CEF
- Regexp
- Syslog (as per RFC3164 and RFC5424)
- CSV/TSV
- Key-value
- XML
- Netflow v5, v9, IPFIX (v10), sFlow v5
- SQL
At this point, normalized events can already be used for analysis.
- Destination. After the collector has processed the event, the event can be sent to other KUMA services: a correlator and/or storage.
Subsequent steps of the event life cycle take place in the correlator.
The following event types are distinguished:
- Base event. An event that has been normalized.
- Aggregated event. When dealing with a large number of similar events, you can "merge" them into a single event to save processing time and resources. These act as base events and are processed in the same way, but In addition to all of the parameters of the parent events (the events that have been "merged"), an aggregated event has a counter that tells how many parent events it represents. Aggregated events also store the time when the first and last parent events were received.
- Correlation event. When a sequence of events is detected that satisfies the conditions of a correlation rule, the application creates a correlation event. These events can be filtered, enriched, and aggregated. They can also be sent for storage or looped into the correlator pipeline.
- Audit event. Audit events are created when certain security-related actions are performed in KUMA. These events are used to ensure system integrity. These events are automatically placed in a separate storage space and stored for at least 365 days.
- Monitoring event. These events are used to track changes in the amount of data received by KUMA.
About alerts
In KUMA, an alert is created when a received sequence of events triggers a correlation rule. Correlation rules are created by KUMA analysts to check incoming events for possible security threats, so when a correlation rule is triggered, a warning about possible malicious activity is displayed. Security officers responsible for data protection must investigate these alerts and respond if necessary.
KUMA automatically assigns a severity level to each alert. This parameter shows how important or numerous are the processes that triggered the correlation rule. Alerts with higher severity should be dealt with first. The severity value is automatically updated when new correlation events are received, but a security officer can also set it manually. In this case, the alert severity is no longer automatically updated.
Related events are linked to the alerts, which allows enriching alerts with data from these events. KUMA also offers drill down functionality for alert investigation.
You can use alerts to create incidents.
Alert management in KUMA is described in this section.
Page top
About incidents
If the nature of the data received by KUMA or the generated correlation events and alerts indicate a possible attack or vulnerability, the symptoms of such an occurrence can be combined into an incident. This allows security officers to analyze threat manifestations in a comprehensive manner and facilitates response.
You can assign a category, type, and severity to an incident, and assign incidents to data protection officers for processing.
Incidents can be exported to NCIRCC.
Page top
About assets
Assets are network devices registered in KUMA. Assets generate network traffic when they send and receive data. KUMA can be configured to track this activity and create base events with a clear indication of where the traffic is coming from and where it is going. The event can contain source and destination IP addresses, as well as DNS names. If you register an asset with certain parameters (for example, a specific IP address), this asset is linked to all events that mention these parameters (IP address in this example).
Assets can be logically grouped. This helps keep your network structure transparent and gives you additional ways to work with correlation rules. When an event linked to an asset is processed, the category of this asset is also taken into consideration. For example, if you assign a high severity value to a certain asset category, base events involving these assets will lead to correlation events with higher severity. This in turn cascades into higher-severity alerts and, therefore, more urgency when responding to such an alert.
We recommend registering network assets in KUMA because using assets allows formulating clear and versatile correlation rules, which makes event analysis more efficient.
Asset management in KUMA is described in this section.
Page top
About resources
Resources are KUMA components that contain parameters for implementing various functions: for example, establishing a connection with a given web address or converting data in accordance with certain rules. These modular components are assembled into resource sets for services, which in turn are used to create KUMA services.
Page top
About services
Services are the main components of KUMA that handle events by receiving, processing, analyzing, and storing them. Each service consists of two parts that work together:
- One part of the service is created in the KUMA web interface based on a resource set for services.
- The other part of the service is installed in the network infrastructure where KUMA is deployed, as one of KUMA components. The server part of a service can consist of multiple instances: for example, services of the same agent or storage can be installed on multiple devices at the same time.
The two parts of a service are linked to each other by the service ID.
Page top
About agents
KUMA agents are services that forward raw events from servers and workstations to KUMA destinations.
The following types of agents are provided:
- wmi agents receive data from remote Windows devices using Windows Management Instrumentation. These are installed on Windows devices.
- wec agents receive Windows logs from the local device using Windows Event Collector. They are installed to Windows assets.
- tcp agents receive data over TCP. These are installed on Linux and Windows devices.
- udp agents receive data over UDP. They are installed to Linux and Windows assets.
- nats-jetstream agents are used for communication through NATS. They are installed to Linux and Windows assets.
- kafka agents are used for kafka communications. They are installed to Linux and Windows assets.
- http agents are used for communication over HTTP. They are installed to Linux and Windows assets.
- file agents get data from a file. They are installed to Linux and Windows assets.
- ftp agents receive data over the File Transfer Protocol. They are installed to Linux and Windows assets.
- nfs agents receive data over the Network File System protocol. They are installed to Linux and Windows assets.
- snmp agents receive data using the Simple Network Management Protocol. They are installed to Linux and Windows assets.
- diode agents are used together with data diodes to receive events from isolated network segments. They are installed to Linux and Windows assets.
- etw agents receive Event Tracing for Windows data. They are installed to Windows assets.
About Severity
Severity reflects the relative importance of security-sensitive activity detected by a KUMA correlator. It suggests the order in which alerts should be processed, and indicates whether senior security officers should be involved.
The correlator automatically assigns a severity value to correlation events and alerts based on correlation rule settings. The severity of an alert also depends on the assets linked to the events being processed because correlation rules take into account the severity of these assets' category. If an alert or correlation event does not have any linked assets with a severity value, or if it does not have any linked assets at all, the alert or correlation event inherits the severity of the correlation rule that generated it. The severity of an alert or correlation event is always equal to or greater than the severity of the correlation rule that generated it.
The severity of an alert can be changed manually. A severity that has been manually modified is no longer automatically updated by correlation rules.
Possible severity values:
- Low
- Medium
- High
- Critical
About the End User License Agreement
The End User License agreement is a legal agreement between you and AO Kaspersky Lab that specifies the conditions under which you can use the application.
Read the terms of the End User License Agreement carefully before using the application for the first time.
You can familiarize yourself with the terms of the End User License Agreement in the following ways:
- Go to the directory with the extracted installer and read the ./roles/kuma/files/LICENSE text file.
- Go to the directory with the extracted installer and run the following command to display the text of the End User License Agreement:
./roles/kuma/files/kuma license --show
- On a host with any KUMA component installed (such as Core, collector, correlator, storage), run the following command to display the text of the End User License Agreement:
/opt/kaspersky/kuma/kuma license --show
- On devices included in the kuma_storage, kuma_collector, kuma_correlator, or kuma_core groups in the inventory file, open the LICENSE file located in the /opt/kaspersky/kuma directory.
On a host in the kuma_core group, you can view the End User License Agreement only if a non-cluster installation is selected.
- On the Windows agent, run the following command to display the text of the End User License Agreement:
.\kuma.exe license --show
- On the Linux agent, go to the directory with the 'kuma' executable file and run the following command to display the text of the End User License Agreement:
./kuma license --show
You accept the terms of the End User License Agreement by confirming your acceptance of the End User License Agreement during the application installation. If you do not accept the terms of the End User License Agreement, you must cease the installation of the application and must not use the application.
Page top
About the license
A License is a time-limited right to use the application, granted under the terms of the End User License Agreement.
A license entitles you to the following kinds of services:
- Use of the application in accordance with the terms of the End User License Agreement
- Getting technical support
The scope of services and the duration of usage depend on the type of license under which the application was activated.
A license is provided when the application is purchased. KUMA behavior in case no license is available:
- After the license expires, KUMA keeps working, but with limited functionality: collectors continue to receive and process events for 7 days, after which they restart and stop receiving new events. Old events remain available. Creating and editing resources, creating and running services also becomes impossible.
- If the license is removed, KUMA collectors stop receiving and processing new events immediately. Old events remain available. Creating and editing resources, creating and running services also becomes impossible.
To continue using KUMA with its full functionality, you need to renew your license.
We recommend that you renew your license no later than its expiration date to ensure maximum protection against cyberthreats.
Page top
About the License Certificate
A License Certificate Is a document that is provided to you along with a key file or activation code.
The License Certificate contains the following information about the license being granted:
- License key or order number
- Information about the user who is granted the license
- Information about the application that can be activated under the provided license
- Restriction on the number of licensing units (for example, the number of events that can be processed per second)
- Start date of the license term
- License expiration date or license term
- License type
About the license key
A license key is a sequence of bits that you can apply to activate and then use the application in accordance with the terms of the End User License Agreement. License keys are generated by Kaspersky specialists.
You can add a license key to the application by applying a key file. The license key is displayed in the application interface as a unique alphanumeric sequence after you add it to the application.
The license key may be blocked by Kaspersky in case the terms of the License Agreement have been violated. If the license key has been blocked, you need to add another one if you want to use the application.
A license key may be active or reserve.
An active license key is the license key currently used by the application. An active license key can be added for a trial or commercial license. The application cannot have more than one active license key.
A reserve license key is the license key that entitles the user to use the application but is not currently in use. The additional license key automatically becomes active when the license associated with the current active license key expires. An additional license key can be added only if an active license key has already been added.
A license key for a trial license can be added as an active license key. A license key for a trial license cannot be added as an additional license key.
Page top
About the key file
The key file is a file named license.key provided to you by Kaspersky. The key file is used to add a license key that activates the application.
You receive a key file at the email address that you provided after purchasing KUMA.
You do not need to connect to Kaspersky activation servers in order to activate the application with a key file.
If the key file has been accidentally deleted, you can restore it. You may need a key file, for example, to register with Kaspersky CompanyAccount.
To restore the key file, you need to do one of the following:
- Contact the license seller.
- Get a key file on the Kaspersky website based on the available activation code.
About the license code
A license code is a unique sequence of twenty Latin letters and numerals that allows you to activate the application. Kaspersky sends you a license code to the email address that you provided after purchasing KUMA.
Activation with a license code from the Core server requires constant internet access. To activate with a license code, you need a connection to Kaspersky activation servers:
https://activation-v2.kaspersky.com:443
In the case of a closed infrastructure, you can specify a proxy server.
If the license code was accidentally deleted, you can get it again by contacting the license vendor.
When the license code is deleted from KUMA, the KUMA collectors immediately stop receiving and processing new events. Old events remain available. Creating and editing resources, creating and running services also becomes impossible.
The web interface of the application displays settings depending on the functionality covered by the license.
If you want to use a license code to activate KUMA, in the Settings → License section, in the Activation type drop-down list, select Activate by code.
If the new license fully matches the parameters of the license that was activated with a license file, the license code activation is performed seamlessly. If the parameters of the old license and the new license are different, the services are restarted
KUMA generates an audit event after adding a license, deleting a license, or a license expiring.
When switching from a license file to a license code, the previous license is automatically deleted. Before renewing your license, make sure that you have the old activation file in your possession.
Page top
Data provision in Kaspersky Unified Monitoring and Analysis Platform
Data provided to third parties
KUMA functionality does not involve automatic provision of user data to third parties.
Locally processed data
Kaspersky Unified Monitoring and Analysis Platform (hereinafter KUMA or "application") is an integrated software solution that combines the following functionality:
- Receiving, processing, and storing information security events
- Analyzing and correlating incoming data
- Searching in received events
- Creation of notifications upon detecting symptoms of information security threats.
- Creation of alerts and incidents for processing information security threats.
- Displaying information about the status of the customer's infrastructure on the dashboard and in reports.
- Monitoring event sources.
- Device (asset) management — viewing information about assets, searching, adding, editing, and deleting assets, exporting asset information to a CSV file.
To perform its primary functions, KUMA may receive, store and process the following information:
- Information about devices on the corporate network.
The KUMA Core server receives data if the corresponding integration is configured. You can add assets to KUMA in the following ways:
- Import assets:
- On demand from MaxPatrol.
- On a schedule from Kaspersky Security Center and KICS/KATA.
- Create assets manually through the web interface or via the API.
KUMA stores the following device information:
- Technical characteristics of the device.
- Vulnerabilities of the asset.
- Information specific to the source of the asset.
- Import assets:
- Additional technical attributes of devices on the corporate network that the user specifies to send an incident to NCIRCC: IP addresses, domain names, URIs, email address of the attacked object, attacked network service, and port/protocol.
- Information about the organization: name, tax ID, address, email address for sending notifications.
- Active Directory information about organizational units, domains, users, and groups obtained as a result of querying the Active Directory network.
The KUMA Core server receives this information if the corresponding integration is configured. To ensure the security of the connection to the LDAP server, the user must enter the server URL, the Base DN, connection credentials, and certificate in the KUMA console.
- Information for domain authentication of users in KUMA: root DN for searching access groups in the Active Directory directory service, URL of the domain controller, certificate (the root public key that the AD certificate is signed with), full path to the access group of users in AD (distinguished name).
- Information contained in events from configured sources.
In the collector, the event source is configured, KUMA events are generated and sent to other KUMA services. Sometimes events can arrive first at the agent service, which relays events from the source to the collector. Additionally, you can configure the saving of the address or host name of the event aggregator server.
- Information required for the integration of KUMA with other applications (Kaspersky Threat Lookup, Kaspersky CyberTrace, Kaspersky Security Center, Kaspersky Industrial CyberSecurity for Networks, Kaspersky Automated Security Awareness Platform, Kaspersky Endpoint Detection and Response, Security Orchestration, Automation and Response SOAR, AI services: AI score and asset status, Kaspersky Investigation & Response Assistant).
It can include certificates, tokens, URLs or credentials for establishing a connection with the other application, or other data necessary for the basic functionality of KUMA, for example, email. The user enters this data in the KUMA console
- Information about sources from which event receipt is configured.
It can include the source name, host name, IP address, the monitoring policy assigned to the source. The monitoring policy specifies the email address of the person responsible, to whom a notification will be sent if the policy is violated.
- User accounts: name, username, email address. The user can view their profile data in the KUMA console.
- User profile settings:
- User role in KUMA. Assigned roles will be displayed.
- Localization language, notification settings, display of non-printable characters.
The user enters this data in the KUMA interface.
- List of asset categories in the Assets section, default dashboard, TV mode flag for the dashboard, SQL query for default events, default preset.
The user specifies these settings in the corresponding sections of the KUMA console.
- Data for domain authentication of users in KUMA:
- Active Directory: root DN for searching access groups in the Active Directory directory service, URL of the domain controller, certificate (the root public key that the AD certificate is signed with), full path to the access group of users in AD (distinguished name).
- Active Directory Federation Services: trusted party ID (KUMA ID in AD FS), URI for getting Connect metadata, URL for redirection from AD FS, and the AD FS server certificate.
- FreeIPA: Base DN, URL, certificate (the public root key that was used to signed the FreeIPA certificate), custom integration credentials, connection credentials.
- Audit events
KUMA automatically records audit events.
- KUMA log
The user can enable verbose logging in the KUMA console. Log entries are stored on the user's device, no data is transmitted automatically.
- Information about the user accepting the terms and conditions of legal agreements with Kaspersky.
- Any information that the user enters in the KUMA interface.
The information listed above can find its way into KUMA in the following ways:
- The user enters information in the KUMA console.
- KUMA services (agent or collector) receive data if the user has configured a connection to event sources.
- Through the KUMA REST API.
- Device information can be obtained using the utility from MaxPatrol.
The listed information is stored in the KUMA database (MongoDB, ClickHouse, SQLite). Passwords are stored in an encrypted form (the hash of the password is stored).
All of the information listed above can be transmitted to Kaspersky only in dump files, trace files, or log files of KUMA components, including log files created by the installer and utilities.
Dump files, trace files, and log files of KUMA components may contain personal and confidential information. Dump files, trace files, and log files are stored on the device in unencrypted form. Dump files, trace files, and log files are not automatically submitted to Kaspersky, but the administrator can manually submit this information to Kaspersky at the request of Technical Support to help troubleshoot KUMA problems.
Kaspersky uses the collected data in anonymized form and only for general statistical purposes. Summary statistics is generated from the received raw data automatically and does not contain any personal or other confidential information. When new data accumulates, older data is erased (once a year). Summary statistics is stored indefinitely.
Kaspersky protects all received data in accordance with applicable law and Kaspersky policies. Data is transmitted over secure communication channels.
Page top
Adding a license key to the program web interface
You can add an application license key in the KUMA web interface.
Only users with the Administrator role can add a license key.
To add a license key to the KUMA web interface:
- Open the KUMA web interface and select Settings → License.
The window with KUMA license conditions opens.
- Select the key you want to add:
- If you need to add an active key, click the Add active license key button.
This button is not displayed if a license key has already been added to the application. If you want to add an active license key instead of the key that has already been added, the current license key must be deleted.
- If you want to add a reserve key, click the Add reserve license key button.
This button is inactive until an active key is added. If you want to add a reserve license key instead of the key that has already been added, the current reserve license key must be deleted.
The license key file selection window appears on the screen.
- If you need to add an active key, click the Add active license key button.
- Select a license file by specifying the path to the directory and the name of the license key file with the KEY extension.
The license key from the selected file will be loaded into the application. Information about the license key is displayed under Settings → License.
Page top
Viewing information about an added license key in the program web interface
In the KUMA web interface, you can view information about the added license key. Information about the license key is displayed under Settings → License.
Only users with the Administrator role can view license information.
The License tab window displays the following information about added license keys:
- Expires on—date when the license key expires.
- Days remaining—number of days before the license is expired.
- EPS available—number of events processed per second supported by the license.
- EPS current per day is the current average amount of events processed by KUMA per day.
- License key—unique alphanumeric sequence.
- Company—name of the company that purchased the license.
- Client name—name of client who purchased the license.
- Modules—modules available for the license.
For an SMB license, the following settings are available in addition to the above:
- EPS current per day is the current average amount of events processed by KUMA per day.
- EPS current per hour is the current average amount of events processed by KUMA per hour.
If values of two settings are exceeded, the collector with the maximum EPS value stops receiving new events for 1 hour. After 1 hour, the collector resumes operation. Multiple collectors may be paused at the same time. A notification about the maximum EPS allowed by the license being exceeded is sent to the user with the General Administrator role.
Page top
Removing a license key in the program web interface
In KUMA, you can remove an added license key from the application (for example, if you need to replace the current license key with a different key). After the license key is removed, collectors immediately stop receiving and processing events. Old events remain available. Creating and editing resources, creating and running services also becomes impossible. This functionality will be re-activated the next time you add a license key.
Only users with the administrator role can delete license keys.
To delete an added license key:
- Open the KUMA web interface and select Settings → License.
The window with KUMA license conditions opens.
- Click the
 icon on the license that you want to delete.
A confirmation window opens.
- Confirm deletion of the license key.
The license key will be removed from the application.
Page top
Administrator's guide
This section provides information about installing and configuring the KUMA SIEM system.
Installing and removing KUMA
To install KUMA, you need the distribution kit:
- kuma-ansible-installer-<build number>.tar.gz contains all necessary files for installing KUMA without the support for high availability configurations.
- kuma-ansible-installer-ha-<build number>.tar.gz contains all necessary files for installing KUMA in a high availability configuration.
To complete the installation, you need the install.sh installer file and an inventory file that describes your infrastructure. You can create an inventory file based on a template. Each distribution contains an install.sh installer file and the following inventory file templates:
- single.inventory.yml.template
- distributed.inventory.yml.template
- expand.inventory.yml.template
- k0s.inventory.yml.template
KUMA keeps its files in the /opt directory, so we recommend making /opt a separate partition and allocating 16 GB for the operating system and the remainder of the disk space for the /opt partition.
KUMA is installed in the same way on all hosts using the installer and your prepared inventory file in which you describe your configuration. We recommend taking time to think through the setup before you proceed.
The following installation options are available:
- Installation on a single server
Single-server installation diagram

Installation on a single server
Example inventory file for installation on a single server
You can install all KUMA components on the same server: specify the same server in the single.inventory.yml inventory file for all components. An "all-in-one" installation can handle a small stream of events, up to 10,000 EPS. If you plan to use many dashboard layouts and process a lot of search queries, a single server might not be sufficient. In that case, we recommend the distributed installation.
- Distributed installation
Distributed Installation diagram
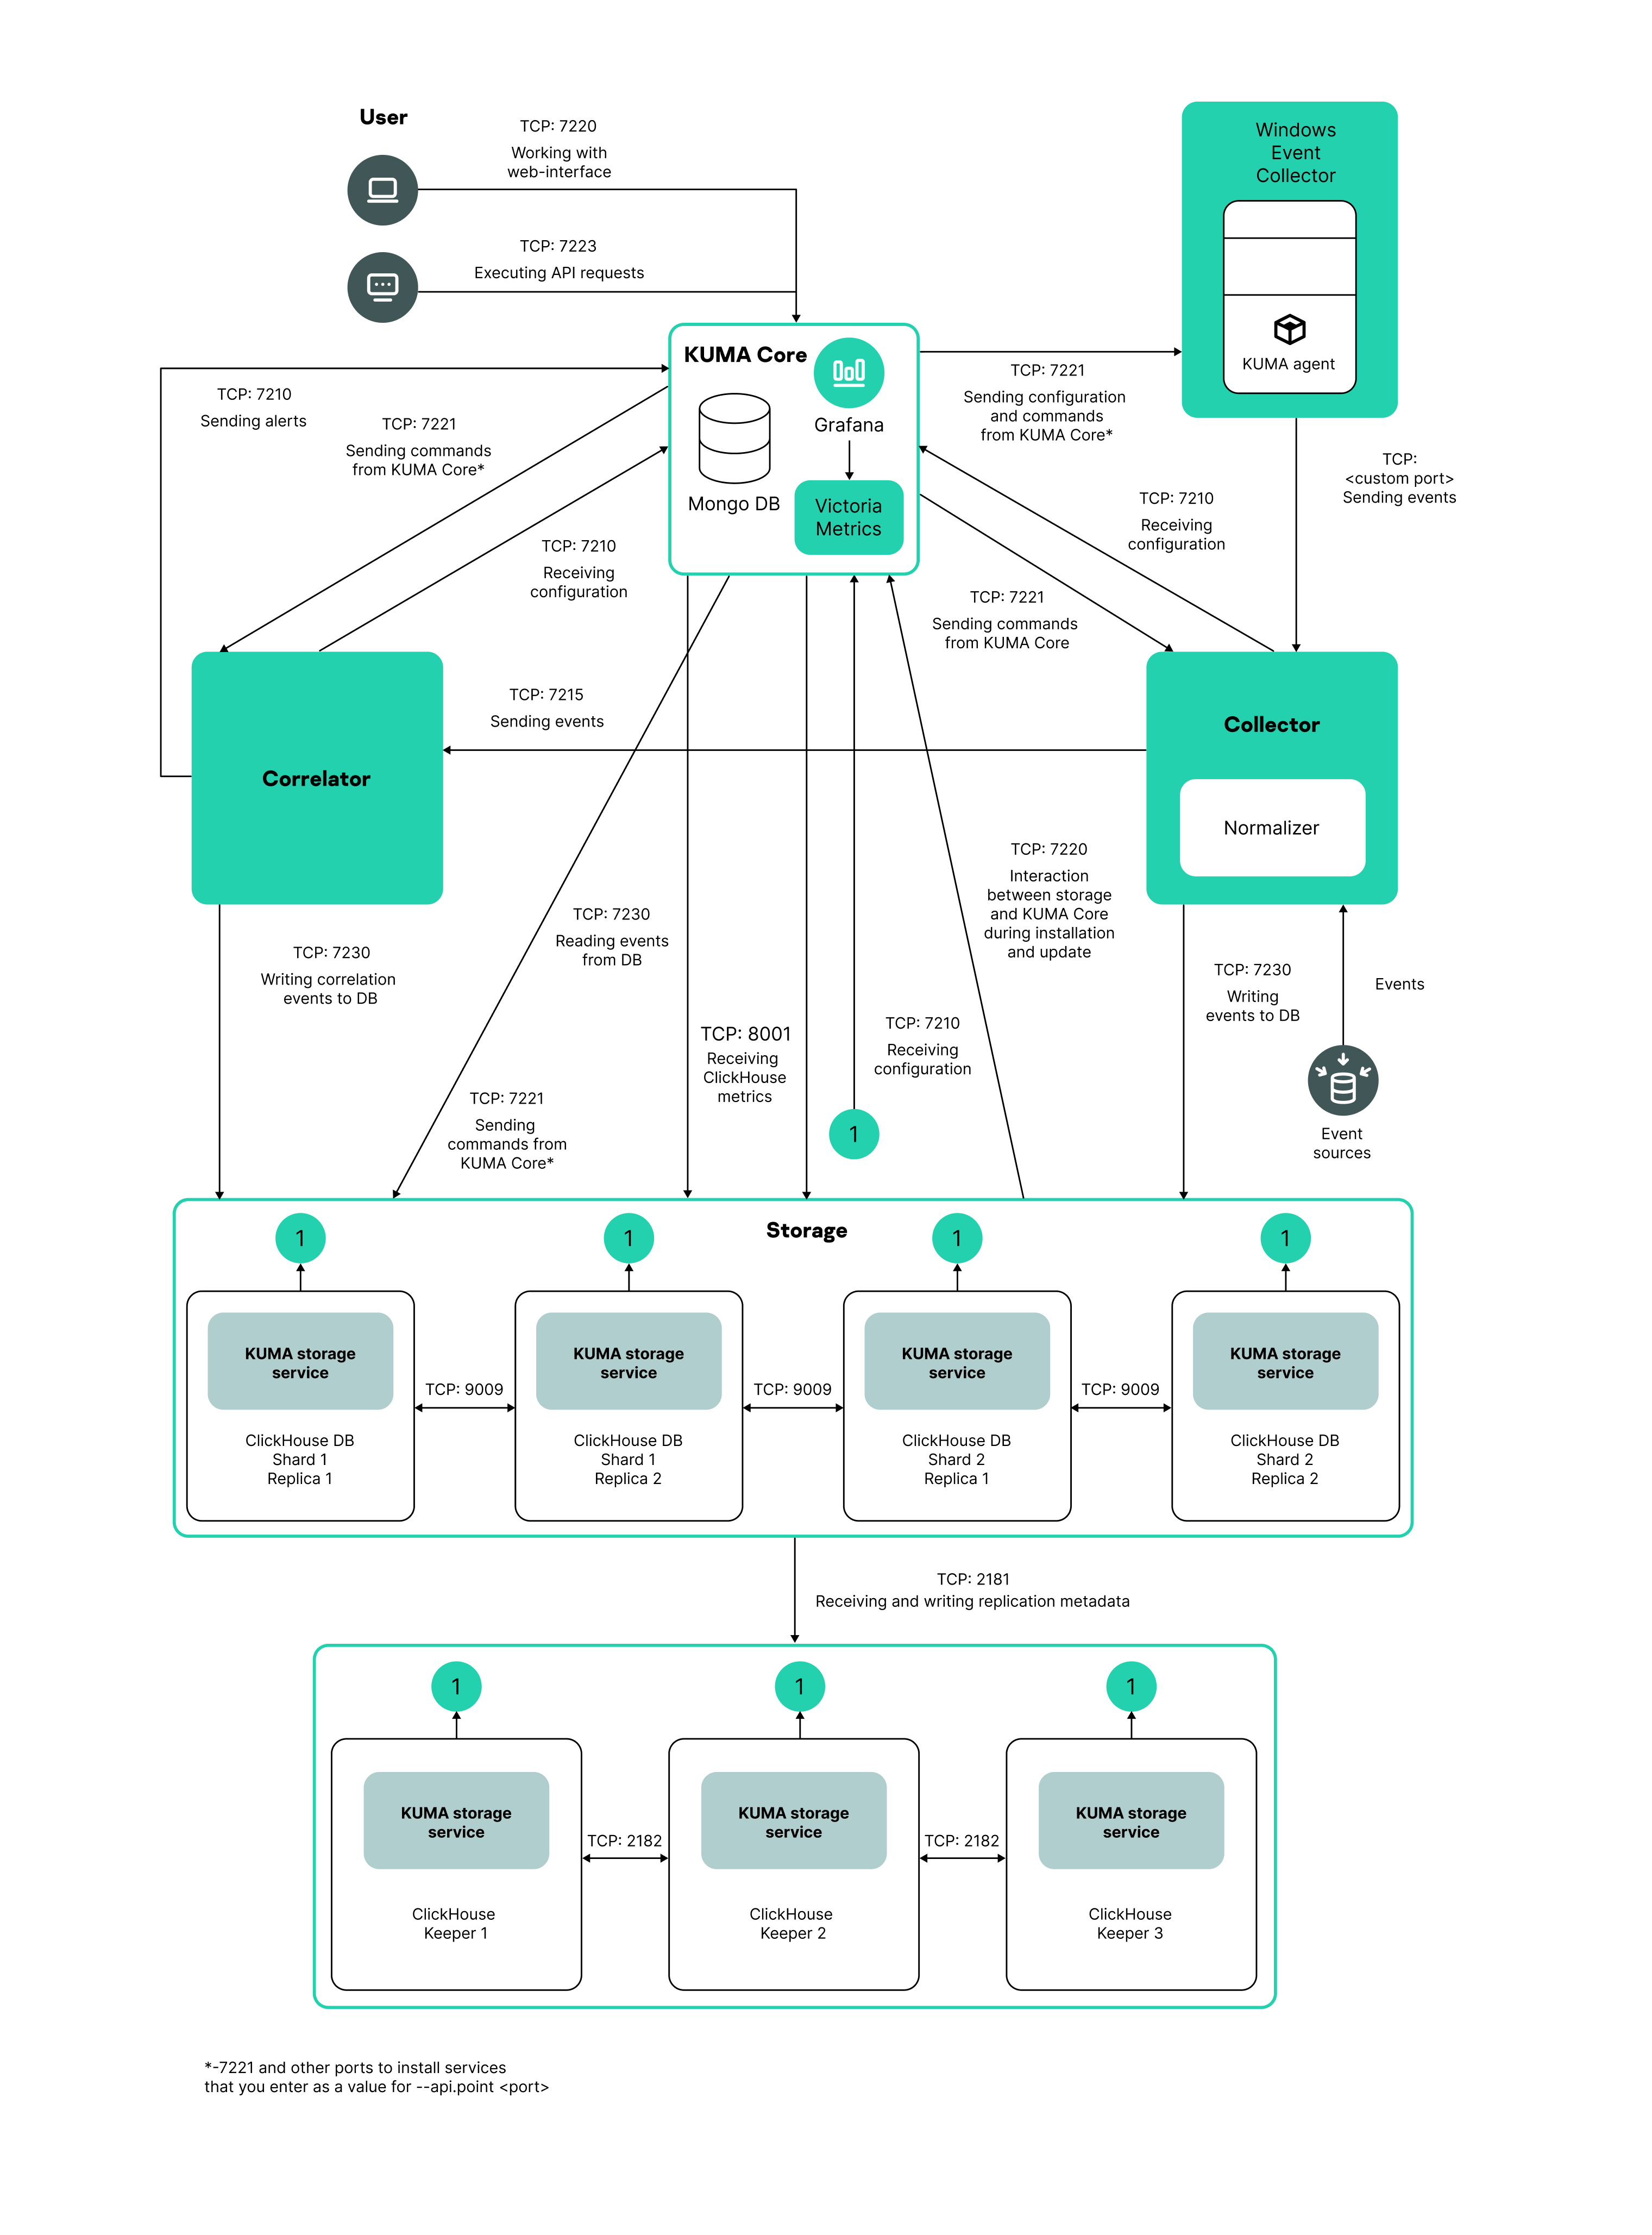
Distributed installation diagram
Example inventory file for distributed installation
You can install KUMA services on different servers; you can describe the configuration for a distributed installation in the distributed.inventory.yml inventory file.
- Distributed installation in a high availability configuration
Diagram of distributed installation in a high availability configuration
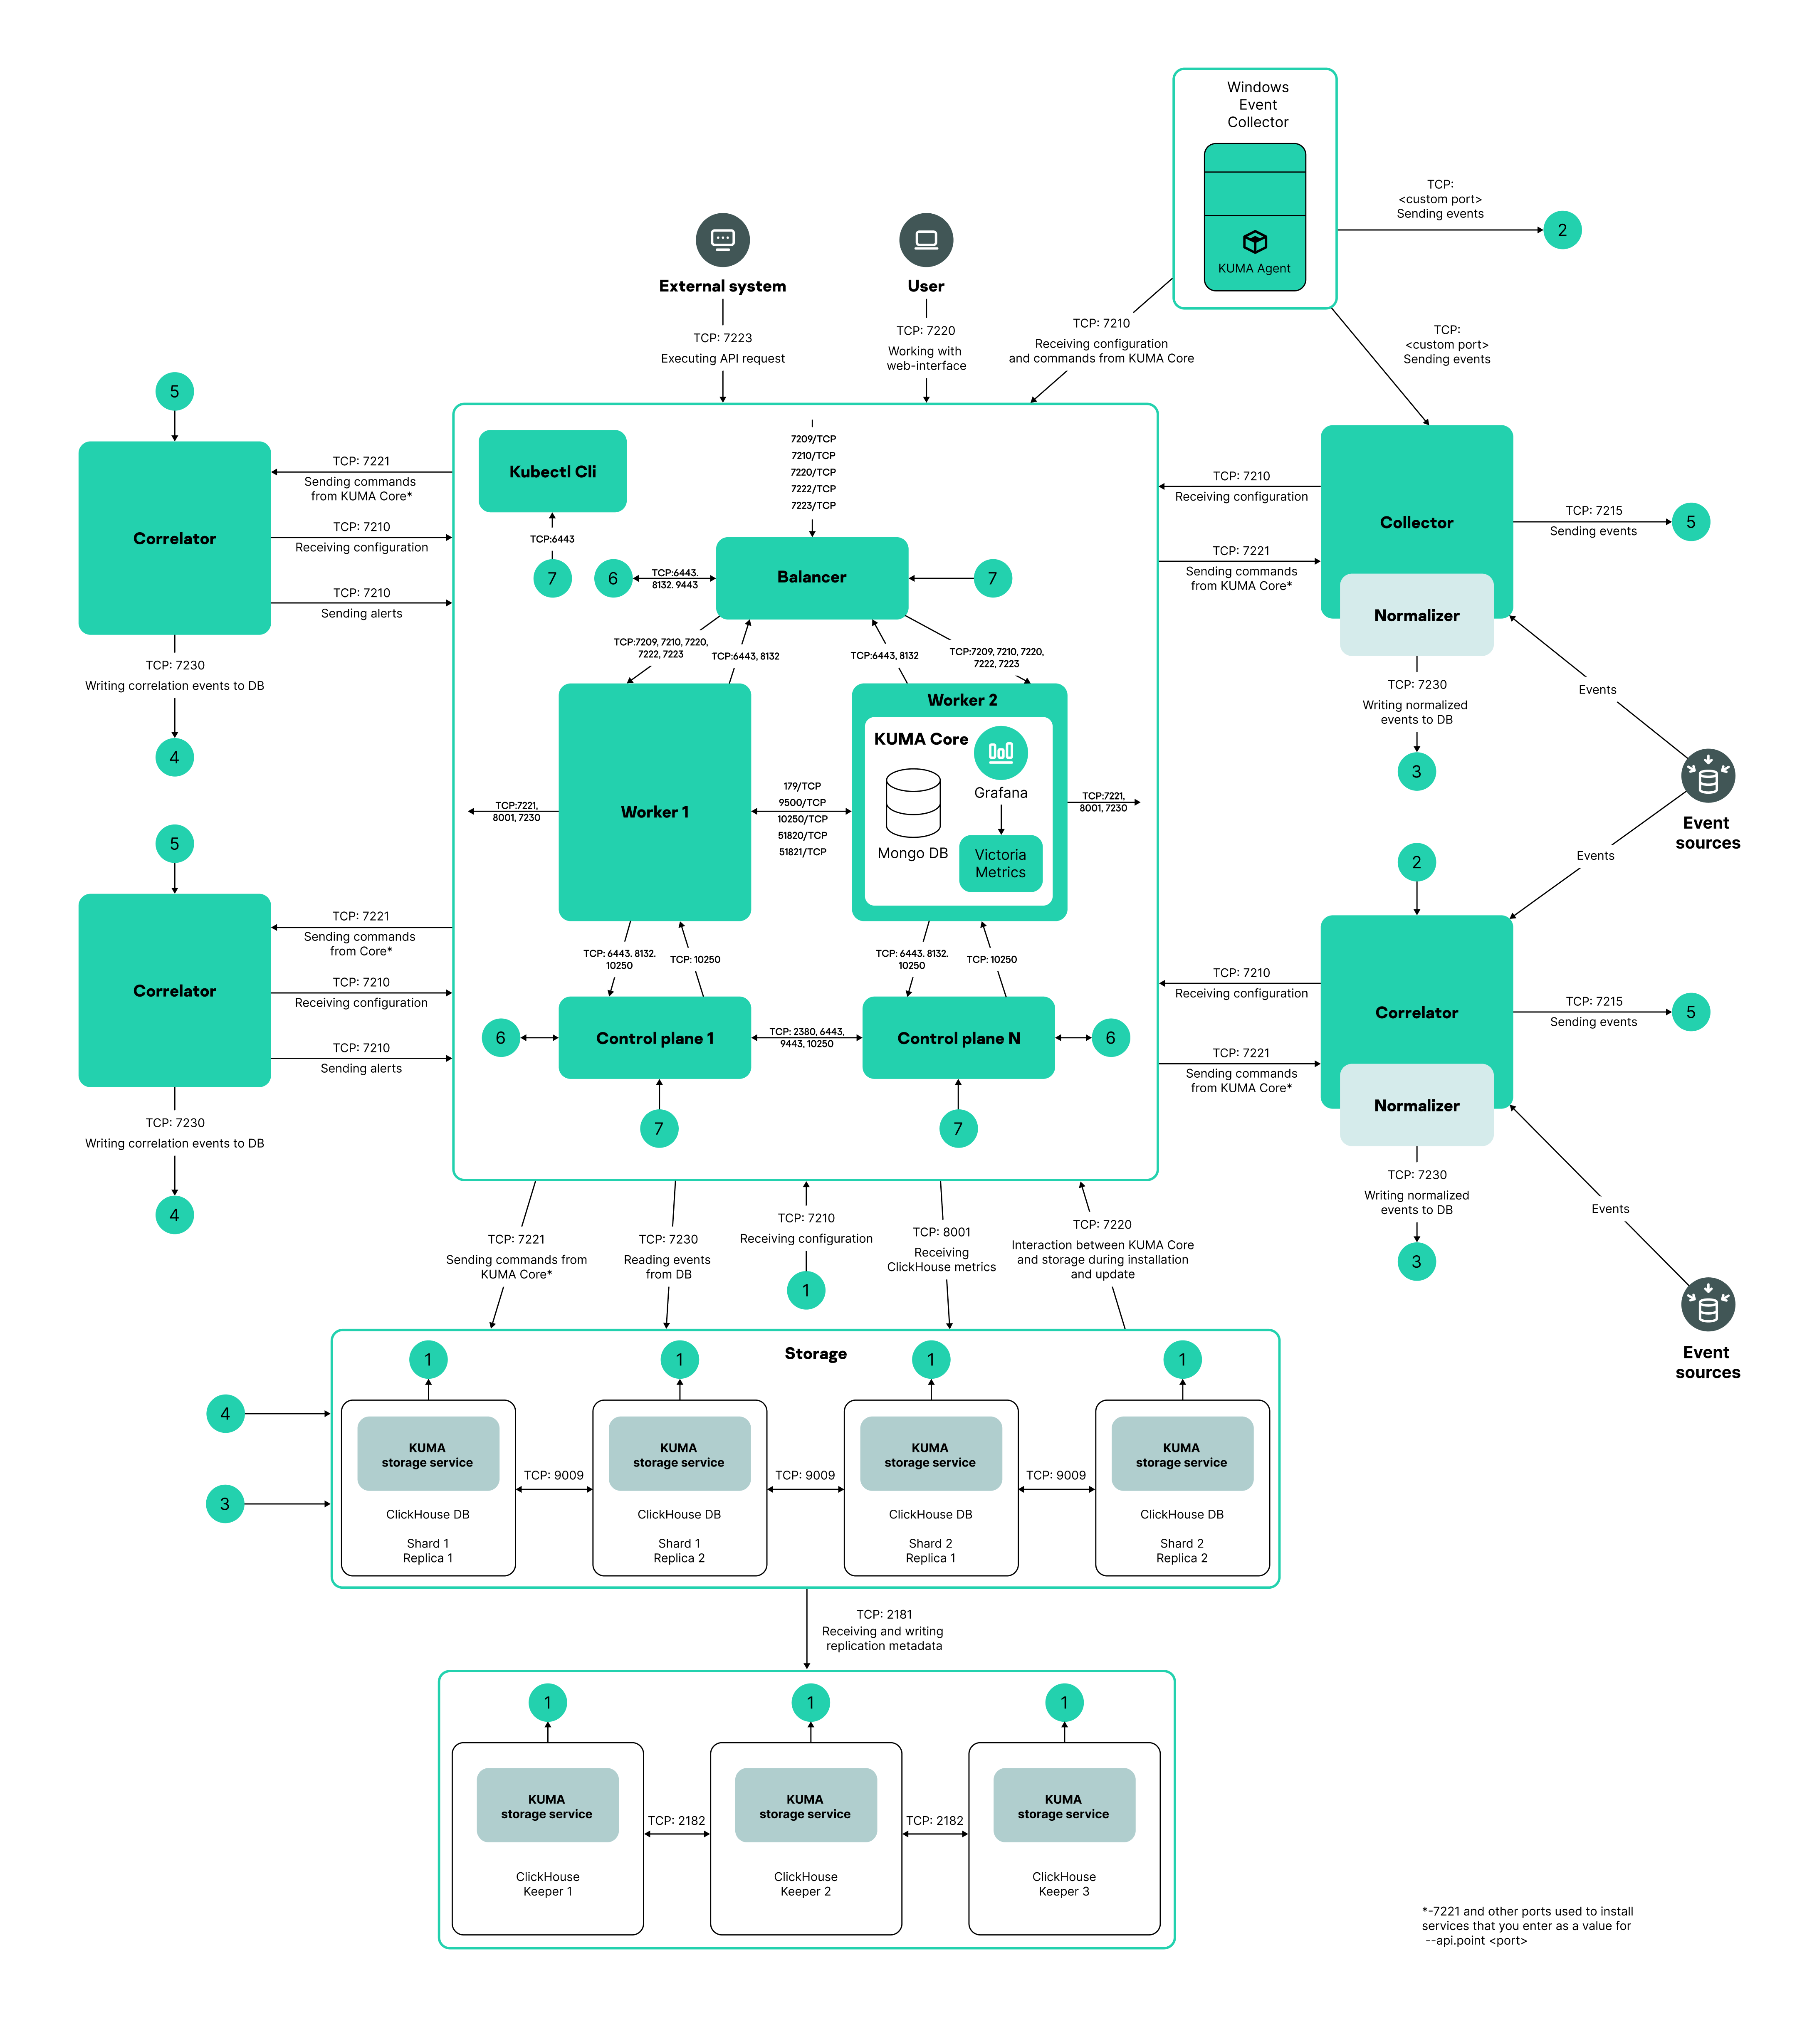
Distributed installation in a high availability configuration
Example inventory file for distributed installation in a high availability configuration
You can install the KUMA Core on a Kubernetes cluster for high availability. Describe the configuration in the k0s.inventory.yml inventory file.
Program installation requirements
General application installation requirements
You can install the application on the following operating systems:
- Oracle Linux
- Astra Linux
- Ubuntu
- RED OS
Supported operating system versions are listed in the Hardware and software requirements section.
Supported configurations are Server and Server with GUI support. In the Server with GUI support configuration, you do not need to install additional packages for reporting.
RED OS 8 is supported without high availability (HA). When using RED OS 8 in the Server with GUI support configuration, you need to install the iscsi-initiator-utils package, and then run the following commands:
systemctl enable iscsidsystemctl start iscsid
Before deploying the application, make sure the following conditions are met:
- Servers on which you want to install the components satisfy the hardware and software requirements.
- Ports to be used by the installed instance of KUMA are available.
- KUMA components are addressed using the fully qualified domain name (FQDN) of the host in the hostname.example.com format. Before you install the application, make sure that the correct host FQDN is returned in the
Static hostnamefield. To do so, run the following command:hostnamectl status - The name of server on which you are running the installer is not
localhostorlocalhost.<domain>. - The name of the server on which you are installing KUMA Core does not start with a numeral.
- Time synchronization over Network Time Protocol (NTP) is configured on all servers with KUMA services.
Installation requirements for Oracle Linux, Astra Linux, Ubuntu 22.04 LTS, and RED OS 7.3.4 and 8
|
Oracle Linux |
Astra Linux |
Ubuntu 22.04 LTS |
RED OS 7.3.4 and 8 |
|---|---|---|---|---|
Python version |
3.6 to 3.11. Versions 3.12 and later are not supported.
|
3.6 to 3.11. Versions 3.12 and later are not supported.
|
3.6 to 3.11. Versions 3.12 and later are not supported.
|
3.6 to 3.11. Versions 3.12 and later are not supported.
|
SELinux module |
Disabled |
Disabled |
Disabled |
Disabled |
Package manager |
pip3 |
pip3 |
pip3 |
pip3 |
Basic packages |
More on upgrading from Oracle Linux 8.x to Oracle Linux 9.x. To install the packages, run the following commands:
|
To install the packages, run the following command:
|
To install the packages, run the following command:
You can download the openssl1.1.1 package from the official website of Ubuntu and install it using the following command:
|
To install the packages, run the following commands:
|
Dependent packages |
No value. |
To install the packages, run the following command:
If you plan to query Oracle DB databases from KUMA, you need to install the Astra Linux libaio1 package. |
To install the packages, run the following command:
|
No value. |
Packages that must be installed on a device with the KUMA Core for correct generation and downloading of reports |
To install the packages, run the following command:
|
To install the packages, run the following command:
|
To install the packages, run the following command:
|
To install the packages, run the following command:
|
User permissions required to install the application |
No value. |
You need to assign the required permissions to the user that will be installing the application:
|
No value. |
No value. |
Upgrading from Oracle Linux 8.x to Oracle Linux 9.x
To upgrade from Oracle Linux 8.x to Oracle Linux 9.x:
- Run the following commands to disable KUMA services on the hosts where the services are installed:
sudo systemctl disable kuma-collector-<service ID>.servicesudo systemctl disable kuma-correlator-<service ID>.servicesudo systemctl disable kuma-storage-<service ID>.servicesudo systemctl disable kuma-grafana.servicesudo systemctl disable kuma-mongodb.servicesudo systemctl disable kuma-victoria-metrics.servicesudo systemctl disable kuma-vmalert.servicesudo systemctl disable kuma-core.service
- Upgrade the OS on every host.
- After the upgrade is complete, run the following command to install the compat-openssl11 package on the host where you want to deploy the KUMA Core outside of the cluster:
yum install compat-openssl11 - Run the following commands to enable the services on the hosts where the services are installed:
sudo systemctl enable kuma-core.servicesudo systemctl enable kuma-storage-<service ID>.servicesudo systemctl enable kuma-collector-<service ID>.servicesudo systemctl enable kuma-correlator-<service ID>.servicesudo systemctl enable kuma-grafana.servicesudo systemctl enable kuma-mongodb.servicesudo systemctl enable kuma-victoria-metrics.servicesudo systemctl enable kuma-vmalert.service
- Restart the hosts.
As a result, the upgrade is completed.
Page top
Ports used by KUMA during installation
For the application to run correctly, you need to ensure that the KUMA components are able to interact with other components and applications over the network using the protocols and ports specified during the installation of the KUMA components.
Before installing the Core on a device, make sure that the following ports are available:
- 9090: used by Victoria Metrics.
- 8880: used by VMalert.
- 27017: used by MongoDB.
The table below lists the default ports. The installer automatically opens the ports during KUMA installation.
Network ports used for the interaction of KUMA components
Protocol |
Port |
Direction |
Purpose of the connection |
HTTPS |
7222 |
From the KUMA client to the KUMA Core server. |
Reverse proxy to the CyberTrace system. |
HTTPS |
8123 |
Local requests from the storage service to the local node of the ClickHouse cluster. |
Writing and getting normalized events in the ClickHouse cluster. |
HTTPS |
8429 |
From the KUMA agent to the KUMA Core server. |
Logging KUMA agent performance metrics. |
HTTPS |
9009 |
Between replicas of the ClickHouse cluster. |
Internal data communication between replicas of the ClickHouse cluster. |
TCP |
2181 |
From ClickHouse cluster nodes to the ClickHouse keeper replication coordination service. |
Getting and writing replication metadata by replicas of ClickHouse servers. |
TCP |
2182 |
From one ClickHouse keeper replication coordination service to another. |
Internal communication between replication coordination services to reach a quorum. |
TCP |
7210 |
From all KUMA components to the KUMA Core server. |
Getting the KUMA configuration from the KUMA Core server. |
TCP |
7220 |
|
|
TCP |
7221 and other ports used for service installation as the value of --api.port <port> |
From KUMA Core to KUMA services. |
Administration of services from the KUMA web interface. |
TCP |
7223 |
To the KUMA Core server. |
Default port for API requests. |
TCP |
8001 |
From Victoria Metrics to the ClickHouse server. |
Getting ClickHouse server operation metrics. |
TCP |
9000 |
|
Port of the ClickHouse native protocol (also called ClickHouse TCP). Used by ClickHouse applications and processes, such as clickhouse-server, clickhouse-client, and native ClickHouse tools Used for inter-server communication for distributed queries. Also used for writing and getting data in the ClickHouse cluster. |
Ports used by predefined OOTB resources
The installer automatically opens these ports during KUMA installation.
Ports used by predefined OOTB resources:
- 7230/tcp
- 7231/tcp
- 7232/tcp
- 7233/tcp
- 7234/tcp
- 7235/tcp
- 5140/tcp
- 5140/udp
- 5141/tcp
- 5144/udp
KUMA Core traffic in a high availability configuration
The table below lists the initiator (source) of the connection and the destination. The port number of the initiator can be dynamic. Return traffic within the established connection must not be blocked.
KUMA Core traffic in a high availability configuration
Source |
Destination |
Destination port |
Type |
|---|---|---|---|
External KUMA services |
Load balancer |
7209 |
TCP |
External KUMA services |
Load balancer |
7210 |
TCP |
External KUMA services |
Load balancer |
7220 |
TCP |
External KUMA services |
Load balancer |
7222 |
TCP |
External KUMA services |
Load balancer |
7223 |
TCP |
KUMA agents |
Load balancer |
8429 |
TCP |
Worker node |
Load balancer |
6443 |
TCP |
Worker node |
Load balancer |
8132 |
TCP |
Control node |
Load balancer |
6443 |
TCP |
Control node |
Load balancer |
8132 |
TCP |
Control node |
Load balancer |
9443 |
TCP |
Worker node |
External KUMA services |
Depending on the settings specified when creating the service. |
TCP |
Load balancer |
Worker node |
7209 |
TCP |
Load balancer |
Worker node |
7210 |
TCP |
Load balancer |
Worker node |
7220 |
TCP |
Load balancer |
Worker node |
7222 |
TCP |
Load balancer |
Worker node |
7223 |
TCP |
Load balancer |
Worker node |
8429 |
TCP |
External KUMA services |
Worker node |
7209 |
TCP |
External KUMA services |
Worker node |
7210 |
TCP |
External KUMA services |
Worker node |
7220 |
TCP |
External KUMA services |
Worker node |
7222 |
TCP |
External KUMA services |
Worker node |
7223 |
TCP |
KUMA agents |
Worker node |
8429 |
TCP |
Worker node |
Worker node |
179 |
TCP |
Worker node |
Worker node |
9500 |
TCP |
Worker node |
Worker node |
10250 |
TCP |
Worker node |
Worker node |
51820 |
UDP |
Worker node |
Worker node |
51821 |
UDP |
Control node |
Worker node |
10250 |
TCP |
Load balancer |
Control node |
6443 |
TCP |
Load balancer |
Control node |
8132 |
TCP |
Load balancer |
Control node |
9443 |
TCP |
Worker node |
Control node |
6443 |
TCP |
Worker node |
Control node |
8132 |
TCP |
Worker node |
Control node |
10250 |
TCP |
Control node |
Control node |
2380 |
TCP |
Control node |
Control node |
6443 |
TCP |
Control node |
Control node |
9443 |
TCP |
Control node |
Control node |
10250 |
TCP |
Cluster management console (CLI) |
Load balancer |
6443 |
TCP |
Cluster management console (CLI) |
Control node |
6443 |
TCP |
Downloading CA certificates
In the KUMA web interface, you can download the following CA certificates:
- REST API CA certificate
This certificate is used to authenticate the API server serving the KUMA public API. You can also use this certificate when importing data from MaxPatrol reports.
You can also change this certificate if you want to use your company's certificate and key instead of the self-signed certificate of the web console.
- Microservice CA certificate
This certificate is used for authentication when connecting log sources to passive collectors using TLS, but without specifying your own certificate.
To download a CA certificate:
- Open the KUMA web interface.
- In the lower left corner of the window, click the name of the user account, and in the menu, click the REST API CA certificate or Microservice CA certificate button, depending on the certificate that you want to download.
The certificate is saved to the download directory configured in your browser.
Reissuing internal CA certificates
The storage location of the self-signed CA certificate and the certificate reissue mechanism have been changed.
The certificate is stored in the database. The previous method of reissuing internal certificates by deleting certificates from the file system of the Core and restarting the Core is no longer allowed. The old method will cause the Core to fail to start. Do not connect new services to the Core until the certificate is successfully reissued.
After reissuing the internal CA certificates in the Settings → General → Reissue internal CA certificates section of the KUMA web interface, you must stop the services, delete the old certificates from the directories of the service, and manually restart all services. Only users with the General Administrator role can reissue internal CA certificates.
The Reissue internal CA certificates option is available only to a user with the General Administrator role.
The process of reissuing certificates for an individual service remains the same: in the KUMA web interface, in the Resources → Active services section, select the service; in the context menu, select Reset certificate, and delete the old certificate from the service installation directory. KUMA automatically generates a new certificate. You do not need to restart running services, the new certificate is applied automatically. A stopped service must be restarted to have the certificate applied.
To reissue internal CA certificates:
- In the KUMA web interface, go to the Settings → General section, click Reissue internal CA certificates, and read the displayed warning. If you decide to proceed with reissuing certificates, click Yes.
As a result, the CA certificates for KUMA services and the CA certificate for ClickHouse are reissued. Next, you must stop the services, delete old certificates from the service installation directories, restart the Core, and restart the stopped services to apply the reissued certificates.
- Connect to the hosts where the collector, correlator, and event router services are deployed.
- Stop all services with the following command:
sudo systemctl stop kuma-<collector/correlator/eventRouter>-<service ID>.service - Delete the internal.cert and internal.key certificate files from the "/opt/kaspersky/kuma/<
service type>/<service ID>/certificates" directories with the following command:sudo rm -f /opt/kaspersky/kuma/<service type>/<service ID>/certificates/internal.certsudo rm -f /opt/kaspersky/kuma/<service type>/<service ID>/certificates/internal.key
- Stop all services with the following command:
- Connect to the hosts where storage services are deployed.
- Stop all storage services.
sudo systemctl stop kuma-<storage>-<service ID>.service - Delete the internal.cert and internal.key certificate files from the "/opt/kaspersky/kuma/storage/<
ID service>/certificates" directories.sudo rm -f /opt/kaspersky/kuma/storage/<service ID>/certificates/internal.certsudo rm -f /opt/kaspersky/kuma/storage/<service ID>/certificates/internal.key
- Stop all storage services.
- Delete all ClickHouse certificates from the "/opt/kaspersky/kuma/clickhouse/certificates" directory.
sudo rm -f /opt/kaspersky/kuma/clickhouse/certificates/internal.certsudo rm -f /opt/kaspersky/kuma/clickhouse/certificates/internal.key - Connect to the hosts where agent services are deployed.
- Stop the services of Windows agents and Linux agents.
- Delete the internal.cert and internal.key certificate files from the working directories of the agents.
- Start the Core to apply the new CA certificates.
- For an "all-in-one" or distributed installation of KUMA, run the following command:
sudo systemctl restart kuma-core-00000000-0000-0000-0000-000000000000.service - For KUMA in a high availability configuration, to restart the Core, run the following command on the primary controller:
sudo k0s kubectl rollout restart deployment/core-deployment -n kumaYou do not need to restart victoria-metrics.
The Core must be restarted using the command because restarting the Core in the KUMA interface affects only the Core container and not the entire pod.
- For an "all-in-one" or distributed installation of KUMA, run the following command:
- Restart all services that were stopped as part of the procedure.
sudo systemctl start kuma-<collector/correlator/eventRouter/storage>-<service ID>.service - Restart victoria-metrics.
sudo systemctl start kuma-victoria-metrics.service
Internal CA certificates are reissued and applied.
Modifying the self-signed web console certificate
You can use your company's certificate and key instead of the self-signed certificate of the web console. For example, if you want to replace the self-signed CA certificate of the Core with a certificate issued by your corporate CA, you must provide an external.cert and an unencrypted external.key in PEM format.
The following example shows how to replace a self-signed CA certificate of the Core with your corporate certificate in PFX format. You can use the instructions as an example and adapt the steps according to your needs.
To replace the certificate of the KUMA web console with an external certificate:
- If you are using a certificate and key in a PFX container, use OpenSSL to convert the PFX file to a certificate and encrypted key in PEM format:
openssl pkcs12 -in kumaWebIssuedByCorporateCA.pfx -nokeys -out external.certopenssl pkcs12 -in kumaWebIssuedByCorporateCA.pfx -nocerts -nodes -out external.keyEnter the password of the PFX key when prompted (Enter Import Password).
The command creates the external.cert certificate and the external.key key in PEM format.
- In the KUMA web interface, go to the Settings → Common → Core settings section under External TLS pair, click Upload certificate and Upload key and upload the external.cert file and the unencrypted external.key file in PEM format.
- Restart KUMA:
systemctl restart kuma-core - Refresh the web page or restart the browser that you are using to manage the KUMA web interface.
Your company certificate and key are replaced.
Page top
Synchronizing time on servers
To configure time synchronization on servers:
- Install chrony:
sudo apt install chrony - Configure the synchronization of system time with an NTP server:
- Make sure the virtual machine has internet access.
If the virtual machine has internet access, go to step b.
If the virtual machine does not have internet access, edit the
/etc/chrony.conffile to replace2.pool.ntp.orgwith the name or IP address of your corporate NTP server. - Start the system time synchronization service:
sudo systemctl enable --now chronyd - Wait a few seconds and run the following command:
sudo timedatectl | grep 'System clock synchronized'If the system time is synchronized correctly, the output will contain "System clock synchronized: yes".
- Make sure the virtual machine has internet access.
Synchronization is configured.
Page top
About the inventory file
You can install, update, or remove KUMA components by changing to the directory with the extracted kuma-ansible-installer and using the Ansible tool and a prepared inventory file. You can specify KUMA configuration settings in the inventory file; the installer then uses these settings when deploying, updating, and removing the application. The inventory file must conform to the YAML format.
You can create an inventory file based on the templates included in the distribution kit. The following templates are provided:
- single.inventory.yml.template can be used when installing KUMA on a single server. This template contains the minimum set of settings optimized for installation on a single device without using a Kubernetes cluster.
- distributed.inventory.yml.template can be used for the initial distributed installation of KUMA without using a Kubernetes cluster, for expanding an all-in-one installation to a distributed installation, and for updating KUMA.
- expand.inventory.yml.template can be used in some reconfiguration scenarios, such as adding collector and correlator servers, expanding an existing storage cluster, or adding a new storage cluster. If you use this inventory file to modify the configuration, the installer does not stop services in the entire infrastructure. If you reuse the inventory file, the installer can stop only services on hosts that are listed in the expand.inventory.yml file.
- k0s.inventory.yml.template can be used to install or migrate KUMA to a Kubernetes cluster.
We recommend saving a backup copy of the inventory file that you used to install the application. You can use it to add components to the system or remove KUMA.
Page top
KUMA settings in the inventory file
The inventory file may include the following blocks:
allkumakuma_k0s
For each host, you must specify the FQDN in the <host name>.<domain> format and, if necessary, an IPv4 or IPv6 address. The KUMA Core domain name and its subdomains may not start with a numeral.
Example: hosts: hostname.example.com: ip: 0.0.0.0 |
The 'all' block
In this block, you can specify the variables that apply to all hosts listed in the inventory file, including the implicitly specified localhost on which the installation is started. Variables can be overridden at the level of host groups or individual hosts.
Example of overriding variables in the inventory file
The table below lists all possible variables in the vars section and their descriptions.
List of possible variables in the 'vars' section
Variable |
Description |
|---|---|
|
Method used to connect to target machines. Possible values:
|
|
User name used to connect to target machines and install components. If root login is blocked on the target machines, choose a user that has the right to establish SSH connections and elevate privileges using su or sudo. |
|
This variable specifies if you want to elevate the privileges of the user that is used to install KUMA components. Possible values:
|
|
Method for elevating the privileges of the user that is used to install KUMA components. You must specify |
|
Path to the private key in the /<path>/.ssh/id_rsa format. You must specify this variable if you want to use a key file other than the default key file (~/.ssh/id_rsa). |
|
This variable specifies whether you want to deploy KUMA components in a Kubernetes cluster. Possible values:
If you do not specify this variable, it defaults to |
|
This variable specifies whether you want to migrate KUMA Core to a new Kubernetes cluster. You need to specify this variable only if Possible values:
If you do not specify this variable, it defaults to |
|
This variable specifies whether the installer must perform the steps to configure the firewall on the hosts. Possible values:
If you do not specify this variable, it defaults to |
|
This variable specifies whether the machines must be registered in the DNS zone of your organization. The installer automatically adds the IP addresses of the machines from the inventory file to the /etc/hosts files on the machines on which KUMA components are installed. The specified IP addresses must be unique. Possible values:
If you do not specify this variable, it defaults to |
|
This variable specifies whether predefined services are created during the installation of KUMA. You need to specify this variable if you want to create demo services independently of the single/distributed/k0s inventory file. Possible values:
If you do not specify this variable, it defaults to |
|
This variable specifies whether KUMA is being installed in an environment with limited computational resources. This variable is not specified in any of the inventory file templates. Possible values:
If you do not specify this variable, it defaults to |
The 'kuma' block
In this block, you can specify the settings of KUMA components deployed outside of the Kubernetes cluster. The kuma block can contain the following sections:
varscontains variables that apply to all hosts specified in thekumablock.childrencontains groups of settings for components:kuma_corecontains settings of the KUMA Core. You can specify only one host and the following MongoDB database log rotation settings for the host:mongo_log_archives_numberis the number of previous logs that you want to keep when rotating the MongoDB database log.mongo_log_file_sizeis the size of the MongoDB database log, in gigabytes, at which rotation begins. If the MongoDB database log never exceeds the specified size, no rotation occurs.mongo_log_frequency_rotationis the interval for checking the size of the MongoDB database log for rotation purposes. Possible values:hourlymeans the size of the MongoDB database log is checked every hour.dailymeans the size of the MongoDB database log is checked every day.weeklymeans the size of the MongoDB database log is checked every week.
The MongoDB database log is stored in the /opt/kaspersky/kuma/mongodb/log directory.
raft_node_addris the FQDN on which you want raft to listen for signals from other nodes. This value must be specified in the <host FQDN>:<port> format. If this setting is not specified explicitly, <host FQDN> defaults to the FQDN of the host on which the KUMA Core is deployed, and <port> defaults to 7209. You can specify an address of your choosing to adapt the KUMA Core to the configuration of your infrastructure.
kuma_collectorcontains settings of KUMA collectors. You can specify multiple hosts.kuma_correlatorcontains settings of KUMA correlators. You can specify multiple hosts.kuma_storagecontains settings of KUMA storage nodes. You can specify multiple hosts as well as shard, replica, and keeper IDs for hosts using the following settings:shardis the shard ID.replicais the replica ID.keeperis the keeper ID.
The specified shard, replica, and keeper IDs are used only if you are deploying demo services as part of a fresh KUMA installation. In other cases, the shard, replica, and keeper IDs that you specified in the KUMA web interface when creating a resource set for the storage are used.
The 'kuma_k0s' block
In this block, you can specify the settings of the Kubernetes cluster that ensures high availability of KUMA. This block is specified only in an inventory file based on k0s.inventory.yml.template.
For test and demo installations in environments with limited computational resources, you must also set low_resources: true in the all block. In this case, the minimum size of the KUMA Core installation directory is reduced to 4 GB and the limitations of other computational resources are ignored.
For each host in the kuma_k0s block, a unique FQDN and IP address must be specified in the ansible_host variable, except for the host in the kuma_lb section. For the host in the kuma_lb section, only the FQDN must be specified. Hosts must be unique within a group.
For a demo installation, you may combine a controller with a worker node. Such a configuration does not provide high availability of the KUMA Core and is only intended for demonstrating the functionality or for testing the software environment.
The minimal configuration that ensures high availability is 3 controllers, 2 worker nodes, and 1 nginx load balancer. In production, we recommend using dedicated worker nodes and controllers. If a cluster controller is under workload and the pod with the KUMA Core is hosted on the controller, if the controller goes down, access to the KUMA Core will be completely lost.
The kuma_k0s block can contain the following sections:
varscontains variables that apply to all hosts specified in thekumablock.сhildrencontains settings of the Kubernetes cluster that provides high availability of KUMA.
The following table lists possible variables in the vars section and their descriptions.
List of possible variables in the vars section
Group of variables |
Description |
|
|---|---|---|
|
FQDN of the load balancer. You can install the nginx load balancer or a third-party TCP load balancer. If you are installing the nginx load balancer, you can set If you are installing a third-party TCP load balancer, you must manually configure it before installing KUMA. |
|
|
The host that acts as the primary controller of the cluster. |
Groups for specifying the primary controller. You only need to specify a host for one group. |
|
A host that combines the role of the primary controller and a worker node of the cluster. For each cluster controller that is combined with a worker node, in the inventory file, you must specify |
|
|
Hosts that act as controllers in the cluster. |
Groups for specifying secondary controllers. |
|
Hosts that combine the roles of controller and worker node in the cluster. For each cluster controller that is combined with a worker node, in the inventory file, you must specify |
|
|
Worker nodes of the cluster. For each cluster controller that is combined with a worker node, in the inventory file, you must specify |
|
|
If multiple network interfaces are being used on the worker nodes of the cluster at the same time, the For example, if you want to use only network interfaces named ethN (where N is the number of the network interface) for communication between worker nodes of the cluster, you can specify the variable as follows:
This makes the cluster use a network interface with a name that matches the If the network interface name on each worker node is the same, for example eth0, you can specify the variable without a mask:
For more information, please refer to the Calico Open Source documentation. |
|
Installation on a single server
To install KUMA components on a single server, complete the following steps:
- Ensure that hardware, software, and installation requirements for KUMA are met.
- Prepare the single.inventory.yml inventory file.
Use the single.yml.template inventory file template from the distribution kit to create a single.inventory.yml inventory file and describe the network structure of application components in that file. The installer uses the single.inventory.yml file to deploy KUMA.
- Install the application.
Install the application and log in to the web interface using the default credentials.
If necessary, you can move application components to different servers to continue with a distributed configuration.
Preparing the single.inventory.yml inventory file
KUMA components can be installed, updated, and removed in the directory containing the extracted installer by using the Ansible tool and the user-created YML inventory file containing a list of the hosts of KUMA components and other settings. If you want to install all KUMA components on the same server, you must specify the same host for all components in the inventory file.
To create an inventory file for installation on a single server:
- Copy the archive with the
kuma-ansible-installer-<version>.tar.gzinstaller to the server and extract it using the following command (about 2 GB of disk space is required):sudo tar -xpf kuma-ansible-installer-<version name>.tar.gz - Go to the KUMA installer directory by executing the following command:
cd kuma-ansible-installer - Copy the single.inventory.yml.template and create an inventory file named single.inventory.yml:
cp single.inventory.yml.template single.inventory.yml - Edit the settings in the single.inventory.yml inventory file.
If you want predefined services to be created during the installation, set deploy_example_services to true.
deploy_example_services: trueThe predefined services will appear only as a result of the initial installation of KUMA. If you are upgrading the system using the same inventory file, the predefined services are not re-created.
- Replace all
kuma.example.comstrings in the inventory file with the name of the host on which you want to install KUMA components.
The inventory file is created. Now you can use it to install KUMA on a single server.
We recommend backing up the inventory file that you used to install the program. You can use it to add components to the system or remove KUMA.
Example inventory file for installation on a single server
Page top
Installing the program on a single server
You can install all KUMA components on a single server using the Ansible tool and the single.inventory.yml inventory file.
To install Kuma on a single server:
- Download the kuma-ansible-installer-<
build number>.tar.gz KUMA distribution kit to the server and extract it. The archive is extracted into the kuma-ansibleinstaller directory. - Go to the directory with the extracted installer.
- Depending on the type of license activation that you are planning to use, do one of the following:
- If you want to activate your license with a file, place the file with the license key in <installer directory>/roles/kuma/files/.
The key file must be named license.key.
sudo cp <key file>.key <installer directory>/roles/kuma/files/license.key - If you want to activate with a license code, go to the next step of the instructions.
Activation using a license code is available starting with KUMA 3.4. For earlier versions of KUMA, you must activate the license with a file.
- If you want to activate your license with a file, place the file with the license key in <installer directory>/roles/kuma/files/.
- Run the following command to start the component installation with your prepared single.inventory.yml inventory file:
sudo ./install.sh single.inventory.yml - Accept the terms of the End User License Agreement.
If you do not accept the terms and conditions of the End User License Agreement, the application cannot be installed.
Depending on the type of license activation, running the installer has one of the following results:
- If you want to activate the license using a file and have placed the file with the license key in "<installer directory>/roles/kuma/files/", running the installer with the "single.inventory.yml" inventory file installs KUMA Core, all services specified in the inventory file, and OOTB resources. If example_services=true is set in the inventory, demo services are installed.
- If you want to activate with a license code or provide a license file later, running the installer with the "single.inventory.yml" inventory file installs only KUMA Core.
To install the services, specify the license code on the command line. Then run the postinstall.sh installer with the "single.inventory.yml" inventory file.
sudo ./postinstall.sh single.inventory.ymlThis creates the specified services. You can select the resources that you want to import from the repository.
- After the installation is complete, log in to the KUMA web interface and enter the address of the KUMA web interface in the address bar of your browser, then enter your credentials on the login page.
The address of the KUMA web interface is
https://<FQDN of the host where KUMA is installed>:7220.Default login credentials:
- login:admin
- password:mustB3Ch@ng3d!After logging in for the first time, change the password of the admin account
All KUMA components are installed and you are logged in to the web interface.
We recommend saving a backup copy of the inventory file that you used to install the application. You can use this inventory file to add components to the system or remove KUMA.
You can expand the installation to a distributed installation.
Page top
Distributed installation
The distributed installation of KUMA involves multiple steps:
- Verifying that the hardware, software, and installation requirements for KUMA are satisfied.
- Preparing the control machine.
The control machine is used during the application installation process to extract and run the installer files.
- Preparing the target machines.
The application components are installed on the target machines.
- Preparing the distributed.inventory.yml inventory file.
Create an inventory file with a description of the network structure of application components. The installer uses this inventory file to deploy KUMA.
- Installing the application.
Install the application and log in to the web interface.
- Creating services.
Create the client part of the services in the KUMA web interface and install the server part of the services on the target machines.
Make sure the KUMA installation is complete before you install KUMA services. We recommend installing services in the following order: storage, collectors, correlators, agents.
When deploying several KUMA services on the same host, during installation, you must specify unique ports for each service using the
--api.port <port>parameter.
If necessary, you can change the KUMA web console certificate to your company's certificate.
Preparing the test machine
To prepare the control machine for installing KUMA:
- Ensure that hardware, software, and installation requirements of the application are met.
- Generate an SSH key for authentication on the SSH servers of the target machines:
sudo ssh-keygen -f /root/.ssh/id_rsa -N "" -C kuma-ansible-installerIf SSH root access is blocked on the control machine, generate an SSH key for authentication on the SSH servers of the target machines for a user from the sudo group:
ssh-keygen -f /home/<name of the user from the sudo group>/.ssh/id_rsa -N "" -C kuma-ansible-installerAs a result, the key is generated and saved in the user's home directory. To make the key available during installation, you must specify the full path to the key in the inventory file, in the ansible_ssh_private_key_file setting.
- Make sure that the control machine has network access to all the target machines by host name and copy the SSH key to each target machine:
sudo ssh-copy-id -i /root/.ssh/id_rsa root@<host name of the control machine>If SSH root access is blocked on the control machine and you want to use the SSH key from the home directory of the user from the sudo group, make sure that the control machine has network access to all target machines by host name and copy the SSH key to each target machine:
ssh-copy-id -i /home/<name of the user in the sudo group>/.ssh/id_rsa <name of the user in the sudo group>@<host name of the control machine> - Copy the installer archive
kuma-ansible-installer-<version>.tar.gzto the control machine and extract it using the following command (approximately 2 GB of disk space is required):sudo tar -xpf kuma-ansible-installer-<version>.tar.gz
The control machine is prepared for installing KUMA.
Page top
Preparing the target machine
To prepare the target machine for the installation of KUMA components:
- Ensure that hardware, software, and installation requirements are met.
- Specify the host name. We recommend specifying a FQDN. For example, kuma1.example.com.
Do not change the KUMA host name after installation: this will make it impossible to verify the authenticity of certificates and will disrupt the network communication between the application components.
- Register the target machine in your organization's DNS zone to allow host names to be resolved to IP addresses.
If your organization does not use a DNS server, you can use the /etc/hosts file for name resolution. The content of the files can be automatically generated for each target machine when installing KUMA.
- To get the hostname that you must specify when installing KUMA, run the following command and record the result:
hostname -fThe control machine must be able to access the target machine using this name.
The target machine is ready for the installation of KUMA components.
Page top
Preparing the distributed.inventory.yml inventory file
To create the distributed.inventory.yml inventory file:
- Go to the KUMA installer folder by executing the following command:
cd kuma-ansible-installer - Create an inventory file named distributed.inventory.yml by copying distributed.inventory.yml.template:
cp distributed.inventory.yml.template distributed.inventory.yml - Edit the settings in the distributed.inventory.yml.
We recommend backing up the inventory file that you used to install the program. You can use it to add components to the system or remove KUMA.
Example inventory file for distributed installation
Page top
Installing the program in a distributed configuration
KUMA is installed using the Ansible tool and a YML inventory file. The installation is performed from the control machine, and all of the KUMA components are installed on target machines.
To install KUMA:
- On the control machine, go to the directory containing the extracted installer.
cd kuma-ansible-installer - Depending on the type of license activation that you plan to use, do one of the following:
- If you want to activate your license with a file, place the file with the license key in <installer directory>/roles/kuma/files/.
The key file must be named license.key.
sudo cp <key file>.key <installer directory>/roles/kuma/files/license.key - If you want to activate with a license code, go to the next step of these instructions.
- If you want to activate your license with a file, place the file with the license key in <installer directory>/roles/kuma/files/.
- From the directory with the extracted installer, start the installation of components using the prepared inventory file, distributed.inventory.yml:
sudo ./install.sh distributed.inventory.yml - Accept the terms and conditions of the End User License Agreement.
If you do not accept the terms and conditions of the End User License Agreement, the application cannot be installed.
Depending on the type of license activation, the installer produces one of the following results:
- If you want to activate the license using a file and have placed the file with the license key in "<installer directory>/roles/kuma/files/", running the installer with the "distributed.inventory.yml" inventory file installs KUMA Core, all services specified in the inventory file, and OOTB resources.
- If you want to activate with a license code or provide a license file later, running the installer with the "distributed.inventory.yml" inventory file installs only KUMA Core.
To install the services, specify the license code on the command line. Then run the postinstall.sh installer with the "distrtibuter.inventory.yml" inventory file.
sudo ./postinstall.sh distributed.inventory.ymlThis creates the specified services. You can select the resources that you want to import from the repository.
- After the installation is complete, log in to the KUMA web interface and enter the address of the KUMA web interface in the address bar of your browser, then enter your credentials on the login page.
The address of the KUMA web interface is
https://<FQDN of the host where KUMA is installed>:7220.Default login credentials:
- login:admin
- password:mustB3Ch@ng3d!After logging in for the first time, change the password of the admin account
All KUMA components are installed and you are logged in to the web interface.
We recommend saving a backup copy of the inventory file that you used to install the application. You can use this inventory file to add components to the system or remove KUMA.
Page top
Distributed installation in a high availability configuration
The high availability configuration of KUMA involves deploying the KUMA Core on a Kubernetes cluster and using an external TCP traffic balancer.
To create a high availability KUMA installation, use the kuma-ansible-installer-ha-<build number>.tar.gz installer and prepare the k0s.inventory.yml inventory file by specifying the configuration of your cluster. For a new installation in a high availability configuration, OOTB resources are always imported. You can also perform an installation with deployment of demo services. To do this, set "deploy_example_services: true" in the inventory file.
You can deploy KUMA Core on a Kubernetes cluster in the following ways:
- Install KUMA on a Kubernetes cluster from scratch.
- Migrate the Core of an existing KUMA installation to a Kubernetes cluster.
Minimum configuration
Kubernetes has 2 node roles:
- Controllers (control-plane). Nodes with this role manage the cluster, store metadata, and balance the workload.
- Workers (worker). Nodes with this role bear the workload by hosting KUMA processes.
To deploy KUMA in a high availability configuration, you need:
- 3 dedicated controllers
- 2 worker nodes
- 1 TCP balancer
You must not use the balancer as the control machine for running the KUMA installer.
To ensure the adequate performance of the KUMA Core in Kubernetes, you must allocate 3 dedicated nodes that have only the controller role. This will provide high availability for the Kubernetes cluster itself and will ensure that the workload (KUMA processes and other processes) cannot affect the tasks involved in managing the Kubernetes cluster. If you are using virtualization tools, make sure that the nodes are hosted on different physical servers and that these physical servers are not being used as worker nodes.
For a demo installation of KUMA, you may combine the controller and worker roles. However, if you are expanding an installation to a distributed installation, you must reinstall the entire Kubernetes cluster and allocate 3 dedicated nodes with the controller role and at least 2 nodes with the worker role. KUMA cannot be upgraded to later versions if any of the nodes combine the controller and worker roles.
Additional requirements for deploying KUMA Core in Kubernetes
If you plan to protect KUMA's network infrastructure using Kaspersky Endpoint Security for Linux, first install KUMA in the Kubernetes cluster and only then deploy Kaspersky Endpoint Security for Linux. When updating or removing KUMA, you must first stop Kaspersky Endpoint Security for Linux using the following command:
systemctl stop kesl
When you install KUMA in a high availability configuration, the following requirements must be met:
- General application installation requirements.
- The hosts that you plan to use for Kubernetes cluster nodes must not use IP addresses from the following Kubernetes ranges:
- serviceCIDR: 10.96.0.0/12
- podCIDR: 10.244.0.0/16
Traffic to proxy servers must excluded for the IP addresses from these ranges.
- Each host must have a unique ID (/etc/machine-id).
- The firewalld or uwf firewall management tool must be installed and enabled on the hosts for adding rules to iptables.
- The nginx load balancer must be installed and configured (for details, please refer to the nginx load balancer documentation). You can install the nginx load balancer using one of the following commands:
sudo yum install nginx(for Oracle Linux)sudo apt install nginx-full(for Astra Linux)sudo apt install nginx libnginx-mod-stream(for Ubuntu)sudo yum install nginx nginx-all-modules(for RED OS)
If you want the nginx load balancer to be configured automatically during the KUMA installation, install the nginx load balancer and allow SSH access to it in the same way as for the Kubernetes cluster hosts.
- An access key from the device on which KUMA is installed must be added to the nginx load balancer server.
- On the nginx load balancer server, the SELinux module must be disabled in the operating system.
- The tar, systemctl packages are installed on the hosts.
During KUMA installation, the hosts are automatically checked to see if they meet the following hardware requirements:
- CPU cores (threads): 12 or more
- RAM: 22,528 MB or more
- Free disk space in the /opt partition: 1000 GB or more.
- For an installation from scratch, the /var/lib partition must have at least 32 GB of free space. If the cluster already has been installed on this node, the size of the required free space is reduced by the size of the /var/lib/k0s directory.
If these conditions are not satisfied, the installation is aborted. For a demo installation, you can disable the check of these conditions by setting low_resources: true in the inventory file.
Additional requirements when installing on Astra Linux or Ubuntu operating systems.
- Installing KUMA in a high availability configuration is supported for Astra Linux Special Edition RUSB.10015-01 (2022-1011SE17MD, update 1.7.2.UU.1). Kernel version 5.15.0.33 or later is required.
- The following packages must be installed on the machines intended for deploying a Kubernetes cluster:
- open-iscsi
- wireguard
- wireguard-tools
To install the packages, run the following command:
sudo apt install open-iscsi wireguard wireguard-tools
Additional requirements when installing on the Oracle Linux, RED OS, or Red Hat Enterprise Linux operating systems
The following packages must be installed on the machines intended for deploying the Kubernetes cluster:
- iscsi-initiator-utils
- wireguard-tools
Before installing the packages on Oracle Linux, you must add the EPEL repository as a source of packages using one of the following commands:
sudo yum install oracle-epel-release-el8(for Oracle Linux 8)sudo yum install oracle-epel-release-el9(for Oracle Linux 9)
To install the packages, run the following command:
sudo yum install iscsi-initiator-utils wireguard-tools
Installing KUMA on a Kubernetes cluster from scratch
The distributed installation of KUMA involves several steps:
- Verifying that the hardware, software, and installation requirements for KUMA are satisfied.
- Preparing the control machine.
The control machine is used during the application installation process to extract and run the installer files.
- Preparing the target machines.
The program components are installed on the target machines.
- Preparing the k0s.inventory.yml inventory file.
Create an inventory file with a description of the network structure of program components. The installer uses this inventory file to deploy KUMA.
- Installing the program.
Install the application and log in to the web interface.
- Creating services.
Create the client part of the services in the KUMA web interface and install the server part of the services on the target machines.
Make sure the KUMA installation is complete before you install KUMA services. We recommend installing services in the following order: storage, collectors, correlators, agents.
When deploying several KUMA services on the same host, during installation, you must specify unique ports for each service using the
--api.port <port>parameter.
If necessary, you can change the certificate of KUMA web console to use your company's certificate.
Page top
Preparing the test machine
To prepare the control machine for installing KUMA:
- Ensure that hardware, software, and installation requirements of the application are met.
- Generate an SSH key for authentication on the SSH servers of the target machines:
sudo ssh-keygen -f /root/.ssh/id_rsa -N "" -C kuma-ansible-installerIf SSH root access is blocked on the control machine, generate an SSH key for authentication on the SSH servers of the target machines for a user from the sudo group:
ssh-keygen -f /home/<name of the user from the sudo group>/.ssh/id_rsa -N "" -C kuma-ansible-installerAs a result, the key is generated and saved in the user's home directory. To make the key available during installation, you must specify the full path to the key in the inventory file, in the ansible_ssh_private_key_file setting.
- Make sure that the control machine has network access to all the target machines by host name and copy the SSH key to each target machine:
sudo ssh-copy-id -i /root/.ssh/id_rsa root@<host name of the control machine>If SSH root access is blocked on the control machine and you want to use the SSH key from the home directory of the user from the sudo group, make sure that the control machine has network access to all target machines by host name and copy the SSH key to each target machine:
ssh-copy-id -i /home/<name of the user in the sudo group>/.ssh/id_rsa <name of the user in the sudo group>@<host name of the test machine> - Copy the
kuma-ansible-installer-ha-<version number> .tar.gzinstaller archive to the control machine and extract it using the following command:sudo tar -xpf kuma-ansible-installer-ha-<version number>.tar.gz
The test machine is ready for the KUMA installation.
Page top
Preparing the target machine
To prepare the target machine for the installation of KUMA components:
- Ensure that hardware, software, and installation requirements are met.
- Specify the host name. We recommend specifying a FQDN. For example, kuma1.example.com.
Do not change the KUMA host name after installation: this will make it impossible to verify the authenticity of certificates and will disrupt the network communication between the application components.
- Register the target machine in your organization's DNS zone to allow host names to be translated to IP addresses.
The option of using the /etc/hosts file is not available when the Core is deployed in Kubernetes.
- To get the hostname that you must specify when installing KUMA, run the following command and record the result:
hostname -fThe control machine must be able to access the target machine using this name.
The target machine is ready for the installation of KUMA components.
Page top
Preparing the k0s.inventory.yml inventory file
To create the k0s.inventory.yml inventory file:
- Go to the KUMA installer folder by executing the following command:
cd kuma-ansible-installer-ha - Copy the k0s.inventory.yml.template file to create the expand.inventory.yml inventory file:
cp k0s.inventory.yml.template k0s.inventory.yml - Edit the inventory file settings in k0s.inventory.yml.
For such a configuration, specify the parameters as follows: need_transfer: false, deploy_example_services: false; in the kuma_storage section, list the servers for the storage cluster. After the installation is complete, you can use the KUMA web interface to assign the shard, replica and keeper roles to the servers specified in the inventory.
The kuma_core, kuma_collector, kuma_correlator, kuma_storage sections of your k0s.inventory.yml inventory file must contain the same hosts that were used in the distributed.inventory.yml file when KUMA was upgraded from version 2.1.3 to version 3.0.3 and then to version 3.2, or when a new installation was performed. In the k0s.inventory.yml inventory file, set deploy_to_k8s: true, need_transfer: true, deploy_example_services: false.
We recommend backing up the inventory file that you used to install the program. You can use it to add components to the system or remove KUMA.
Page top
Installing the program in a high availability configuration
KUMA is installed using the Ansible tool and the k0s.inventory.yml inventory file. The installation is performed from the control machine, and all of the KUMA components are installed on target machines.
To install KUMA:
- On the control machine, go to the directory containing the extracted installer.
cd kuma-ansible-installer-ha - Depending on the type of license activation that you are planning to use, do one of the following:
- If you want to activate your license with a file, place the file with the license key in <installer directory>/roles/kuma/files/.
The key file must be named license.key.
sudo cp <key file>.key <installer directory>/roles/kuma/files/license.key - If you want to activate with a license code, go to the next step of these instructions.
- If you want to activate your license with a file, place the file with the license key in <installer directory>/roles/kuma/files/.
- From the folder with the unpacked installer, start the installation of components using the prepared distributed.inventory.yml inventory file:
sudo ./install.sh k0s.inventory.yml - Accept the terms of the End User License Agreement.
If you do not accept the terms and conditions of the End User License Agreement, the application cannot be installed.
Depending on the type of license activation, running the installer has one of the following results:
- If you want to activate the license using a file and have placed the file with the license key in "<installer directory>/roles/kuma/files/", running the installer with the "k0s.inventory.yml" inventory file installs KUMA Core, all services specified in the inventory file, and OOTB resources.
- If you want to activate with a license code or provide a license file later, running the installer with the "k0s.inventory.yml" inventory file installs only KUMA Core.
To install the services, specify the license code on the command line. Then run the postinstall.sh installer with the "k0s.inventory.yml" inventory file.
sudo ./postinstall.sh k0s.inventory.ymlThis creates the specified services. You can select the resources that you want to import from the repository.
- After the installation is complete, log in to the KUMA web interface and enter the address of the KUMA web interface in the address bar of your browser, then enter your credentials on the login page.
The address of the KUMA web interface is
https://<FQDN of the nginx load balancer>:7220.Default login credentials:
- login –admin
- password –mustB3Ch@ng3d!After logging in for the first time, change the password of the admin account
All KUMA components are installed and you are logged in to the web interface.
We recommend saving a backup copy of the inventory file that you used to install the application. You can use this inventory file to add components to the system or remove KUMA.
Page top
Migrating the KUMA Core to a new Kubernetes cluster
To migrate KUMA Core to a new Kubernetes cluster:
- Prepare the k0s.inventory.yml inventory file.
The kuma_core, kuma_ collector, kuma_correlator, kuma_storage sections of your k0s.inventory.yml inventory file must contain the same hosts that were used when KUMA was upgraded from version 2.1.3 to version 3.0.3 and then to version 3.2, or when a new installation was performed. In the inventory file, set deploy_to_k8s: true, need_transfer: true. Set deploy_example_services: false.
- Follow the steps for distributed installation using your prepared k0s.inventory.yml inventory file.
Migrating the KUMA Core to a new Kubernetes cluster
When the installer is started with an inventory file, the installer looks for an installed KUMA Core on all hosts where you plan to deploy worker nodes of the cluster. If a Core is found, it is moved from its host to the newly created Kubernetes cluster.
Resolving the KUMA Core migration error
If the component is not detected on the worker nodes, a clean installation of the KUMA Core is performed in the cluster without migrating resources to it. Existing components must be manually recreated with the new Core in the KUMA web interface.
For collectors, correlators and storages from the inventory file, certificates for communication with the Core inside the cluster will be reissued. This does not change the URL of the Core for components.
On the Core host, the installer does the following:
- Removes the following systemd services from the host: kuma-core, kuma-mongodb, kuma-victoria-metrics, kuma-vmalert, and kuma-grafana.
- Deletes the internal certificate of the Core.
- Deletes the certificate files of all other components and deletes their records from MongoDB.
- Deletes the following directories:
- /opt/kaspersky/kuma/core/bin
- /opt/kaspersky/kuma/core/certificates
- /opt/kaspersky/kuma/core/log
- /opt/kaspersky/kuma/core/logs
- /opt/kaspersky/kuma/grafana/bin
- /opt/kaspersky/kuma/mongodb/bin
- /opt/kaspersky/kuma/mongodb/log
- /opt/kaspersky/kuma/victoria-metrics/bin
- Migrates data from the Core and its dependencies to a network drive within the Kubernetes cluster.
- On the Core host, it moves the following directories:
- /opt/kaspersky/kuma/core → /opt/kaspersky/kuma/core.moved
- /opt/kaspersky/kuma/grafana → /opt/kaspersky/kuma/grafana.moved
- /opt/kaspersky/kuma/mongodb → /opt/kaspersky/kuma/mongodb.moved
- /opt/kaspersky/kuma/victoria-metrics → /opt/kaspersky/kuma/victoria-metrics.moved
After you have verified that the Core was correctly migrated to the cluster, you can delete these directories.
If you encounter problems with the migration, check the logs for records of the 'core-transfer' migration task in the 'kuma' namespace in the cluster (this task is available for 1 hour after the migration).
If you need to perform migration again, you must restore the original names of the /opt/kaspersky/kuma/*.moved directories.
If the /etc/hosts file on the Core host contained lines that were not related to addresses in the 127.X.X.X range, the contents of the /etc/hosts file from the Core host is entered into the coredns ConfigMap when the Core is migrated to the Kubernetes cluster. If the Core is not migrated, the contents of the /etc/hosts file from the host where the primary controller is deployed is entered into the ConfigMap.
KUMA Core availability under various scenarios
KUMA Core availability in various scenarios:
- The worker node on which the KUMA Core service is deployed fails or loses network connectivity.
Access to the KUMA web interface is lost. After 6 minutes, Kubernetes initiates the migration of the Core bucket to an operational node of the cluster. After the deployment, which takes less than one minute, is completed, the KUMA web interface becomes available again at URLs based on the FQDN of the load balancer. To find out which host is hosting the Core now, run the following command in the terminal of one of the controllers:
k0s kubectl get pod -n kuma -o wideWhen the failed worker node recovers or its network connectivity is restored, the Core bucket remains on its current worker node and is not migrated back to the recovered node. The recovered node can participate in the replication of the Core service's disk volume.
- A worker node that contains a replica of the KUMA Core disk, and which is not hosting the Core service at the moment, fails or loses network connectivity.
The KUMA web interface remains available at URLs based on the FQDN of the load balancer. The network storage creates a replica of the currently operational Core disk volume on other healthy nodes. There is also no disruption of access to KUMA at URLs based on the FQDNs of currently operational nodes.
- One or more cluster controllers become unavailable, but quorum is maintained.
Worker nodes work normally. Access to KUMA is not disrupted. A failure of cluster controllers extensive enough to break quorum leads to the loss of control over the cluster.
How many machines are needed for high availability
Number of controllers when installing the cluster
Minimum number (quorum) of controllers to keep the cluster operational
How many controllers may fail without breaking quorum
1
1
0
2
2
0
3
2
1
4
3
1
5
3
2
6
4
2
7
4
3
8
5
3
9
5
4
- All controllers of the Kubernetes cluster fail simultaneously.
Control of the cluster is lost, and the cluster is not operational.
- Simultaneous loss of availability of all worker nodes of a cluster with replicas of the Core volume and the Core pod.
Access to the KUMA web interface is lost. If all replicas are lost, information loss occurs.
Managing Kubernetes and accessing KUMA
When installing KUMA in a high availability configuration, a file named ./artifacts/k0s-kubeconfig.yml is created in the installer directory. This file contains the details required for connecting to the created Kubernetes cluster. An identical file is created on the main controller in the home directory of the user specified as the ansible_user in the inventory file.
To ensure that the Kubernetes cluster can be monitored and managed, the k0s-kubeconfig.yml file must be saved in a location accessible by the cluster administrators. Access to the file must be restricted.
Managing the Kubernetes cluster
To monitor and manage the cluster, you can use the k0s application that is installed on all cluster nodes during KUMA deployment. For example, you can use the following command to view the load on worker nodes:
k0s kubectl top nodes
Access to the KUMA Core
The URL of the KUMA Core is https://<worker node FQDN>:<worker node port>. Available ports: 7209, 7210, 7220, 7222, 7223. Port 7220 is the default port for connecting to the KUMA Core web interface. Any worker node whose extra_args parameter contains the value kaspersky.com/kuma-ingress=true can be used as an access point.
It is not possible to log in to the KUMA web interface on multiple worker nodes simultaneously using the same credentials. Only the most recently established connection remains active.
If you are using an external load balancer in the configuration of the high availability Kubernetes cluster, you must use the FQDN of the load balancer for access to KUMA Core ports.
Page top
Time zone in a Kubernetes cluster
The time zone within the Kubernetes cluster is always UTC+0, so the following time difference must be taken into account when dealing with data created by a high-availability KUMA Core:
- In audit events, the time zone in the
DeviceTimeZonefield is UTC+0. - In generated reports, the difference between the report generation time and the browser's time will be displayed.
- In the dashboard, the user will find the difference between the time in the widget (the time of the user's browser is displayed) and the time in the exported widget data in the CSV file (the time of the Kubernetes cluster is displayed).
KUMA backup
KUMA allows you to back up the KUMA Core database and certificates. The backup functionality is intended for restoring KUMA. To move or copy resources, use the resource export and import functionality.
You can perform backup using the REST API.
Special considerations for KUMA backup
- Data can only be restored from a backup copy created in the same version of KUMA.
- Backing up collectors is not necessary, except collectors with an SQL connection. When restoring such collectors, you must revert the initial ID to the original value.
- If the MongoDB service does not start, we recommend resetting the 'kuma' database in MongoDB. If the server that hosts the database loses power, the integrity of the database may be compromised. In such a case, you can reset the database and restore the data from the backup.
How to reset a database in MongoDB when the mongodb service is working
How to reset a database in MongoDB when the mongodb service is down
Modifying the configuration of KUMA
The KUMA configuration can be modified in the following ways.
- Expanding an all-in-one installation to a distributed installation.
- Adding servers for collectors to a distributed installation.
- Adding servers for correlators to a distributed installation.
- Adding servers to an existing storage cluster.
- Adding another storage cluster.
- Removing servers from a distributed installation.
- Removing a storage cluster from a distributed installation.
- Migrating the KUMA Core to a new Kubernetes cluster.
Updating previous versions of KUMA
The upgrade procedure is the same for all hosts and involves using the installer and inventory file.
Version upgrade scheme:
2.0.х → 2.1.3 → 3.0.3 → 3.2.x → 3.4
2.1.х → 2.1.3 → 3.0.3 → 3.2.x → 3.4
2.1.3 → 3.0.3 → 3.2.x → 3.4
3.0.x → 3.0.3 → 3.2.x → 3.4
Upgrading from version 2.0.x to 2.1.3
Upgrading from version 2.1.x to 2.1.3
Upgrading from version 2.1.3 to 3.0.3
Upgrading from version 3.0.x to 3.0.3
Upgrading from version 3.0.3 to 3.2.x
Upgrading from version 3.2.0 or 3.2.1 to 3.4
If you want to upgrade a distributed installation of KUMA to the latest version of KUMA in a fault tolerant configuration, first upgrade your distributed installation to the latest version and then migrate KUMA Core to a Kubernetes cluster. For further updates, use the k0s.inventory.yml inventory file with the need_transfer parameter set to false, because the KUMA Core already has been migrated to the Kubernetes cluster and you do not need to repeat this.
Page top
Troubleshooting update errors
When upgrading KUMA, you may encounter the following errors:
- Timeout error
- Invalid administrator password
- DB::Exception error
- Expiration of k0s cluster certificates
Fix the errors to successfully complete the update.
Page top
Delete KUMA
To remove KUMA, use the Ansible tool and the inventory file that you have prepared.
To remove KUMA:
- On the control machine, go to the installer directory:
cd kuma-ansible-installer - Run the following command:
sudo ./uninstall.sh <inventory file>
KUMA and all of its data is removed from the server.
The databases that were used by KUMA (for example, the ClickHouse storage database) and the data therein must be deleted separately.
Special considerations for removing KUMA in a high availability configuration
Which components need to be removed depends on the value of the deploy_to_k8s parameter in the inventory file that you are using to remove KUMA:
- If the setting is
true, the Kubernetes cluster created during the KUMA installation is deleted. - If the setting is
false, all KUMA components except for the Core are removed from the Kubernetes cluster. The cluster itself is not deleted.
In addition to the KUMA components installed outside the cluster, the following directories and files are deleted on the cluster nodes:
- /usr/bin/k0s
- /etc/k0s/
- /var/lib/k0s/
- /usr/libexec/k0s/
- ~/k0s/ (for the ansible_user)
- /opt/longhorn/
- /opt/cni/
- /opt/containerd
While the cluster is being deleted, error messages may be displayed; however, this does not abort the installer.
- You can ignore such messages for the Delete KUMA transfer job and Delete KUMA pod tasks.
- For the Reset k0s task (if an error message contains the following text: "
To ensure a full reset, a node reboot is recommended.") and the Delete k0s Directories and files task (if an error message contains the following text: "I/O error: '/var/lib/k0s/kubelet/plugins/kubernetes.io/csi/driver.longhorn.io/"), we recommend restarting the relevant host and trying to remove KUMA again with the same inventory file.
After removing KUMA, restart the hosts on which the KUMA components or Kubernetes were installed.
Page top
Working with tenants
Access to tenants is regulated in the settings of users. The general administrator has access to the data of all tenants. Only a user with this role can create and delete tenants.
Tenants are displayed in the table under Settings → Tenants in the KUMA web interface. You can sort the table by clicking on columns.
Available columns:
- Name—tenant name. The table can be filtered by this column.
- EPS limit—quota size for EPS (events processed per second) allocated to the tenant out of the overall EPS quota determined by the license.
- Description—description of the tenant.
- Disabled—indicates that the tenant is inactive.
By default, inactive tenants are not displayed in the table. You can view them by selecting the Show disabled check box.
- Created—tenant creation date.
To create a tenant:
- In the KUMA web interface under Settings → Tenants, click Add.
The Add tenant window opens.
- Specify the tenant name in the Name field. The name must contain 1 to 128 Unicode characters.
- In the EPS limit field, specify the EPS quota for the tenant. The cumulative EPS of all tenants cannot exceed the EPS of the license.
- If necessary, add a Description of the tenant. The description can contain no more than 256 Unicode characters.
- Click Save.
The tenant is added. Press F5 to refresh the page. After refreshing the page, the created tenant is displayed in the web interface.
To delete a tenant:
- In the Settings → Tenants section of the KUMA web interface, select the relevant tenant by selecting the check box next to it, then select Delete in the toolbar.
- This opens the Delete tenant window, which displays information about the tenant and prompts you to enter a code and confirm the deletion of the tenant. If you want to proceed with deleting the tenant, enter the code.
- Click OK.
The tenant is deleted.
When a tenant is deleted, its services are automatically stopped, except the agents; events are no longer received or processed for the tenant; and the EPS of the tenant is no longer counted towards the cumulative EPS of the license. You can stop the Windows agent services manually in the Start → Services section, and to stop the Linux agent services, you can press Ctrl+C in the terminal in which the agent was started.
Selecting a tenant
If you have access to multiple tenants, KUMA lets you select which tenants' data will be displayed in the KUMA web interface.
To select a tenant for displaying data:
- In the KUMA web interface, click Selected tenants.
The tenant selection area opens.
- Select the check boxes next to the tenants whose data you want to see in sections of the KUMA web interface.
- You must select at least one tenant. You can use the Search field to search for tenants.
- Click the tenant selection area by clicking Selected tenants.
Sections of the KUMA web interface will display only the data and analytics related to the selected tenants.
Your selection of tenants for data display will determine which tenants can be specified when creating resources, services, layouts, report templates, widgets, incidents, assets, and other KUMA settings that let you select a tenant.
Page top
Tenant affiliation rules
Tenant inheritance rules
It is important to track which tenant owns specific objects created in KUMA because this determines who will have access to the objects and whether or not interaction with specific objects can be configured. Tenant identification rules:
- The tenant of an object (such as a service or resource) is determined by the user when the object is created.
After the object is created, the tenant selected for that object cannot be changed. However, resources can be exported then imported into another tenant.
- The tenant of an alert and correlation event is inherited from the correlator that created them.
The tenant name is indicated in the
TenantIdevent field. - If events of different tenants that are processed by the same correlator are not merged, the correlation events created by the correlator inherit the tenant of the event.
- The incident tenant is inherited from the alert.
Examples of multitenant interactions
Multitenancy in KUMA provides the capability to centrally investigate alerts and incidents that occur in different tenants. Below are some examples that illustrate which tenants own certain objects that are created.
When correlating events from different tenants in a common stream, you should not group events by tenant. In other words, the TenantId event field should not be specified in the Identical fields field in correlation rules. Events must be grouped by tenant only if you must not merge events from different tenants.
Services that must be accommodated by the capacities of the main tenant can be deployed only by a user with the general administrator role.
- Correlation of events for one tenant, correlator is allocated for this tenant and deployed at the tenant
- Correlation of events for one tenant, correlator is allocated for this tenant and deployed at the main tenant
- Centralized correlation of events received from different tenants
- The tenant correlates its own events, but the main tenant additionally provides centralized correlation of events.
- One correlator for two tenants
Managing users
It is possible for multiple users to have access to KUMA. Users are assigned user roles, which affect the tasks the users can perform. The same user may have different roles with different tenants. However, you cannot assign roles to yourself, even if your user account has the General administrator role; the displayed list of roles cannot be edited.
You can create or edit user accounts in the Settings → Users section of the KUMA web interface. Users are also created automatically in the application if KUMA integration with Active Directory is enabled and the user is logging in to the KUMA web interface for the first time using their domain account.
The user must change the password upon the first login to the KUMA web interface. Subsequently, each user must regularly change their password in accordance with corporate policies, but at least once every three months.
The table of user accounts is displayed in the Users window of the KUMA web interface. You can use the Search field to look for users. You can sort the table based on the User information column by clicking the column header and selecting Ascending or Descending.
You can create, edit, or disable user accounts. When editing user accounts (your own or the accounts of others), you can generate an API token for them.
By default, disabled user accounts are not displayed in the users table. However, they can be viewed by clicking the User information column and selecting the Disabled users check box.
To disable a user:
In the Settings → Users section of the KUMA web interface, select the check box next to the relevant user and click Disable user.
User roles
KUMA users may have the following roles:
- General administrator—this role is designed for users who are responsible for the core functionality of KUMA systems. For example, they install system components, perform maintenance, work with services, create backups, and add users to the system. These users have full access to KUMA.
- Tenant administrator—this role is for users responsible for the core functionality of KUMA systems owned by specific tenants.
- Tier 2 analyst—this role is for users responsible for configuring the KUMA system to receive and process events of a specific tenant. They also create and tweak correlation rules.
- Tier 1 analyst—this role is for users responsible for configuring the KUMA system to receive and process events of a specific tenant. They also create and tweak correlation rules. Users with this role have fewer privileges than Tier 2 analysts.
- Junior analyst—this role is for users dealing with immediate security threats of a specific tenant. A user with this role can check resources of the Shared tenant through the REST API.
- Access to NCIRCC—this role can be selected if the license includes the NCIRCC module. Users with this role receive notifications by default.
- Access to CII—this role can be selected if the license includes the NCIRCC module. Users with this role receive notifications by default.
- Read shared resources—this role is intended for managing the Shared tenant. Users with this role have read access to shared resources.
- Manage shared resources—this role is intended for managing the Shared tenant. Users with this role have edit access to shared resources.
User roles rights
Web interface section and actions
General administrator
Tenant administrator
Tier 2 analyst
Tier 1 analyst
Junior analyst
Manage shared resources
Read shared resources
Access to NCIRCC
Access to CII
Comment
Reports
Create report template
yes
yes
yes
yes
no
no
no
no
no
View and edit templates and reports
yes
yes
yes
yes
no
no
no
no
no
Tier 2 analysts and Tier 1 analysts can:
- View any templates and reports, their own and those of other users, provided that all tenants specified in the template are available for this role.
- Edit their own templates/reports.
Tier 2 analysts can edit predefined templates.
Specifying the user's email address in the template is no longer grounds for providing access to a report generated from that template. Such a report is available to the user for viewing if all tenants specified in the template are available for the user's role.
Generate reports
yes
yes
yes
yes
no
no
no
no
no
Tier 2 analysts and Tier 1 analysts can generate any reports, their own and those of other users, provided that all tenants specified in the template are available for the role.
Tier 2 analysts and Tier 1 analysts cannot generate reports that were sent to the analyst by email.
View generated reports
yes
yes
yes
yes
yes
no
no
no
no
Junior analysts, Tier 1 analysts, and Tier 2 analysts have read access to their own and others' reports, including predefined reports, as long as they have full access to the tenants of the report.
Modify generated reports
yes
yes
yes
yes
no
no
no
no
no
A Tier 2 analyst can change generation settings of predefined templates.
Export generated reports
yes
yes
yes
yes
no
no
no
no
no
Tier 2 analysts and Tier 1 analysts can download any reports, provided that all tenants specified in the template are available for the role.
Delete templates and generated reports
yes
yes
yes
yes
no
no
no
no
no
Tier 2 analysts can delete their own templates and reports, as well as predefined templates.
Tier 2 analysts cannot delete reports that were sent to them by email.
General administrator, Tenant administrator, Tier 2 analyst can delete predefined templates and reports.
Edit the settings for generating reports
yes
yes
yes
yes
no
no
no
no
no
Tier 2 analysts can edit the settings for generating predefined templates and reports, as well as their own templates and reports.
Tier 1 analysts can edit the settings for generating the reports they created.
Duplicate report template
yes
yes
yes
yes
no
no
no
no
no
Tier 2 analysts and Tier 1 analysts can duplicate their own reports and predefined reports.
Open the generated report by email
yes
yes
yes
yes
yes
no
no
no
no
If a report is sent as a link, it is available to KUMA users only.
If a report is sent as an attachment, the report is available to the recipient if all tenants specified in the report template are available to the role of the recipient.
Dashboard
View data on the dashboard and change layouts
yes
yes
yes
yes
yes
no
no
yes
yes
Available if the user has full access. Full access means that the list of tenants defined at the dashboard level is identical to the list of tenants available to the user. Tenants in the toggle switch are also taken into account.
View the Universal layout
yes
yes
yes
yes
yes
no
no
yes
yes
Add layouts
yes
yes
yes
yes
no
no
no
no
no
This includes adding widgets to a layout.
Only the general administrator can add a universal layout.
Edit and rename layouts
yes
yes
yes
yes
no
no
no
no
no
This includes adding, editing, and deleting widgets.
Tier 2 analysts can change/rename predefined layouts and layouts that were created by their own account.
Tier 1 analysts can edit/rename layouts created by their own account.
Delete layouts
yes
yes
yes
yes
no
no
no
no
no
Tenant administrators may delete layouts in the tenants available to them.
Tier 2 analysts and Tier 1 analysts can delete layouts created by their own account.
General administrators, Tenant administrators, and Tier 2 analysts can delete predefined layouts.
When the kuma-core.service service is restarted, predefined layouts are restored to their original condition if they were previously deleted.
Enable and disable the TV mode
yes
yes
yes
yes
yes
no
no
yes
yes
Resources → Services and Resources → Services → Active services
View the list of active services
yes
yes
yes
yes
yes
no
no
yes
yes
Only the General Administrator can view and delete storage spaces.
Access rights do not depend on the tenants selected in the menu.
Tier 1 analysts and Tier 2 analysts can:
- See the storage service in the list of active services.
- Copy the ID of the storage and download the logs of the storage.
Access to viewing active services was added to the Junior analyst, Access to CII, Access to NCIRCC roles.
These roles have the following abilities:
- Viewing the Services section
- Viewing service logs
- Copying the service ID
- Refreshing the table
- Going to events
View and delete partitions in storage
yes
no
no
no
no
no
no
no
no
Download service logs
yes
yes
yes
yes
yes
no
no
yes
yes
Copy the service ID
yes
yes
yes
yes
yes
no
no
yes
yes
Refresh the table of active services
yes
yes
yes
yes
yes
no
no
yes
yes
Go to Events
yes
yes
yes
yes
yes
no
no
yes
yes
View the contents of the active list
yes
yes
yes
yes
no
no
no
no
no
View the content of a context table
yes
yes
yes
yes
no
no
no
no
no
Import/export/clear/add/edit/delete active list content
yes
yes
yes
yes
no
no
no
no
no
Tier 1 analysts can import data into any list of a correlator of an available tenant.
Import/export/clear/add/edit/delete context table content
yes
yes
yes
yes
no
no
no
no
no
Tier 1 analysts can import data into any table of a correlator of an available tenant.
Create a resource set for services
yes
yes
yes
no
no
no
no
no
no
Tier 2 analysts cannot create storages.
Create a service under Resources → Services → Active services
yes
yes
no
no
no
no
no
no
no
Only the general administrator can create a service.
Delete services
yes
yes
no
no
no
no
no
no
no
View services that have the gray status
yes
no
no
no
no
no
no
no
no
Restart services
yes
yes
no
no
no
no
no
no
no
Update the settings of services
yes
yes
yes
no
no
no
no
no
no
Reset certificates
yes
yes
no
no
no
no
no
no
no
Users with the Tenant administrator role can reset the certificates of services only in the tenants that are accessible to the user.
Collect and analyze data
View the scheduler configuration
yes
yes
yes
no
no
no
yes
no
no
Create a scheduler
yes
yes
yes
no
no
no
no
no
no
Link storages and correlators
yes
yes
yes
no
no
no
no
no
no
Run
yes
yes
yes
no
no
yes
no
no
no
Resources → Resource configuration and Service configuration
View the list of resource and service configurations
yes
yes
yes
yes
no
yes
yes
no
no
The configuration of a secret resource can be viewed by the following roles: Tier 1 analyst, Tier 2 analyst, Manage shared resources, and Read shared resources.
The list of secrets is available when creating services (collector, correlator, agent), resources, settings.
The Manage shared resources role grants access to viewing and editing resources only in the Shared tenant.
The Read shared resources role grants access to viewing resources only in the Shared tenant.
Access rights do not depend on the tenants selected in the menu. That is, the Storage section may be visible because the user has the administrator role in a tenant in which no storage was created. In that case, the Storage section is displayed, but contains no information.
Only the General administrator can view configurations of the event router service.
Create a service configuration
yes
yes
yes
yes
no
no
no
no
no
The configuration of the Storage service cannot be viewed by the following roles: Tier 1 analyst and Tier 2 analyst.
Create a resource configuration
yes
yes
yes
yes
no
yes
no
no
no
Creating a configuration for a secret resource is not available to the following roles: Tier 2 analyst, Tier 1 analyst, and Manage shared resources.
Duplicate the configuration of a resource/service
yes
yes
yes
yes
no
yes
no
no
no
Tier 1 analysts can duplicate a resource created by other users, including the resource set of a service. However, Tier 1 analysts cannot change the dependent resources in the copy of the set of service resources.
Edit the configuration of a resource/service
yes
yes
yes
yes
no
yes
no
no
no
Tier 2 analysts cannot edit resources of secrets.
Delete the configuration of a resource/service
yes
yes
yes
yes
no
yes
no
no
no
Tier 2 analysts cannot delete resources of secrets.
Import the configuration of a resource/service from a file
yes
yes
yes
yes
no
yes
no
no
no
The following roles can import resources to the Shared tenant: General administrator and Manage shared resources.
User rights are not checked at the time of upload, instead they are checked at the time of import, when a tenant is already selected. Therefore, if the user account is not trusted, you must clear the POST /resources/toc, POST /resources/upload check boxes in the properties of API methods.
View the repository, import the resources from the repository
yes
yes
yes
no
no
no
no
no
no
The Shared tenant's dependent resources are imported into the Shared tenant. A special right to the Shared tenant is not required; only the right to import in the target tenant is checked.
Export the configuration of a resource/service
yes
yes
yes
yes
no
yes
yes
no
no
This includes resources from the Shared tenant.
Export correlation rules to MITRE ATT&CK Navigator
yes
yes
yes
yes
no
no
no
no
no
Create and edit a resource configuration in the Shared tenant
yes
no
no
no
no
yes
yes
no
no
View a resource in the Shared tenant (including linking, export, duplication)
yes
no
no
no
no
yes
yes
no
no
Source status → List of event sources
View sources of events
yes
yes
yes
yes
yes
yes
no
yes
yes
Change sources of events
yes
yes
yes
no
no
yes
no
no
no
Delete sources of events
yes
yes
yes
no
no
yes
no
no
no
Source status → Monitoring policies
View monitoring policies
yes
yes
yes
yes
yes
yes
yes
yes
yes
Create monitoring policies
yes
yes
yes
no
no
yes
no
no
no
Edit monitoring policies
yes
yes
yes
no
no
yes
no
no
no
Only the general administrator can edit the predefined monitoring policies.
Delete monitoring policies
yes
yes
yes
no
no
yes
no
no
no
Predefined policies cannot be removed.
Assets
View the list of assets
yes
yes
yes
yes
yes
no
no
yes
yes
View the list of categories
yes
yes
yes
yes
yes
yes
yes
yes
yes
This includes categories of the Shared tenant.
Add/edit/delete asset categories
yes
yes
yes
yes
no
no
no
no
no
Within the tenant available to the user.
Add asset categories in the Shared tenant
yes
no
no
no
no
no
no
no
no
This includes editing and deleting categories of the Shared tenant.
Link assets to an asset category of the Shared tenant
yes
yes
yes
yes
no
yes
yes
no
no
Add assets
yes
yes
yes
yes
no
no
no
no
no
Edit assets
yes
yes
yes
yes
no
no
no
no
no
Delete assets
yes
yes
yes
yes
no
no
no
no
no
Import assets from Kaspersky Security Center
yes
yes
yes
yes
no
no
no
no
no
Start tasks on assets in Kaspersky Security Center
yes
yes
yes
yes
no
no
no
no
no
Run tasks to move an asset to a Kaspersky Security Center administration group
yes
yes
yes
yes
no
no
no
no
no
Run tasks on assets in Kaspersky Endpoint Detection and Response
yes
yes
yes
yes
no
no
no
no
no
Initiating the change of asset status in KICS for Networks
yes
yes
yes
yes
no
no
no
no
no
Confirm updates to fix the asset vulnerabilities and accept the licensing agreements
yes
yes
no
no
no
no
no
no
no
Editing CII categorization in the asset card
yes
no
no
no
no
no
no
no
yes
Editing custom fields of the assets (Settings → Assets)
yes
yes
yes
yes
no
no
no
no
no
Alerts
View the list of alerts
yes
yes
yes
yes
yes
no
no
yes
yes
Change the severity of alerts
yes
yes
yes
yes
yes
no
no
yes
yes
Open the details of alerts
yes
yes
yes
yes
yes
no
no
yes
yes
Assign responsible users
yes
yes
yes
yes
yes
no
no
yes
yes
Close alerts
yes
yes
yes
yes
yes
no
no
yes
yes
Add comments to alerts
yes
yes
yes
yes
yes
no
no
yes
yes
Attach an event to alerts
yes
yes
yes
yes
yes
no
no
yes
yes
Detach an event from alerts
yes
yes
yes
yes
yes
no
no
yes
yes
Edit and delete someone else's filters
yes
yes
no
no
no
no
no
no
no
Tier 2 analysts and Junior analysts can edit or delete only their own filter resources.
Incidents
View the list of incidents
yes
yes
yes
yes
yes
no
no
yes
yes
Create blank incidents
yes
yes
yes
yes
yes
no
no
yes
yes
Manually create incidents from alerts
yes
yes
yes
yes
yes
no
no
yes
yes
Change the severity of incidents
yes
yes
yes
yes
yes
no
no
yes
yes
Open the incident details
yes
yes
yes
yes
yes
no
no
yes
yes
Incident details display data from only those tenants to which the user has access.
Assign executors
yes
yes
yes
yes
yes
no
no
yes
yes
Close incidents
yes
yes
yes
yes
yes
no
no
yes
yes
Add comments to incidents
yes
yes
yes
yes
yes
no
no
yes
yes
Attach alerts to incidents
yes
yes
yes
yes
yes
no
no
yes
yes
Detach alerts from incidents
yes
yes
yes
yes
yes
no
no
yes
yes
Edit and delete someone else's filters
yes
yes
no
no
no
no
no
no
no
Tier 2 analysts, Tier 1 analysts, and Junior analysts can edit or delete only their own filter resources.
Export incidents to NCIRCC
yes
no
no
no
no
no
no
yes
no
The functions are always available to the General administrator. Other users can use the functions if the Can interact with NCIRCC check box is selected in their profile.
Send files to NCIRCC
yes
no
no
no
no
no
no
yes
no
Download files sent to NCIRCC
yes
no
no
no
no
no
no
yes
no
Export additional incident data to NCIRCC upon request
yes
no
no
no
no
no
no
yes
no
Send messages to NCIRCC
yes
no
no
no
no
no
no
yes
no
View messages from NCIRCC
yes
no
no
no
no
no
no
yes
no
View incident data exported to NCIRCC
yes
no
no
no
no
no
no
yes
no
Events
View the list of events
yes
yes
yes
yes
yes
no
no
yes
yes
Search events
yes
yes
yes
yes
yes
no
no
yes
yes
Open the details of events
yes
yes
yes
yes
yes
no
no
yes
yes
Open statistics
yes
yes
yes
yes
yes
no
no
yes
yes
Perform a retroscan
yes
yes
yes
no
no
no
no
no
no
Export events to a TSV file
yes
yes
yes
yes
yes
no
no
yes
yes
View filters (search query)
yes
yes
yes
yes
yes
yes
yes
yes
yes
Add (save) filter
yes
yes
yes
yes
yes
yes
no
yes
yes
Edit or delete someone else's filter folders
yes
yes
no
no
no
no
no
no
no
Tier 2 analysts, Tier 1 analysts, and Junior analysts can edit or delete only their own filter resources.
Delete own filters
yes
yes
yes
yes
yes
yes
no
yes
yes
Delete other users' filters
yes
yes
no
no
no
no
no
no
no
Start ktl enrichment
yes
yes
yes
yes
no
no
no
no
no
Run tasks on Kaspersky Endpoint Detection and Response assets in event details
yes
yes
yes
yes
no
no
no
no
no
Create presets
yes
yes
yes
yes
yes
yes
no
yes
yes
Delete presets
yes
yes
yes
yes
yes
yes
no
yes
yes
Tier 2 analysts, Tier 1 analysts, and Junior analysts can delete only their own presets.
View and use presets
yes
yes
yes
yes
yes
yes
yes
yes
yes
Settings → Users
View the list of users
yes
no
no
no
no
no
no
no
no
Add a user
yes
no
no
no
no
no
no
no
no
Edit a user
yes
no
no
no
no
no
no
no
no
Generate token
yes
yes
yes
yes
yes
yes
yes
yes
yes
All users can generate their own tokens.
The general administrator can generate a token for any user.
Change access rights for a token
yes
yes
yes
yes
yes
yes
yes
yes
yes
The General administrator can modify access rights for any user. Users can assign to themselves only those rights that are available to them as part of the user's role.
View the data of their own profile
yes
yes
yes
yes
yes
yes
yes
yes
yes
Edit the data of their own profile
yes
yes
yes
yes
yes
yes
yes
yes
yes
The user role is not available for change.
Settings → LDAP server
View the LDAP connection settings
yes
yes
yes
yes
no
no
no
no
no
Edit the LDAP connection settings
yes
yes
no
no
no
no
no
no
no
Delete the configuration of an entire tenant from the settings
yes
yes
no
no
no
no
no
no
no
Import assets
yes
yes
no
no
no
no
no
no
no
Settings → Tenants
This section is available only to the general administrator.
View the list of tenants
yes
no
no
no
no
no
no
no
no
Add tenants
yes
no
no
no
no
no
no
no
no
Change tenants
yes
no
no
no
no
no
no
no
no
Export tenants
yes
no
no
no
no
no
no
no
no
Settings → Domain authorization
This section is available only to the general administrator.
View the Active Directory connection settings
yes
no
no
no
no
no
no
no
no
Edit the Active Directory connection settings
yes
no
no
no
no
no
no
no
no
Add filters based on roles for tenants
yes
no
no
no
no
no
no
no
no
Settings → Common
This section is available only to the general administrator.
View the SMTP connection settings
yes
no
no
no
no
no
no
no
no
Edit the SMTP connection settings
yes
no
no
no
no
no
no
no
no
Settings → License
This section is available only to the general administrator.
View the list of added license keys
yes
no
no
no
no
no
no
no
no
Add license keys
yes
no
no
no
no
no
no
no
no
Delete license keys
yes
no
no
no
no
no
no
no
no
Settings → Kaspersky Security Center
View the list of successfully integrated Kaspersky Security Center servers
yes
yes
yes
yes
no
no
no
no
no
Add Kaspersky Security Center connections
yes
yes
no
no
no
no
no
no
no
Delete Kaspersky Security Center connections
yes
yes
no
no
no
no
no
no
no
Delete the configuration of an entire tenant from the settings
yes
yes
no
no
no
no
no
no
no
Start the tasks for importing Kaspersky Security Center assets
yes
yes
no
no
no
no
no
no
no
Settings → KICS/KATA
View a list of KICS/KATA servers with which integration has been configured
yes
yes
no
no
no
no
no
no
no
Add and modify the settings of KICS/KATA integration
yes
yes
no
no
no
no
no
no
no
Delete the settings of KICS/KATA integration
yes
yes
no
no
no
no
no
no
no
Run the tasks to import assets from the KICS/KATA settings
yes
yes
no
no
no
no
no
no
no
Settings → Kaspersky Automated Security Awareness Platform
View the ASAP integration settings
yes
no
no
no
no
no
no
no
no
Edit the ASAP integration settings
yes
no
no
no
no
no
no
no
no
Settings → Kaspersky Endpoint Detection and Response
View the connection settings
yes
yes
yes
yes
no
no
no
no
no
Add, edit and disconnect the connections when the distributed solution mode is enabled
yes
no
no
no
no
no
no
no
no
Enable the distributed solution mode
yes
no
no
no
no
no
no
no
no
Add connections when the distributed solution mode is disabled
yes
yes
no
no
no
no
no
no
no
Delete the connections when the distributed solution mode is disabled
yes
yes
no
no
no
no
no
no
no
Delete the configuration of an entire tenant from the settings
yes
yes
no
no
no
no
no
no
no
Settings → Kaspersky CyberTrace
This section is available only to the general administrator.
View the CyberTrace integration settings
yes
no
no
no
no
no
no
no
no
Edit the CyberTrace integration settings
yes
no
no
no
no
no
no
no
no
Settings → IRP / SOAR
This section is available only to the general administrator.
View the settings for integration with IRP / SOAR
yes
no
no
no
no
no
no
no
no
Edit the IRP/SOAR integration settings
yes
no
no
no
no
no
no
no
no
Settings → Kaspersky Threat Lookup
This section is available only to the general administrator.
View the Threat Lookup integration settings
yes
no
no
no
no
no
no
no
no
Edit the Threat Lookup integration settings
yes
no
no
no
no
no
no
no
no
Settings → Alerts
View the parameters
yes
yes
yes
yes
no
no
no
no
no
Edit the parameters
yes
yes
yes
no
no
no
no
no
no
Delete the configuration of an entire tenant from the settings
yes
yes
yes
no
no
no
no
no
no
Settings → Incidents → Automatic linking of alerts to incidents
This section is available for an account with the Tenant administrator, Tier 2 analyst, and Tier 1 analyst roles if the role is assigned in the Main tenant.
View the parameters
yes
yes
yes
yes
no
no
no
no
no
Edit the parameters
yes
no
no
no
no
no
no
no
no
Settings → Incidents → Incident types
View the categories reference
yes
yes
yes
yes
no
no
no
no
no
View the categories charts
yes
yes
yes
yes
no
no
no
no
no
Add categories
yes
yes
no
no
no
no
no
no
no
Edit categories
yes
yes
no
no
no
no
no
no
no
Delete categories
yes
yes
no
no
no
no
no
no
no
Settings → NCIRCC
View the parameters
yes
no
no
no
no
no
no
no
no
Edit the parameters
yes
no
no
no
no
no
no
no
no
Settings → Asset audit
Create, clone and edit the settings
yes
yes
yes
no
no
no
no
no
no
View the parameters
yes
yes
yes
yes
no
no
no
no
no
Delete settings
yes
yes
yes
no
no
no
no
no
no
Settings → Repository update
View the parameters
yes
yes
yes
no
no
no
no
no
no
Edit the parameters
yes
no
no
no
no
no
no
no
no
Start the repository update task manually
yes
yes
yes
no
no
no
no
no
no
Settings → Assets
Add, edit, and delete the asset fields
yes
no
no
no
no
no
no
no
no
Settings → Space sets
Viewing the list of sets
yes
no
no
no
no
no
no
no
no
To view your sets, you must log in to your profile. The profile displays a list of assigned sets; you can hover over a set to display the list of available spaces.
Adding, editing, deleting a space set
yes
no
no
no
no
no
no
no
no
The default set (All spaces) cannot be edited.
Setting the default space set
yes
no
no
no
no
no
no
no
no
Assigning a space set to a user
yes
no
no
no
no
no
no
no
no
Can only be done with rights in the Main tenant.
Settings → Tags
View the list of tags
yes
yes
yes
yes
no
no
no
no
no
Settings → Extended event schema fields
Viewing the table of extended event schema fields
yes
yes
yes
yes
yes
no
yes
no
no
Exporting extended event schema fields
yes
yes
yes
yes
yes
no
yes
no
no
Service fields of the extended event schema with the
KL_prefix cannot be exported.Adding and modifying extended event schema fields
yes
yes
yes
yes
yes
no
no
no
no
Service fields of the extended event schema with the
KL_prefix are not editable.Importing extended event schema fields
yes
yes
yes
yes
yes
no
no
no
no
Removing and disabling extended event schema fields
yes
no
no
no
no
no
no
no
no
Service fields of the extended event schema with the
KL_prefix cannot be deleted.Metrics
Open metrics
yes
no
no
no
no
no
no
no
no
Task manager
View a list of your own tasks
yes
yes
yes
yes
yes
no
no
yes
yes
A user with the General administrator role has access to tasks of all tenants.
Tenant administrators can view and manage tasks of other users in tenants available to the Tenant administrator.
Users have access to tasks in available tenants.
A user can restart a task of another user if the restarting user has rights to start tasks of that type.
Finish your own tasks
yes
yes
yes
yes
yes
no
no
yes
yes
Restart your own tasks
yes
yes
yes
yes
yes
no
no
yes
yes
View a list of all tasks
yes
no
no
no
no
no
no
no
no
Finish any task
yes
no
no
no
no
no
no
no
no
Restart any task
yes
no
no
no
no
no
no
no
no
CyberTrace
This section is not displayed in the web interface unless CyberTrace integration is configured under Settings → CyberTrace.
Open the section
yes
no
no
no
no
no
no
no
no
Access to the data of tenants
Access to tenants
yes
yes
yes
yes
yes
no
no
yes
yes
A user has access to the tenant if its name is indicated in the settings blocks of the roles assigned to the user account. The access level depends on which role is indicated for the tenant.
Shared tenant
yes
yes
yes
yes
yes
yes
yes
yes
yes
A shared tenant is used to store shared resources that must be available to all tenants.
Although services cannot be owned by the Shared tenant, these services may utilize resources that are owned by the Shared tenant. These services are still owned by their respective tenants.
Events, alerts and incidents cannot be shared.
Permissions to access the Shared tenant:
- Read/write—only the general administrator.
- Read—all other users, including users that have permissions to access the main tenant.
Main tenant
yes
yes
yes
yes
yes
no
no
yes
yes
A user has access to the main tenant if its name is indicated in the settings blocks of the roles assigned to the user account. The access level depends on which role is indicated for the tenant.
Permissions to access the main tenant do not grant access to other tenants.
Creating a user
To create a user account:
- In the KUMA web interface, open Settings → Users.
In the right part of the Settings section the Users table will be displayed.
- Click the Add user button and set the parameters as described below.
- In the Name field, enter the user name. The length of the string must be 1 to 128 Unicode characters.
- In the Login field, enter a unique user name for the user account. Must contain from 3 to 64 characters (only a–z, A–Z, 0–9, . \ - _).
- In the Email field, enter the unique email address of the user. Must be a valid email address.
- In the New password field, enter the password to the user account. The password must satisfy the following requirements:
- 8 to 128 characters long. Starting with version 3.2.x, 16 to 128 characters long.
- At least one lowercase character.
- At least one uppercase character.
- At lease one numeral.
- At least one of the following special characters:
!,@,#,%,^,&,* - Sequences of three or more identical characters are forbidden.
The user must change the password upon the first login to the KUMA web interface. Subsequently, each user must regularly change their password in accordance with corporate policies, but at least once every three months.
- In the Confirm password field, enter the password again for confirmation.
- Disabled—select this check box if you want to disable a user account. By default, this check box is cleared.
- Under Tenants for roles, use the Add field buttons to specify which roles the user will perform in which tenants. A user can be assigned different roles in different tenants; multiple roles can be assigned within the same tenant.
- In the Space sets drop-down list, select check boxes next to one or more space sets to which you want to grant access. If the user does not have a space set selected, access is granted to the default space set.
- Select or clear the check boxes that control access rights and user capabilities:
- Receive email notifications—select this check box if you want the user to receive SMTP notifications from KUMA.
- Display non-printable characters—select this check box if you want the KUMA web interface to display non-printing characters such as spaces, tab characters, and line breaks. If the Display non-printable characters check box is selected, you can press Ctrl/Command+* to enable or disable the display of non-printing characters.
Spaces and tab characters are displayed in all input fields (except the Description field), in normalizers, correlation rules, filters and connectors, and in SQL queries for searching events in the Events section. Spaces are displayed as dots. A tab character is displayed as a dash in normalizers, correlation rules, filters and connectors. In other fields, a tab character is displayed as one or two dots.
Line break characters are displayed in all input fields that support multi-line input, such as the event search field.
- If necessary, use the Generate token button to generate an API token.
Clicking this button displays the token creation window.
- If necessary, configure the operations available to the user via the REST API by using the API access rights button.
- Click Save.
The user account will be created and displayed in the Users table.
Page top
Editing user
To edit a user:
- In the KUMA web interface, open Settings → Users.
In the right part of the Settings section the Users table will be displayed.
- Select the relevant user and change the necessary settings in the user details area that opens on the right.
- Name (required)—edit the user name. The length of the string must be 1 to 128 Unicode characters.
- Login(required) – enter a unique user name for the user account. Must contain from 3 to 64 characters (only a–z, A–Z, 0–9, . \ - _).
- Email (required)—enter the unique email address of the user. Must be a valid email address.
- Disabled—select this check box if you want to disable a user account. By default, this check box is cleared.
- Under Tenants for roles, use the Add field buttons to specify which roles the user will perform in which tenants. A user can be assigned different roles in different tenants; multiple roles can be assigned within the same tenant. For a domain user, the ability to change the main role (General administrator, Tenant administrator, Tier 2 analyst, Tier 1 analyst, Junior analyst) is blocked in the user card, while additional roles can be added or removed (Access to CII, Interaction with NCIRCC, Access to shared resources), including management of additional role assignment to tenants.
- In the Space sets drop-down list, select check boxes next to one or more space sets to which you want to grant access. If the user does not have a space set selected, access is granted to the default space set.
- Select or clear the check boxes that control access rights and user capabilities:
- Receive email notifications—select this check box if you want the user to receive SMTP notifications from KUMA.
- Display non-printable characters—select this check box if you want the KUMA web interface to display non-printing characters such as spaces, tab characters, and line breaks. If the Display non-printable characters check box is selected, you can press Ctrl/Command+* to enable and disable the display of non-printing characters.
Spaces and tab characters are displayed in all input fields (except Description), in normalizers, correlation rules, filters and connectors, and in SQL queries for searching events in the Events section. Spaces are displayed as dots. A tab character is displayed as a dash in normalizers, correlation rules, filters and connectors. In other fields, a tab character is displayed as one or two dots.
Line break characters are displayed in all input fields that support multi-line input, such as the event search field.
- If you need to change the password, click the Change password button and fill in the fields described below in the opened window. When finished, click OK.
- Current password (required)—enter the current password of your user account. The field is available if you change your account password.
- New password (required)—enter a new password to the user account. Password requirements:
- 8 to 128 characters long.
- At least one lowercase character.
- At least one uppercase character.
- At lease one numeral.
- At least one of the following special characters: !, @, #, %, ^, &, *.
- Confirm password (required)—enter the password again for confirmation.
- If necessary, use the Generate token button to generate an API token. Clicking this button displays the token creation window.
- If necessary, configure the operations available to the user via the REST API by using the API access rights button.
- Click Save.
The user account will be changed.
Page top
Editing your user account
To edit your user account:
- Open the KUMA web interface, click the name of your user account in the bottom-left corner of the window and click the Profile button in the opened menu.
The User window with your user account parameters opens.
- Make the necessary changes to the parameters:
- Name (required)—enter the user name. The length of the string must be 1 to 128 Unicode characters.
- Login(required) – enter a unique user name for the user account. Must contain from 3 to 64 characters (only a–z, A–Z, 0–9, . \ - _).
Email (required)—enter the unique email address of the user. Must be a valid email address.
- Select or clear the check boxes that control access rights and user capabilities:
- Receive email notifications—select this check box if you want the user to receive SMTP notifications from KUMA.
- Display non-printable characters—select this check box if you want the KUMA web interface to display non-printing characters such as spaces, tab characters, and line breaks.
Spaces and tab characters are displayed in all input fields (except Description), in normalizers, correlation rules, filters and connectors, and in SQL queries for searching events in the Events section.
Spaces are displayed as dots.
A tab character is displayed as a dash in normalizers, correlation rules, filters and connectors. In other fields, a tab character is displayed as one or two dots.
Line break characters are displayed in all input fields that support multi-line input, such as the event search field.
If the Display non-printable characters check box is selected, you can press Ctrl/Command+* to enable and disable the display of non-printing characters.
- If you need to change the password, click the Change password button and fill in the fields described below in the opened window. When finished, click OK.
- Current password (required)—enter the current password of your user account.
- New password (required)—enter a new password to your account. Password requirements:
- 8 to 128 characters long.
- At least one lowercase character.
- At least one uppercase character.
- At lease one numeral.
- At least one of the following special characters: !, @, #, %, ^, &, *.
- Confirm password (required)—enter the password again for confirmation.
- If necessary, use the Generate token button to generate an API token. Clicking this button displays the token creation window.
- If necessary, configure the operations that are available via the REST API by using the API access rights button.
- Click Save.
Your user account is changed.
Page top
KUMA services
Services are the main components of KUMA that help the system to manage events: services allow you to receive events from event sources and subsequently bring them to a common form that is convenient for finding correlation, as well as for storage and manual analysis. Each service consists of two parts that work together:
- One part of the service is created in the KUMA web interface based on a resource set for services.
- The second part of the service is installed in the network infrastructure where the KUMA system is deployed as one of its components. The server part of a service can consist of multiple instances: for example, services of the same agent or storage can be installed on multiple devices at once.
On the server side, KUMA services are located in the
/opt/kaspersky/kumadirectory.When you install KUMA in high availability mode, only the KUMA Core is installed in the cluster. Collectors, correlators, and storages are hosted on hosts outside of the Kubernetes cluster.
Parts of services are connected to each other via the service ID.
Service types:
- Storages are used to save events.
- Correlators are used to analyze events and search for defined patterns.
- Collectors are used to receive events and convert them to KUMA format.
- Agents are used to receive events on remote devices and forward them to KUMA collectors.
In the KUMA web interface, services are displayed in the Resources → Active services section in table format. The table of services can be updated using the Refresh button and sorted by columns by clicking on the active headers. You can also configure the columns displayed in the table. To do so, click the gear button in the upper-right corner to display a drop-down list. In that drop-down list, select check boxes next to the names of the columns that you want to display in the table. You can leave any single column in the list to be displayed.
The maximum table size is not limited. If you want to select all services, scroll to the end of the table and select the Select all check box, which selects all available services in the table.
Table columns:
- Status—service status:
- Green means the service is running and accessible from the Core server.
- Red means the service is not running or is not accessible from the Core server.
- Yellow is the status that applies to all services except the agent. The yellow status means that the service is running, but there are errors in the service log, or there are alerts for the service from Victoria Metrics. You can view the error message by hovering the mouse cursor over the status of the service in the Active services section.
- Purple is the status that is applied to running services whose configuration file in the database has changed, but that have no other errors. If a service has an incorrect configuration file and has errors, for example, from Victoria Metrics, status of the service is yellow.
- Gray means that if a deleted tenant had a running service that is still running, that service is displayed with a gray status on the Active services page. Services with the gray status are kept when you delete the tenant to let you copy the ID and remove services on your servers. Only the General administrator can delete services with the gray status. When a tenant is deleted, the services of that tenant are assigned to the Main tenant.
- Type—type of service: agent, collector, correlator, storage, event router.
- Name—name of the service. Clicking on the name of the service opens its settings.
- Version—service version.
- Tenant—the name of the tenant that owns the service.
- FQDN—fully qualified domain name of the service server.
- IP address—IP address of the server where the service is installed.
- API port—Remote Procedure Call port number.
- Uptime—Uptime of the service.
- Created—the date and time when the service was created.
- UUID—Unique ID of the service.
By default, this column is not displayed in the table. You can add it to the table by clicking the gear icon in the upper-right part of the table of services and selecting the check box next to the name of the UUID column in the drop-down list.
You can sort data in the table in ascending and descending order, as well as by the Status parameter and by the service type in the Type column. To sort active services, right-click the context menu and select one or more statuses and a type.
You can use the buttons in the upper part of the Services window to perform the following group actions:
- Add service
You can create new services based on existing service resource sets. We do not recommend creating services outside the main tenant without first carefully planning the inter-tenant interactions of various services and users.
- Refresh
You can refresh the list of active services.
- Update configuration
The Update settings button is not available if the KUMA Core service is among the services selected for group actions or if any of the selected services has the grey status. To make the Update settings button available for group actions, clear the check box from the KUMA Core service and services with the grey status.
- Restart
To perform an action with an individual service, right-click the service to display its context menu. The following actions are available:
- Reset certificate
- Delete
- Download log
If you want to receive detailed information, enable the Debug mode in the service settings.
- Copy service ID
You need this ID to install, restart, stop, or delete the service.
- Go to Events
- Go to active lists
- Go to context tables
- Go to partitions
To change a service, select a service under Resources → Active services. This opens a window with a resource set based on which the service was created. You can edit the settings of the resource set and save your changes. To apply the saved changes, restart the service.
If, when changing the settings of a collector resource set, you change or delete conversions in a normalizer connected to it, the edits will not be saved, and the normalizer itself may be corrupted. If you need to modify conversions in a normalizer that is already part of a service, the changes must be made directly to the normalizer under Resources → Normalizers in the web interface.
Services tools
This section describes the tools for working with services available in the Resources → Active services section of the KUMA web interface.
Getting service identifier
The service identifier is used to bind parts of the service residing within KUMA and installed in the network infrastructure into a single complex. An identifier is assigned to a service when it is created in KUMA, and is then used when installing the service to the server.
To get the identifier of a service:
- Log in to the KUMA web interface and open Resources → Active services.
- Select the check box next to the service whose ID you want to obtain, and click Copy ID.
The identifier of the service will be copied to the clipboard. For instance, this ID can be used to install the service on a server.
Page top
Stopping, starting, checking status of the service
While managing KUMA, you may need to perform the following operations.
- Temporarily stop the service. For example, when restoring the Core from backup, or to edit service settings related to the operating system.
- Start the service.
- Check the status of the service.
The table below lists commands that may be useful while managing KUMA.
Commands for stopping, starting, and checking the status of a service
Service |
Stop service |
Start service |
Check the status of the service |
|---|---|---|---|
Core |
|
|
|
Services with an ID:
|
|
|
|
Services without an ID:
|
|
|
|
Windows agents |
To stop an agent service: 1. Copy the agent ID in the KUMA web interface. 2. Connect to the host on which you want to start the KUMA agent service. 3. Run PowerShell as an account that has administrative privileges. 4. Run the following command in PowerShell:
|
To start an agent service: 1. Copy the agent ID in the KUMA web interface. 2. Connect to the host on which you want to start the KUMA agent service. 3. Run PowerShell as an account that has administrative privileges. 4. Run the following command in PowerShell:
|
To view the status of an agent service: 1. In Windows, go to the Start → Services menu, and in the list of services, double-click the relevant KUMA agent. 2. This opens a window; in that window, view the status of the agent in the Service status field. |
Restarting the service
To restart the service:
- Log in to the KUMA web interface and open Resources → Active services.
- Select the check box next to the service and select the necessary option:
- Update configuration—perform a hot update of a running service configuration. For example, you can change the field mapping settings or the destination point settings this way.
- Restart—stop a service and start it again. This option is used to modify the port number or connector type.
Restarting KUMA agents:
- KUMA Windows Agent can be restarted as described above only if it is running on a remote computer. If the service on the remote computer is inactive, you will receive an error when trying to restart from KUMA. In that case you must restart KUMA Windows Agent service on the remote Windows machine. For information on restarting Windows services, refer to the documentation specific to the operating system version of your remote Windows computer.
- KUMA Agent for Linux stops when this option is used. To start the agent again, you must execute the command that was used to start it.
- Reset certificate—remove certificates that the service uses for internal communication. This option may not be used to renew the Core certificate. To renew KUMA Core certificates, they must be reissued.
Special considerations for deleting Windows agent certificates:
- If the agent has the green status and you select Reset certificate, KUMA deletes the current certificate and creates a new one, the agent continues working with the new certificate.
- If the agent has the red status and you select Reset certificate, KUMA generates an error that the agent is not running. In the %PROGRAMDATA%\Kaspersky Lab\KUMA\agent\<agent ID>\certificates folder, manually delete the internal.cert and internal.key files and start the agent manually. When the agent starts, a new certificate is created automatically.
Special considerations for deleting Linux agent certificates:
- Regardless of the agent status, apply the Reset certificate option in the web interface to delete the certificate in the databases.
- In the agent installation directory, /opt/kaspersky/agent/<Agent ID>/certificates, manually delete the internal.cert and internal.key files.
- Since the Reset certificate option stops the agent, to continue its operation, start the agent manually. When the agent starts, a new certificate is created automatically.
Deleting the service
Before deleting the service get its ID. The ID will be required to remove the service for the server.
To remove a service in the KUMA web interface:
- Log in to the KUMA web interface and open Resources → Active services.
- Select the check box next to the service you want to delete, and click Delete.
A confirmation window opens.
- Click OK.
The service has been deleted from KUMA.
To remove a service from the server, run the following command:
sudo /opt/kaspersky/kuma/kuma <collector/correlator/storage> --id <service ID> --uninstall
The service has been deleted from the server.
Partitions window
If the storage service was created and installed, you can view its partitions in the Partitions table.
To open Partitions table:
- Log in to the KUMA web interface and open Resources → Active services.
- Select the check box next to the relevant storage and click Go to partitions.
The Partitions table opens.
The table has the following columns:
- Tenant—the name of the tenant that owns the stored data.
- Created—partition creation date.
- Space—the name of the space.
- Size—the size of the space.
- Events—the number of stored events.
- Transfer to cold storage—the date when data will be migrated from the ClickHouse clusters to cold storage disks.
- Expires—the date when the partition expires. After this date, the partition and the events it contains are no longer available.
You can delete partitions.
To delete a partition:
- Open the Partitions table (see above).
- Open the
 drop-down list to the left from the required partition.
 - Select Delete.
A confirmation window opens.
- Click OK.
The partition has been deleted. Audit event partitions cannot be deleted.
Page top
Searching for related events
You can search for events processed by the Correlator or the Collector services.
To search for events related to the Correlator or the Collector service:
- Log in to the KUMA web interface and open Resources → Active services.
- Select the check box next to the required correlator or collector and click Go to Events.
This opens a new browser tab with the KUMA Events section open.
- To find events, click the
 icon.
icon.A table with events selected by the search expression
ServiceID = <ID of the selected service> will be displayed.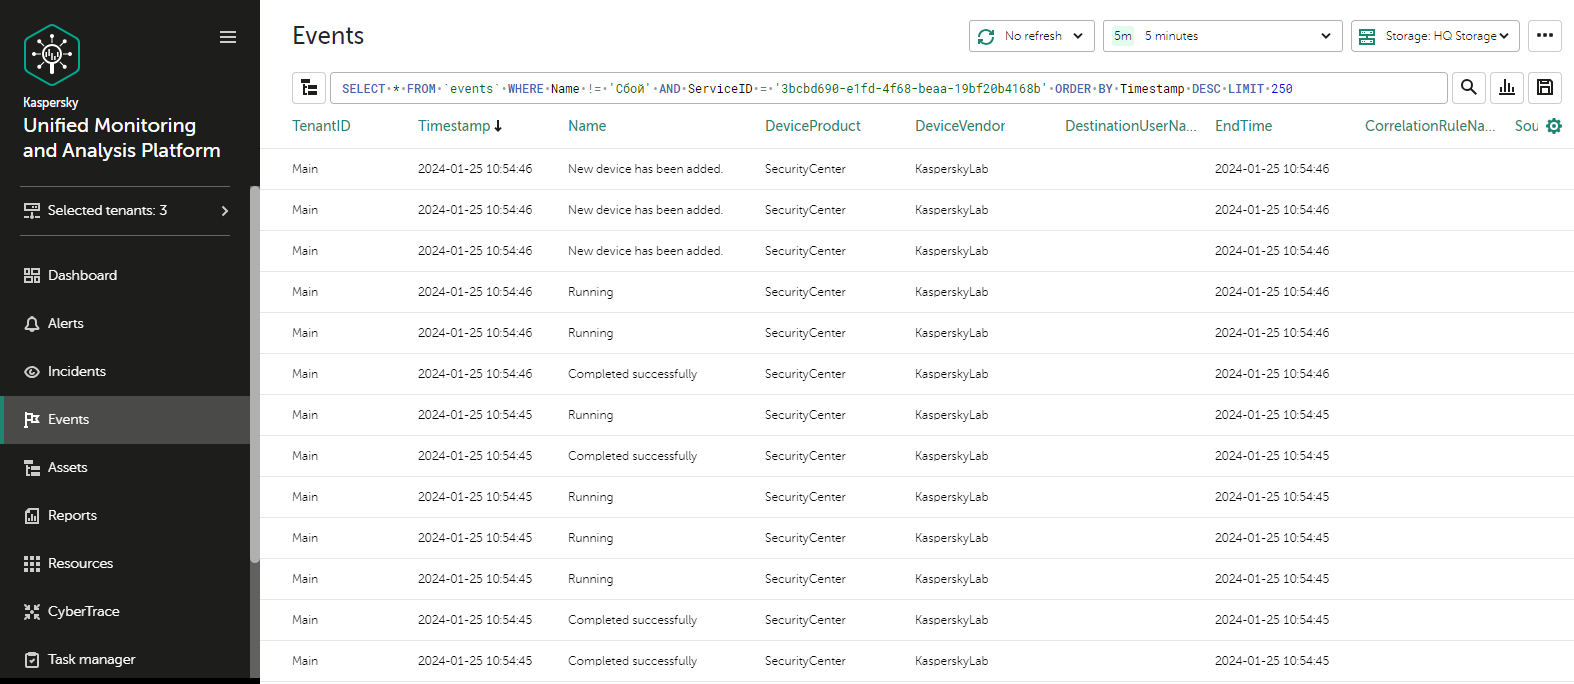
Event search results
When searching for events, you may encounter the following shard unavailability error:
Code: 279. DB::NetException: All connection tries failed. Log: \\n\\nTimeout exceeded while connecting to socket (host.example.com:port, connection timeout 1000 ms)\\nTimeout exceeded while connecting to socket (host.example.com:port, connection timeout 1000 ms)\\nTimeout exceeded while connecting to socket (host.example.com:port, connection timeout 1000 ms)\\n\\n: While executing Remote. (ALL_CONNECTION_TRIES_FAILED) (version 23.8.8.207)\\n\"}",
In this case, you need to override the ClickHouse configuration in storage settings.
To override the ClickHouse configuration:
- In the KUMA web interface, in the Resources → Storages section, click the storage resource that you want to edit.
This opens the Edit storage window.
- To skip unavailable shards when searching, insert the following lines into the ClickHouse configuration override field:
<profiles>
<default>
<skip_unavailable_shards>1</skip_unavailable_shards>
</default>
</profiles>
- To apply the ClickHouse configuration, click Save.
- Restart the storage services that depend on this resource.
This resolves the shard unavailability error, and you can proceed to search for events processed by a particular correlator or collector.
Page top
Service resource sets
Service resource sets are a resource type, a KUMA component, a set of settings based on which the KUMA services are created and operate. Resource sets for services are collections of resources.
Any resources added to a resource set must be owned by the same tenant that owns the created resource set. An exception is the Shared tenant, whose owned resources can be used in the sets of resources of other tenants.
Resource sets for services are displayed in the Resources → <Resource set type for the service> section of the KUMA web interface. Available types:
- Collectors
- Correlators
- Storages
- Agents
When you select the required type, a table opens with the available sets of resources for services of this type. The resource table contains the following columns:
- Name—the name of a resource set. Can be used for searching and sorting.
- Updated—the date and time of the last update of the resource set. Can be used for sorting.
- Created by—the name of the user who created the resource set.
- Description—the description of the resource set.
Creating a storage
A storage consists of two parts: one part is created inside the KUMA web interface, and the other part is installed on network infrastructure servers intended for storing events. The server part of a KUMA storage consists of ClickHouse nodes collected into a cluster. ClickHouse clusters can be supplemented with cold storage disks.
For each ClickHouse cluster, a separate storage must be installed.
Prior to storage creation, carefully plan the cluster structure and deploy the necessary network infrastructure. When choosing a ClickHouse cluster configuration, consider the specific event storage requirements of your organization.
We recommend using the ext4 file system.
A storage is created in several steps:
- Creating a resource set for a storage in the KUMA web interface
- Creating a storage service in the KUMA web interface
- Installing storage nodes in the network infrastructure
When creating storage cluster nodes, verify the network connectivity of the system and open the ports used by the components.
If the storage settings are changed, the service must be restarted.
ClickHouse cluster structure
A ClickHouse cluster is a logical group of devices that possess all accumulated normalized KUMA events. It consists of one or more logical shards.
A shard is a logical group of devices that possess a specific portion of all normalized events accumulated in the cluster. It consists of one or more replicas. Increasing the number of shards lets you do the following:
- Accumulate more events by increasing the total number of servers and disk space.
- Absorb a larger stream of events by distributing the load associated with an influx of new events.
- Reduce the time taken to search for events by distributing search zones among multiple devices.
A replica is a device that is a member of a logical shard and possesses a single copy of that shard's data. If multiple replicas exist, it means multiple copies exist (the data is replicated). Increasing the number of replicas lets you do the following:
- Improve high availability.
- Distribute the total load related to data searches among multiple machines (although it's best to increase the number of shards for this purpose).
A keeper is a device that participates in coordination of data replication at the whole cluster level. At least one device per cluster must have this role. The recommended number of the devices with this role is 3. The number of devices involved in coordinating replication must be an odd number. The keeper and replica roles can be combined in one machine.
Page top
ClickHouse cluster node settings
Prior to storage creation, carefully plan the cluster structure and deploy the necessary network infrastructure. When choosing a ClickHouse cluster configuration, consider the specific event storage requirements of your organization.
When creating ClickHouse cluster nodes, verify the network connectivity of the system and open the ports used by the components.
For each node of the ClickHouse cluster, you need to specify the following settings:
- Fully qualified domain name (FQDN)—a unique address to access the node. Specify the entire FQDN, for example,
kuma-storage.example.com. - Shard, replica, and keeper IDs—the combination of these settings determines the position of the node in the ClickHouse cluster structure and the node role.
Node roles
The roles of the nodes depend on the specified settings:
- shard, replica, keeper—the node participates in the accumulation and search of normalized KUMA events and helps coordinate data replication at the cluster-wide level.
- shard, replica—the node participates in the accumulation and search of normalized KUMA events.
- keeper—the node does not accumulate normalized events, but helps coordinate data replication at the cluster-wide level. Dedicated keepers must be specified at the beginning of the list in the Resources → Storages → <Storage> → Basic settings → ClickHouse cluster nodes section.
ID requirements:
- If multiple shards are created in the same cluster, the shard IDs must be unique within this cluster.
- If multiple replicas are created in the same shard, the replica IDs must be unique within this shard.
- The keeper IDs must be unique within the cluster.
Example of ClickHouse cluster node IDs:
- shard 1, replica 1, keeper 1;
- shard 1, replica 2;
- shard 2, replica 1;
- shard 2, replica 2, keeper 3;
- shard 2, replica 3;
- keeper 2.
Cold storage of events
In KUMA, you can configure the migration of legacy data from a ClickHouse cluster to the cold storage. Cold storage can be implemented using the local disks mounted in the operating system or the Hadoop Distributed File System (HDFS). Cold storage is enabled when at least one cold storage disk is specified. If multiple storages are used, a cold storage disk or a HDFS disk must be mounted at the path specified in the storage configuration on each node with data. If a cold storage disk is not configured and the server runs out of disk space in hot storage, the storage service is stopped. If both hot storage and cold storage are configured, and space runs out on the cold storage disk, the KUMA storage service is stopped. We recommend avoiding such situations by adding custom event storage conditions in hot storage.
Cold storage disks can be added or removed. If you have added multiple cold storage disks, data is written to them in a round-robin manner. If data to be written to disk would take up more space than is available on that disk, this data and all subsequent data is written round-robin to the next cold storage disks. If you added only two cold storage disks, the data is written to the drive that has free space left.
After changing the cold storage settings, the storage service must be restarted. If the service does not start, the reason is specified in the storage log.
If the cold storage disk specified in the storage settings has become unavailable (for example, out of order), this may lead to errors in the operation of the storage service. In this case, recreate a disk with the same path (for local disks) or the same address (for HDFS disks) and then delete it from the storage settings.
Rules for moving the data to the cold storage disks
You can configure the storage conditions for events in hot storage of the ClickHouse cluster by setting a limit based on retention time or on maximum storage size. When cold storage is used, every 15 minutses and after each Core restart, KUMA checks if the specified storage conditions are satisfied:
- KUMA gets the partitions for the storage being checked and groups the partitions by cold storage disks and spaces.
- For each space, KUMA checks whether the specified storage condition is satisfied.
- If the condition is satisfied (for example, if the space contains that exceed their retention time, or if the size of the storage has reached or exceeded limit specified in the condition), KUMA transfers all partitions with the oldest date to cold storage disks or deletes these partitions if no cold storage disk is configured or if it is configured incorrectly. This action is repeated while the configured storage condition remains satisfied in the space; for example, if after deleting partitions for a date, the storage size still exceeds the maximum size specified in the condition.
KUMA generates audit events when data transfer starts and ends, or when data is removed.
- If retention time is configured in KUMA, whenever partitions are transferred to cold storage disks, it is checked whether the configured conditions are satisfied on the disk. If events are found on the disk that have been stored for longer than the Event retention time, which is counted from the moment the events were received in KUMA, the solution deletes these events or all partitions for the oldest date.
KUMA generates audit events when it deletes data.
If the ClickHouse cluster disks are 95% full, the biggest partitions are automatically moved to the cold storage disks. This can happen more often than once per hour.
During data transfer, the storage service remains operational, and its status stays green in the Resources → Active services section of the KUMA web interface. When you hover over the status icon, a message is displayed about the data transfer. When a cold storage disk is removed, the storage service has the yellow status.
Special considerations for storing and accessing events
- When using HDFS disks for cold storage, protect your data in one of the following ways:
- Configure a separate physical interface in the VLAN, where only HDFS disks and the ClickHouse cluster are located.
- Configure network segmentation and traffic filtering rules that exclude direct access to the HDFS disk or interception of traffic to the disk from ClickHouse.
- Events located in the ClickHouse cluster and on the cold storage disks are equally available in the KUMA web interface. For example, when you search for events or view events related to alerts.
- You can disable the storage of events or audit events on cold storage disks. To do so, specify the following in storage settings:
- If you do not want to store events on cold storage disks, do one of the following:
- If in the Storage condition options field, you have a gigabyte or percentage based storage condition selected, in the Event retention time, specify
0. - If in the Storage condition options field, you have a storage condition in days, in the Event retention time field, specify the same number of days as in the Storage condition options field.
- If in the Storage condition options field, you have a gigabyte or percentage based storage condition selected, in the Event retention time, specify
- If you do not want to store audit events on cold storage disks, in the Audit cold retention period field, specify
0(days).
- If you do not want to store events on cold storage disks, do one of the following:
Special considerations for using HDFS disks
- Before connecting HDFS disks, create directories for each node of the ClickHouse cluster on them in the following format:
<HDFS disk host>/<shard ID>/<replica ID>. For example, if a cluster consists of two nodes containing two replicas of the same shard, the following directories must be created:- hdfs://hdfs-example-1:9000/clickhouse/1/1/
- hdfs://hdfs-example-1:9000/clickhouse/1/2/
Events from the ClickHouse cluster nodes are migrated to the directories with names containing the IDs of their shard and replica. If you change these node settings without creating a corresponding directory on the HDFS disk, events may be lost during migration.
- HDFS disks added to storage operate in the JBOD mode. This means that if one of the disks fails, access to the storage will be lost. When using HDFS, take high availability into account and configure RAID, as well as storage of data from different replicas on different devices.
- The speed of event recording to HDFS is usually lower than the speed of event recording to local disks. The speed of accessing events in HDFS, as a rule, is significantly lower than the speed of accessing events on local disks. When using local disks and HDFS disks at the same time, the data is written to them in turn.
- HDFS is used only as distributed file data storage of ClickHouse. Compression mechanisms of ClickHouse, not HDFS, are used to compress data.
- The ClickHouse server must have write access to the corresponding HDFS storage.
Removing cold storage disks
Before physically disconnecting cold storage disks, remove these disks from the storage settings.
To remove a disk from the storage settings:
- In the KUMA web interface, under Resources → Storages, select the relevant storage.
This opens the storage.
- In the window, in the Disks for cold storage section, in the required disk's group of settings, click Delete disk.
Data from removed disk is automatically migrated to other cold storage disks or, if there are no such disks, to the ClickHouse cluster. While data is being migrated, the status icon of the storage turns yellow and an hourglass icon is displayed. Audit events are generated when data transfer starts and ends.
- After event migration is complete, the disk is automatically removed from the storage settings. It can now be safely disconnected.
Removed disks can still contain events. If you want to delete them, you can manually delete the data partitions using the DROP PARTITION command.
If the cold storage disk specified in the storage settings has become unavailable (for example, out of order), this may lead to errors in the operation of the storage service. In this case, create a disk with the same path (for local disks) or the same address (for HDFS disks) and then delete it from the storage settings.
Page top
Detaching, archiving, and attaching partitions
If you want to optimize disk space and speed up queries in KUMA, you can detach data partitions in ClickHouse, archive partitions, or move partitions to a drive. If necessary, you can later reattach the partitions you need and perform data processing.
Detaching partitions
To detach partitions:
- Determine the shard on all replicas of which you want to detach the partition.
- Get the partition ID using the following command:
sudo /opt/kaspersky/kuma/clickhouse/bin/client.sh -d kuma --multiline --query "SELECT partition, name FROM system.parts;" |grep 20231130In this example, the command returns the partition ID for November 30, 2023.
- One each replica of the shard, detach the partition using the following command and specifying the partition ID:
sudo /opt/kaspersky/kuma/clickhouse/bin/client.sh -d kuma --multiline --query "ALTER TABLE events_local_v2 DETACH PARTITION ID '<partition ID>'"
As a result, the partition is detached on all replicas of the shard. Now you can move the data directory to a drive or archive the partition.
Archiving partitions
To archive detached partitions:
- Find the detached partition in disk subsystem of the server:
sudo find /opt/kaspersky/kuma/clickhouse/data/ -name <ID of the detached partition>\* Change to the 'detached' directory that contains the detached partition, and while in the 'detached' directory, perform the archival:sudo cd <path to the 'detached' directory containing the detached partition>sudo zip -9 -r detached.zip *For example:
sudo cd /opt/kaspersky/kuma/clickhouse/data/store/d5b/d5bdd8d8-e1eb-4968-95bd-d8d8e1eb3968/detached/sudo zip -9 -r detached.zip *
The partition is archived.
Attaching partitions
To attach archived partitions to KUMA:
- Increase the Retention period value.
KUMA deletes data based on the date specified in the Timestamp field, which records the time when the event is received, and based on the Retention period value that you set for the storage.
Before restoring archived data, make sure that the Retention period value overlaps the date in the Timestamp field. If this is not the case, the archived data will be deleted within 1 hour.
- Place the archive partition in the 'detached' section of your storage and extract the archive:
sudounzip detached.zip -d<path to the 'detached' directory>For example:
sudounzip detached.zip -d/opt/kaspersky/kuma/clickhouse/data/store/d5b/d5bdd8d8-e1eb-4968-95bd-d8d8e1eb3968/detached/ - Run the command to attach the partition:
sudo /opt/kaspersky/kuma/clickhouse/bin/client.sh -d kuma --multiline --query "ALTER TABLE events_local_v2 ATTACH PARTITION ID '<partition ID>'"Repeat the steps of extracting the archive and attaching the partition on each replica of the shard.
As a result, the archived partition is attached and its events are again available for search.
Page top
Creating a set of resources for a storage
In the KUMA web interface, a storage service is created based on the resource set for the storage.
To create a resource set for a storage in the KUMA web interface:
- In the KUMA web interface, under Resources → Storages, click Add storage.
This opens the Create storage window.
- On the Basic settings tab, in the Storage name field, enter a unique name for the service you are creating. The name must contain 1 to 128 Unicode characters.
- In the Tenant drop-down list, select the tenant that will own the storage.
- In the Tags drop-down list, select the tags for the resource set that you are creating.
The list includes all available tags created in the tenant of the resource and in the Shared tenant. You can find a tag in the list by typing its name in the field. If the tag you entered does not exist, you can press Enter or click Add to create it.
- You can optionally add up to 256 Unicode characters describing the service in the Description field.
- In the Storage condition options field, select an event storage condition in the ClickHouse cluster for the storage, which, when satisfied, will cause events to be transferred to cold storage disks or deleted if cold storage is not configured or is configured incorrectly. The condition is applied to the default space and to events from deleted spaces.
By default, ClickHouse moves events to cold storage disks or deletes them if more than 97% of the storage is full. KUMA also applies an additional 365 days storage condition when creating a storage. You can configure custom storage conditions for more stable performance of the storage.
To set the storage condition, do one of the following:
- If you want to limit the storage period for events, select Days from the drop-down list, and in the field, specify the maximum event storage period (in days) in the ClickHouse hot storage cluster.
After the specified period, events are automatically transferred to cold storage disks or deleted from the ClickHouse cluster, starting with the partitions with the oldest date. The minimum value is 1. The default value is 365.
- If you want to limit the maximum storage size, select GB from the drop-down list, and in the field, specify the maximum storage size in gigabytes.
When the storage reaches the specified size, events are automatically transferred to cold storage disks or deleted from the ClickHouse cluster, starting with the partitions with the oldest date. The minimum value and default value is 1.
- If you want to limit the storage size to a percentage of disk space that is available to the storage (according to VictoriaMetrics), select Percentage from the drop-down list, and in the field, specify the maximum storage size as a percentage of the available disk space. In this case, the condition can also be triggered when the disk space available to the storage is decreased.
When the storage reaches the specified percentage of disk space available to it, events are automatically transferred to cold storage disks or deleted from the ClickHouse cluster, starting with the partitions with the oldest date. Possible values: 1 to 95. The default value is 80. If you want to use percentages for all storage spaces, the sum total of percentages in the conditions of all spaces may not exceed 95, but we recommend specifying a limit of at most 90% for the entire storage or for individual spaces.
We do not recommend specifying small percentage values because this increases the probability of data loss in the storage.
For [OOTV] Storage, the default event storage period is 2 days. If you want to use this storage, you can change the event storage condition for it, if necessary.
- If you want to limit the storage period for events, select Days from the drop-down list, and in the field, specify the maximum event storage period (in days) in the ClickHouse hot storage cluster.
- If you want to use an additional storage condition, click Add storage condition and specify an additional storage condition as described in step 6.
The maximum number of conditions is two, and you can combine only conditions the following types:
- Days and storage size in GB
- Days and storage size as a percentage
If you want to delete a storage condition, click the X icon next to this condition.
- In the Audit retention period field, specify the period, in days, to store audit events. The minimum value and default value is
365. - If cold storage is required, specify the event storage term:
- Event retention time specifies the total KUMA event storage duration in days, counting from the moment when the event is received. When the specified period expires, events are automatically deleted from the cold storage disk. The default value is 0.
The event retention time is calculated as the sum of the event retention time in the ClickHouse hot storage cluster until the condition specified in the Storage condition options setting is triggered, and the event retention time on the cold storage disk. After one of storage conditions is triggered, the data partition for the earliest date is moved to the cold storage disk, and there it remains until the event retention time in KUMA expires.
Depending on the specified storage condition, the resulting retention time is as follows:
- If you specified a storage condition in days, the Event retention time must be strictly greater than the number of days specified in the storage condition. You can calculate the cold retention period for events as the Event retention time minus the number of days specified in the Storage condition options setting.
If you do not want to store events on the cold storage disk, you can specify the same number of days in the Event retention time field as in the storage condition.
- If you specified the storage condition in terms of disk size (absolute or percentage), the minimum value of the Event retention time is 1. The cold storage duration for events is calculated as Event retention time minus the number of days from the receipt of the event to triggering of the condition and the disk partition filling up, but until the condition is triggered, calculating an exact duration is impossible. In this case, we recommend specifying a relatively large value for Event retention time to avoid events being deleted.
If you do not want to store events on the cold storage disk, you can set Event retention time to 0.
- If you specified a storage condition in days, the Event retention time must be strictly greater than the number of days specified in the storage condition. You can calculate the cold retention period for events as the Event retention time minus the number of days specified in the Storage condition options setting.
- Audit cold retention period—the number of days to store audit events. The minimum value is 0.
The Event retention time and Audit cold retention period settings become available only after at least one cold storage disk has been added.
- Event retention time specifies the total KUMA event storage duration in days, counting from the moment when the event is received. When the specified period expires, events are automatically deleted from the cold storage disk. The default value is 0.
- If you want to change ClickHouse settings, in the ClickHouse configuration override field, paste the lines with settings from the ClickHouse configuration XML file /opt/kaspersky/kuma/clickhouse/cfg/config.xml. Specifying the root elements <yandex>, </yandex> is not required. Settings passed in this field are used instead of the default settings.
Example:
<merge_tree>
<parts_to_delay_insert>600</parts_to_delay_insert>
<parts_to_throw_insert>1100</parts_to_throw_insert>
</merge_tree>
- Use the Debug toggle switch to specify whether resource logging must be enabled. If you want to only log errors for all KUMA components, disable debugging. If you want to get detailed information in the logs, enable debugging.
- If necessary, in the ClickHouse cluster nodes section, add ClickHouse cluster nodes to the storage.
There can be multiple nodes. You can add nodes by clicking the Add node button or remove nodes by clicking the X icon of the relevant node.
Available settings:
- In the FQDN field, enter the fully qualified domain name of the node that you want to add. For example,
kuma-storage-cluster1-server1.example.com. - In the Shard ID, Replica ID, and Keeper ID fields, specify the role of the node in the ClickHouse cluster. The shard and keeper IDs must be unique within the cluster, the replica ID must be unique within the shard. The following example shows how to populate the ClickHouse cluster nodes section for a storage with dedicated keepers in a distributed installation. You can adapt this example according to your needs.
Distributed Installation diagram
Example:
ClickHouse cluster nodes
FQDN: kuma-storage-cluster1-server1.example.com
Shard ID: 0
Replica ID: 0
Keeper ID: 1
FQDN: kuma-storage-cluster1server2.example.com
Shard ID: 0
Replica ID: 0
Keeper ID: 2
FQDN: kuma-storage-cluster1server3.example.com
Shard ID: 0
Replica ID: 0
Keeper ID: 3
FQDN: kuma-storage-cluster1server4.example.com
Shard ID: 1
Replica ID: 1
Keeper ID: 0
FQDN: kuma-storage-cluster1server5.example.com
Shard ID: 1
Replica ID: 2
Keeper ID: 0
FQDN: kuma-storage-cluster1server6.example.com
Shard ID: 2
Replica ID: 1
Keeper ID: 0
FQDN: kuma-storage-cluster1server7.example.com
Shard ID: 2
Replica ID: 2
Keeper ID: 0
- In the FQDN field, enter the fully qualified domain name of the node that you want to add. For example,
- If necessary, in the Spaces section, add spaces to the storage to distribute the stored events.
There can be multiple spaces. You can add spaces by clicking the Add space button or remove nodes by clicking the X icon of the relevant space.
Available settings:
- In the Name field, specify a name for the space containing 1 to 128 Unicode characters.
- In the Storage condition options field, select an event storage condition in the ClickHouse cluster for the space, which, when satisfied, will cause events to be transferred to cold storage disks or deleted if cold storage is not configured or is configured incorrectly. KUMA applies the 365 days storage condition when a space is added.
To set the storage condition for a space, do one of the following:
- If you want to limit the storage period for events, select Days from the drop-down list, and in the field, specify the maximum event storage period (in days) in the ClickHouse hot storage cluster.
After the specified period, events are automatically transferred to cold storage disks or deleted from the ClickHouse cluster, starting with the partitions with the oldest date. The minimum value is 1. The default value is 365.
- If you want to limit the maximum storage space size, select GB from the drop-down list, and in the field, specify the maximum space size in gigabytes.
When the space reaches the specified size, events are automatically transferred to cold storage disks or deleted from the ClickHouse cluster, starting with the partitions with the oldest date. The minimum value and default value is 1.
- If you want to limit the space size to a percentage of disk space that is available to the storage (according to VictoriaMetrics), select Percentage from the drop-down list, and in the field, specify the maximum space size as a percentage of the size of the disk available to the storage. In this case, the condition can also be triggered when the disk space available to the storage is decreased.
When the space reaches the specified percentage of disk space available to the storage, events are automatically transferred to cold storage disks or deleted from the ClickHouse cluster, starting with the partitions with the oldest date. Possible values: 1 to 95. The default value is 80. If you want to use percentages for all storage spaces, the sum total of percentages in the conditions of all spaces may not exceed 95, but we recommend specifying a limit of at most 90% for the entire storage or for individual spaces.
We do not recommend specifying small percentage values because this increases the probability of data loss in the storage.
When using size as the storage condition, you must ensure that the total size of all spaces specified in the storage conditions does not exceed the physical size of the storage, otherwise an error will be displayed when starting the service.
In storage conditions with a size limitation, use the same units of measure for all spaces of a storage (only gigabytes or only percentage values). Otherwise, if the condition is specified as a percentage for one space, and in gigabytes for another space, the storage may overflow due to mismatch of values, leading to data loss.
- If you want to limit the storage period for events, select Days from the drop-down list, and in the field, specify the maximum event storage period (in days) in the ClickHouse hot storage cluster.
- If you want to make a space inactive if it is outdated and no longer relevant, select the Read only check box.
This prevents events from going into that space. To make the space active again, clear the Read only check box. This check box is cleared by default.
- If necessary, in the Event retention time field, specify the total KUMA event storage duration in days, counting from the moment when the event is received. When the specified period expires, events are automatically deleted from the cold storage disk. The default value is 0.
The event retention time is calculated as the sum of the event retention time in the ClickHouse hot storage cluster until the condition specified in the Storage condition options setting is triggered, and the event retention time on the cold storage disk. After one of storage conditions is triggered, the data partition for the earliest date is moved to the cold storage disk, and there it remains until the event retention time in KUMA expires.
Depending on the specified storage condition, the resulting retention time is as follows:
- If you specified a storage condition in days, the Event retention time must be strictly greater than the number of days specified in the storage condition. The cold storage duration for events is calculated as the Event retention time minus the number of days specified in the Storage condition options setting.
If you do not want to store events from this space on the cold storage disk, you can specify the same number of days in the Event retention time field as in the storage condition.
- If you specified the storage condition in terms of disk size (absolute or percentage), the minimum value of the Event retention time is 1. The cold storage duration for events is calculated as Event retention time minus the number of days from the receipt of the event to triggering of the condition and the disk partition filling up, but until the condition is triggered, calculating an exact duration is impossible. In this case, we recommend specifying a relatively large value for Event retention time to avoid events being deleted.
If you do not want to store events from this space on the cold storage disk, you can set Event retention time to 0.
The Event retention time setting becomes available only after adding at least one cold storage disk.
- If you specified a storage condition in days, the Event retention time must be strictly greater than the number of days specified in the storage condition. The cold storage duration for events is calculated as the Event retention time minus the number of days specified in the Storage condition options setting.
- In the Filter settings section, you can specify conditions to identify events that will be put into this space. To create a new filter, in the Filter drop-down list, select an existing filter or Create new.
Creating a filter in resources
To create a filter:
- In the Filter drop-down list, select Create new.
- If you want to keep the filter as a separate resource, select the Save filter check box. In this case, you will be able to use the created filter in various services. This check box is cleared by default.
- If you selected the Save filter check box, enter a name for the created filter resource in the Name field. Maximum length of the name: 128 Unicode characters.
- Under Conditions, specify the conditions that the events must meet:
- Click the Add condition button.
- In the Left operand and Right operand drop-down lists, specify the search parameters. Depending on the data source selected in the Right operand field, fields of additional parameters for identifying the value to be passed to the filter may be displayed. For example, when you select active list, you must specify the name of the active list, the entry key, and the entry key field.
- In the Operator drop-down list, select an operator.
- If you want the operator to be case-insensitive, select the do not match case check box. The selection of this check box does not apply to the InSubnet, InActiveList, InCategory or InActiveDirectoryGroup operators. This check box is cleared by default.
- If you want to add a negative condition, select If not from the If drop-down list.
You can add multiple conditions or a group of conditions.
- If you have added multiple conditions or groups of conditions, choose a selection condition (and, or, not) by clicking the AND button.
- If you want to add existing filters that are selected from the Select filter drop-down list, click the Add filter button. You can view the nested filter settings by clicking the
 button.
After the service is created, you can view and delete spaces in the storage resource settings.
There is no need to create a separate space for audit events. Events of this type (Type=4) are automatically placed in a separate Audit space with a storage term of at least 365 days. This space cannot be edited or deleted from the KUMA web interface.
- If necessary, in the Disks for cold storage section, add to the storage the disks where you want to transfer events from the ClickHouse cluster for long-term storage.
There can be multiple disks. You can add disks by clicking the Add disk button and remove them by clicking the Delete disk button.
Available settings:
- In the FQDN drop-down list, select the type of domain name of the disk you are connecting:
- Local—for the disks mounted in the operating system as directories.
- HDFS—for the disks of the Hadoop Distributed File System.
- In the Name field, specify the disk name. The name must contain 1 to 128 Unicode characters.
- If you select the Local domain name type for the disk, specify the absolute directory path of the mounted local disk in the Path field. The path must begin and end with a "/" character.
The directory of the mounted local disk must be owned by the KUMA user.
- If you select HDFS domain name type for the disk, specify the path to HDFS in the Host field. For example,
hdfs://hdfs1:9000/clickhouse/.
- In the FQDN drop-down list, select the type of domain name of the disk you are connecting:
- Go to the Advanced settings tab and fill in the following fields:
- In the Buffer size field, enter the buffer size in bytes at which events must be sent to the database. The default value is 128 MB. No maximum value is configured. If the virtual machine has less free RAM than the specified Buffer size, KUMA sets the limit to 128 MB.
If the expected traffic to the storage service is greater than 1 Gbps, we recommend changing the Buffer size setting (in bytes) to the expected value and setting the Buffer flush interval to 2.
The value of the Buffer size setting can be determined empirically. KUMAIf the Insert QPS metric of the storage is greater than 1 and you see that a queue of requests building up, follow the recommendations for calculating and adjusting the Buffer size setting in the Insert QPS section provided in the Viewing KUMA metrics article.
- In the Maximum buffer size field, specify the maximum buffer size in bytes. The default value is 256 MB.
By default, events are written to the database once per second. If the EPS rises and events are registered more often than once per second, the buffer size is automatically increased. The buffer is increased up to three times the Buffer size value, but cannot exceed the Maximum buffer size value. When the load goes back to normal, the buffer size stays the same; there is no automatic reduction of buffer size.
If the Maximum buffer size is less than or equal to the Buffer size, the buffer size does not change.
Restarting the storage service resets the increased buffer size to the value in the Buffer size field.
- In the Buffer flush interval field, enter the time in seconds for which KUMA waits for the buffer to fill up. If the buffer is not full, but the specified time has passed, KUMA sends events to the database. The default value is 1 second.
- In the Required memory size field, specify the minimum amount of free RAM in bytes. The default value is 128 MB.
If the node on which the storage is installed has less free RAM than this setting, database insert request returns an error, and the events are recorded later. Limiting the memory size allows avoiding the situation when the memory fills up if, for any reason, the recording of events in the database is blocked and data begins to accumulate in memory.
- In the Disk buffer size limit field, enter a value in bytes. The disk buffer is used to temporarily store events that could not be sent for further processing or storage. If the disk space allocated for the disk buffer is exhausted, events are rotated as follows: new events replace the oldest events written to the buffer. The default value is 10 GB.
- Use the Disk buffer toggle switch to enable or disable the disk buffer. By default, the disk buffer is enabled.
- Use the Write to local database table toggle switch to enable or disable writing to the local database table. Writing is disabled by default.
If enabled, data is written only on the host on which the storage is located. We recommend using this functionality only if you have configured balancing on the collector and/or correlator — at step 6. Routing, in the Advanced settings section, the URL selection policy field is set to Round robin.
If you disable writing, the data is distributed across the shards of the cluster.
- If necessary, use the Debug toggle switch to enable logging of service operations.
- You can use the Create dump periodically toggle switch at the request of Technical Support to generate resource (CPU, RAM, etc.) utilization reports in the form of dumps.
- In the Dump settings field, you can specify the settings to be used when creating dumps. For instructions on filling out this field, please contact Technical Support.
- In the Buffer size field, enter the buffer size in bytes at which events must be sent to the database. The default value is 128 MB. No maximum value is configured. If the virtual machine has less free RAM than the specified Buffer size, KUMA sets the limit to 128 MB.
The set of resources for the storage is created and is displayed under Resources → Storages. Now you can create a storage service.
Page top
Creating a storage service in the KUMA web interface
When a resource set is created for a storage, you can proceed to create a storage service in KUMA.
To create a storage service in the KUMA web interface:
- In the KUMA web interface, under Resources → Active services, click Add service.
- In the opened Choose a service window, select the resource set that you just created for the storage and click Create service.
The storage service is created in the KUMA web interface and is displayed under Resources → Active services. Now storage services must be installed to each node of the ClickHouse cluster by using the service ID.
Page top
Installing a storage in the KUMA network infrastructure
To create a storage:
- Log in to the server where you want to install the service.
- Execute the following command:
sudo /opt/kaspersky/kuma/kuma storage --core https://<KUMA Core server FQDN>:<port used by KUMA Core for internal communication (port 7210 by default)> --id <service ID copied from the KUMA web interface> --installExample:
sudo /opt/kaspersky/kuma/kuma storage --core https://kuma.example.com:7210 --id XXXXX --installWhen deploying several KUMA services on the same host, during the installation process you must specify unique ports for each component using the
--api.port <port>parameter. The following setting values are used by default:--api.port 7221. - Repeat steps 1–2 for each storage node.
Only one storage service can be installed on a host.
The storage is installed.
Page top
Creating a correlator
A correlator consists of two parts: one part is created inside the KUMA web interface, and the other part is installed on the network infrastructure server intended for processing events.
Actions in the KUMA web interface
A correlator is created in the KUMA web interface by using the Installation Wizard, which combines the necessary resources into a resource set for the correlator. Upon completion of the Wizard, the service is automatically created based on this resource set.
To create a correlator in the KUMA web interface:
Start the Correlator Installation Wizard:
- In the KUMA web interface, under Resources, click Create correlator.
- In the KUMA web interface, under Resources → Correlators, click Add correlator.
As a result of completing the steps of the Wizard, a correlator service is created in the KUMA web interface.
A resource set for a correlator includes the following resources:
- Correlation rules
- Enrichment rules (if required)
- Response rules (if required)
- Destinations (normally one for sending events to a storage)
These resources can be prepared in advance, or you can create them while the Installation Wizard is running.
Actions on the KUMA correlator server
If you are installing the correlator on a server that you intend to use for event processing, you need to run the command displayed at the last step of the Installation Wizard on the server. When installing, you must specify the identifier automatically assigned to the service in the KUMA web interface, as well as the port used for communication.
Testing the installation
After creating a correlator, it is recommended to make sure that it is working correctly.
Starting the Correlator Installation Wizard
To start the Correlator Installation Wizard:
- In the KUMA web interface, under Resources, click Add correlator.
- In the KUMA web interface, under Resources → Correlators, click Add correlator.
Follow the instructions of the Wizard.
Aside from the first and last steps of the Wizard, the steps of the Wizard can be performed in any order. You can switch between steps by using the Next and Previous buttons, as well as by clicking the names of the steps in the left side of the window.
After the Wizard completes, a resource set for the correlator is created in the KUMA web interface under Resources → Correlators, and a correlator service is added under Resources → Active services.
Step 1. General correlator settings
This is a required step of the Installation Wizard. At this step, you specify the main settings of the correlator: the correlator name and the tenant that will own it.
To specify the general settings of the correlator:
- On the Basic settings tab, fill in the following fields:
- In the Name field, enter a unique name for the service you are creating. The name must contain 1 to 128 Unicode characters.
- In the Tenant drop-down list, select the tenant that will own the correlator. The tenant selection determines what resources will be available when the collector is created.
- If you return to this window from another subsequent step of the Installation Wizard and select another tenant, you will have to manually edit all the resources that you have added to the service. Only resources from the selected tenant and the Shared tenant can be added to the service.
- If required, specify the number of processes that the service can run concurrently in the Workers field. By default, the number of worker processes is the same as the number of vCPUs on the server where the service is installed.
- You can optionally add up to 256 Unicode characters describing the service in the Description field.
- On the Advanced settings tab, fill in the following fields:
- If necessary, use the Debug toggle switch to enable logging of service operations.
- You can use the Create dump periodically toggle switch at the request of Technical Support to generate resource (CPU, RAM, etc.) utilization reports in the form of dumps.
- In the Dump settings field, you can specify the settings to be used when creating dumps. The specifics of filling in this field must be provided by Technical Support.
General settings of the correlator are specified. Proceed to the next step of the Installation Wizard.
Page top
Step 2. Global variables
If tracking values in event fields, active lists, or dictionaries is not enough to cover some specific security scenarios, you can use global and local variables. You can use them to take various actions on the values received by the correlators by implementing complex logic for threat detection. Variables can be assigned a specific function and then queried from correlation rules as if they were ordinary event fields, with the triggered function result received in response.
To add a global variable in the correlator,
click the Add variable button and specify the following parameters:
- In the Variable window, enter the name of the variable.
- In the Value window, enter the variable function.
When entering functions, you can use autocomplete as a list of hints with possible function names, their brief description and usage examples. You can select a function from the list and insert it together with its list of arguments into the input field.
To display the list of all hints in the field, press Ctrl+Space. Press Enter to select a function from the list. Press Tab to go to the next argument in the list of arguments of the selected function.
The global variable is added. It can be queried from correlation rules by adding the $ character in front of the variable name. There can be multiple variables. Added variables can be edited or deleted by using the  icon.
icon.
Proceed to the next step of the Installation Wizard.
Page top
Step 3. Correlation
This is an optional but recommended step of the Installation Wizard. On the Correlation tab of the Installation Wizard, select or create correlation rules. These resources define the sequences of events that indicate security-related incidents. When these sequences are detected, the correlator creates a correlation event and an alert.
If you have added global variables to the correlator, all added correlation rules can query them.
Correlation rules that are added to the resource set for the correlator are displayed in the table with the following columns:
- Correlation rules—name of the correlation rule resource.
- Type—type of correlation rule: standard, simple, operational. The table can be filtered based on the values of this column by clicking the column header and selecting the relevant values.
- Actions—list of actions that will be performed by the correlator when the correlation rule is triggered. These actions are indicated in the correlation rule settings. The table can be filtered based on the values of this column by clicking the column header and selecting the relevant values.
Available values:
- Output—correlation events created by this correlation rule are transmitted to other correlator resources: enrichment, response rule, and then to other KUMA services.
- Edit active list—the correlation rule changes the active lists.
- Loop to correlator—the correlation event is sent to the same correlation rule for reprocessing.
- Categorization—the correlation rule changes asset categories.
- Event enrichment—the correlation rule is configured to enrich correlation events.
- Do not create alert—when a correlation event is created as a result of a correlation rule triggering, no alert is created for that. If you do not want to create an alert when a correlation rule is triggered, but you still want to send a correlation event to the storage, select the Output and No alert check boxes. If you select only the No alert check box, a correlation event is not saved in the storage.
- Shared resource—the correlation rule or the resources used in the correlation rule are located in the Shared tenant.
You can use the Search field to search for a correlation rule. Added correlation rules can be removed from the resource set by selecting the relevant rules and clicking Delete.
Selecting a correlation rule opens a window with its settings, which can be edited and then saved by clicking Save. If you click Delete in this window, the correlation rule is unlinked from the resource set.
Use the Move up and Move down buttons to change the position of the selected correlation rules in the table. It affects their execution sequence when events are processed. Using the Move operational to top button, you can move correlation rules of the operational type to the beginning of the correlation rules list.
To link the existing correlation rules to the resource set for the correlator:
- Click Link.
The resource selection window opens.
- Select the relevant correlation rules and click OK.
The correlation rules will be linked to the resource set for the correlator and will be displayed in the rules table.
To create a new correlation rule in a resource set for a correlator:
- Click Add.
The correlation rule creation window opens.
- Specify the correlation rule settings and click Save.
The correlation rule will be created and linked to the resource set for the correlator. It is displayed in the correlation rules table and in the list of resources under Resources → Correlation rules.
Proceed to the next step of the Installation Wizard.
Page top
Step 4. Enrichment
This is an optional step of the Installation Wizard. On the Enrichment tab of the Installation Wizard, you can select or create enrichment rules and indicate which data from which sources you want to add to correlation events that the correlator creates. There can be more than one enrichment rule. You can add them by clicking the Add button and can remove them by clicking the button.
To add an existing enrichment rule to a resource set:
- Click Add.
This opens the enrichment rule settings block.
- In the Enrichment rule drop-down list, select the relevant resource.
The enrichment rule is added to the resource set for the correlator.
To create a new enrichment rule in a resource set:
- Click Add.
This opens the enrichment rule settings block.
- In the Enrichment rule drop-down list, select Create new.
- In the Source kind drop-down list, select the source of data for enrichment and define its corresponding settings:
- constant
- dictionary
- event
- template
- dns
- cybertrace
For systems with a high load on the collector or correlator, we recommend using the cybertrace-http enrichment type.
This type of enrichment is used to add information from CyberTrace data streams to event fields.
Available settings:
- URL (required)—in this field, you can specify the URL of a CyberTrace server to which you want to send requests. The default CyberTrace port is 9999.
- Number of connections—maximum number of connections to the CyberTrace server that can be simultaneously established by KUMA. By default, this value is equal to the number of vCPUs of the KUMA Core server.
- RPS—maximum number of requests sent to the server per second. The default value is
1,000. - Timeout—amount of time to wait for a response from the CyberTrace server, in seconds. The default value is
30. - Maximum number of events in the enrichment queue—maximum number of events stored in the enrichment queue for re-sending. The default value is 1,000,000.
- Mapping (required)—this settings block contains the mapping table for mapping KUMA event fields to CyberTrace indicator types. The KUMA field column shows the names of KUMA event fields, and the CyberTrace indicator column shows the types of CyberTrace indicators.
Available types of CyberTrace indicators:
- ip
- url
- hash
In the mapping table, you must provide at least one string. You can use the Add row button to add a string, and can use the
button to remove a string.
- cybertrace-http
- timezone
- Use the Debug toggle switch to indicate whether or not to enable logging of service operations. Logging is disabled by default.
- In the Filter section, you can specify conditions to identify events that will be processed using the enrichment rule. You can select an existing filter from the drop-down list or create a new filter.
Creating a filter in resources
To create a filter:
- In the Filter drop-down list, select Create new.
- If you want to keep the filter as a separate resource, select the Save filter check box. In this case, you will be able to use the created filter in various services. This check box is cleared by default.
- If you selected the Save filter check box, enter a name for the created filter resource in the Name field. Maximum length of the name: 128 Unicode characters.
- Under Conditions, specify the conditions that the events must meet:
- Click the Add condition button.
- In the Left operand and Right operand drop-down lists, specify the search parameters. Depending on the data source selected in the Right operand field, fields of additional parameters for identifying the value to be passed to the filter may be displayed. For example, when you select active list, you must specify the name of the active list, the entry key, and the entry key field.
- In the Operator drop-down list, select an operator.
- If you want the operator to be case-insensitive, select the do not match case check box. The selection of this check box does not apply to the InSubnet, InActiveList, InCategory or InActiveDirectoryGroup operators. This check box is cleared by default.
- If you want to add a negative condition, select If not from the If drop-down list.
You can add multiple conditions or a group of conditions.
- If you have added multiple conditions or groups of conditions, choose a selection condition (and, or, not) by clicking the AND button.
- If you want to add existing filters that are selected from the Select filter drop-down list, click the Add filter button. You can view the nested filter settings by clicking the button.
The new enrichment rule was added to the resource set for the correlator.
Proceed to the next step of the Installation Wizard.
Page top
Step 5. Response
This is an optional step of the Installation Wizard. On the Response tab of the Installation Wizard, you can select or create response rules and indicate which actions must be performed when the correlation rules are triggered. There can be multiple response rules. You can add them by clicking the Add button and can remove them by clicking the button.
To add an existing response rule to a resource set:
- Click Add.
The response rule settings window opens.
- In the Response rule drop-down list, select the relevant resource.
The response rule is added to the resource set for the correlator.
To create a new response rule in a resource set:
- Click Add.
The response rule settings window opens.
- In the Response rule drop-down list, select Create new.
- In the Type drop-down list, select the type of response rule and define its corresponding settings:
- KSC response—response rules for automatically launching the tasks on Kaspersky Security Center assets. For example, you can configure automatic startup of a virus scan or database update.
Tasks are automatically started when KUMA is integrated with Kaspersky Security Center. Tasks are run only on assets that were imported from Kaspersky Security Center.
- Run script—response rules for automatically running a script. For example, you can create a script containing commands to be executed on the KUMA server when selected events are detected.
The script file is stored on the server where the correlator service using the response resource is installed: /opt/kaspersky/kuma/correlator/<Correlator ID>/scripts.
The
kumauser of this server requires the permissions to run the script. - KEDR response—response rules for automatically creating prevention rules, starting network isolation, or starting the application on Kaspersky Endpoint Detection and Response and Kaspersky Security Center assets.
Automatic response actions are carried out when KUMA is integrated with Kaspersky Endpoint Detection and Response.
- Response via KICS/KATA—response rules for automatically starting tasks on KICS for Networks assets. For example, you can change the asset status in KICS for Networks.
Tasks are automatically started when KUMA is integrated with KICS for Networks.
- Response via Active Directory—response rules for changing the permissions of Active Directory users. For example, block a user.
Tasks are started if integration with Active Directory is configured.
- KSC response—response rules for automatically launching the tasks on Kaspersky Security Center assets. For example, you can configure automatic startup of a virus scan or database update.
- In the Workers field, specify the number of processes that the service can run simultaneously.
By default, the number of workers is the same as the number of virtual processors on the server where the service is installed.
This field is optional.
- In the Filter section, you can specify conditions to identify events that will be processed using the response rule. You can select an existing filter from the drop-down list or create a new filter.
Creating a filter in resources
To create a filter:
- In the Filter drop-down list, select Create new.
- If you want to keep the filter as a separate resource, select the Save filter check box. In this case, you will be able to use the created filter in various services. This check box is cleared by default.
- If you selected the Save filter check box, enter a name for the created filter resource in the Name field. Maximum length of the name: 128 Unicode characters.
- Under Conditions, specify the conditions that the events must meet:
- Click the Add condition button.
- In the Left operand and Right operand drop-down lists, specify the search parameters. Depending on the data source selected in the Right operand field, fields of additional parameters for identifying the value to be passed to the filter may be displayed. For example, when you select active list, you must specify the name of the active list, the entry key, and the entry key field.
- In the Operator drop-down list, select an operator.
- If you want the operator to be case-insensitive, select the do not match case check box. The selection of this check box does not apply to the InSubnet, InActiveList, InCategory or InActiveDirectoryGroup operators. This check box is cleared by default.
- If you want to add a negative condition, select If not from the If drop-down list.
You can add multiple conditions or a group of conditions.
- If you have added multiple conditions or groups of conditions, choose a selection condition (and, or, not) by clicking the AND button.
- If you want to add existing filters that are selected from the Select filter drop-down list, click the Add filter button. You can view the nested filter settings by clicking the button.
The new response rule was added to the resource set for the correlator.
Proceed to the next step of the Installation Wizard.
Page top
Step 6. Routing
This is an optional step of the Installation Wizard. On the Routing tab of the Installation Wizard, you can select or create destinations with settings indicating the forwarding destination of events created by the correlator. Events from a correlator are usually redirected to storage so that they can be saved and later viewed if necessary. Events can be sent to other locations as needed. There can be more than one destination point.
To add an existing destination to a resource set for a correlator:
- In the Add destination drop-down list, select the type of destination resource you want to add:
- Select Storage if you want to configure forwarding of processed events to the storage.
- Select Correlator if you want to configure forwarding of processed events to a correlator.
- Select Other if you want to send events to other locations.
This type of resource includes correlator and storage services that were created in previous versions of the application.
The Add destination window opens where you can specify parameters for events forwarding.
- In the Destination drop-down list, select the necessary destination.
The window name changes to Edit destination, and it displays the settings of the selected resource. The resource can be opened for editing in a new browser tab using the
button. - Click Save.
The selected destination is displayed on the Installation Wizard tab. A destination resource can be removed from the resource set by selecting it and clicking Delete in the opened window.
To add a new destination to a resource set for a correlator:
- In the Add destination drop-down list, select the type of destination resource you want to add:
- Select Storage if you want to configure forwarding of processed events to the storage.
- Select Correlator if you want to configure forwarding of processed events to a correlator.
- Select Other if you want to send events to other locations.
This type of resource includes correlator and storage services that were created in previous versions of the application.
The Add destination window opens where you can specify parameters for events forwarding.
- Specify the settings on the Basic settings tab:
- In the Destination drop-down list, select Create new.
- In the Name field, enter a unique name for the destination resource. The name must contain 1 to 128 Unicode characters.
- Use the Disabled toggle button to specify whether events will be sent to this destination. By default, sending events is enabled.
- Select the Type for the destination resource:
- Select storage if you want to configure forwarding of processed events to the storage.
- Select correlator if you want to configure forwarding of processed events to a correlator.
- Select nats-jetstream, tcp, http, kafka, or file if you want to configure sending events to other locations.
- Specify the URL to which events should be sent in the hostname:<API port> format.
You can specify multiple destination addresses using the URL button for all types except nats-jetstream and file.
- For the nats-jetstream and kafka types, use the Topic field to specify which topic the data should be written to. The topic must contain Unicode characters. The Kafka topic is limited to 255 characters.
- If necessary, specify the settings on the Advanced settings tab. The available settings vary based on the selected destination resource type:
- Compression is a drop-down list where you can enable Snappy compression. By default, compression is disabled.
- Proxy is a drop-down list for proxy server selection.
- The Buffer size field is used to set buffer size (in bytes) for the destination. The default value is 1 MB, and the maximum value is 64 MB.
- Timeout field is used to set the timeout (in seconds) for another service or component response. The default value is
30. - Disk buffer size limit field is used to specify the size of the disk buffer in bytes. The default size is 10 GB.
- Cluster ID is the ID of the NATS cluster.
- TLS mode is a drop-down list where you can specify the conditions for using TLS encryption:
- Disabled (default)—do not use TLS encryption.
- Enabled—encryption is enabled, but without verification.
- With verification—use encryption with verification that the certificate was signed with the KUMA root certificate. The root certificate and key of KUMA are created automatically during application installation and are stored on the KUMA Core server in /opt/kaspersky/kuma/core/certificates/.
When using TLS, it is impossible to specify an IP address as a URL.
- URL selection policy is a drop-down list in which you can select a method for determining which URL to send events to if several URLs have been specified:
- Any. Events are sent to one of the available URLs as long as this URL receives events. If the connection is broken (for example, the receiving node is disconnected) a different URL will be selected as the events destination.
- Prefer first. Events are sent to the first URL in the list of added addresses. If it becomes unavailable, events are sent to the next available node in sequence. When the first URL becomes available again, events start to be sent to it again.
- Balanced means that packages with events are evenly distributed among the available URLs from the list. Because packets are sent either on a destination buffer overflow or on the flush timer, this URL selection policy does not guarantee an equal distribution of events to destinations.
- Delimiter is used to specify the character delimiting the events. By default,
\nis used. - Path—the file path if the file destination type is selected.
- Buffer flush interval—this field is used to set the time interval (in seconds) at which the data is sent to the destination. The default value is
100. - Workers—this field is used to set the number of services processing the queue. By default, this value is equal to the number of vCPUs of the KUMA Core server.
- You can set health checks using the Health check path and Health check timeout fields. You can also disable health checks by selecting the Health Check Disabled check box.
- Debug—a toggle switch that lets you specify whether resource logging must be enabled. By default, this toggle switch is in the Disabled position.
- The Disk buffer disabled drop-down list is used to enable or disable the use of a disk buffer. By default, the disk buffer is disabled.
- In the Filter section, you can specify the conditions to define events that will be processed by this resource. You can select an existing filter from the drop-down list or create a new filter.
Creating a filter in resources
To create a filter:
- In the Filter drop-down list, select Create new.
- If you want to keep the filter as a separate resource, select the Save filter check box. In this case, you will be able to use the created filter in various services. This check box is cleared by default.
- If you selected the Save filter check box, enter a name for the created filter resource in the Name field. Maximum length of the name: 128 Unicode characters.
- Under Conditions, specify the conditions that the events must meet:
- Click the Add condition button.
- In the Left operand and Right operand drop-down lists, specify the search parameters. Depending on the data source selected in the Right operand field, fields of additional parameters for identifying the value to be passed to the filter may be displayed. For example, when you select active list, you must specify the name of the active list, the entry key, and the entry key field.
- In the Operator drop-down list, select an operator.
- If you want the operator to be case-insensitive, select the do not match case check box. The selection of this check box does not apply to the InSubnet, InActiveList, InCategory or InActiveDirectoryGroup operators. This check box is cleared by default.
- If you want to add a negative condition, select If not from the If drop-down list.
You can add multiple conditions or a group of conditions.
- If you have added multiple conditions or groups of conditions, choose a selection condition (and, or, not) by clicking the AND button.
- If you want to add existing filters that are selected from the Select filter drop-down list, click the Add filter button. You can view the nested filter settings by clicking the button.
- Click Save.
The created destination is displayed on the Installation Wizard tab. A destination resource can be removed from the resource set by selecting it and clicking Delete in the opened window.
Proceed to the next step of the Installation Wizard.
Page top
Step 7. Setup validation
This is the required, final step of the Installation Wizard. At this step, KUMA creates a service resource set, and the Services are created automatically based on this set:
- The resource set for the correlator is displayed under Resources → Correlators. It can be used to create new correlator services. When this resource set changes, all services that operate based on this resource set will start using the new parameters after the services restart. To do so, you can use the Save and restart services and Save and update service configurations buttons.
A resource set can be modified, copied, moved from one folder to another, deleted, imported, and exported, like other resources.
- Services are displayed in Resources → Active services. The services created using the Installation Wizard perform functions inside the KUMA application. To communicate with external parts of the network infrastructure, you need to install similar external services on the servers and assets intended for them. For example, an external correlator service should be installed on a server intended to process events, external storage services should be installed on servers with a deployed ClickHouse service, and external agent services should be installed on Windows assets that must both receive and forward Windows events.
To finish the Installation Wizard:
- Click Create and save service.
The Setup validation tab of the Installation Wizard displays a table of services created based on the resource set selected in the Installation Wizard. The lower part of the window shows examples of commands that you must use to install external equivalents of these services on their intended servers and assets.
For example:
/opt/kaspersky/kuma/kuma correlator --core https://kuma-example:<port used for communication with the KUMA Core> --id <service ID> --api.port <port used for communication with the service> --install
The "kuma" file can be found inside the installer in the /kuma-ansible-installer/roles/kuma/files/ directory.
The port for communication with the KUMA Core, the service ID, and the port for communication with the service are added to the command automatically. You should also ensure the network connectivity of the KUMA system and open the ports used by its components if necessary.
- Close the Wizard by clicking Save.
The correlator service is created in KUMA. Now the service must be installed on the server intended for processing events.
Page top
Installing a correlator in a KUMA network infrastructure
A correlator consists of two parts: one part is created inside the KUMA web interface, and the other part is installed on the network infrastructure server intended for processing events. The second part of the correlator is installed in the network infrastructure.
To install a correlator:
- Log in to the server where you want to install the service.
- Execute the following command:
sudo /opt/kaspersky/kuma/kuma correlator --core https://<KUMA Core server FQDN>:<port used by KUMA Core server for internal communication (port 7210 by default)> --id <service ID copied from the KUMA web interface> --api.port <port used for communication with the installed component> --installExample:
sudo /opt/kaspersky/kuma/kuma correlator --core https://kuma.example.com:7210 --id XXXX --api.port YYYY --installYou can copy the correlator installation command at the last step of the Installation Wizard. It automatically specifies the address and port of the KUMA Core server, the identifier of the correlator to be installed, and the port that the correlator uses for communication. Before installation, ensure the network connectivity of KUMA components.
When deploying several KUMA services on the same host, during the installation process you must specify unique ports for each component using the
--api.port <port>parameter. The following setting values are used by default:--api.port 7221.
The correlator is installed. You can use it to analyze events for threats.
Page top
Validating correlator installation
To verify that the correlator is ready to receive events:
- In the KUMA web interface, open Resources → Active services.
- Make sure that the correlator you installed has the green status.
If the events that are fed into the correlator contain events that meet the correlation rule filter conditions, the events tab will show events with the DeviceVendor=Kaspersky and DeviceProduct=KUMA parameters. The name of the triggered correlation rule will be displayed as the name of these correlation events.
If no correlation events are found
You can create a simpler version of your correlation rule to find possible errors. Use a simple correlation rule and a single Output action. It is recommended to create a filter to find events that are regularly received by KUMA.
When updating, adding, or removing a correlation rule, you must update configuration of the correlator.
When you finish testing your correlation rules, you must remove all testing and temporary correlation rules from KUMA and update configuration of the correlator.
Page top
Creating an event router
An event router is a service that allows you to receive streams of events from collectors and correlators and then distribute the events to specified destinations in accordance with the configured filters.
To have events from the collector sent to the event router, you must create an 'eventRouter' destination resource with the address of the event router and link the resource to the collectors that you want to send events to the event router.
The event router receives events on the API port, just like 'storage' and 'correlator' destinations.
You can create a router in the Resources section.
Using an event router lets you reduce the utilization of links, which is important for low-bandwidth and busy links.
Possible use cases:
Collector — Router in the data center
The collector sends events to an event router in the data center, and the event router sends the events to the specified destinations: correlator and storage.
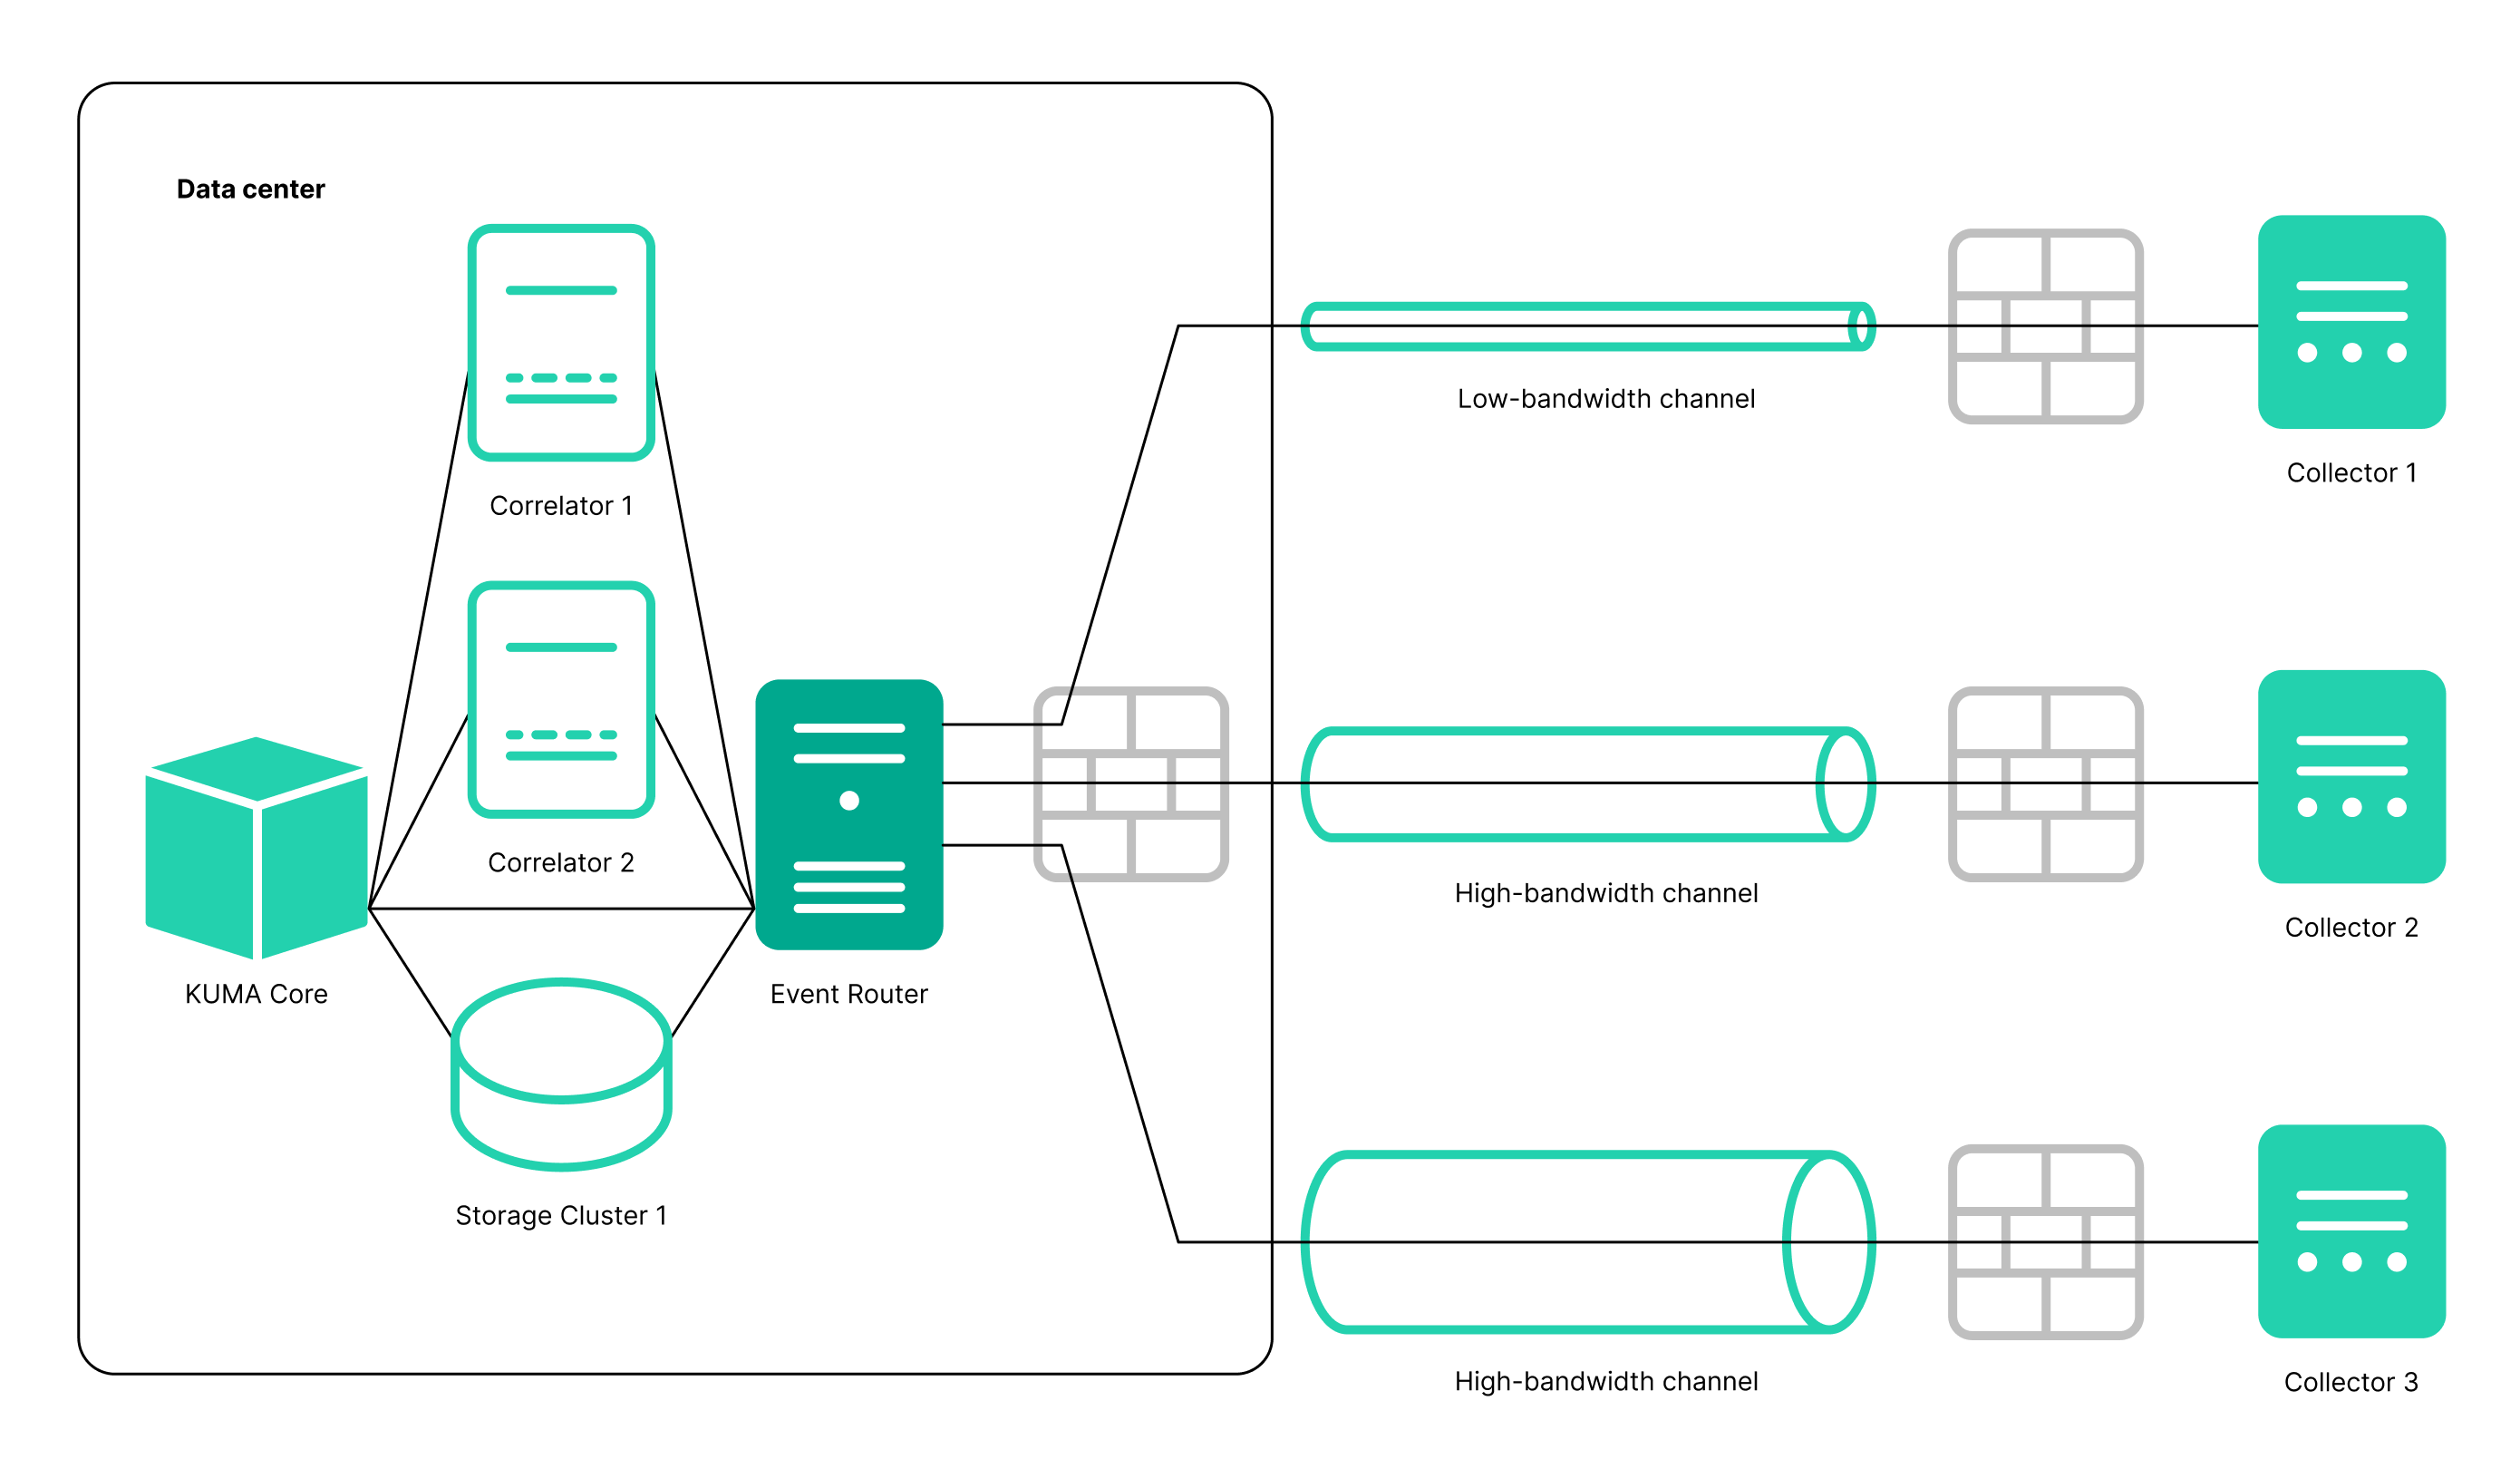
Preconditions:
- KUMA 3.2 collectors are configured at the branch offices.
- The data center has the capacity to install an event router.
- KUMA 3.2 is installed in the data center.
Steps:
- In the data center:
- Create the Event router service.
- Create storage and correlator destination points and specify them in the Event router.
- In the Event router on the Advanced settings tab, configure a filter to send events to storage and/or correlator. For example, "DeviceCustomString = correlator" or "DeviceCustomString = storage".
- Configure enrichment.
- In the collectors at branch offices:
- Create a destination of the eventRouter type.
- Specify the URL of the event router in the data center of the branch office.
- If eventRouter replaces previously configured destinations, you can delete them.
Postcondition:
- Collectors at the branch offices are configured.
- The event router in the data center is configured.
Connections of branch offices to the data center have been optimized: for each collector, you no longer need to configure events to be sent both to storage and to the correlator in the data center. This halves the load on the link.
Routing to the storage and the correlator is performed within the data center.
Multiple collectors send events to the event router at the branch office, and the event router at the branch office sends events to the router in the data center, where events are then sent to the specified destinations, that is, correlators and storage.
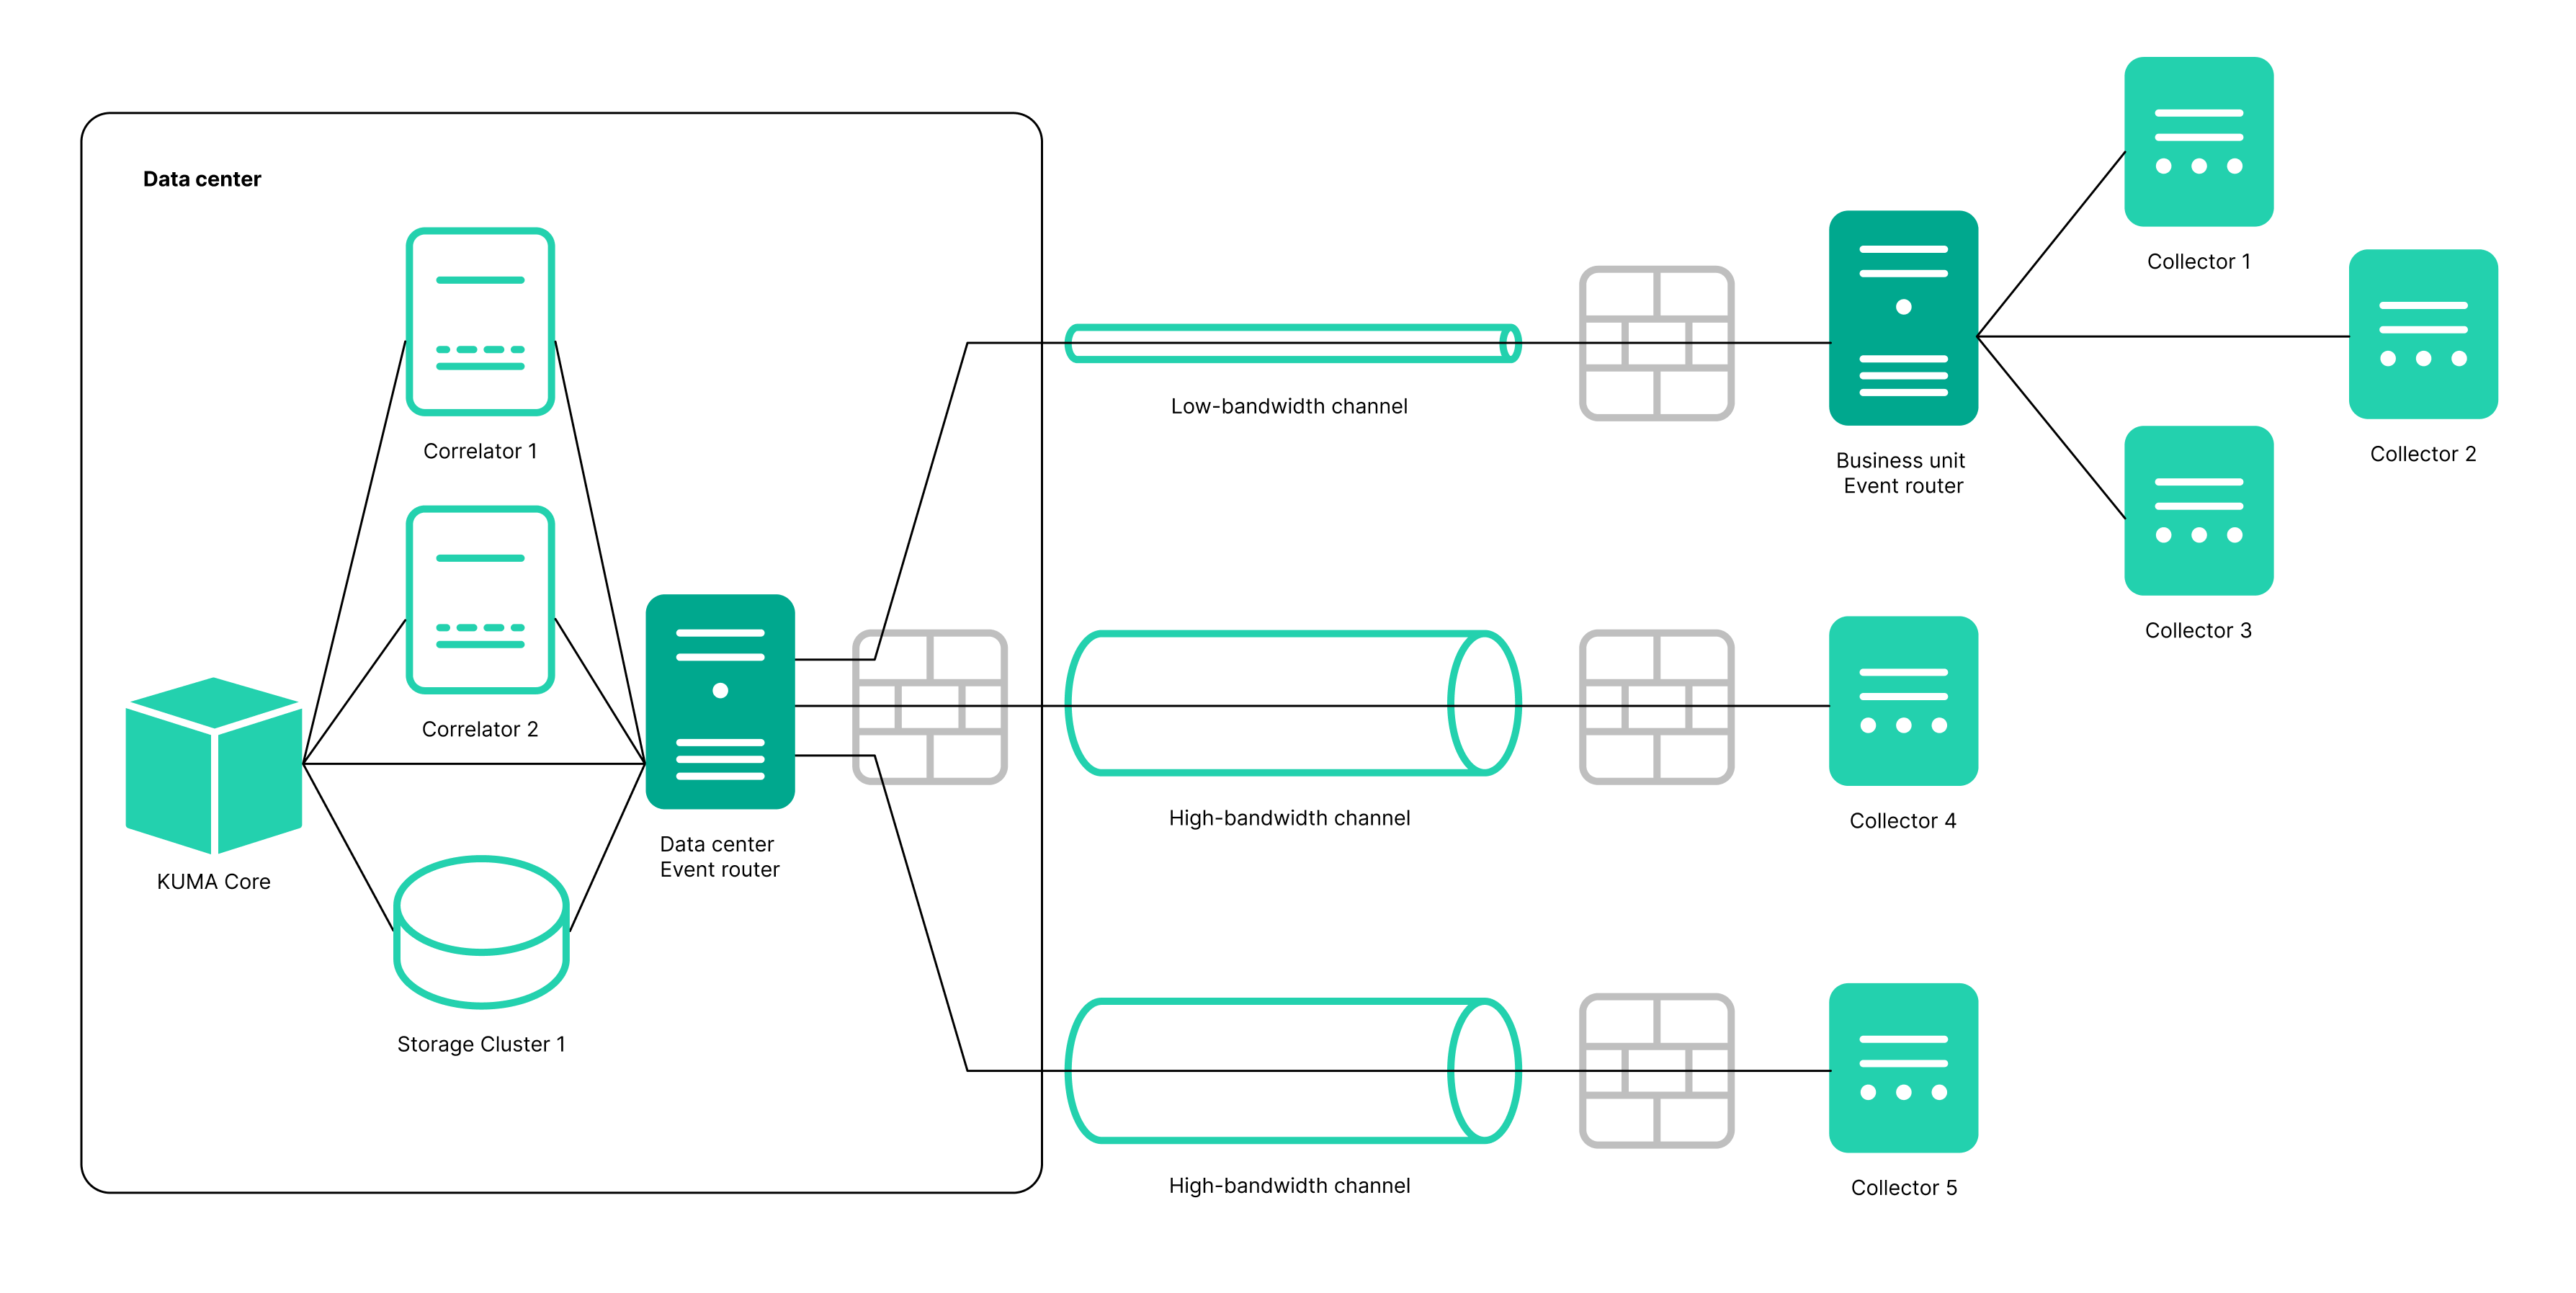
Preconditions:
- KUMA 3.2 collectors are configured at the branch offices.
- The data center has the capacity to install an event router.
- KUMA 3.2 is installed in the data center.
Steps:
- In the data center:
- Create the Event router service.
- Create storage and correlator destination points and specify them in the Event router.
- In the Event router on the Advanced settings tab, configure a filter to send events to storage and/or correlator. For example, "DeviceCustomString = correlator" or "DeviceCustomString = storage".
- At the branch office:
- Create the Event router service.
- Create a destination of the eventRouter type and specify the URL of the Event router in the data center.
- In the collectors at branch offices:
- Create a destination of the eventRouter type and specify the URL of the Event router at the branch office.
- If eventRouter replaces previously configured destinations, you can delete them.
Postcondition:
- Collectors at the branch offices are configured.
- The event router in the data center and the event router at the branch office are configured.
The connections of branch offices with the data center are optimized: in each collector, you no longer need to configure events to be sent to the data center; it is enough to collect all events on the router and send it to the data center as one stream.
The event router must be installed on a Linux device. Only a user with the General Administrator role can create the service. You can create a service in any tenant; the tenant relation does not impose any restrictions.
You can use the following metrics to get information about the service performance:
- IO
- Process
- OS
As with other resources, the following audit events are generated for the event router in KUMA:
- Resource was successfully added
- Resource was successfully updated
- Resource was successfully deleted
Installing an event router involves two steps:
- Create the event router service in the KUMA web interface using the Installation Wizard.
- Install the event router service on the server.
Starting the Event Router Installation Wizard
To start Event Router Installation Wizard:
- In the KUMA web interface, in the Resources section, click Event routers.
- This opens the Event routers window; in that window, click Add.
Follow the instructions of the installation wizard.
Step 1. General settings of the event router
This is a required step of the Installation Wizard. At this step, you specify the main settings of the event router: its name and the tenant that will own it.
To specify the general settings of the event router:
- On the Basic settings tab, fill in the following fields:
- In the Name field, enter a unique name for the service you are creating. The name must contain 1 to 128 Unicode characters.
- In the Tenant drop-down list, select the tenant that will own the event router. An event router belonging to a tenant is organizational in nature and does not impose any restrictions.
- If necessary, specify the number of processes that the service can run concurrently in the Handlers field. By default, the number of handlers is the same as the number of vCPUs on the server where the service is installed.
- You can optionally add up to 4000 Unicode characters describing the service in the Description field.
- On the Advanced settings tab, fill in the following fields:
- If necessary, use the Debug toggle switch to enable logging of service operations.
- You can use the Create dump periodically toggle switch at the request of Technical Support to generate resource (CPU, RAM, etc.) utilization reports in the form of dumps.
- In the Dump settings field, you can specify the settings to be used when creating dumps. For instructions on filling out this field, please contact Technical Support.
General settings of the event router are specified. Proceed to the next step of the Installation Wizard.
Page top
Step 2. Routing
This is a required step of the Installation Wizard. We recommend sending events to at least two destinations: to the correlator for analysis and to the storage for storage. You can also select another event router as the destination.
To specify the settings of the destination to which you want the event router to send events received from collectors:
- In the Routing step of the Installation Wizard, click Add.
- This opens the Create destination window; in that window, specify the following settings:
- On the Basic settings tab, in the Name field, enter a unique name for the destination. The name must contain 1 to 128 Unicode characters.
- You can use the State toggle switch to enable or disable the service as needed.
- In the Type drop-down list, select the type of the destination. The following values are available:
- On the Advanced settings tab, specify the values of parameters. The set of parameters that can be configured depends on the type of the destination selected on the Basic settings tab. For detailed information about parameters and their values, click the link for each type of destination in paragraph "c." of these instructions.
The created destination is displayed on the Installation Wizard tab. A destination resource can be removed from the resource set by selecting it and clicking Delete in the opened window.
Routing is configured. You can proceed to the next step of the Installation Wizard.
Page top
Step 3. Setup validation
This is the required, final step of the Installation Wizard.
To create an event router in the Installation Wizard:
- Click Create and save service.
The lower part of the window displays the command that you must use to install the router on the server.
Example command:
/opt/kaspersky/kuma/kuma eventrouter --core https://kuma-example:<port used for communication with the KUMA Core>--id<event router service ID>--api.port<port used for communication with the service>--installThe port for communication with the KUMA Core, the service ID, and the port for communication with the service are added to the command automatically. You must also ensure the network connectivity of KUMA and open the ports used by application components, if necessary.
- Close the Wizard by clicking Save.
The service is installed in the KUMA web interface. You can now proceed with installing the service in the KUMA network infrastructure.
Page top
Installing the event router on the server
To install the event router on the server:
- Log in to the server where you want to install the event router service.
If you want to install the event router service on a separate server, use one of the hosts specified in the
kuma_correlatorparameter. - Create the /opt/kaspersky/kuma/ directory.
- Copy the "kuma" file to the "/opt/kaspersky/kuma/" directory. The file is located inside the installer in the "/kuma-ansible-installer/roles/kuma/files/" directory.
- Make sure the kuma file has sufficient rights to run. If the file is not executable, make it executable:
sudo chmod +x /opt/kaspersky/kuma/kuma - Place the LICENSE file from the /kuma-ansible-installer/roles/kuma/files/ directory in the /opt/kaspersky/kuma/ directory and accept the license by running the following command:
sudo /opt/kaspersky/kuma/kuma license - Create the 'kuma' user:
sudo useradd --system kuma && usermod -s /usr/bin/false kuma - Make the 'kuma' user the owner of the /opt/kaspersky/kuma directory and all files inside the directory:
sudo chown -R kuma:kuma /opt/kaspersky/kuma/ - Add the KUMA event router port to firewall exclusions.
For the application to run correctly, ensure that the KUMA components are able to interact with other components and applications over the network via the protocols and ports specified during the installation of the KUMA components.
- Execute the following command:
sudo /opt/kaspersky/kuma/kuma eventrouter --core https://<FQDN of the KUMA Core server>:<port used by KUMA Core server for internal communication (port 7210 by default)> --id <service ID copied from the KUMA web interface> --api.port <port used for communication with the installed component> --installExample:
sudo /opt/kaspersky/kuma/kuma eventrouter --core https://kuma.example.com:7210 --id XXXX --api.port YYYY --install
The event router is installed on the server. You can use it to receive events from collectors and relay the events to specified destinations.
Page top
Creating a collector
A collector receives raw events from event sources, performs normalization, and sends processed events to their destinations. The maximum size of an event that can be processed by the KUMA collector is 4 MB.
If you are using the SMB license, and both the hourly average EPS and the daily average EPS allowed by the license is exceeded for a collector, the collector stops receiving events and is displayed with a red status and a notification about the EPS limit being exceeded. The user with the General Administrator role gets a notification about the EPS limit being exceeded and the collector being stopped. Every hour, the hourly average EPS value is recalculated and compared with the EPS limit in the license. If the hourly average is under the limit, the restrictions on the collector are lifted, and the collector resumes receiving and processing events.
Installing a collector involves two steps:
- Create the collector in the KUMA web interface using the Installation Wizard. In this step, you specify the general collector settings to be applied when installing the collector on the server.
- Install the collector on the network infrastructure server on which you want to receive events.
Actions in the KUMA web interface
The creation of a collector in the KUMA web interface is carried out by using the Installation Wizard. This Wizard combines the required resources into a resource set for a collector. Upon completion of the Wizard, the service itself is automatically created based on this resource set.
To create a collector in the KUMA web interface,
Start the Collector Installation Wizard:
- In the KUMA web interface, in the Resources section, click Add event source button.
- In the KUMA web interface in the Resources → Collectors section click Add collector button.
As a result of completing the steps of the Wizard, a collector service is created in the KUMA web interface.
A resource set for a collector includes the following resources:
- Connector
- Normalizer (at least one)
- Filters (if required)
- Aggregation rules (if required)
- Enrichment rules (if required)
- Destinations (normally two are defined for sending events to the correlator and storage)
These resources can be prepared in advance, or you can create them while the Installation Wizard is running.
Actions on the KUMA Collector Server
When installing the collector on the server that you intend to use for receiving events, run the command displayed at the last step of the Installation Wizard. When installing, you must specify the identifier automatically assigned to the service in the KUMA web interface, as well as the port used for communication.
Testing the installation
After creating a collector, you are advised to make sure that it is working correctly.
Starting the Collector Installation Wizard
A collector consists of two parts: one part is created inside the KUMA web interface, and the other part is installed on the network infrastructure server intended for receiving events. The Installation Wizard creates the first part of the collector.
To start the Collector Installation Wizard:
- In the KUMA web interface, in the Resources section, click Add event source.
- In the KUMA web interface in the Resources → Collectors section click Add collector.
Follow the instructions of the Wizard.
Aside from the first and last steps of the Wizard, the steps of the Wizard can be performed in any order. You can switch between steps by using the Next and Previous buttons, as well as by clicking the names of the steps in the left side of the window.
After the Wizard completes, a resource set for a collector is created in the KUMA web interface under Resources → Collectors, and a collector service is added under Resources → Active services.
Step 1. Connect event sources
This is a required step of the Installation Wizard. At this step, you specify the main settings of the collector: its name and the tenant that will own it.
To specify the general settings of the collector:
- On the Basic settings tab, fill in the following fields:
- In the Collector name field, enter a unique name for the service you are creating. The name must contain 1 to 128 Unicode characters.
When certain types of collectors are created, agents named
agent: <Collector name>, auto createdare also automatically created together with the collectors. If this type of agent was previously created and has not been deleted, you cannot create a collector named<Collector name>. If this is the case, you will have to either specify a different name for the collector or delete the previously created agent. - In the Tenant drop-down list, select the tenant that will own the collector. The tenant selection determines what resources will be available when the collector is created.
If you return to this window from another subsequent step of the Installation Wizard and select another tenant, you will have to manually edit all the resources that you have added to the service. Only resources from the selected tenant and the Shared tenant can be added to the service.
- If required, specify the number of processes that the service can run concurrently in the Workers field. By default, the number of worker processes is the same as the number of vCPUs on the server where the service is installed.
- You can optionally add up to 256 Unicode characters describing the service in the Description field.
- In the Collector name field, enter a unique name for the service you are creating. The name must contain 1 to 128 Unicode characters.
- On the Advanced settings tab, fill in the following fields:
- If necessary, use the Debug toggle switch to enable logging of service operations. Error messages of the collector service are logged even when debug mode is disabled. The log can be viewed on the machine where the collector is installed, in the /opt/kaspersky/kuma/collector/<collector ID>/log/collector directory.
- You can use the Create dump periodically toggle switch at the request of Technical Support to generate resource (CPU, RAM, etc.) utilization reports in the form of dumps.
- In the Dump settings field, you can specify the settings to be used when creating dumps. For instructions on filling out this field, please contact Technical Support.
General settings of the collector are specified. Proceed to the next step of the Installation Wizard.
Page top
Step 2. Transport
This is a required step of the Installation Wizard. On the Transport tab of the Installation Wizard, select or create a connector and in its settings, specify the source of events for the collector service.
To add an existing connector to a resource set,
select the name of the required connector from the Connector drop-down list.
The Transport tab of the Installation Wizard displays the settings of the selected connector. You can open the selected connector for editing in a new browser tab using the button.
To create a new connector:
- Select Create new from the Connector drop-down list.
- In the Type drop-down list, select the connector type and specify its settings on the Basic settings and Advanced settings tabs. The available settings depend on the selected type of connector:
- tcp
- udp
- netflow
- sflow
- nats-jetstream
- kafka
- http
- sql
- file
- 1c-log
- 1c-xml
- diode
- ftp
- nfs
- wmi
- wec
- etw
- snmp
- snmp-trap
- kata\edr
- vmware
- elastic
When using the tcp or udp connector type at the normalization stage, IP addresses of the assets from which the events were received will be written in the DeviceAddress event field if it is empty.
When using a wmi, wec, or etw connector, agents are automatically created for receiving Windows events.
It is recommended to use the default encoding (UTF-8), and to apply other settings only if bit characters are received in the fields of events.
Making KUMA collectors to listen on ports up to 1,000 requires running the service of the relevant collector with root privileges. To do this, after installing the collector, add the line
AmbientCapabilities = CAP_NET_BIND_SERVICEto its systemd configuration file in the [Service] section.
The systemd file is located in the /usr/lib/systemd/system/kuma-collector-<collector ID>.service directory.
The connector is added to the resource set of the collector. The created connector is only available in this resource set and is not displayed in the web interface Resources → Connectors section.
Proceed to the next step of the Installation Wizard.
Page top
Step 3. Event parsing
This is a required step of the Installation Wizard. On the Event parsing tab of the Installation Wizard, click the + Add event parsing button to open the Basic event parsing window, and in that window, in the Normalizer drop-down list, select or create a normalizer. In normalizer settings, define the rules for converting raw events into normalized events. You can add multiple event parsing rules to the normalizer to implement complex event processing logic. You can test the normalizer using test events.
When you create a new normalizer in the Installation Wizard, the default normalizer is saved in the resource set for the collector. You cannot use the created normalizer in other collectors. You can select the Save normalizer check box to create the normalizer as a separate resource. This will make the normalizer available for selection in other collectors of the tenant.
If, when editing the settings of a resource set of a collector, you edit or delete conversions in a normalizer connected to the resource set of the collector, the edits will not be saved, and the normalizer itself may be corrupted. If you need to modify conversions in a normalizer that is already part of a service, the changes must be made directly in the normalizer under Resources → Normalizers in the web interface.
Adding a normalizer to a resource set
To add a normalizer to a resource set:
- Click the + Add event parsing button.
This opens the Basic event parsing window with the normalizer settings. By default, the Normalization scheme tab is selected.
- In the Normalizer drop-down list, select a normalizer. You can select a normalizer that belongs to the tenant of the collector or to the Shared tenant.
The normalizer settings are displayed.
If you want to edit the settings of the normalizer, in the Normalizer drop-down list, click the pencil
 icon next to the name of the normalizer to open the Edit normalizer window, and in that window, click the dark circle. This opens the Basic event parsing window with the normalizer settings. If you want to edit additional parsing settings, in the Edit normalizer window, hover over the dark circle and click the plus symbol that appears. This opens the Additional event parsing with settings of the additional parsing. For more details on configuring the additional parsing of events, see the Creating the structure of event normalization rules section below.
 - Click OK.
The normalizer is added and displayed as a dark circle on the Event parsing tab of the Installation Wizard. You can click the dark circle to view the settings of the normalizer.
To create a new normalizer in the collector:
- Click the + Add event parsing button.
This opens the Basic event parsing window with the normalizer settings. By default, the Normalization scheme tab is selected.
- If you want to create the normalizer as a separate resource, select the Save normalizer check box. If the check box is selected, the normalizer becomes available for selection in other collectors of the tenant. This check box is cleared by default.
- In the Name field, enter a unique name for the normalizer. Maximum length of the name: 128 Unicode characters.
- In the Parsing method drop-down list, select the type of events to receive. Depending on the selected value, you can use the predefined event field matching rules or define rules manually. When you select some parsing methods, additional settings may become available that you must specify.
Available parsing methods:
- json
- cef
- regexp
This parsing method is used to create custom rules for processing data in a format using regular expressions.
You must add a regular expression (RE2 syntax) with named capturing groups to the field under Normalization. The name of the capturing group and its value are considered the field and value of the raw event that can be converted to an event field in KUMA format.
To add event handling rules:
- If necessary, copy an example of the data you want to process to the Event examples field. We recommend completing this step.
- In the field under Normalization, add a RE2 regular expression with named capturing groups, for example,
"(?P<name>regexp)". The regular expression added to the field under Normalization must exactly match the event. When designing the regular expression, we recommend using special characters that match the starting and ending positions of the text:^,$.You can add multiple regular expressions or remove regular expressions. To add a regular expression, click Add regular expression. To remove a regular expression, click the delete icon
next to it. - Click the Copy field names to the mapping table button.
Capture group names are displayed in the KUMA field column of the Mapping table. You can select the corresponding KUMA field in the column opposite each capturing group. If you followed the CEF format when naming the capturing groups, you can use automatic CEF mapping by selecting the Use CEF syntax for normalization check box.
Event handling rules are added.
- syslog
- csv
- kv
- xml
This parsing method is used to process XML data in which each object, including nested objects, occupies a single line in a file. Files are processed line by line.
If you want to send the raw event for advanced normalization, at each nesting level in the Advanced event parsing window, select Yes in the Keep raw event drop-down list.
If you select this parsing method, under XML attributes, you can specify the key XML attributes to be extracted from tags. If an XML structure has multiple XML attributes with different values in the same tag, you can identify the necessary value by specifying the key of the value in the Source column of the Mapping table.
To add key XML attributes:
- Click + Add field.
- This opens a window; in that window, specify the path to the XML attribute.
You can add multiple XML attributes or remove XML attributes. To remove an individual XML attribute, click the delete icon
next to it. To remove all XML attributes, click Reset.If XML key attributes are not specified, then in the course of field mapping the unique path to the XML value will be represented by a sequence of tags.
Tag numbering
Starting with KUMA 2.1.3, you can use automatic tag numbering in XML events. This lets you parse an event with the identical tags or unnamed tags, such as
<Data>.As an example, we will number the tags of the
EventDataattribute of the Microsoft Windows PowerShell event ID 800.To parse events with identical tags or unnamed tags, you need to configure tag numbering and data mapping for numbered tags with KUMA event fields.
KUMA 3.0.x supports using XML attributes and tag numbering at the same time in the same extra normalizer. If an XML attribute contains unnamed tags or identical tags, we recommend using tag numbering. If the XML attribute contains only named tags, we recommend using XML attributes.
To use XML attributes and tag numbering in extra normalizers, you must sequentially enable the Keep raw event setting in each extra normalizer along the path that the event follows to the target extra normalizer, and in the target extra normalizer itself.
For an example of how tag numbering works, you can refer to the MicrosoftProducts normalizer. The Keep raw event setting is enabled sequentially in both AD FS and 424 extra normalizers.
To set up the parsing of events with unnamed or identical tags:
- Open an existing normalizer or create a new normalizer.
- In the Basic event parsing window of the normalizer, in the Parsing method drop-down list, select xml.
- In the Tag numbering field, click + Add field.
- In the displayed field, enter the full path to the tag to whose elements you want to assign a number, for example,
Event.EventData.Data. The first tag gets number 0. If the tag is empty, for example,<Data />, it is also assigned a number. - To configure data mapping, under Mapping, click + Add row and do the following:
- In the displayed row, in the Source field, enter the full path to the tag and the index of the tag. For example, for the Microsoft Windows PowerShell event ID 800 from the example above, the full paths to tags and tag indices are as follows:
Event.EventData.Data.0Event.EventData.Data.1Event.EventData.Data.2and so on.
- In the KUMA field drop-down list, select the field in the KUMA event that will receive the value from the numbered tag after parsing.
- In the displayed row, in the Source field, enter the full path to the tag and the index of the tag. For example, for the Microsoft Windows PowerShell event ID 800 from the example above, the full paths to tags and tag indices are as follows:
- Save changes in one of the following ways:
- If you created a new normalizer, click Save.
- If you edited an existing normalizer, in the collector to which the normalizer is linked, click Update configuration.
Parsing is configured.
- netflow
- netflow5
- netflow9
- sflow5
- ipfix
- sql. This parsing method becomes available only if at the Transport step of the Installation Wizard you specified a connector of the sql type.
- In the Keep raw event drop-down list, specify whether you want to store the original raw event in the re-created normalized event.
- Don't save—do not save the raw event. This value is selected by default.
- Only errors—save the raw event in the
Rawfield of the normalized event if errors occurred when parsing it. You can use this value to debug the service. In this case, an event having a non-emptyRawfield will indicate problems. - Always—always save the raw event in the
Rawfield of the normalized event.
- In the Keep extra fields drop-down list, choose whether you want to store the raw event fields in the normalized event if no mapping is configured for them (see step 8 of these instructions):
- No. This value is selected by default.
- Yes. The original event fields are saved in the
Extrafield of the normalized event.
- If necessary, provide an example of the data you want to process to the Event examples field. We recommend completing this step.
- In the Mapping table, configure the mapping of raw event fields to KUMA event fields:
- Click + Add row.
You can add multiple table rows or delete table rows. To delete a table row, select the check box next to it and click the Delete button.
- In the Source column, specify the name of the raw event field that you want to map to the KUMA event field.
For details about the field name format, refer to the Normalized event data model article. For a description of the mapping, refer to the Mapping fields of predefined normalizers article.
If you want to create rules for modifying the fields of the original event before writing to the KUMA event fields, click the settings
 icon next to the field name to open the Conversion window, and in that window, click + Add conversion. You can reorder the rules or delete the rules. To reorder rules, use the reorder
  icons. To delete a rule, click the delete
  icon next to it.
If at the Transport step of the Installation Wizard, you specified a connector of the file type, you can pass the name or path of the file being processed by the collector to the KUMA event field. To do this, in the Source column, specify one of the following values:
$kuma_fileSourceNameto pass the name of the file being processed by the collector in the KUMA event field.$kuma_fileSourcePathto pass the path to the file being processed by the collector in the KUMA event field.
When you use a file connector, the new variables in the normalizer will only work with destinations of the internal type.
- In the KUMA field column, select a KUMA event field from the drop-down list. You can find the KUMA event field by typing its name. If the name of the KUMA event field begins with
DeviceCustom*orFlex*, enter a unique custom label in the Label field, if necessary.
If you want KUMA to enrich events with asset information, and the asset information to be available in the alert card when a correlation rule is triggered, in the Mapping table, configure a mapping of host address and host name fields depending on the purpose of the asset. For example, you can configure a mapping for SourceAddress and SourceHostName, or DestinationAddress and DestinationHostName KUMA event fields. As a result of enrichment, the event card includes a SourceAssetID or DestinationAssetID KUMA event field, and a link to the asset card. As a result of enrichment, asset information is also available in the alert card.
If you have loaded data into the Event examples field, the table will have an Examples column containing examples of values carried over from the raw event field to the KUMA event field.
- Click + Add row.
- Click OK.
The normalizer is created and displayed as a dark circle on the Event parsing tab of the Installation Wizard. You can click the dark circle to view the settings of the normalizer. If you want to edit additional parsing settings, hover over the dark circle and click the plus symbol that appears. This opens the Additional event parsing with settings of the additional parsing. For more details on configuring the additional parsing of events, see the Creating the structure of event normalization rules section below.
Enriching normalized events with additional data
You can create enrichment rules in the normalizer to add extra data to created normalized events. Enrichment rules are stored in the normalizer in which they were created.
To add enrichment rules to the normalizer:
- Select the main or additional normalization rule to open a window, and in that window, select the Enrichment tab.
- Click the + Add enrichment button.
The enrichment rule settings section is displayed. You can add multiple enrichment rules or delete enrichment rules. To delete an enrichment rule, click the delete
icon next to it. - In the Source kind drop-down list, select the type of the enrichment source. When you select some enrichment source types, additional settings may become available that you must specify.
Available Enrichment rule source types:
- constant
- dictionary
- table
This type of enrichment is used if you need to add a value from the dictionary of the Table type. Available enrichment type settings are listed in the table below.
Available enrichment type settings
Setting
Description
Dictionary name
The dictionary from which the values are to be taken.
Key fields
Event fields whose values are to be used for selecting a dictionary entry. To add an event field, click Add field. You can add multiple event fields.
Mapping
Event fields for data transfer:
- Dictionary field specifies dictionary fields from which data is to be transmitted. The available fields depend on the selected dictionary resource.
- KUMA field specifies event fields to which data is to be transmitted. For some of the selected fields (
*custom*and*flex*), in the Label column, you can specify a name for the data written there.
The first field in the table (Dictionary field) is taken as the key with which the fields selected from the event as key fields are matched (KUMA field). As the key in the Dictionary field, you must select an indicator of compromise by which the enrichment is to be performed, for example, IP address, URL, or hash. In the rule, you must select the event field that corresponds to the selected indicator of compromise in the dictionary field.
If you want to select multiple key fields, you can specify them using
|as a separator (when specifying in the web interface or importing as a CSV file), for example,<IP address>|<user name>.You can add new table rows or delete table rows. To add a new table row, click Add new element. To delete a row in the table, click the
button. - event
This type of enrichment is used when you need to write a value from another event field to the current event field. Available enrichment type settings are listed in the table below.
Available enrichment type settings
Setting
Description
Target field
The KUMA event field that you want to populate with the data.
Source field
The event field whose value is written to the target field.
Clicking
 opens the Conversion window, in which you can click Add conversion to create rules for modifying the source data before writing them to the KUMA event fields. You can reorder and delete created rules. To change the position of a rule, click next to it. To delete a rule, click next to it.
When using enrichment of events that have event selected as the Source kind and the extended event schema fields are used as arguments, the following special considerations apply:
- If the source extended event schema field has the
Array of stringstype, and the target extended event schema field has theStringtype, the values are written to the target extended event schema field in TSV format.Example: The
SA.StringArrayextended event schema field contains values:"string1","string2","string3". An event enrichment operation is performed. The result of the event enrichment operation is written to theDeviceCustomString1extended event schema field. TheDeviceCustomString1extended event schema field contains values:["string1", "string2", "string3"]. - If the source and target extended event schema fields have the
Array of stringstype, values of the source extended event schema field are added to the values of the target extended event schema field, and the "," character is used as the delimiter.Example: The
SA.StringArrayOnefield of the extended event scheme contains the["string1","string2","string3"]values, and theSA.StringArrayTwofield of the extended event scheme contains the["string4", "string5", "string6"]values. An event enrichment operation is performed. The result of the event enrichment operation is written to theSA.StringArrayTwofield of the extended event scheme. TheSA.StringArrayTwoextended event schema field contains values:["string4", "string5", "string6", "string1", "string2", "string3"].
- If the source extended event schema field has the
- template
- In the Target field drop-down list, select the KUMA event field to which you want to write the data. You cannot select a value if in the Source kind drop-down list, you selected table.
- If you want to enable details in the normalizer log, enable the Debug toggle switch. The toggle switch is turned off by default.
- Click OK.
The event enrichment rules with additional data are added to the normalizer into the selected parsing rule.
Configuring parsing linked to IPv4 addresses
If at the Transport step of the Installation Wizard, you specified a connector of the udp, tcp, or http type, you can forward events from multiple IPv4 addresses from sources of different types to the same collector, and have the collector apply the specified normalizers. To do this, you need to specify several IPv4 addresses and select the normalizer that you want to apply to events coming from the specified IPv4 addresses. The following types of normalizers are available: json, cef, regexp, syslog, csv, kv, and xml.
If you select a connector type other than udp, tcp, or http in a collector with configured normalizers and linking to IPv4 addresses, the Parsing settings tab is no longer displayed, and only the first of the previously specified normalizers is specified on the Event parsing tab of the Installation Wizard. The Parsing settings tab is hidden immediately, and the changes are applied after the resource is saved. If you want to restore the previous settings, exit the Installation Wizard without saving.
For normalizers of the Syslog and regexp types, you can use of a chain of normalizers. In this case, you can specify additional normalization conditions depending on the value of the DeviceProcessName field. The difference from extra normalization is that you can specify shared normalizers.
To configure parsing with linking to IPv4 addresses:
- Select the Parsing settings tab and click the + Event source button.
A group of parsing settings is displayed. You can add multiple parsings or delete parsings. To remove a parsing, click the delete
icon next to it. - In the IP address(es) field, enter the IPv4 address from which events will be sent. You can specify multiple IP addresses separated by commas. The length of the IPv4 address list is unlimited; however, we recommend limiting the number of IPv4 addresses to keep the load on the collector balanced. You must specify a value in this field if you want to apply multiple normalizers in one collector.
The IPv4 address must be unique for each normalizer. KUMA checks the uniqueness of IPv4 addresses, and if you specify the same IPv4 address for different normalizers, the
Field must be uniquemessage is displayed.If you want to send all events to the same normalizer without specifying IPv4 addresses, we recommend creating a separate collector. To improve performance, we recommend creating a separate collector with one normalizer if you want to apply the same normalizer to events from a large number of IPv4 addresses.
- In the Normalizer drop-down list, create or select a normalizer. You can click the arrow icon next to the drop-down list to select the Parsing schemas tab.
Normalization will be triggered if at the Transport step of the Installation Wizard, you specified a connector of the udp, tcp, or http type. For a http connector, you must specify the header of the event source. Taking into account the available connectors, the following normalizer types are available for automatic source recognition: json, cef, regexp, syslog, csv, kv, and xml.
- If you selected a normalizer of the Syslog or regexp type, and you want to add a conditional normalization, click the + Add conditional normalization button. Conditional normalization is available if in the Mapping table of the main normalizer, you configured the mapping of the source event field to the DeviceProcessName KUMA event field. Under Condition, in the DeviceProcessName field, specify a process name, and in the drop-down list, create or select a normalizer. You can specify multiple combinations of the DeviceProcessName KUMA event field and a normalizer. Normalization is performed until the first match.
Parsing with linking to IPv4 addresses is configured.
Creating a structure of event normalization rules
To implement complex event processing logic, you can add multiple event parsing rules to the normalizer. Events are switched between the parsing rules depending on the specified conditions. Events are processed sequentially in accordance with the creation order of the parsing rules. The event processing path is displayed as arrows.
To create an additional parsing rule:
- Create a normalizer. For more information on creating normalizers, see the Adding a normalizer to a resource set section earlier in this article.
The created normalizer is displayed as a dark circle on the Event parsing tab of the Installation Wizard.
- Hover over the dark circle and click the plus sign that appears.
- In the Additional event parsing window that opens, configure the additional event parsing rule:
- Extra normalization conditions tab:
If you want to send a raw event for extra normalization, select Yes in the Keep raw event drop-down list. The default value is No. We recommend passing a raw event to normalizers of json and xml types. If you want to send a raw event for extra normalization to the second, third, etc nesting levels, at each nesting level, select Yes in the Keep raw event drop-down list.
To send only the events with a specific field to the additional normalizer, specify the field in the Field to pass into normalizer field.
On this tab, you can define other conditions that must be satisfied for the event to be sent for additional parsing.
- Normalization scheme tab:
On this tab, you can configure event processing rules, similar to the main normalizer settings. The Keep raw event setting is not available. The Event examples field displays the values specified when the normalizer was created.
- Enrichment tab:
On this tab, you can configure enrichment rules for events. For more details on configuring enrichment rules, see the Enriching normalized events with additional data section earlier in this article.
- Extra normalization conditions tab:
- Click OK.
An additional parsing rule is added to the normalizer and displayed as a dark box. The dark box specifies the conditions that trigger the additional parsing rule.
You can do the following:
- You can chick the additional parsing rule to edit its settings.
- You can find an additional parsing rule by entering its name in the field in the upper part of the window.
- Create a new additional parsing rule. To do this, hover over the additional parsing rule and click on the plus icon that appears.
- Delete an additional parsing rule. To do this, hover over the additional parsing rule and click on the trash can icon.
Proceed to the next step of the Installation Wizard.
Page top
Step 4. Filtering events
This is an optional step of the Installation Wizard. The Event filtering tab of the Installation Wizard allows you to select or create a filter whose settings specify the conditions for selecting events. You can add multiple filters to the collector. You can swap the filters by dragging them by the icon as well as delete them. Filters are combined by the AND operator.
When configuring filters, we recommend to adhere to the chosen normalization scheme. In filters, use only KUMA service fields and the fields that you specified in the normalizer in the Mapping and Enrichment sections. For example, if the DeviceAddress field is not used in normalization, avoid using the DeviceAddress field in a filter because such filtering will not work.
To add an existing filter to a collector resource set,
Click the Add filter button and select the required filter from the Filter drop-down menu.
To add a new filter to the collector resource set:
- Click the Add filter button and select Create new from the Filter drop-down menu.
- If you want to keep the filter as a separate resource, select the Save filter check box. This can be useful if you decide to reuse the same filter across different services. This check box is cleared by default.
- If you selected the Save filter check box, enter a name for the created filter in the Name field. The name must contain 1 to 128 Unicode characters.
- In the Conditions section, specify the conditions that must be met by the filtered events:
- The Add condition button is used to add filtering conditions. You can select two values (two operands, left and right) and assign the operation you want to perform with the selected values. The result of the operation is either True or False.
- In the operator drop-down list, select the function to be performed by the filter.
In this drop-down list, you can select the do not match case check box if the operator should ignore the case of values. This check box is ignored if the InSubnet, InActiveList, InCategory, and InActiveDirectoryGroup operators are selected. This check box is cleared by default.
- In the Left operand and Right operand drop-down lists, select where the data to be filtered will come from. As a result of the selection, Advanced settings will appear. Use them to determine the exact value that will be passed to the filter. For example, when choosing active list you will need to specify the name of the active list, the entry key, and the entry key field.
- You can use the If drop-down list to choose whether you need to create a negative filter condition.
Conditions can be deleted using the
button. - In the operator drop-down list, select the function to be performed by the filter.
- The Add group button is used to add groups of conditions. Operator AND can be switched between AND, OR, and NOT values.
A condition group can be deleted using the
button. - By clicking Add filter, you can add existing filters selected in the Select filter drop-down list to the conditions. You can click to navigate to a nested filter.
A nested filter can be deleted using the
button.
- The Add condition button is used to add filtering conditions. You can select two values (two operands, left and right) and assign the operation you want to perform with the selected values. The result of the operation is either True or False.
The filter has been added.
Proceed to the next step of the Installation Wizard.
Page top
Step 5. Event aggregation
This is an optional step of the Installation Wizard. The Event aggregation tab of the Installation Wizard allows you to select or create aggregation rules whose settings specify the conditions for aggregating events of the same type. You can add multiple aggregation rules to the collector.
To add an existing aggregation rule to a set of collector resources,
click Add aggregation rule and select Aggregation rule in the drop-down list.
To add a new aggregation rule to a set of collector resources:
- Click the Add aggregation rule button and select Create new from the Aggregation rule drop-down menu.
- Enter the name of the newly created aggregation rule in the Name field. The name must contain 1 to 128 Unicode characters.
- In the Threshold field, specify how many events must be accumulated before the aggregation rule triggers and the events are aggregated. The default value is
100. - In the Triggered rule lifetime field, specify how long (in seconds) the collector must accumulate events to be aggregated. When this time expires, the aggregation rule is triggered and a new aggregation event is created. The default value is
60. - In the Identical fields section, use the Add field button to select the fields that will be used to identify the same types of events. You can select the following service fields: SourceAssetID, DestinationAssetID, DeviceAssetID, SourceAccountID, DestinationAccountID. Asset IDs are added after event normalization, which means you can use them to aggregate events. The rest of the service fields are not used in aggregation. Selected events can be deleted using the buttons with a cross icon.
- In the Unique fields section, you can click Add field to select the fields that will disqualify events from aggregation even if the events contain fields listed in the Identical fields section. Selected events can be deleted using the buttons with a cross icon.
- In the Sum fields section, you can use the Add field button to select the fields whose values will be summed during the aggregation process. Selected events can be deleted using the buttons with a cross icon.
- In the Filter section, you can specify the conditions to define events that will be processed by this resource. You can select an existing filter from the drop-down list or create a new filter.
Creating a filter in resources
To create a filter:
- In the Filter drop-down list, select Create new.
- If you want to keep the filter as a separate resource, select the Save filter check box. In this case, you will be able to use the created filter in various services. This check box is cleared by default.
- If you selected the Save filter check box, enter a name for the created filter resource in the Name field. Maximum length of the name: 128 Unicode characters.
- Under Conditions, specify the conditions that the events must meet:
- Click the Add condition button.
- In the Left operand and Right operand drop-down lists, specify the search parameters. Depending on the data source selected in the Right operand field, fields of additional parameters for identifying the value to be passed to the filter may be displayed. For example, when you select active list, you must specify the name of the active list, the entry key, and the entry key field.
- In the Operator drop-down list, select an operator.
- If you want the operator to be case-insensitive, select the do not match case check box. The selection of this check box does not apply to the InSubnet, InActiveList, InCategory or InActiveDirectoryGroup operators. This check box is cleared by default.
- If you want to add a negative condition, select If not from the If drop-down list.
You can add multiple conditions or a group of conditions.
- If you have added multiple conditions or groups of conditions, choose a selection condition (and, or, not) by clicking the AND button.
- If you want to add existing filters that are selected from the Select filter drop-down list, click the Add filter button. You can view the nested filter settings by clicking the button.
Aggregation rule added. You can delete it using the button.
Proceed to the next step of the Installation Wizard.
Page top
Step 6. Event enrichment
This is an optional step of the Installation Wizard. On the Event enrichment tab of the Installation Wizard, you can specify which data from which sources should be added to events processed by the collector. Events can be enriched with data obtained using enrichment rules or LDAP.
Incoming events are first enriched with data from the sources that you select at this step of the wizard, and then the events are automatically enriched with asset information. For example, if you have dns enrichment configured, which leads to the IP address in the event being enriched with the corresponding DNS name of an asset, the event is enriched with this asset.
Rule-based enrichment
There can be more than one enrichment rule. You can add them by clicking the Add enrichment button and can remove them by clicking the button. You can use existing enrichment rules or create rules directly in the Installation Wizard.
To add an existing enrichment rule to a set of resources:
- Click Add enrichment.
This opens the enrichment rules settings block.
- In the Enrichment rule drop-down list, select the relevant resource.
The enrichment rule is added to the resource set for the collector.
To create a new enrichment rule in a set of resources:
- Click Add enrichment.
This opens the enrichment rules settings block.
- In the Enrichment rule drop-down list, select Create new.
- In the Source kind drop-down list, select the source of data for enrichment and define its corresponding settings:
- constant
- dictionary
- event
- template
- dns
- cybertrace
For systems with a high load on the collector or correlator, we recommend using the cybertrace-http enrichment type.
This type of enrichment is used to add information from CyberTrace data streams to event fields.
Available settings:
- URL (required)—in this field, you can specify the URL of a CyberTrace server to which you want to send requests. The default CyberTrace port is 9999.
- Number of connections—maximum number of connections to the CyberTrace server that can be simultaneously established by KUMA. By default, this value is equal to the number of vCPUs of the KUMA Core server.
- RPS—maximum number of requests sent to the server per second. The default value is
1,000. - Timeout—amount of time to wait for a response from the CyberTrace server, in seconds. The default value is
30. - Maximum number of events in the enrichment queue—maximum number of events stored in the enrichment queue for re-sending. The default value is 1,000,000.
- Mapping (required)—this settings block contains the mapping table for mapping KUMA event fields to CyberTrace indicator types. The KUMA field column shows the names of KUMA event fields, and the CyberTrace indicator column shows the types of CyberTrace indicators.
Available types of CyberTrace indicators:
- ip
- url
- hash
In the mapping table, you must provide at least one string. You can use the Add row button to add a string, and can use the
button to remove a string.
- cybertrace-http
- timezone
- geographic data
This type of enrichment is used to add IP address geographic data to event fields. Learn more about linking IP addresses to geographic data.
When this type is selected, under Mapping geographic data to event fields, you must specify from which event field the IP address will be read, select the required attributes of geographic data, and define the event fields in which geographic data will be written:
- In the Event field with IP address drop-down list, select the event field from which the IP address is read. Geographic data uploaded to KUMA is matched against this IP address.
You can use the Add event field with IP address button to specify multiple event fields with IP addresses that require geographic data enrichment. You can delete event fields added in this way by clicking the Delete event field with IP address button.
When the
SourceAddress,DestinationAddress, andDeviceAddressevent fields are selected, the Apply default mapping button becomes available. You can use this button to add preconfigured mapping pairs of geographic data attributes and event fields. - For each event field you need to read the IP address from, select the type of geographic data and the event field to which the geographic data should be written.
You can use the Add geodata attribute button to add field pairs for Geodata attribute – Event field to write to. You can also configure different types of geographic data for one IP address to be written to different event fields. To delete a field pair, click
 .
.- In the Geodata attribute field, select which geographic data corresponding to the read IP address should be written to the event. Available geographic data attributes: Country, Region, City, Longitude, Latitude.
- In the Event field to write to, select the event field which the selected geographic data attribute must be written to.
You can write identical geographic data attributes to different event fields. If you configure multiple geographic data attributes to be written to the same event field, the event will be enriched with the last mapping in the sequence.
- In the Event field with IP address drop-down list, select the event field from which the IP address is read. Geographic data uploaded to KUMA is matched against this IP address.
- Use the Debug toggle switch to indicate whether or not to enable logging of service operations. Logging is disabled by default.
- In the Filter section, you can specify conditions to identify events that will be processed by the enrichment rule resource. You can select an existing filter from the drop-down list or create a new filter.
Creating a filter in resources
To create a filter:
- In the Filter drop-down list, select Create new.
- If you want to keep the filter as a separate resource, select the Save filter check box. In this case, you will be able to use the created filter in various services. This check box is cleared by default.
- If you selected the Save filter check box, enter a name for the created filter resource in the Name field. Maximum length of the name: 128 Unicode characters.
- Under Conditions, specify the conditions that the events must meet:
- Click the Add condition button.
- In the Left operand and Right operand drop-down lists, specify the search parameters. Depending on the data source selected in the Right operand field, fields of additional parameters for identifying the value to be passed to the filter may be displayed. For example, when you select active list, you must specify the name of the active list, the entry key, and the entry key field.
- In the Operator drop-down list, select an operator.
- If you want the operator to be case-insensitive, select the do not match case check box. The selection of this check box does not apply to the InSubnet, InActiveList, InCategory or InActiveDirectoryGroup operators. This check box is cleared by default.
- If you want to add a negative condition, select If not from the If drop-down list.
You can add multiple conditions or a group of conditions.
- If you have added multiple conditions or groups of conditions, choose a selection condition (and, or, not) by clicking the AND button.
- If you want to add existing filters that are selected from the Select filter drop-down list, click the Add filter button. You can view the nested filter settings by clicking the button.
The new enrichment rule was added to the resource set for the collector.
LDAP enrichment
To enable enrichment using LDAP:
- Click Add enrichment with LDAP data.
This opens the settings block for LDAP enrichment.
- Under LDAP accounts mapping, use the New domain button to specify the domain of the user accounts. You can specify multiple domains.
- In the LDAP mapping table, define the rules for mapping KUMA fields to LDAP attributes:
- In the KUMA field column, indicate the KUMA event field which data should be compared to LDAP attribute.
- In the LDAP attribute column, specify the attribute that must be compared with the KUMA event field. The drop-down list contains standard attributes and can be augmented with custom attributes.
- In the KUMA event field to write to column, specify in which field of the KUMA event the ID of the user account imported from LDAP should be placed if the mapping was successful.
You can use the Add row button to add a string to the table, and can use the
button to remove a string. You can use the Apply default mapping button to fill the mapping table with standard values.
Event enrichment rules for data received from LDAP were added to the group of resources for the collector.
If you add an enrichment to an existing collector using LDAP or change the enrichment settings, you must stop and restart the service.
Proceed to the next step of the Installation Wizard.
Page top
Step 7. Routing
This is an optional step of the Installation Wizard. On the Routing tab of the Installation Wizard, you can select or create destinations with settings indicating the forwarding destination of events processed by the collector. Typically, events from the collector are routed to two points: to the correlator to analyze and search for threats; and to the storage, both for storage and so that processed events can be viewed later. If necessary, events can be sent elsewhere, for example, to the event router. In that case, select the 'internal' connector at the Transport step. There can be more than one destination point.
To add an existing destination to a collector resource set:
- In the Routing step of the Installation Wizard, click Add.
- This opens the Create destination window; in that window, select the type of destination you want to add.
- In the Destination drop-down list, select the necessary destination.
The window name changes to Edit destination, and it displays the settings of the selected resource. To open the settings of a destination for editing in a new browser tab, click
. - Click Save.
The selected destination is displayed on the Installation Wizard tab. A destination resource can be removed from the resource set by selecting it and clicking Delete in the opened window.
To add a new destination resource to a collector resource set:
- In the Routing step of the Installation Wizard, click Add.
- This opens the Create destination window; in that window, specify the following settings:
- On the Basic settings tab, in the Name field, enter a unique name for the destination. The name must contain 1 to 128 Unicode characters.
- You can use the State toggle switch to enable or disable the service as needed.
- In the Type drop-down list, select the type of the destination. The following values are available:
- On the Advanced settings tab, specify the values of parameters. The set of parameters that can be configured depends on the type of the destination selected on the Basic settings tab. For detailed information about parameters and their values, click the link for each type of destination in paragraph "c." of these instructions.
The created destination is displayed on the Installation Wizard tab. A destination resource can be removed from the resource set by selecting it and clicking Delete in the opened window.
Proceed to the next step of the Installation Wizard.
Page top
Step 8. Setup validation
This is the required, final step of the Installation Wizard. At this step, KUMA creates a service resource set, and the Services are created automatically based on this set:
- The resource set for the collector is displayed under Resources → Collectors. It can be used to create new collector services. When this set of resources changes, all services that operate based on this set of resources will start using the new parameters after the services restart. To do so, you can use the Save and restart services and Save and update service configurations buttons.
A resource set can be modified, copied, moved from one folder to another, deleted, imported, and exported, like other resources.
- Services are displayed in Resources → Active services. The services created using the Installation Wizard perform functions inside the KUMA program. To communicate with external parts of the network infrastructure, you need to install similar external services on the servers and assets intended for them. For example, an external collector service should be installed on a server intended as an events recipient, external storage services should be installed on servers that have a deployed ClickHouse service, and external agent services should be installed on the Windows assets that must both receive and forward Windows events.
To finish the Installation Wizard:
- Click Create and save service.
The Setup validation tab of the Installation Wizard displays a table of services created based on the resource set selected in the Installation Wizard. The lower part of the window shows examples of commands that you must use to install external equivalents of these services on their intended servers and assets.
For example:
/opt/kaspersky/kuma/kuma collector --core https://kuma-example:<port used for communication with the KUMA Core> --id <service ID> --api.port <port used for communication with the service> --install
The "kuma" file can be found inside the installer in the /kuma-ansible-installer/roles/kuma/files/ directory.
The port for communication with the KUMA Core, the service ID, and the port for communication with the service are added to the command automatically. You should also ensure the network connectivity of the KUMA system and open the ports used by its components if necessary.
- Close the Wizard by clicking Save collector.
The collector service is created in KUMA. Now the service must be installed on the server intended for receiving events.
If a wmi, wec, or etw connector was selected for collectors, you must also install the automatically created KUMA agents.
Page top
Installing a collector in a KUMA network infrastructure
A collector consists of two parts: one part is created in the KUMA web interface, and the other part is installed on the network infrastructure server intended for receiving events. The second part of the collector is installed in the network infrastructure.
To install a collector:
- Log in to the server where you want to install the service.
- Execute the following command:
sudo /opt/kaspersky/kuma/kuma collector --core https://<FQDN of the KUMA Core server>:<port used by KUMA Core for internal communication (port 7210 is used by default)> --id <service ID copied from the KUMA web interface> --api.port <port used for communication with the installed component>Example:
sudo /opt/kaspersky/kuma/kuma collector --core https://test.kuma.com:7210 --id XXXX --api.port YYYYIf errors are detected as a result of the command execution, make sure that the settings are correct. For example, the availability of the required access level, network availability between the collector service and the Core, and the uniqueness of the selected API port. After fixing errors, continue installing the collector.
If no errors were found, and the collector status in the KUMA web interface is changed to green, stop the command execution and proceed to the next step.
The command can be copied at the last step of the installer wizard. The address and port of the KUMA Core server, the identifier of the collector to be installed, and the port that the collector uses for communication are automatically specified in the command.
When deploying several KUMA services on the same host, during the installation process you must specify unique ports for each component using the
--api.port <port>parameter. The following setting values are used by default:--api.port 7221.Before installation, ensure the network connectivity of KUMA components.
- Run the command again by adding the
--installkey:sudo /opt/kaspersky/kuma/kuma collector --core https://<FQDN of the KUMA Core server>:<port used by KUMA Core server for internal communication (port 7210 by default)> --id <service ID copied from the KUMA web interface> --api.port <port used for communication with the installed component> --installExample:
sudo /opt/kaspersky/kuma/kuma collector --core https://kuma.example.com:7210 --id XXXX --api.port YYYY --install - Add KUMA collector port to firewall exclusions.
For the program to run correctly, ensure that the KUMA components are able to interact with other components and programs over the network via the protocols and ports specified during the installation of the KUMA components.
The collector is installed. You can use it to receive data from an event source and forward it for processing.
Page top
Validating collector installation
To verify that the collector is ready to receive events:
- In the KUMA web interface, open Resources → Active services.
- Make sure that the collector you installed has the green status.
If the status of the collector is not green, view the log of this service on the machine where it is installed, in the /opt/kaspersky/kuma/collector/<collector ID>/log/collector directory. Errors are logged regardless of whether debug mode is enabled or disabled.
If the collector is installed correctly and you are sure that data is coming from the event source, the table should display events when you search for events associated with the collector.
To check for normalization errors using the Events section of the KUMA web interface:
- Make sure that the Collector service is running.
- Make sure that the event source is providing events to the KUMA.
- Make sure that you selected Only errors in the Keep raw event drop-down list of the Normalizer resource in the Resources section of the KUMA web interface.
- In the Events section of KUMA, search for events with the following parameters:
ServiceID = <ID of the collector to be checked>Raw != ""
If any events are found with this search, it means that there are normalization errors and they should be investigated.
To check for normalization errors using the Grafana Dashboard:
- Make sure that the Collector service is running.
- Make sure that the event source is providing events to the KUMA.
- Open the Metrics section and follow the KUMA Collectors link.
- See if the Errors section of the Normalization widget displays any errors.
If there are any errors, it means that there are normalization errors and they should be investigated.
For collectors that use WEC, WMI, or ETW connectors as the transport, make sure that a unique port is used for connecting to the agent. This port is specified in the Transport section of Collector Installation Wizard.
Page top
Ensuring uninterrupted collector operation
An uninterrupted event stream from the event source to KUMA is important for protecting the network infrastructure. Continuity can be ensured though automatic forwarding of the event stream to a larger number of collectors:
- On the KUMA side, two or more identical collectors must be installed.
- On the event source side, you must configure control of event streams between collectors using third-party server load management tools, such as rsyslog or nginx.
With this configuration of the collectors in place, no incoming events will be lost if the collector server is unavailable for any reason.
Please keep in mind that when the event stream switches between collectors, each collector will aggregate events separately.
If the KUMA collector fails to start, and its log includes the "panic: runtime error: slice bounds out of range [8:0]" error:
- Stop the collector.
sudo systemctl stop kuma-collector-<collector ID> - Delete the DNS enrichment cache files.
sudo rm -rf /opt/kaspersky/kuma/collector/<collector ID>/cache/enrichment/DNS-* - Delete the event cache files (disk buffer). Run the command only if you can afford to jettison the events in the disk buffers of the collector.
sudo rm -rf /opt/kaspersky/kuma/collector/<collector ID>/buffers/* - Start the collector service.
sudo systemctl start kuma-collector-<collector ID>
Event stream control using rsyslog
To enable rsyslog event stream control on the event source server:
- Create two or more identical collectors that you want to use to ensure uninterrupted reception of events.
- Install rsyslog on the event source server (refer to the rsyslog documentation).
- Add rules for forwarding the event stream between collectors to the configuration file /etc/rsyslog.conf:
*. * @@ <main collector server FQDN>: <port for incoming events>$ActionExecOnlyWhenPreviousIsSuspended on*. * @@ <backup collector server FQDN>: <port for incoming events>$ActionExecOnlyWhenPreviousIsSuspended off - Restart rsyslog by running the following command:
systemctl restart rsyslog.
Event stream control is now enabled on the event source server.
Page top
Event stream control using nginx
To control the event stream using nginx, you need to create and configure an nginx server to receive events from the event source and then forward these to collectors.
To enable nginx event stream control on the event source server:
- Create two or more identical collectors that you want to use to ensure uninterrupted reception of events.
- Install nginx on the server intended for event stream control.
- Installation command in Oracle Linux 8.6:
$sudo dnf install nginx - Installation command in Ubuntu 20.4:
$sudo apt-get install nginxWhen installing from sources, you must compile with the parameter
-with-streamoption:
$ sudo ./configure -with-stream -without-http_rewrite_module -without-http_gzip_module
- Installation command in Oracle Linux 8.6:
- On the nginx server, add the stream module to the nginx.conf configuration file that contains the rules for forwarding the stream of events between collectors.
With a large number of active services and users, you may need to increase the limit of open files in the nginx.conf settings. For example:
worker_rlimit_nofile 1000000;events {worker_connections 20000;}# worker_rlimit_nofile is the limit on the number of open files (RLIMIT_NOFILE) for workers. This is used to raise the limit without restarting the main process.# worker_connections is the maximum number of connections that a worker can open simultaneously. - Restart nginx by running the following command:
systemctl restart nginx - On the event source server, forward events to the nginx server.
Event stream control is now enabled on the event source server.
Nginx Plus may be required to fine-tune balancing, but certain balancing methods, such as Round Robin and Least Connections, are available in the base version of ngnix.
For more details on configuring nginx, please refer to the nginx documentation.
Page top
Predefined collectors
The predefined collectors listed in the table below are included in the KUMA distribution kit.
Predefined collectors
Name |
Description |
|---|---|
[OOTB] CEF |
Collects CEF events received over the TCP protocol. |
[OOTB] KSC |
Collects events from Kaspersky Security Center over the Syslog TCP protocol. |
[OOTB] KSC SQL |
Collects events from Kaspersky Security Center using an MS SQL database query. |
[OOTB] Syslog |
Collects events via the Syslog protocol. |
[OOTB] Syslog-CEF |
Collects CEF events that arrive over the UDP protocol and have a Syslog header. |
Creating an agent
A KUMA agent consists of two parts: one part is created inside the KUMA web interface, and the second part is installed on a server or on an asset in the network infrastructure.
An agent is created in several steps:
- Creating a resource set for the agent in the KUMA web interface
- Creating an agent service in the KUMA web interface
- Installing the server portion of the agent to the asset that will send events
KUMA agents for Windows devices can be created as follows:
- Manually by creating a set of agent resources and creating an agent service in the KUMA web interface.
- Automatically when creating a collector of the wmi, wec, or etw transport type. Although the set of resources and service of these agents are created in the Collector Installation Wizard, they must still be installed to the asset that will be used to forward an event. In a manually created agent, a connector of the etw type can be used in only one connection. If you configure multiple connections in a manually created etw agent, the status of the etw agent status is green, but events are not transmitted and an error is logged in the etw agent log.
Multiple agents can be installed on a device; the version of all such agents must be the same.
If an older version of the agent is already installed on the device where you want to create an agent, you must first stop the installed agent (remove the agent from a Windows device or restart the agent service on a Linux device), and then you can proceed to create a new agent. However, if the version of the installed agents is the same as the version of the agent that you want to create, stopping the agents is not necessary.
When creating and running an agent whose version is 3.0.1 or later, you must accept the terms and conditions of the End User License Agreement.
Creating a set of resources for an agent
In the KUMA web interface, an agent service is created based on the resource set for an agent that unites connectors and destinations. The agent type is determined by the connector that is used in the agent. The only exception is for agents with a destination of the diode type. These agents are considered to be diode agents.
To create a resource set for an agent in the KUMA web interface:
- In the KUMA web interface, under Resources → Agents, click Add agent.
This opens the agent creation window. The left part of the window displays tabs with base settings of the agent and connections. The Base settings tab is active.
- On the Base settings tab:
- In the Agent name field, enter a unique name for the created service. The name must contain 1 to 128 Unicode characters.
- In the Tenant drop-down list, select the tenant that will own the storage.
- If you want to enable logging of service operations, enable the Debug toggle switch.
- If you want to view the names of services or addresses of hosts from which the event came, enable the Trace event route toggle switch.
The Trace event route toggle switch is available if at least one internal destination is specified in the connections. By default, the toggle switch is Disabled.
When using the tcp, udp, http, wec, wmi, or etw connector type at the normalization stage, IP addresses of the assets from which the events were received are written to the DeviceAddress event field if it is empty.
- You can optionally add up to 256 Unicode characters describing the service in the Description field.
- Go to the tab of an existing connection or create a connection by clicking the Add button in the lower part of the left pane, then go to the tab of the newly created connection to edit its settings.
By default, a connection named Config #1 is created for a new agent. The name of the connection follows the Config #<number> pattern.
You can create multiple connections for an agent. If necessary, you can manage connections:
- Rename connections
- Duplicate connections
- Delete connections
- If necessary, in the Name of connection field, rename the connection for your convenience when managing it, for example, to be able to figure out from which connection and from which agent events arrived. If you leave the field blank, a name is assigned following the Config #<number> pattern.
The name can contain from 1 to 128 characters. The name can contain only letters and numerals and cannot contain special characters. Leading and trailing spaces are removed. When pasting a name into the field from the clipboard, if the text contains a newline, paragraph, or indentation, these characters are replaced with a space. You can reuse a name for multiple connections within the same agent.
If you have enabled event route tracing, then when viewing event information, the Events section displays the name of the connection from which the event was received.
- In the Connector group of settings, add a connector:
- If you want to select an existing connector, select it from the drop-down list.
- If you want to create a new connector, select Create new in the drop-down list and specify the following settings:
- Specify the connector name in the Name field. The name must contain 1 to 128 Unicode characters.
- In the Type drop-down list, select the connector type and specify its settings on the Basic settings and Advanced settings tabs. The available settings depend on the selected type of connector:
When using the tcp or udp connector type at the normalization stage, IP addresses of the assets from which the events were received will be written in the DeviceAddress event field if it is empty.
The ability to edit previously created wec, wmi, or etw connections in agents, collectors, and connectors is limited. You can change the connection type from wec to wmi or etw and back, but you cannot change the wec, wmi, or etw connection to any other connection type. When editing other connection types, you cannot select the wec, wmi, or etw types. You can create connections without any restrictions on the types of connectors.
When adding an (existing or new) wmi, wec, or etw connector for an agent, the TLS mode and Compression settings are not displayed on the agent, but the values of these settings are stored in the agent's configuration. For a new connector, these settings are disabled by default.
If TLS mode is enabled for an existing connector that is selected in the list, you cannot download the agent configuration file. In this case, to download the configuration file, you must go to the connector resource that is being used on the agent and disable TLS mode.
The connector is added to the selected connection of the agent's resource set. The created connector is only available in this resource set and is not displayed in the web interface Resources → Connectors section.
- In the Destinations group of settings, add a destination.
- If you want to select an existing destination, select it from the drop-down list.
- If you want to create a new destination, select Create new in the drop-down list and specify the following settings:
- Specify the destination name in the Name field. The name must contain 1 to 128 Unicode characters.
- In the Type drop-down list, select the destination type and specify its settings on the Basic settings and Advanced settings tabs. The available settings depend on the selected type of destination:
- nats-jetstream—used for NATS communications.
- tcp—used for communications over TCP.
- http—used for HTTP communications.
- diode—used to transmit events using a data diode.
- kafka—used for Kafka communications.
- file—used for writing to a file.
- Enable or disable the State toggle switch to enable or disable the sending of events to the destination. This toggle switch is turned on by default.
The advanced settings for an agent destination (such as TLS mode and compression) must match the advanced destination settings for the collector that you want to link to the agent.
There can be more than one destination point. You can add them by clicking the Add destination button and can remove them by clicking the
button. - Repeat steps 3–5 for each agent connection that you want to create.
- Click Save.
The resource set for the agent is created and displayed under Resources → Agents. Now you can create an agent service in KUMA.
Page top
Managing connections for an agent
You can manage the connections created for the agent by renaming, duplicating, or deleting them.
Renaming a connection
By default, the name of a new connection created in a resource set for an agent follows the Connection <number> pattern. For your convenience when managing connections, you can rename them, for example, to make it clear at a glance from which connection and from which agent an event was received.
To rename a connection:
- In the KUMA web interface, in the Resources → Agents section, create a new agent or click an existing agent in the table.
- If necessary, create a connection for the agent by clicking the Add button in the lower part of the left pane.
- Go to the tab of the connection that you want to rename.
- In the Connection name field, edit the name of the connection.
The name can contain from 1 to 128 characters. The name can contain only letters and numerals and cannot contain special characters. Leading and trailing spaces are removed. When pasting a name into the field from the clipboard, if the text contains a newline, paragraph, or indentation, these characters are replaced with a space. You can reuse a name for multiple connections within the same agent.
- Click Save.
The connection is renamed. If you have enabled event route tracing, then when viewing event information, the Events section displays the name of the connection from which the event was received.
Duplicating a connection
If you want to create a connection for an agent based on an existing connection, you can create a copy of the connection with identical settings.
To duplicate a connection:
- In the KUMA web interface, in the Resources → Agents section, create a new agent or click an existing agent in the table.
- If necessary, create a connection for the agent by clicking the Add button in the lower part of the left pane.
- Go to the tab of the connection that you want to duplicate and click the Duplicate button.
A connection is created for the agent with the same settings as the original connection. The new connection is created with one of the following names:
- If the original connection name followed the Connection <number> template, the duplicated connection name also follows this template. The connection is named "Connection <number+1>", where <number> is the number of the last created connection whose name followed the same template.
- If the original connection had been renamed, the new connection gets the same name. You can reuse a name for multiple connections within the same agent.
You can edit the name of the new connection in the Name of connection field on the tab of the connection.
Removing a connection
If the agent has more than one connection, you can delete a connection.
To delete a connection:
- In the KUMA web interface, in the Resources → Agents section, create a new agent or click an existing agent in the table.
- If necessary, create a connection for the agent by clicking the Add button in the lower part of the left pane.
- Go to the tab of the connection that you want to delete and click the Delete button.
You cannot restore a deleted connection, but you can recover the version of the agent in which this connection was previously saved through the change history.
Page top
Creating an agent service in the KUMA web interface
When a resource set is created for an agent, you can proceed to create an agent service in KUMA.
To create an agent service in the KUMA web interface:
- In the KUMA web interface, under Resources → Active services, click Add service.
- In the opened Choose a service window, select the resource set that was just created for the agent and click Create service.
The agent service is created in the KUMA web interface and is displayed under Resources → Active services. Now agent services must be installed to each asset from which you want to forward data to the collector. A service ID is used during installation.
Page top
Installing an agent in a KUMA network infrastructure
When an agent service is created in KUMA, you can proceed to installation of the agent to the network infrastructure assets that will be used to forward data to a collector.
Multiple agents can be installed on a device; the version of all such agents must be the same.
Prior to installation, verify the network connectivity of the system and open the ports used by its components.
Installing a KUMA agent on Linux assets
KUMA agent installed on Linux devices stops when you close the terminal or restart the server. If you do not want to start KUMA agents manually, we recommend installing agents using an application that automatically starts applications whenever the server is restarted, for example, the Supervisor application. If you want to start KUMA agents automatically, specify the automatic start and restart settings in the KUMA configuration file. For more information on configuring automatic starting and restarting, see the official documentation of applications for automatically starting applications.
Example configuration in Supervisor
To install a KUMA agent to a Linux asset:
- On the Linux device on which you want to install the KUMA agent, create directories for the KUMA configuration file and agents, for example:
- /opt/kaspersky/kuma
- /opt/kaspersky/agent
- Place the KUMA configuration file in the directory created for it. The KUMA configuration file can be found inside the installer in the /kuma-ansible-installer/roles/kuma/files directory.
Make sure the kuma file has sufficient rights to run.
- Create the KUMA user:
sudo useradd --system kuma && usermod -s /usr/bin/false kuma - Grant the KUMA user access to the directory with the KUMA configuration file and to all files within the directory:
sudo chown -R kuma:kuma <path to the directory with the KUMA configuration file> - Install the KUMA agent:
sudo /opt/kaspersky/kuma/kuma agent --core https://<KUMA Core server FQDN>:<port used by KUMA Core for internal communication (port 7210 by default)> --id <service ID copied from the KUMA web interface> --wd <path to the directory that will contain the files of the installed KUMA agent.If this option is not specified, the files will be stored in the directory where the KUMA file is located> [--accept-eula]You can install two KUMA agents on the same Linux device. In this case, KUMA agents will work in parallel. When installing the second KUMA agent, you need to specify a separate directory for it using the
--wdoption.To run the agent, you need to accept the End User License Agreement. You can add the
--accept-eulaoption to the command to automatically accept the End User License Agreement during KUMA agent installation. This lets you perform the installation non-interactively. If you do not specify this option, you will need to accept or reject the License Agreement manually during the installation of the KUMA agent.Examples of installing the KUMA agent:
- Installing the KUMA agent without automatically accepting the End User License Agreement:
sudo /opt/kaspersky/kuma/kuma agent --core https://kuma.example.com:7210 --id XXXX --wd /opt/kaspersky/kuma/agent/XXXX - Installing the KUMA agent with automatic acceptance of the End User License Agreement:
sudo /opt/kaspersky/kuma/kuma agent --core https://kuma.example.com:7210 --id XXXX --wd /opt/kaspersky/kuma/agent/XXXX --accept-eula
By using the
--accept-eulaoption during the installation of the KUMA agent, you confirm that you agree with and accept the terms and conditions of the End User License Agreement. - Installing the KUMA agent without automatically accepting the End User License Agreement:
- If you chose KUMA installation with the automatic acceptance of the End User License Agreement and want to read the text of the End User License Agreement, or if the text of the End User License Agreement was not automatically provided to you during the installation process, run the following command:
./kuma license --show
The KUMA agent is installed on the Linux device.
You can configure the collector to receive data that the KUMA agent sends to KUMA.
Page top
Installing a KUMA agent on Windows assets
Prior to installing a KUMA agent to a Windows asset, the server administrator must create a user account with the EventLogReaders and Log on as a service permissions on the Windows asset. This user account must be used to start the agent.
If you want to run the agent under a local account, you need administrator rights and Log on as a service. If you want to perform the collection remotely and only read logs under a domain account, EventLogReaders rights are sufficient.
To install a KUMA agent to a Windows asset:
- Copy the kuma.exe file to a folder on the Windows asset.
C:\Users\<User name>\Desktop\KUMAfolder is recommended for installation.The kuma.exe file is located inside the installer in the /kuma-ansible-installer/roles/kuma/files/ directory.
- Start the Command Prompt on the Windows asset with Administrator privileges and locate the folder containing the kuma.exe file.
- Execute the following command:
kuma agent --core https://<fully qualified domain name of the KUMA Core server>:<port used by the KUMA Core server for internal communications (port 7210 by default)> --id <ID of the agent service that was created in KUMA> --user <name of the user account used to run the agent, including the domain> --install [--accept-eula]To run the agent, you need to accept the End User License Agreement. You can add the
--accept-eulaoption to the command to automatically accept the End User License Agreement during agent installation. This lets you perform the installation non-interactively. If you do not specify this option, you will need to accept or reject the License Agreement manually during the installation of the KUMA agent.Examples:
- Installing the KUMA agent without automatically accepting the End User License Agreement:
kuma agent --core https://kuma.example.com:7210 --id XXXXX --user domain\username --install - Installing the KUMA agent with automatic acceptance of the End User License Agreement:
kuma agent --core https://kuma.example.com:7210 --id XXXXX --user domain\username --install --accept-eula
By using the
--accept-eulaoption during the installation of the KUMA agent, you confirm that you agree with and accept the terms and conditions of the End User License Agreement.You can get help information by executing the
kuma help agentcommand. - Installing the KUMA agent without automatically accepting the End User License Agreement:
- If you started the installation of the agent without automatically accepting the End User License Agreement, during the installation process, you will be prompted to read the text of the End User License Agreement and you will have the opportunity to accept or reject the agreement.
- If you chose installation with the automatic acceptance of the End User License Agreement and want to read the text of the End User License Agreement, or if the text of the End User License Agreement was not automatically provided to you during the installation process, run the following command:
kuma.exe license --showIf you want to accept the End User License Agreement, run the following command and press
y:kuma.exe license - Specify the password for the agent's user in one the following ways:
- Manually.
- From a file when installing the agent.
To avoid entering the password manually, you can add the password to a .TXT file and place the file in the same directory as the executable file of the agent.
In the command, specify the file containing the password as follows:
<name of the password file>.txt. For example,password.txt.kuma agent --core https://kuma.example.com:7210 --id XXXXX --user domain\username --install < password.txtAll data from the password.txt file is redirected to the command as the password, excluding end-of-line characters (\n\r, \n).
Path for storing the agent folder after installation: C:\ProgramData\Kaspersky Lab\KUMA\agent\${agent_id}.
If you did not accept the End User License Agreement (EULA) before installing the agent with the
< password.txtflag, an error message is displayed saying that the agreement was not accepted.You can accept the EULA in the following ways:
- In the password file, you can specify the EULA acceptance flag. To achieve this, the file with the password must contain two lines: the first line containing "y", which serves to assert EULA acceptance, and the second line containing the password. For example:
y<password>The agent installation command looks like this:
kuma agent --core https://kuma.example.com:7210 --id XXXXX --user domain\username --install < password.txtIn this case, you will not need to additionally accept the EULA when installing the agent.
If the EULA has been accepted before running the command with the password file, the first line in the file is interpreted as the password and the installation is aborted with an
Access deniederror. - You can accept the EULA and perform a silent installation at the same time by using the --accept-eula flag.
The agent installation command looks like this:
kuma agent --core https://kuma.example.com:7210 --id XXXXX --user domain\username --accept-eula --install < password.txtMake sure that only the password is specified in the file, on the first line, otherwise an error will occur.
The C:\ProgramData\Kaspersky Lab\KUMA\agent\<agent ID> folder is created and the KUMA agent service is installed in it. The agent forwards Windows events to KUMA, and you can set up a collector to receive them.
When the agent service is installed, it starts automatically. The service is also configured to restart in case of any failures. The agent can be restarted from the KUMA web interface, but only when the service is active. Otherwise, the service needs to be manually restarted on the Windows asset.
Removing a KUMA agent from Windows assets
When configuring services, you can check the configuration for errors before installation by running the agent with the following command:
kuma agent --core https://<fullly qualified domain name of the KUMA Core server>:<port used by the KUMA Core server for internal communications (port 7210 by default)> --id <ID of the agent service that was created in KUMA> --user <name of the user account used to run the agent, including the domain>
Automatically created agents
When creating a collector with wec, wmi, or etw connectors, agents are automatically created for receiving Windows events.
Automatically created agents have the following special conditions:
- Automatically created agents can have only one connection.
- Automatically created agents are displayed under Resources → Agents, and
auto createdis indicated at the end of their name. Agents can be reviewed or deleted. - The settings of automatically created agents are defined automatically based on the collector settings from the Connect event sources and Transport sections. You can change the settings only for a collector that has a created agent.
- The description of an automatically created agent is taken from the collector description in the Connect event sources section.
- Debugging of an automatically created agent is enabled and disabled in the Connect event sources section of the collector.
- When deleting a collector with an automatically created agent, you will be prompted to choose whether to delete the collector together with the agent or to just delete the collector. When deleting only the collector, the agent will become available for editing.
- When deleting automatically created agents, the type of collector changes to http, and the connection address is deleted from the URL field of the collector.
- If at least one Windows log name in wec or wmi connector is specified incorrectly, the agent will not receive events from any Windows log listed in the connector. At the same time the agent status will be green. Attempts to receive events will be repeated every 60 seconds, and error messages will be added to the service log.
- If in a connector of the etw type, the session name is specified incorrectly, the wrong provider is specified in the session, or an incorrect method is specified for sending events (to send events correctly, on the Windows Server side, you must specify "Real time" or "File and Real time" mode), events will not arrive from the agent, an error will be recorded in the agent log on Windows, and the status of the agent will be green. At the same time, no attempt will be made to get events every 60 seconds. If you modify session settings on the Windows side, you must restart the etw agent and/or the session for the changes to take effect.
In the KUMA interface, automatically created agents appear at the same time when the collector is created. However, they must still be installed on the asset that will be used to forward a message.
Page top
Update agents
When updating KUMA versions, the WMI, WEC, and ETW agents installed on remote machines must also be updated.
To update the agent, use an administrator account and follow these steps:
- In the KUMA web interface, in the Resources → Active services - Agents section, select the agent that you want to update and copy its ID.
You need the ID to install the new agent with the same ID after removing the old agent.
- In Windows, in the Services section, open the agent and click Stop.
- On the command line, go to the folder where the agent is installed and run the command to remove the agent from the server.
kuma.exe agent --id <
ID of agent service that was created in KUMA> --uninstall - Place the new agent in the same folder.
- On the command line, go to the folder with the new agent and from that folder, run the installation command using the agent ID from step 1.
kuma agent --core https://<
fullly qualified domain name of the KUMA Core server>:<port used by the KUMA Core server for internal communications (port 7210 by default)> --id <ID of the agent service that was created in KUMA> --user <name of the user account used to run the agent, including the domain> --install - When when installing the updated agent on a device for the first time, you must confirm the license. During the installation process, you are prompted to read the text of the license and then accept or reject the agreement. If this did not happen automatically, you can use the following command to view the text of the license:
kuma.exe license --showIf you want to accept the license agreement, run the command and press
y:kuma.exe license
The agent is updated.
Page top
Transferring events from isolated network segments to KUMA
Data transfer scenario
Data diodes can be used to transfer events from isolated network segments to KUMA. Data transfer is organized as follows:
- KUMA agent that is Installed on a standalone server, with a diode destination receives events and moves them to a directory from which the data diode will pick up the events.
The agent accumulates events in a buffer until it overflows or for a user-defined period after the last write to disk. The events are then written to a file in the temporary directory of the agent. The file is moved to the directory processed by the data diode; its name is a combination of the file contents hash (SHA-256) and the file creation time.
- The data diode moves files from the isolated server directory to the external server directory.
- A KUMA collector with a diode connector installed on an external server reads and processes events from the files of the directory where the data diode places files.
After all events are read from a file, it is automatically deleted. Before reading events, the contents of files are verified based on the hash in the file name. If the contents fail verification, the file is deleted.
In the described scenario, the KUMA components are responsible for moving events to a specific directory within the isolated segment and for receiving events from a specific directory in the external network segment. The data diode transfers files containing events from the directory of the isolated network segment to the directory of the external network segment.
For each data source within an isolated network segment, you must create its own KUMA collector and agent, and configure the data diode to work with separate directories.
Configuring KUMA components
Configuring KUMA components for transferring data from isolated network segments consists of the following steps:
- Creating a collector service in the external network segment.
At this step, you must create and install a collector to receive and process the files that the data diode will transfer from the isolated network segment. You can use the Collector Installation Wizard to create the collector and all the resources it requires.
At the Transport step, you must select or create a connector of the diode type. In the connector, you must specify the directory to which the data diode will move files from the isolated network segment.
The user "kuma" that runs the collector must have read/write/delete permissions in the directory to which the data diode moves data from the isolated network segment.
- Creating a resource set for a KUMA agent.
At this step, you must create a resource set for the KUMA agent that will receive events in an isolated network segment and prepare them for transferring to the data diode. The diode agent resource set has the following requirements:
- The destination in the agent must have the diode type. In this resource, you must specify the directory from which the data diode will move files to the external network segment.
- You cannot select connectors of the sql or netflow types for the diode agent.
- TLS mode must be disabled in the connector of the diode agent.
- Downloading the agent configuration file as JSON file.
- The set of agent resources from a diode-type destination must be downloaded as a JSON file.
- If secret resources were used in the agent resource set, you must manually add the secret data to the configuration file.
- Installing the KUMA agent service in the isolated network segment.
At this step, you must install the agent in an isolated network segment based on the agent configuration file that was created at the previous step. It can be installed to Linux and Windows devices.
Configuring a data diode
The data diode must be configured as follows:
- Data must be transferred atomically from the directory of the isolated server (where the KUMA agent places the data) to the directory of the external server (where the KUMA collector reads the data).
- The transferred files must be deleted from the isolated server.
For information on configuring the data diode, please refer to the documentation for the data diode used in your organization.
Special considerations
When working with isolated network segments, operations with SQL and NetFlow are not supported.
When using the scenario described above, the agent cannot be administered through the KUMA web interface because it resides in an isolated network segment. Such agents are not displayed in the list of active KUMA services.
Diode agent configuration file
A created set of agent resources with a diode-type destination can be downloaded as a configuration file. This file is used when installing the agent in an isolated network segment.
To download the configuration file:
In the KUMA web interface, under Resources → Agents, select the required set of agent resources with a diode destination and click Download config.
The agent settings configuration is downloaded as a JSON file based on the settings of your browser. Secrets used in the agent resource set are downloaded empty. Their IDs are specified in the file in the secrets section. To use a configuration file to install an agent in an isolated network segment, you must manually add secrets to the configuration file (for example, specify the URL and passwords used in the agent connector to receive events).
You must use an access control list (ACL) to configure permissions to access the file on the server where the agent will be installed. File read access must be available to the user account that will run the diode agent.
Below is an example of a diode agent configuration file with a kafka connector.
{ "config": { "id": "<ID of the set of agent resources>", "name": "<name of the set of agent resources>", "proxyConfigs": [ { "connector": { "id": "<ID of the connector. This example shows a kafka-type connector, but other types of connectors can also be used in a diode agent. If a connector is created directly in the set of agent resources, the ID is not defined.>", "name": "<name of the connector>", "kind": "kafka", "connections": [ { "kind": "kafka", "urls": [ "localhost:9093" ], "host": "", "port": "", "secretID": "<ID of the secret>", "clusterID": "", "tlsMode": "", "proxy": null, "rps": 0, "maxConns": 0, "urlPolicy": "", "version": "", "identityColumn": "", "identitySeed": "", "pollInterval": 0, "query": "", "stateID": "", "certificateSecretID": "", "authMode": "pfx", "secretTemplateKind": "", "certSecretTemplateKind": "" } ], "topic": "<kafka topic name>", "groupID": "<kafka group ID>", "delimiter": "", "bufferSize": 0, "characterEncoding": "", "query": "", "pollInterval": 0, "workers": 0, "compression": "", "debug": false, "logs": [], "defaultSecretID": "", "snmpParameters": [ { "name": "", "oid": "", "key": "" } ], "remoteLogs": null, "defaultSecretTemplateKind": "" }, "destinations": [ { "id": "<ID of the destination. If the destination is created directly in the set of agent resources, the ID is not defined.>", "name": "<destination name>", "kind": "diode", "connection": { "kind": "file", "urls": [ "<path to the directory where the destination should place events that the data diode will transmit from the isolated network segment>", "<path to the temporary directory in which events are placed to prepare for data transmission by the diode>" ], "host": "", "port": "", "secretID": "", "clusterID": "", "tlsMode": "", "proxy": null, "rps": 0, "maxConns": 0, "urlPolicy": "", "version": "", "identityColumn": "", "identitySeed": "", "pollInterval": 0, "query": "", "stateID": "", "certificateSecretID": "", "authMode": "", "secretTemplateKind": "", "certSecretTemplateKind": "" }, "topic": "", "bufferSize": 0, "flushInterval": 0, "diskBufferDisabled": false, "diskBufferSizeLimit": 0, "healthCheckPath": "", "healthCheckTimeout": 0, "healthCheckDisabled": false, "timeout": 0, "workers": 0, "delimiter": "", "debug": false, "disabled": false, "compression": "", "filter": null, "path": "" } ] } ], "workers": 0, "debug": false }, "secrets": { "<secret ID>": { "pfx": "<encrypted pfx key>", "pfxPassword": "<password to the encrypted pfx key. The changeit value is exported from KUMA instead of the actual password. In the configuration file, you must manually specify the contents of secrets>" } }, "tenantID": "<ID of the tenant>" } |
Description of secret fields
Secret fields
Field name |
Type |
Description |
|
string |
User name |
|
string |
Password |
|
string |
Token |
|
array of strings |
URL list |
|
string |
Public key (used in PKI) |
|
string |
Private key (used in PKI) |
|
string containing the base64-encoded pfx file |
Base64-encoded contents of the PFX file. In Linux, you can get the base64 encoding of a file by running the following command:
|
|
string |
Password of the PFX |
|
string |
Used in snmp3. Possible values: |
|
string |
Used in snmp1 |
|
string |
Used in snmp3. Possible values: |
|
string |
Used in snmp3. Possible values: |
|
string |
Used in snmp3 |
|
string containing the base64-encoded pem file |
Base64-encoded contents of the PEM file. In Linux, you can get the base64 encoding of a file by running the following command:
|
Installing Linux Agent in an isolated network segment
To install a KUMA agent to a Linux device in an isolated network segment:
- Place the following files on the Linux server in an isolated network segment that will be used by the agent to receive events and from which the data diode will move files to the external network segment:
- Agent configuration file.
You must use an access control list (ACL) to configure access permissions for the configuration file so that only the KUMA user will have file read access.
- Executive file /opt/kaspersky/kuma/kuma (the "kuma" file can located in the installer in the /kuma-ansible-installer/roles/kuma/files/ directory).
- Agent configuration file.
- Execute the following command:
sudo ./kuma agent --cfg <path to the agent configuration file> --wd <path to the directory where the files of the agent being installed will reside. If this flag is not specified, the files will be stored in the directory where the kuma file is located>
The agent service is installed and running on the server in an isolated network segment. It receives events and relays them to the data diode so that they can be sent to an external network segment.
Page top
Installing Windows Agent in an isolated network segment
Prior to installing a KUMA agent to a Windows asset, the server administrator must create a user account with the EventLogReaders and Log on as a service permissions on the Windows asset. This user account must be used to start the agent.
To install a KUMA agent to a Windows device in an isolated network segment:
- Place the following files on the Window server in an isolated network segment that will be used by the agent to receive events and from which the data diode will move files to the external network segment:
- Agent configuration file.
You must use an access control list (ACL) to configure access permissions for the configuration file so that the file can only be read by the user account that will run the agent.
- Kuma.exe executable file. This file can be found inside the installer in the /kuma-ansible-installer/roles/kuma/files/ directory.
We recommend using the
C:\Users\<user name>\Desktop\KUMAfolder. - Agent configuration file.
- Start the Command Prompt on the Windows asset with Administrator privileges and locate the folder containing the kuma.exe file.
- Execute the following command:
kuma.exe agent --cfg <path to the agent configuration file> --user <user name that will run the agent, including the domain> --installYou can get installer Help information by running the following command:
kuma.exe help agent - Enter the password of the user account used to run the agent.
The C:\Program Files\Kaspersky Lab\KUMA\agent\<Agent ID> folder is created in which the KUMA agent service is installed. The agent moves events to the folder so that they can be processed by the data diode.
When installing the agent, the agent configuration file is moved to the directory C:\Program Files\Kaspersky Lab\KUMA\agent\<agent ID specified in the configuration file>. The kuma.exe file is moved to the C:\Program Files\Kaspersky Lab\KUMA directory.
When installing an agent, its configuration file must not be located in the directory where the agent is installed.
When the agent service is installed, it starts automatically. The service is also configured to restart in case of any failures.
Removing a KUMA agent from Windows assets
When configuring services, you can check the configuration for errors before installation by running the agent with the following command:
kuma.exe agent --cfg <path to agent configuration file>
Transferring events from Windows machines to KUMA
To transfer events from Windows machines to KUMA, a combination of a KUMA agent and a KUMA collector is used. Data transfer is organized as follows:
- The KUMA agent installed on the machine receives Windows events:
- Using the WEC connector: the agent receives events arriving at the host under a subscription, as well as the server logs.
- Using the WMI connector: the agent connects to remote servers specified in the configuration and receives events.
- Using the ETW connector: the agent connect to the DNS server using the session name and provider specified in the connector settings, and receives events.
- The agent sends events (without preprocessing) to the KUMA collector specified in the destination.
You can configure the agent so that different logs are sent to different collectors.
- The collector receives events from the agent, performs a full event processing cycle, and sends the processed events to the destination.
Receiving events from the WEC agent is recommended when using centralized gathering of events from Windows hosts using Windows Event Forwarding (WEF). The agent must be installed on the server that collects events; it acts as the Windows Event Collector (WEC). We do not recommend installing KUMA agents on every endpoint host from which you want to receive events.
The process of configuring the receipt of events using the WEC Agent is described in detail in the appendix: Configuring receipt of events from Windows devices using KUMA Agent (WEC).
For details about the Windows Event Forwarding technology, please refer to the official Microsoft documentation.
We recommend receiving events using the WMI agent in the following cases:
- If it is not possible to use the WEF technology to implement centralized gathering of events, and at the same time, installation of third-party software (for example, the KUMA agent) on the event source server is prohibited.
- If you need to obtain events from a small number of hosts — no more than 500 hosts per one KUMA agent.
The ETW agent is used only to retrieve events from Windows logs of DNS servers.
For connecting Windows logs as an event source, we recommend using the Add event source wizard. When using a wizard to create a collector with WEC or WMI connectors, agents are automatically created for receiving Windows events. You can also manually create the resources necessary for collecting Windows events.
An agent and a collector for receiving Windows events are created and installed in several stages:
- Creating a resource set for an agent.
Agent connector:
When creating an agent, on the Connection tab, you must create or select a connector of the WEC, WMI, or ETW type.
If at least one Windows log name in a WEC or WMI connector is specified incorrectly, the agent will receive events from all Windows logs listed in the connector, except the problematic log. At the same time the agent status will be green. Attempts to receive events will be repeated every 60 seconds, and error messages will be added to the service log.
Agent destination:
The type of agent destination depends on the data transfer method you use: nats-jetstream, tcp, http, diode, kafka, file.
You must use the
\0value as the destination separator.The advanced settings for the agent destination (such as separator, compression and TLS mode) must match the advanced destination settings for the collector connector that you want to link to the agent.
- Create an agent service in the KUMA web interface.
- Installing the KUMA agent on the Windows machine from which you want to receive Windows events.
Before installation, make sure that the system components have access to the network and open the necessary network ports:
- Port 7210, TCP: from server with collectors to the Core.
- Port 7210, TCP: from agent server to the Core.
- The port configured in the URL field when the connector was created: from the agent server to the server with the collector.
- Creating and installing KUMA collector.
When creating a set of collectors, at the Transport step, you must create or select a connector that the collector will use to receive events from the agent. Connector type must match the type of the agent destination.
The advanced settings of the connector (such as delimiter, compression, and TLS mode) must match the advanced settings of the agent destination that you want to link to the agent.
AI score and asset status
The AI score and asset status service can be installed if your license covers the AI module.
The AI service helps with precisely assessing the severity of correlation events generated by triggered correlation rules.
The AI service gets correlation events with a non-empty Affected assets field from the available storage clusters, constructs the expected sequence of events, and trains the AI model. Based on the chain of triggered correlation rules, the AI service calculates whether such a sequence of events is typical for this infrastructure. Non-typical patterns increase the score of the asset.
The AI service calculates the AI score and the Status, which are displayed in the asset card. If you remove the license, the AI score and Status fields are hidden from the asset card. If you add the license again, the values of the AI score and Status fields are shown again.
The score is a number that quantifies how non-typical the activity on the asset is, and whether it is worth paying attention to. Possible values of the Status field: Low, Medium, High, Critical. The score is a number in the range from 0 to 1.
There are four ranges that correspond to statuses:
Low: 0 ≤ score < 0.25
Medium: 0.25 ≤ score < 0.5
High: 0.5 ≤ score < 0.75
Critical: 0.75 ≤ score ≤ 1
You can apply a filter by the Score AI and Status fields when searching for assets. You can also set up proactive categorization of assets by the AI score and Status fields, which moves the asset to the category corresponding to the risk level as soon as the AI service assigns a score to the asset.
You can create a structure of multiple categories and automatically populate these with assets in accordance with the calculated risk values.
In the Settings → Asset audit section, you can configure audit events to be generated when an asset is added to a category. Audit events can be taken into account in correlation rules, and you can monitor them on the dashboard and in reports.
To monitor asset category changes on the dashboard, create an Events widget with a query similar to the following:
SELECT count(ID) AS `metric`, formatDateTime(toTimeZone(fromUnixTimestamp64Milli(Timestamp), 'Europe/Moscow'), '%d.%m.%Y %H:%m:%S') AS `value` FROM `events`
where DeviceVendor = 'Kaspersky' and DeviceProduct = 'KUMA' and
DeviceEventCategory = 'Audit assets' and DeviceAction= 'asset added to category'
and DeviceCustomString1 = 'Main/Categorized assets/ML/score>0.5'
GROUP BY Timestamp ORDER BY value LIMIT 250
To monitor the distribution of assets by status on the dashboard, create an Assets by severity widget. The Assets by severity widget is available if the license includes the AI module. The pie chart indicates the numbers of assets grouped by status.
Every time the AI service is restarted, the AI service trains the model from scratch and reassesses the score of the assets mentioned in events of the current day.
The directory specified in the configuration file stores events that the AI service got from KUMA storage clusters for the specified number of days. For example, if the configuration file specifies 12 days, the AI service gets events for the past 12 days. The oldest events are deleted from the directory. The trained model is stored in the same directory.
The model is retrained at midnight UTC. The asset score is reassessed once an hour for all assets that were mentioned in events of the current day (UTC).
Service logs are stored in /var/log/syslog.
Installing and removing the AI score and asset status service
Installing the AI score and asset status service
To install the service:
- Extract the mlservice-installer-0.1.54.XX.tgz archive that is included in the distribution kit.
The mlservice-installer-0.1.54.XX.tgz archive contains scripts for installing and removing the service, as well as the config.yaml configuration file.
- In the config.yaml configuration file, in the
kuma_addresssetting, specify the FQDN of the host on which KUMA Core is installed and the port on which the KUMA Core is to listen for AI service connections.In a high availability configuration, you must specify port 7226. You can keep default values for the rest of the settings. After installation, the service starts with the settings specified in the config.yaml file.
- If you want to install the service on a remote host, specify the address of the remote host in the inventory.yaml file and make sure you have network access. By default, the service is installed on the local host as specified in inventory.yaml.
- Get the Core certificate in the KUMA web interface: in the Administrator menu, click REST API CA certificate. The certificate is downloaded to your default download directory.
- Save the KUMA Core certificate file in the roles/mlservice/files directory under the installer directory.
- Change to the directory with the service files and from that directory, run the following command:
./install <path to inventory.yaml> - If you accept the terms and conditions of the EULA, press
Y. If you do not accept the terms and conditions of the EULA, you cannot proceed with the installation of the service. You can find the file with the text of the EULA in the mlservice-installer/eula directory. - The installer generates a certificate and a key during the installation process and places these in the directories specified in the config.yaml configuration file. You must upload the certificate to KUMA.
In the KUMA web interface, in the Settings → AI service section, in the AI score and asset status window, fill in the following fields:
- In the URL field, specify the FQDN of the host on which the KUMA Core is installed and port on which the KUMA Core is to listen for the AI service. For example, <FQDN of the host on which KUMA Core is installed>:7226 The port number must match the port number specified in the configuration file. Make sure the port is not being used by other applications.
For a KUMA installation in high availability configuration, the URL field is not displayed in the interface, the port value is taken from the KUMA_APPRAISER_AI_API_PORT environment variable and the port is opened for all IP addresses of the KUMA Core host.
- In the Certificate drop-down list, select Create new to open the Create secret window; in that window, specify Certificate as the secret type and upload the certificate from the directory specified in the config.yaml configuration file.
- Move the Disabled toggle switch to the inactive position. By default, the toggle switch is on.
- Click Save.
Immediately after installation, the service will make attempts to connect to KUMA for 15 minutes with 1-minute intervals. If no certificate is added in the KUMA web interface, the connection will fail and the service will stop. In this case, you can add a certificate and restart the AI service; the service will make new attempts to connect.
After saving the settings, get the log of the Core server and make sure it does not contain the "<port number>: bind: address already in use" error
- In the URL field, specify the FQDN of the host on which the KUMA Core is installed and port on which the KUMA Core is to listen for the AI service. For example, <FQDN of the host on which KUMA Core is installed>:7226 The port number must match the port number specified in the configuration file. Make sure the port is not being used by other applications.
The AI service is installed.
Removing the AI score and asset status service
To remove the AI service, change to the directory with the AI service files, and from that directory, run the following:
./uninstall <path to inventory.yaml>
Settings of the AI score and asset status service
Available AI service settings
Setting |
Description |
|---|---|
|
Path to the directory that contains the certificate generated by the installer. Default path: /opt/kaspersky/mlservice/service.crt You can specify a different path. In this case, make sure that the user that starts the service has access to the specified directory. |
|
Path to the directory that contains the key generated by the installer. Default path: /opt/kaspersky/mlservice/service.key You can specify a different path. In this case, make sure that the user that starts the service has access to the specified directory. |
|
FQDN of the host on which the KUMA Core is installed and port on which the KUMA Core is to listen for the AI service. To install in a high availability configuration, you must specify port 7226. Example: <FQDN of the host on which KUMA Core is installed>:7226
|
|
Path to the directory where the KUMA Core certificate is located. Default path: /opt/kaspersky/mlservice/core-external-ca.cert |
|
Path to the directory where the service is to place received correlation events. Default path: /var/mlservice/events |
|
Path to the directory where the service is to place the trained model. Default path: /var/mlservice/models |
|
The number of days for which you want to get correlation events that involve your assets from the available storage clusters in order to train the model. The default setting is 12 days. This means that the directory will contain events for the past <N> days. The oldest events are deleted. |
|
Overlap time. When events for assessing the scores of assets are downloaded on a schedule, they are retrieved from the time of the last downloaded event for the current day minus the value of the events_overlap_in_seconds setting. The default value is 60 seconds. Example: the time when the last event was received is 8:58. The starting time for the next batch of events to be downloaded is 8:57. |
Analyze with KIRA
In KUMA, you can use Kaspersky Investigation & Response Assistant (KIRA) to analyze the command that triggered the correlation rule. The command is written to the event field if normalization is configured to write the command to the event field. You can view the command in the event card or the correlation event card and click Analyze with KIRA in the upper part of the event card to send a query to KIRA. KIRA performs deobfuscation and displays the cached result of the previous request for the command if such a request was performed earlier. This helps investigate alerts and incidents. The analysis results are kept in cache for 14 days and are available for review. Each time a request is sent, an audit event is generated.
This functionality is available in the RU region if the following conditions are satisfied:
- An active license covering the AI module is available.
If the license has expired, the analysis results remain available through tasks during the lifetime of the cache, that is, for 14 days from the moment the result is cached.
- A certificate was uploaded when configuring the KIRA integration. You can get the certificate file in PFX format, packed in the <customer name>.ZIP archive, and the password for the certificate from Technical Support.
- The user has one of the following roles with corresponding access rights: General administrator, Administrator, Tier 2 analyst, Tier 1 analyst, and Junior analyst. Only a user with the General administrator role can configure the integration.
Configuring integration with KIRA
To configure integration with KIRA:
- Get a license with the AI module and activate in KUMA.
- In the KUMA web console, go to the Settings → AI services section and in the AI services window, go to the KIRA tab.
- On the KIRA tab, in the Certificate drop-down list, click Select file and upload the certificate file in PFX format, packed into the <customer name>.ZIP archive.
- In the Certificate password, enter the password.
- If necessary, in the Proxy server drop-down list, select a previously created resource or create a new resource.
- Click Save.
After clicking Save, you are prompted to accept the terms of use of the service. If you do not accept the terms of use, you cannot proceed to save settings and use the functionality.
After saving the settings, the available number of tokens is displayed. The allowance is reset every day.
If you want to disable this functionality, turn on the Disable toggle switch.
Integration is configured, you can proceed to the analysis. Analysis is available for all events: new and previously received.
Page top
Analyzing using KIRA
After configuring the integration, you can analyze commands using KIRA.
To perform an analysis:
- Go to the card of the event or correlation event and on the toolbar in the event card, in the Analyze with KIRA drop-down list, select the field whose value you want to analyze.
This opens the Analyze with KIRA window.
- This opens the Analyze with KIRA window, displaying the command to be analysed. You can do the following:
- If the command is obfuscated, it is de-obfuscated automatically without spending tokens. If you want to analyze the command in obfuscated form, in the Actions drop-down list, select Revert to original string. If necessary, you can de-obfuscate the string again.
- If you want to know in advance how many tokens will be spent on analysis, in the Actions drop-down list, select Calculate size in tokens. Number of tokens for analysis = number of tokens to send a request + number of tokens to produce a response.
- To analyze the command, click the Analyze button.
If you have enough tokens, the analysis and the Query in KIRA task are started.
Processing the request may take 30 seconds or longer.
Tokens are expended even if the request returns an error saying that the requested topic is in the deny list; the information about remaining tokens is also updated.
The command is analyzed.
The result of the analysis is available in the same Analyze with KIRA window: the output, a brief summary, and a detailed analysis. You can also view the result in a separate window by clicking View result in the pop-up notification. This opens a separate KIRA result window, from which you can also click the link to Go to event. After the analysis is completed, the Result is displayed on the KIRA analysis tab in the event card and is available for viewing by all users with access to the Analyze with KIRA functionality.
You can also view the result of the analysis in the Task manager section in the properties of the Query in KIRA task. You can click the name of the task to select one of the following commands in the context menu:
- View result shows the results of the task from the cache to any user with access to KIRA tasks; no tokens are expended.
- Restart performs the analysis disregarding the data of the previous analysis stored in the cache; the analysis expends tokens.
Possible errors of the Analyze using KIRA task
Possible errors
HTTP code |
Description |
400 |
Invalid client certificate. |
404 |
Error in request. |
401 |
Missing certificate information. Please contact Technical Support. |
403 |
Daily limit of tokens exhausted. |
413 |
Maximum number of tokens for request reached. Make the request smaller. |
500 |
Unknown error of the service. |
502 |
KIRA service unavailable. |
503 |
Error getting access token in service. |
Other |
Unknown error. |
No code |
Error while processing the request. |
Configuring event sources
This section provides information on configuring the receipt of events from various sources.
Configuring receipt of Auditd events
KUMA lets you monitor and audit the Auditd events on Linux devices.
Before configuring event receiving, make sure to create a new KUMA collector for the Auditd events.
Configuring the receipt of Auditd events involves the following steps:
- Configuring the KUMA collector for receiving Auditd events.
- Configuring the event source server.
- Verifying receipt of Auditd events by the KUMA collector.
You can verify that the Auditd event source server is configured correctly by searching for related events in the KUMA web interface.
Configuring the KUMA collector for receiving Auditd events
At the Transport step, select the TCP or UDP connector type and move the Auditd toggle switch to the enabled position.
After creating a collector, in order to configure event receiving using rsyslog, you must install a collector on the network infrastructure server intended for receiving events.
For details on installing the KUMA collector, refer to the Installing collector in the network infrastructure section.
Page top
Configuring the event source server
The rsyslog service is used to transmit events from the server to the KUMA collector.
To configure transmission of events from the server to the collector:
- Make sure that the rsyslog service is installed on the event source server. For this purpose, execute the following command:
systemctl status rsyslog.serviceIf the rsyslog service is not installed on the server, install it by executing the following command:
yum install rsyslogsystemctl enable rsyslog.servicesystemctl start rsyslog.service - Edit the audit.service configuration file /etc/audit/auditd.conf and change the value of the
name_formatparameter toNONE:name_format=NONEAfter editing the settings, restart the auditd service:
sudo systemctl restart auditd.service - In
- To send events over TCP:
$ModLoad imfile$InputFileName /var/log/audit/audit.log$InputFileTag tag_audit_log:$InputFileStateFile audit_log$InputFileSeverity info$InputFileFacility local6$InputRunFileMonitor*.* @@<IP address of the KUMA collector>:<port of the KUMA collector>For example:*.* @@192.1.3.4:5858 To send events over UDP:$ModLoad imfile$InputFileName /var/log/audit/audit.log$InputFileTag tag_audit_log:$InputFileStateFile audit_log$InputFileSeverity info$InputFileFacility local6$InputRunFileMonitortemplate(name="AuditFormat" type="string" string="<%PRI%>%TIMESTAMP:::date-rfc3339% %HOSTNAME% %syslogtag% %msg%\n")*.* @<IP address of the KUMA collector>:<port of the KUMA collector>For example:*.* @192.1.3.4:5858;AuditFormat
- To send events over TCP:
- Save the changes to the audit.conf file.
- Restart the rsyslog service by executing the following command:
systemctl restart rsyslog.service
The event source server is configured. Data about events is transmitted from the server to the KUMA collector.
Page top
Configuring receipt of KATA/EDR events
You can configure the receipt of Kaspersky Anti Targeted Attack Platform events in the KUMA
.
Before configuring event receipt, make sure to create a KUMA collector for the KATA/EDR events.
When creating a collector in the KUMA web interface, make sure that the port number and connector type match the port and protocol specified in the Kaspersky Anti Targeted Attack Platform event export settings in KUMA.
To receive Kaspersky Anti Targeted Attack Platform events using Syslog, in the Collector Installation Wizard, at the Event parsing step, select the [OOTB] KATA normalizer.
Configuring the receipt of KATA/EDR events involves the following steps:
- Configuring the forwarding of KATA/EDR events
- Installing the KUMA collector in the network infrastructure
- Verifying receipt of KATA/EDR events in the KUMA collector
You can verify that the KATA/EDR event source server is configured correctly by searching for related events in the KUMA web interface. Kaspersky Anti Targeted Attack Platform events are displayed as KATA in the table with search results.
Configuring export of KATA/EDR events to KUMA
To configure export of events from Kaspersky Anti Targeted Attack Platform to KUMA:
- In a browser on any computer with access to the Central Node server, enter the IP address of the server hosting the Central Node component.
A window for entering Kaspersky Anti Targeted Attack Platform user credentials opens.
- In the user credentials entry window, select the Local administrator check box and enter the Administrator credentials.
- Go to the Settings → SIEM system section.
- Specify the following settings:
- Select the Activity log and Detections check boxes.
- In the Host/IP field, enter the IP address or host name of the KUMA collector.
- In the Port field, specify the port number to connect to the KUMA collector.
- In the Protocol field, select TCP or UDP from the list.
- In the Host ID field, specify the server host ID to be indicated in the SIEM systems log as a detection source.
- In the Alert frequency field, enter the interval for sending messages: from 1 to 59 minutes.
- Enable TLS encryption, if necessary.
- Click Apply.
Export of Kaspersky Anti Targeted Attack Platform events to KUMA is configured.
Page top
Creating KUMA collector for receiving KATA/EDR events
After configuring the event export settings, you must create a collector for Kaspersky Anti Targeted Attack Platform events in the KUMA web interface.
For details on creating a KUMA collector, refer to Creating a collector.
When creating a collector in the KUMA web interface, make sure that the port number matches the port specified in step 4c of Configuring export of Kaspersky Anti Targeted Attack Platform events to KUMA, and that the connector type corresponds to the type specified in step 4d.
To receive Kaspersky Anti Targeted Attack Platform events using Syslog, in the Collector Installation Wizard, at the Event parsing step, select the [OOTB] KATA normalizer.
Page top
Installing KUMA collector for receiving KATA/EDR events
After creating a collector, to configure receiving Kaspersky Anti Targeted Attack Platform events, install a new collector on the network infrastructure server intended for receiving events.
For details on installing the KUMA collector, refer to the Installing collector in the network infrastructure section.
Page top
Configuring the export of Kaspersky Security Center events to the KUMA SIEM system
KUMA allows you to receive and export events from the Kaspersky Security Center Administration Server to the KUMA SIEM system.
Configuring the export and receipt of Kaspersky Security Center events involves of the following steps:
- Configuring the export of Kaspersky Security Center events.
- Configuring the KUMA Collector.
- Installing the KUMA collector in the network infrastructure.
- Verifying the receipt of Kaspersky Security Center events by KUMA.
You can verify if the events from Kaspersky Security Center Administration Server were correctly exported to the KUMA SIEM system by using the KUMA web interface to search for related events.
To display Kaspersky Security Center events in the table, enter the following search expression:
SELECT * FROM `events` WHERE DeviceProduct = 'KSC' ORDER BY Timestamp DESC LIMIT 250
Configuring export of Kaspersky Security Center events in CEF format
Kaspersky Security Center allows you to configure the settings for exporting events in the CEF format to a SIEM system.
The function of exporting Kaspersky Security Center events in the CEF format to SIEM systems is available with Kaspersky Endpoint Security for Business Advanced license or above.
To configure export of events from Kaspersky Security Center Administration Server to the KUMA SIEM system:
- In Kaspersky Security Center console tree, select the Administration server node.
- In the workspace of the node, select the Events tab.
- Click the Configure notifications and event export link and select Configure export to SIEM system from the drop-down list.
The Properties: Events window opens. By default the Events export section is displayed.
- In the Events export section, select the Automatically export events to SIEM system database check box.
- In the SIEM system drop-down list select ArcSight (CEF format).
- In the corresponding fields, specify the address of the KUMA SIEM system server and the port for connecting to the server. Select TCP/IP as the protocol.
You can click Export archive and specify the starting date from which pre-existing KUMA events are to be exported to the SIEM system database. By default, Kaspersky Security Center exports events starting from the current date.
- Click OK.
As a result, the Kaspersky Security Center Administration Server automatically exports all events to the KUMA SIEM system.
Page top
Configuring KUMA collector for collecting Kaspersky Security Center events
After configuring the export of events in the CEF format from Kaspersky Security Center Administration Server, configure the collector in the KUMA web interface.
To configure the KUMA Collector for Kaspersky Security Center events:
- In the KUMA web interface, select Resources → Collectors.
- In the list of collectors, find the collector with the [OOTB] KSC normalizer and open it for editing.
- At the Transport step, in the URL field, specify the port to be used by the collector to receive Kaspersky Security Center events.
The port must match the port of the KUMA SIEM system server.
- At the Event parsing step, make sure that the [OOTB] KSC normalizer is selected.
- At the Routing step, make sure that the following destinations are added to the collector resource set:
- Storage. To send processed events to the storage.
- Correlator. To send processed events to the correlator.
If the Storage and Correlator destinations were not added, create them.
- At the Setup validation tab, click Create and save service.
- Copy the command for installing the KUMA collector that appears.
Installing KUMA collector for collecting Kaspersky Security Center events
After configuring the collector for collecting Kaspersky Security Center events in the CEF format, install the KUMA collector on the network infrastructure server intended for receiving events.
For details on installing the KUMA collector, refer to the Installing collector in the network infrastructure section.
Page top
Configuring receiving Kaspersky Security Center event from MS SQL
KUMA allows you to receive information about Kaspersky Security Center events from an MS SQL database.
Before configuring, make sure that you have created the KUMA collector for Kaspersky Security Center events from MS SQL.
When creating the collector in the KUMA web interface, at the Transport step, select the [OOTB] KSC SQL connector.
To receive Kaspersky Security Center events from the MS SQL database, at the Event parsing step, select the [OOTB] KSC from SQL normalizer.
Configuring event receiving consists of the following steps:
- Creating an account in the MS SQL.
- Configuring the SQL Server Browser service.
- Creating a secret.
- Configuring a connector.
- Installing a collector in the network infrastructure.
- Verifying receipt of events from MS SQL in the KUMA collector.
You can verify that the receipt of events from MS SQL is configured correctly by searching for related events in the KUMA web interface.
Creating an account in the MS SQL database
To receive Kaspersky Security Center events from MS SQL, a user account is required that has the rights necessary to connect and work with the database.
To create an account for working with MS SQL:
- Log in to the server with MS SQL for Kaspersky Security Center installed.
- Using SQL Server Management Studio, connect to MS SQL using an account with administrator rights.
- In the Object Explorer pane, expand the Security section.
- Right-click the Logins folder and select New Login from the context menu.
The Login - New window opens.
- On the General tab, click the Search button next to the Login name field.
The Select User or Group window opens.
- In the Enter the object name to select (examples) field, specify the object name and click OK.
The Select User or Group window closes.
- In the Login - New window, on the General tab, select the Windows authentication option.
- In the Default database field, select the Kaspersky Security Center database.
The default Kaspersky Security Center database name is KAV.
- On the User Mapping tab, configure the account permissions:
- In the Users mapped to this login section, select the Kaspersky Security Center database.
- In the Database role membership for section, select the check boxes next to the db_datareader and public permissions.
- On the Status tab, configure the permissions for connecting the account to the database:
- In the Permission to connect to database engine section, select Grant.
- In the Login section, select Enabled.
- Click OK.
The Login - New window closes.
To check the account permissions:
- Run SQL Server Management Studio using the created account.
- Go to any MS SQL database table and make a selection based on the table.
Configuring the SQL Server Browser service
After creating an account in MS SQL, you must configure the SQL Server Browser service.
To configure the SQL Server Browser service:
- Open SQL Server Configuration Manager.
- In the left pane, select SQL Server Services.
A list of services opens.
- Open the SQL Server Browser service properties in one of the following ways:
- Double-click the name of the SQL Server Browser service.
- Right-click the name of the SQL Server Browser service and select Properties from the context menu.
- In the SQL Server Browser Properties window that opens, select the Service tab.
- In the Start Mode field, select Automatic.
- Select the Log On tab and click the Start button.
Automatic startup of the SQL Server Browser service is enabled.
- Enable and configure the TCP/IP protocol by doing the following:
- In the left pane, expand the SQL Server Network Configuration section and select the Protocols for <SQL Server name> subsection.
- Right-click the TCP/IP protocol and select Enable from the context menu.
- In the Warning window that opens, click OK.
- Open the TCP/IP protocol properties in one of the following ways:
- Double-click the TCP/IP protocol.
- Right-click the TCP/IP protocol and select Properties from the context menu.
- Select the IP Addresses tab, and then in the IPALL section, specify port 1433 in the TCP Port field.
- Click Apply to save the changes.
- Click OK to close the window.
- Restart the SQL Server (<SQL Server name>) service by doing the following:
- In the left pane, select SQL Server Services.
- In the service list on the right, right-click the SQL Server (<SQL Server name>) service and select Restart from the context menu.
- In Windows Defender Firewall with Advanced Security, allow inbound connections on the server on the TCP port 1433.
Creating a secret in KUMA
After creating and configuring an account in MS SQL, you must add a secret in the KUMA web interface. This resource is used to store credentials for connecting to MS SQL.
To create a KUMA secret:
- In the KUMA web interface, open Resources → Secrets.
The list of available secrets will be displayed.
- Click the Add secret button to create a new secret.
The secret window is displayed.
- Enter information about the secret:
- In the Name field, choose a name for the added secret.
- In the Tenant drop-down list, select the tenant that will own the created resource.
- In the Type drop-down list, select urls.
- In the URL field, specify a string of the form:
sqlserver://[<domain>%5C]<username>:<password>@<server>:1433/<database_name>where:
domainis a domain name.%5Cis the domain/user separator. Represents the "\" character in URL format.usernameis the name of the created MS SQL account.passwordis the password of the created MS SQL account.serveris the name or IP address of the server where the MS SQL database for Kaspersky Security Center is installed.database_nameis the name of the Kaspersky Security Center database. The default name is KAV.
Example:
sqlserver://test.local%5Cuser:password123@10.0.0.1:1433/KAVIf the MS SQL database account password contains special characters (@ # $ % & * ! + = [ ] : ' , ? / \ ` ( ) ;), convert them to URL format.
- Click Save.
For security reasons, the string specified in the URL field is hidden after the secret is saved.
Configuring a connector
To connect KUMA to an MS SQL database, you must configure the connector.
To configure a connector:
- In the KUMA web interface, select Resources → Connectors.
- In the list of connectors, find the [OOTB] KSC SQL connector and open it for editing.
If a connector is not available for editing, copy it and open the connector copy for editing.
If the [OOTB] KSC SQL connector is not available, contact your system administrator.
- On the Basic settings tab, in the URL drop-down lists, select the secret created for connecting to the MS SQL database.
- Click Save.
Configuring the KUMA Collector for receiving Kaspersky Security Center events from an MS SQL database
After configuring the event export settings, you must create a collector in the KUMA web interface for Kaspersky Security Center events received from MS SQL.
For details on creating a KUMA collector, refer to Creating a collector.
When creating the collector in the KUMA web interface, at the Transport step, select the [OOTB] KSC SQL connector.
To receive Kaspersky Security Center events from MS SQL, at the Event parsing step, select the [OOTB] KSC from SQL normalizer.
Page top
Installing the KUMA Collector for receiving Kaspersky Security Center events from the MS SQL database
After configuring the collector for receiving Kaspersky Security Center events from MS SQL, install the KUMA collector on the network infrastructure server where you intend to receive events.
For details on installing the KUMA collector, refer to the Installing collector in the network infrastructure section.
Page top
Configuring receipt of events from Windows devices using KUMA Agent (WEC)
KUMA allows you to receive information about events from Windows devices using the WEC KUMA Agent.
Configuring event receiving consists of the following steps:
- Configuring policies for receiving events from Windows devices.
- Configuring centralized receipt of events using the Windows Event Collector service.
- Granting permissions to view events.
- Granting permissions to log on as a service.
- Configuring the KUMA Collector.
- Installing KUMA collector.
- Forwarding events from Windows devices to KUMA.
Configuring audit of events from Windows devices
You can configure event audit on Windows devices for an individual device or for all devices in a domain.
This section describes how to configure an audit on an individual device and how to use a domain group policy to configure an audit.
Configuring an audit policy on a Windows device
To configure audit policies on a device:
- Open the Run window by pressing the key combination Win+R.
- In the opened window, type
secpol.mscand click OK.The Local security policy window opens.
- Select Security Settings → Local policies → Audit policy.
- In the pane on the right, double-click to open the properties of the policy for which you want to enable an audit of successful and unsuccessful attempts.
- In the <Policy name> properties window, on the Local security setting tab, select the Success and Failure check boxes to track successful and interrupted attempts.
It is recommended to enable an audit of successful and unsuccessful attempts for the following policies:
- Audit Logon
- Audit Policy Change
- Audit System Events
- Audit Logon Events
- Audit Account Management
Configuration of an audit policy on the device is complete.
Page top
Configuring an audit using a group policy
In addition to configuring an audit policy on an individual device, you can also configure an audit by using a domain group policy.
To configure an audit using a group policy:
- Open the Run window by pressing the key combination Win+R.
- In the opened window, type
gpedit.mscand click OK.The Local Group Policy Editor window opens.
- Select Computer configuration → Windows configuration → Security settings → Local policies → Audit policy.
- In the pane on the right, double-click to open the properties of the policy for which you want to enable an audit of successful and unsuccessful attempts.
- In the <Policy name> properties window, on the Local security setting tab, select the Success and Failure check boxes to track successful and interrupted attempts.
It is recommended to enable an audit of successful and unsuccessful attempts for the following policies:
- Audit Logon
- Audit Policy Change
- Audit System Events
- Audit Logon Events
- Audit Account Management
If you want to receive Windows logs from a large number of servers or if installation of KUMA agents on domain controllers is not allowed, it is recommended to configure Windows log redirection to individual servers that have the Windows Event Collector service configured.
The audit policy is now configured on the server or workstation.
Page top
Configuring centralized receipt of events from Windows devices using the Windows Event Collector service
The Windows Event Collector service allows you to centrally receive data about events on servers and workstations running Windows. You can use the Windows Event Collector service to subscribe to events that are registered on remote devices.
You can configure the following types of event subscriptions:
- Source-initiated subscriptions. Remote devices send event data to the Windows Event Collector server whose address is specified in the group policy. For details on the subscription configuration procedure, please refer to the Configuring data transfer from the event source server section.
- Collector-initiated subscriptions. The Windows Event Collector server connects to remote devices and independently gathers events from local logs. For details on the subscription configuration procedure, please refer to the Configuring the Windows Event Collector service section.
Configuring data transfer from the event source server
You can receive information about events on servers and workstations by configuring data transfer from remote devices to the Windows Event Collector server.
Preliminary steps
- Verify that the Windows Remote Management service is configured on the event source server by running the following command in the PowerShell console:
winrm get winrm/configIf the Windows Remote Management service is not configured, initialize it by running the following command:
winrm quickconfig - If the event source server is a domain controller, make the Windows logs available over the network by running the following command in PowerShell as an administrator:
wevtutil set-log security /ca:O:BAG:SYD:(A;;0xf0005;;;SY)(A;;0x5;;;BA)(A;;0x1;;;S-1-5-32-573)(A;;0x1;;;S-1-5-20)Verify access by running the following command:
wevtutil get-log security
Configuring the firewall on the event source server
To enable the Windows Event Collector server to receive Windows log entries, inbound connection ports must be opened on the event source server.
To open ports for inbound connections:
- On the event source server, open the Run window by pressing the key combination Win+R.
- In the opened window, type
wf.mscand click OK.The Windows Defender Firewall with Advanced Security window opens.
- Go to the Inbound Rules section and click New Rule in the Actions pane.
The New Inbound Rule Wizard opens.
- At the Rule type step, select Port.
- At the Protocols and ports step, select TCP as the protocol. In the Specific local ports field, indicate the relevant port numbers:
5985(for HTTP access)5986(for HTTPS access)
You can indicate one of the ports, or both.
- At the Action step, select Allow connection (selected by default).
- At the Profile step, clear the Private and Public check boxes.
- At the Name step, specify a name for the new inbound connection rule and click Done.
Configuration of data transfer from the event source server is complete.
The Windows Event Collector server must have the permissions to read Windows logs on the event source server. These permissions can be assigned to both the Windows Event Collector server account and to a special user account. For details on granting permissions, please refer to the Granting user permissions to view the Windows Event Log.
Page top
Configuring the Windows Event Collector service
The Windows Event Collector server can independently connect to devices and gather data on events of any severity.
To configure the receipt of event data by the Windows Event Collector server:
- On the event source server, open the Run window by pressing Win+R.
- In the opened window, type
services.mscand click OK.The Services window opens.
- In the list of services, find and start the Windows Event Collector service.
- Open the Event Viewer snap-in by doing the following:
- Open the Run window by pressing the key combination Win+R.
- In the opened window, type
eventvwrand click OK.
- Go to the Subscriptions section and click Create Subscription in the Actions pane.
- In the opened Subscription Properties window, specify the name and description of the subscription, and define the following settings:
- In the Destination log field, select Forwarded events from the list.
- In the Subscription type and source computers section, click the Select computers button.
- In the opened Computers window, click the Add domain computer button.
The Select computer window opens.
- In the Enter the object names to select (examples) field, list the names of the devices from which you want to receive event information. Click OK.
- In the Computers window, check the list of devices from which the Windows Event Collector server will gather event data and click OK.
- In the Subscription properties window, in the Collected events field, click the Select events button.
- In the opened Request filter window, specify how often and which data about events on devices you want to receive.
- If necessary, in the <All event codes> field, list the codes of the events whose information you want to receive or do not want to receive. Click OK.
- If you want to use a special account to view event data, do the following:
- In the Subscription properties window, click the Advanced button.
- In the opened Advanced subscription settings window, in the user account settings, select Specific user.
- Click the User and password button and enter the account credentials of the selected user.
Configuration of the Event Collector Service is complete.
To verify that the configuration is correct and event data is being received by the Windows Event Collector server:
In the Event Viewer snap-in, go to Event Viewer (Local) → Windows logs → Forwarded events.
Page top
Granting permissions to view Windows events
You can grant permissions to view Windows events for a specific device or for all devices in a domain.
To grant permissions to view events on a specific device:
- Open the Run window by pressing the key combination Win+R.
- In the opened window, type
compmgmt.mscand click OK.The Computer Management window opens.
- Go to Computer Management (local) → Local users and groups → Groups.
- In the pane on the right, select the Event Log Readers group and double-click to open the policy properties.
- Click the Add button at the bottom of the Properties: Event Log Readers window.
The Select Users, Computers or Groups window opens.
- In the Enter the object names to select (examples) field, list the names of the users or devices to which you want to grant permissions to view event data. Click OK.
To grant permissions to view events for all devices in a domain:
- Log in to the domain controller with administrator privileges.
- Open the Run window by pressing the key combination Win+R.
- This opens a window; in that window, type
dsa.mscand click OK.The Active Directory Users and Computers window opens.
- Go to Active Directory Users and Computers → <Domain name> → Builtin.
- In the pane on the right, select the Event Log Readers group and double-click to open the policy properties.
In the Properties: Event Log Readers window, open the Members tab and click the Add button.
The Select Users, Computers or Groups window opens.
- In the Enter the object names to select (examples) field, list the names of the users or devices to which you want to grant permissions to view event data. Click OK.
Granting permissions to log on as a service
You can grant permission to log on as a service to a specific device or to all devices in a domain. The "Log on as a service" permission allows you to start a process using an account that has been granted this permission.
To grant the "Log on as a service" permission to a device:
- Open the Run window by pressing the key combination Win+R.
- In the opened window, type
secpol.mscand click OK.The Local security policy window opens.
- Go to Security settings → Local policies → User rights assignment.
- In the pane on the right, double-click to open the properties of the Log on as a service policy.
- In the opened Properties: Log on as a Service window, click the Add User or Group button.
The Select Users or Groups window opens.
- In the Enter the object names to select (examples) field, list the names of the accounts or devices to which you want to grant the permission to log on as a service. Click OK.
Before granting the permission, make sure that the accounts or devices to which you want to grant the Log on as a service permission are not listed in the properties of the Deny log on as a service policy.
To grant the "Log on as a service" permission to devices in a domain:
- Open the Run window by pressing the key combination Win+R.
- In the opened window, type
gpedit.mscand click OK.The Local Group Policy Editor window opens.
- Select Computer configuration → Windows configuration → Security settings → Local policies → User rights assignment.
- In the pane on the right, double-click to open the properties of the Log on as a service policy.
- In the opened Properties: Log on as a Service window, click the Add User or Group button.
The Select Users or Groups window opens.
- In the Enter the object names to select (examples) field, list the names of the users or devices to which you want to grant the permission to log on as a service. Click OK.
Before granting the permission, make sure that the accounts or devices to which you want to grant the Log on as a service permission are not listed in the properties of the Deny log on as a service policy.
Page top
Configuring the KUMA Collector for receiving events from Windows devices
After you finish configuring the audit policy on devices, creating subscriptions to events and granting all the necessary permissions, you need to create a collector in the KUMA web interface for events from Windows devices.
For details on creating a KUMA collector, refer to Creating a collector.
To receive events from Windows devices, define the following collector settings in the KUMA Collector Installation Wizard:
- At the Transport step, define the following settings:
- In the Connector window, select Create.
- In the Type field, select http.
- In the Delimiter field, select \0.
- On the Advanced settings tab, in the TLS mode field, select With verification.
- At the Event parsing step, click the Add event parsing button.
- This opens the Basic event parsing window; in that window, in the Normalizer field, select [OOTB] Microsoft Products and click OK.
- At the Routing step, add the following destinations:
- Storage. To send processed events to the storage.
- Correlator. To send processed events to the correlator.
If the Storage and Correlator destinations were not added, create them.
- At the Setup validation tab, click Create and save service.
- Copy the command for installing the KUMA collector that appears.
Installing the KUMA Collector for receiving events from Windows devices
After configuring the collector for receiving Windows events, install the KUMA Collector on the server of the network infrastructure intended for receiving events.
For details on installing the KUMA collector, refer to the Installing collector in the network infrastructure section.
Page top
Configuring forwarding of events from Windows devices to KUMA using KUMA Agent (WEC)
To complete the data forwarding configuration, you must create a WEC KUMA agent and then install it on the device from which you want to receive event information.
For more details on creating and installing a WEC KUMA Agent on Windows devices, please refer to the Forwarding events from Windows devices to KUMA section.
Page top
Configuring receipt of events from Windows devices using KUMA Agent (WMI)
KUMA allows you to receive information about events from Windows devices using the WMI KUMA Agent.
Configuring event receiving consists of the following steps:
- Configuring audit settings for managing KUMA.
- Configuring data transfer from the event source server.
- Granting permissions to view events.
- Granting permissions to log on as a service.
- Creating a KUMA collector.
To receive Windows device events, in the KUMA Collector Setup Wizard, at the Event parsing step, in the Normalizer field, select [OOTB] Microsoft Products.
- Installing KUMA collector.
- Forwarding events from Windows devices to KUMA.
To complete the data forwarding configuration, you must create a WMI KUMA agent and then install it on the device from which you want to receive event information.
Configuring audit settings for managing KUMA
You can configure event audit on Windows devices both on a specific device using a local policy or on all devices in a domain using a group policy.
This section describes how to configure an audit on an individual device and how to use a domain group policy to configure an audit.
Configuring an audit using a local policy
To configure an audit using a local policy:
- Open the Run window by pressing the key combination Win+R.
- In the opened window, type
secpol.mscand click OK.The Local security policy window opens.
- Select Security Settings → Local policies → Audit policy.
- In the pane on the right, double-click to open the properties of the policy for which you want to enable an audit of successful and unsuccessful attempts.
- In the <Policy name> properties window, on the Local security setting tab, select the Success and Failure check boxes to track successful and interrupted attempts.
It is recommended to enable an audit of successful and unsuccessful attempts for the following policies:
- Audit Logon
- Audit Policy Change
- Audit System Events
- Audit Logon Events
- Audit Account Management
Configuration of an audit policy on the device is complete.
Page top
Configuring an audit using a group policy
In addition to configuring an audit on an individual device, you can also configure an audit by using a domain group policy.
To configure an audit using a group policy:
- Open the Run window by pressing the key combination Win+R.
- In the opened window, type
gpedit.mscand click OK.The Local Group Policy Editor window opens.
- Select Computer configuration → Windows configuration → Security settings → Local policies → Audit policy.
- In the pane on the right, double-click to open the properties of the policy for which you want to enable an audit of successful and unsuccessful attempts.
- In the <Policy name> properties window, on the Local security setting tab, select the Success and Failure check boxes to track successful and interrupted attempts.
It is recommended to enable an audit of successful and unsuccessful attempts for the following policies:
- Audit Logon
- Audit Policy Change
- Audit System Events
- Audit Logon Events
- Audit Account Management
The audit policy is now configured on the server or workstation.
Page top
Configuring data transfer from the event source server
Preliminary steps
- On the event source server, open the Run window by pressing the key combination Win+R.
- In the opened window, type
services.mscand click OK.The Services window opens.
- In the list of services, find the following services:
- Remote Procedure Call
- RPC Endpoint Mapper
- Check the Status column to confirm that these services have the Running status.
Configuring the firewall on the event source server
The Windows Management Instrumentation server can receive Windows log entries if ports are open for inbound connections on the event source server.
To open ports for inbound connections:
- On the event source server, open the Run window by pressing the key combination Win+R.
- In the opened window, type
wf.mscand click OK.The Windows Defender Firewall with Advanced Security window opens.
- In the Windows Defender Firewall with Advanced Security window, go to the Inbound Rules section and in the Actions pane, click New Rule.
This opens the New Inbound Rule Wizard.
- In the New Inbound Rule Wizard, at the Rule Type step, select Port.
- At the Protocols and ports step, select TCP as the protocol. In the Specific local ports field, indicate the relevant port numbers:
13544549152–65535
- At the Action step, select Allow connection (selected by default).
- At the Profile step, clear the Private and Public check boxes.
- At the Name step, specify a name for the new inbound connection rule and click Done.
Configuration of data transfer from the event source server is complete.
Page top
Granting permissions to view Windows events
You can grant permissions to view Windows events for a specific device or for all devices in a domain.
To grant permissions to view events on a specific device:
- Open the Run window by pressing the key combination Win+R.
- In the opened window, type
compmgmt.mscand click OK.The Computer Management window opens.
- Go to Computer Management (local) → Local users and groups → Groups.
- In the pane on the right, select the Event Log Readers group and double-click to open the policy properties.
- Click the Add button at the bottom of the Properties: Event Log Readers window.
The Select Users, Computers or Groups window opens.
- In the Enter the object names to select (examples) field, list the names of the users or devices to which you want to grant permissions to view event data. Click OK.
To grant permissions to view events for all devices in a domain:
- Log in to the domain controller with administrator privileges.
- Open the Run window by pressing the key combination Win+R.
- This opens a window; in that window, type
dsa.mscand click OK.The Active Directory Users and Computers window opens.
- In the Active Directory Users and Computers window, go to the Active Directory Users and Computers section → <Domain name> → Builtin.
- In the pane on the right, select the Event Log Readers group and double-click to open the policy properties.
In the Properties: Event Log Readers window, open the Members tab and click the Add button.
The Select Users, Computers or Groups window opens.
- In the Select User, Computer, or Group window, In the Enter the object name to select (examples) field, list the names of the users or devices to which you want to grant permissions to view event data. Click OK.
Granting permissions to log on as a service
You can grant permission to log on as a service to a specific device or to all devices in a domain. The "Log on as a service" permission allows you to start a process using an account that has been granted this permission.
Before granting the permission, make sure that the accounts or devices to which you want to grant the Log on as a service permission are not listed in the properties of the Deny log on as a service policy.
To grant the "Log on as a service" permission to a device:
- Open the Run window by pressing the key combination Win+R.
- In the opened window, type
secpol.mscand click OK.The Local security policy window opens.
- In the Local Security Policy window, go to the Security Settings → Local Policies → User Rights Assignment section.
- In the pane on the right, double-click to open the properties of the Log on as a service policy.
- This opens the Properties: Log on as a Service window; in that window, click Add User or Group.
This opens the Select Users or Groups window.
- In the Enter the object names to select (examples) field, list the names of the accounts or devices to which you want to grant the permission to log on as a service. Click OK.
To grant the "Log on as a service" permission to devices in a domain:
- Open the Run window by pressing the key combination Win+R.
- In the opened window, type
gpedit.mscand click OK.The Local Group Policy Editor window opens.
- Select Computer configuration → Windows configuration → Security settings → Local policies → User rights assignment.
- In the pane on the right, double-click to open the properties of the Log on as a service policy.
- This opens the Properties: Log on as a Service window; in that window, click Add User or Group.
This opens the Select Users or Groups window.
- In the Enter the object names to select (examples) field, list the names of the users or devices to which you want to grant the permission to log on as a service. Click OK.
Configuring receipt of DNS server events using the ETW agent
The Event Tracing for Windows connector (hereinafter also referred to as the ETW connector) is a mechanism for logging events generated by applications and drivers on the DNS server. You can use the ETW connector to troubleshoot errors during development or to look for malicious activity.
The impact of the ETW connector on DNS server performance is insignificant. For example, a DNS server running on modern hardware and getting up to 100,000 queries per second (QPS) may experience a 5% performance drop while using the ETW connector. If the DNS server gets up to 50,000 requests per second, no performance drop is observed. We recommend monitoring DNS server performance when using the ETW connector, regardless of the number of requests per second.
By default, you can use the ETW connector on Windows Server 2016 or later. The ETW connector is also supported by Windows Server 2012 R2 if the update for event logging and change auditing is installed. The update is available on the Microsoft Support website.
The ETW connector consists of the following components:
- Providers are elements of the system that generate events and send them to the ETW connector. For example, Windows kernels or device drivers can act as providers. When working with code, developers must specify which events the providers must send to the ETW connector. An event may represent the execution of a function that the developer considers important, for example, a function that allows access to the Security Account Manager (SAM).
- Consumers are software systems that receive events generated by providers from the ETW connector, and use these events in some way. For example, KUMA can act as a consumer.
- Controllers are pieces of software that manage the interaction between providers and consumers. For example, the Logman or Wevtutil utilities can be controllers. Providers register with the controller to send events to consumers. The controller can enable or disable a provider. If a provider is disabled, it does not generate events.
Controllers use trace sessions for communication between providers and consumers. Trace sessions are also used for filtering data based on specified parameters because consumers may need different events.
Configuring DNS server event reception using the ETW connector involves the following steps:
- Configuration on the Windows side.
- Creating a KUMA collector.
When creating a KUMA collector, follow these steps:
- At step 2 of the Collector Installation Wizard:
- In the Type drop-down list, select the tcp connector type. You can also specify the http connector type and other connector types with verification for secure transmission.
- In the URL field, enter the FQDN and port number on which the KUMA collector will listen for a connection from the KUMA agent. You can specify any unoccupied port number.
- In the Delimiter field, enter
\n.
- At the step 3 of the Collector Installation Wizard, in the Normalizer drop-down list, select a normalizer. We recommend selecting the predefined extended normalizer for Windows events, [OOTB] Microsoft DNS ETW logs json.
- At step 7 of the Collector Installation Wizard, add a Storage type destination for storing events. If you plan to use event correlation, you also need to add a Correlator type destination.
- At step 8 of the Collector Installation Wizard, click Create and save service, and in the lower part of the window, copy the command for installing the KUMA collector on the server.
- At step 2 of the Collector Installation Wizard:
- Installing the KUMA collector on the server.
Do the following:
- Connect to the KUMA command line interface using a user account with root privileges.
- Install the KUMA collector by running the command that you copied at step 8 of the Collector Installation Wizard.
- If you want to add the KUMA collector port to the firewall exclusions and update the firewall settings, run the following commands:
firewall-cmd --add-port=<collector port number>/tcp --permanentfirewall-cmd --reload
The KUMA collector is installed and the status of the KUMA collector service changes to green in the KUMA web interface.
- Creating a KUMA agent.
When creating a KUMA agent, follow these steps:
- Go to the Connection 1 tab.
- Under Connector, in the Connector drop-down list, select Create and specify the following settings:
- In the Type drop-down list, select the etw connector type.
- In the Session name field, enter the provider name that you specified when you configured the reception of DNS server events using the ETW connector on the Windows side.
- Under Destinations, in the Destination drop-down list, select Create and specify the following settings:
- In the Type drop-down list, select the tcp destination type.
- In the URL field, enter the FQDN and port number on which the KUMA collector will listen for a connection from the KUMA agent. The value must match the value that you specified at step 2 of the Collector Installation Wizard.
- Go to the Advanced settings tab, and in the Disk buffer size limit field, enter
1073741824.
- Creating a KUMA agent service.
You need to copy the ID of the created KUMA agent service. To do so, right-click next to the KUMA agent service and select Copy ID in the context menu.
- Creating an account for the KUMA agent.
Create a domain or local Windows user account for running the KUMA agent and reading the analytic log. You need to add the created user account to the Performance Log Users group and grant the Log on service permission (Log on as a service).
- Installing a KUMA agent on a Windows server.
You need to install the KUMA agent on the Windows server that will be receiving events from the provider. To do so:
- Add the FQDN of the KUMA Core server to the hosts file on the Windows server or to the DNS server.
- Create the C:\Users\<user name>\Desktop\KUMA folder on the Windows server.
- Copy the kuma.exe file from the KUMA installation package archive to the C:\Users\<user name>\Desktop\KUMA folder.
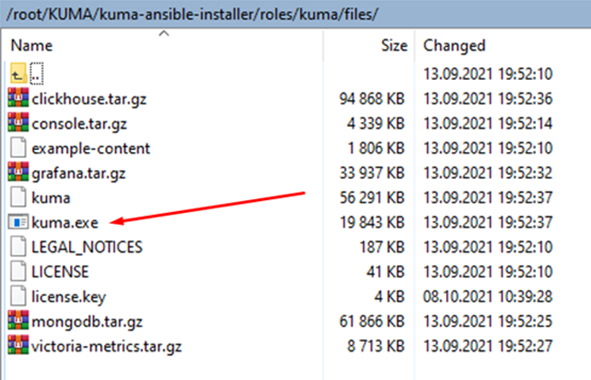
- Run the command interpreter as administrator.
- Change to the C:\Users\<user name>\Desktop\KUMA folder and run the following command:
C:\Users\<user name>\Desktop\KUMA>kuma.exe agent --core https://<DOMAIN-NAME-KUMA-CORE-Server>:7210 --id <KUMA agent service ID>In the KUMA web interface, in the Resources → Active services section, make sure that the KUMA agent service is running and its status is now green, and then abort the command.
- Start the KUMA Agent installation in one of the following ways:
- If you want to start the KUMA agent installation using a domain user account, run the following command:
C:\Users\<user name>\Desktop\KUMA>kuma.exe agent --core https://<DOMAIN-NAME-KUMA-CORE-Server>:7210 --id <KUMA agent service ID> –-user <domain>\<user account name for the KUMA agent> --install - If you want to start the agent installation using a local user account, run the following command:
C:\Users\<user name>\Desktop\KUMA>kuma.exe agent --core https://<DOMAIN-NAME-KUMA-CORE-Server>:7210 --id <KUMA agent service ID> –-user <user account name for the KUMA agent> --install
You will need to enter the password of the KUMA agent user account.
- If you want to start the KUMA agent installation using a domain user account, run the following command:
The KUMA Windows Agent service <KUMA agent service ID> is installed on the Windows server. In the KUMA web interface, in the Resources → Active services section, if the KUMA agent service is not running and has the red status, you need to make sure that port 7210 is available, as well as the Windows collector port in the direction from the KUMA agent to the KUMA collector.
To remove the KUMA agent service on the Windows server, run the following command:
C:\Users\<user name>\Desktop\KUMA>kuma.exe agent --id <KUMA agent service ID> --uninstall - Verifying receipt of DNS server events in the KUMA collector.
You can verify that you have correctly configured the reception of DNS server events using the ETW connector in the Searching for related events section of the KUMA web interface.
Configuration on the Windows side
To configure the reception of DNS server events using the ETW connector on the Windows side:
- Start the Event viewer by running the following command:
eventvwr.msc - This opens a window; in that window, go to the Applications and Services Logs → Microsoft → Windows → DNS-Server folder.
- Open the context menu of the DNS-Server folder and select View → Show Analytic and Debug Logs.
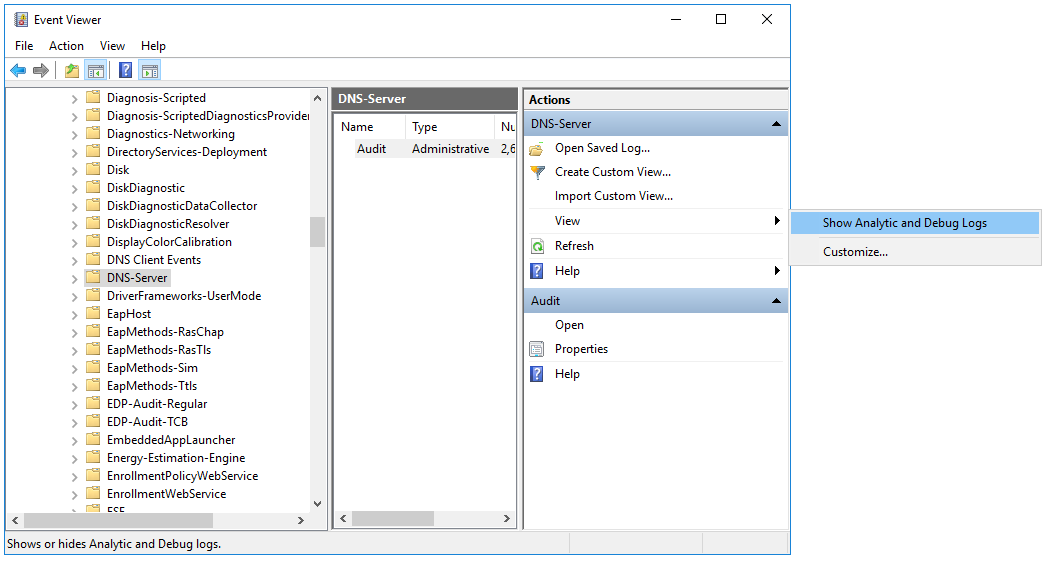
The Audit debug log and Analytical log are displayed.
- Configure the analytic log:
- Open the context menu of the Analytical log and select Properties.
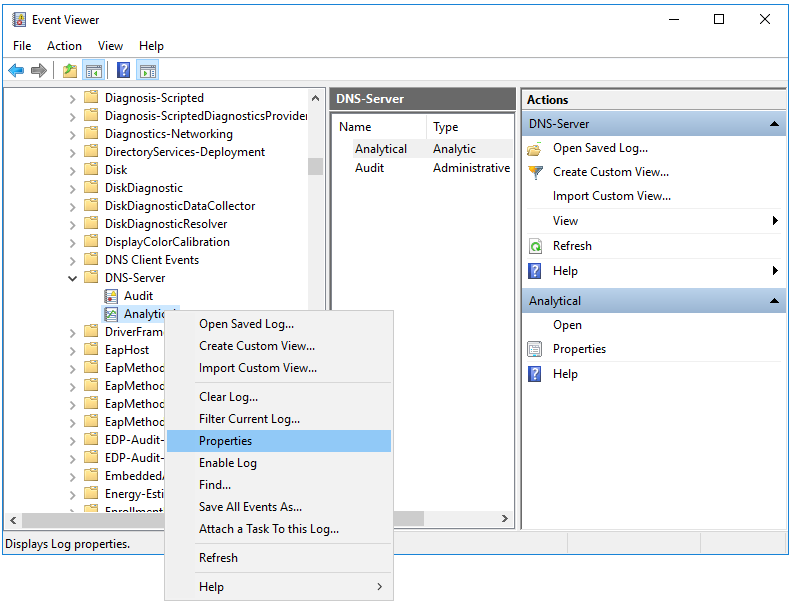
- This opens a window; in that window, make sure that in the Max Log Size (KB) field, the value is
1048576.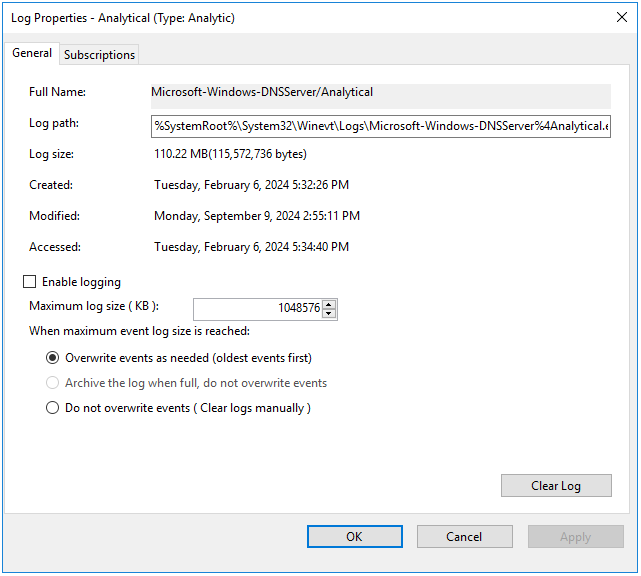
- Select the Enable logging check box and in the confirmation window, click OK.
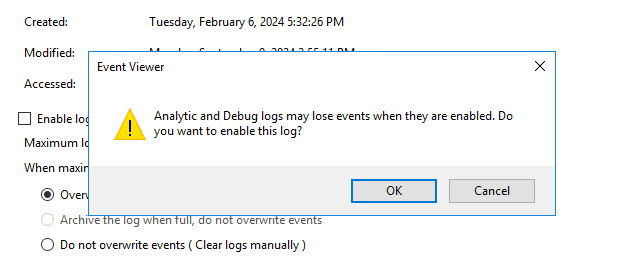
The analytic log must be configured as follows:
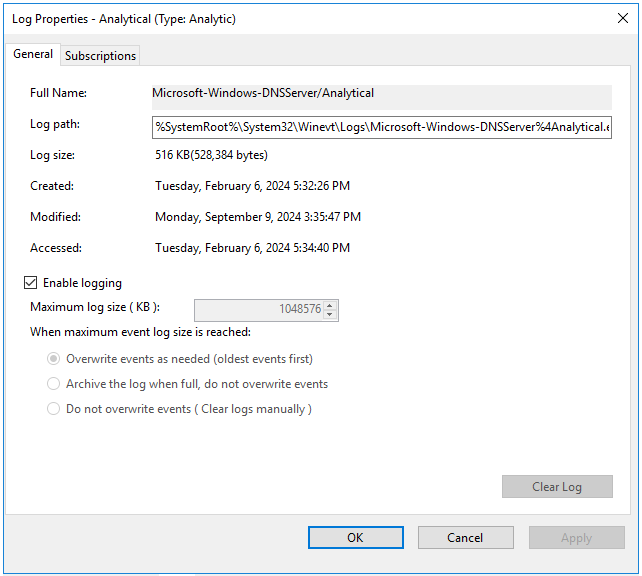
- Click Apply, then click OK.
An error window is displayed.
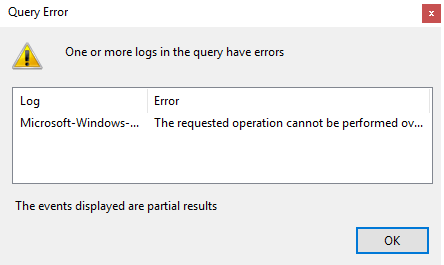
When analytic log rotation is enabled, events are not displayed. To view events, in the Actions pane, click Stop logging.
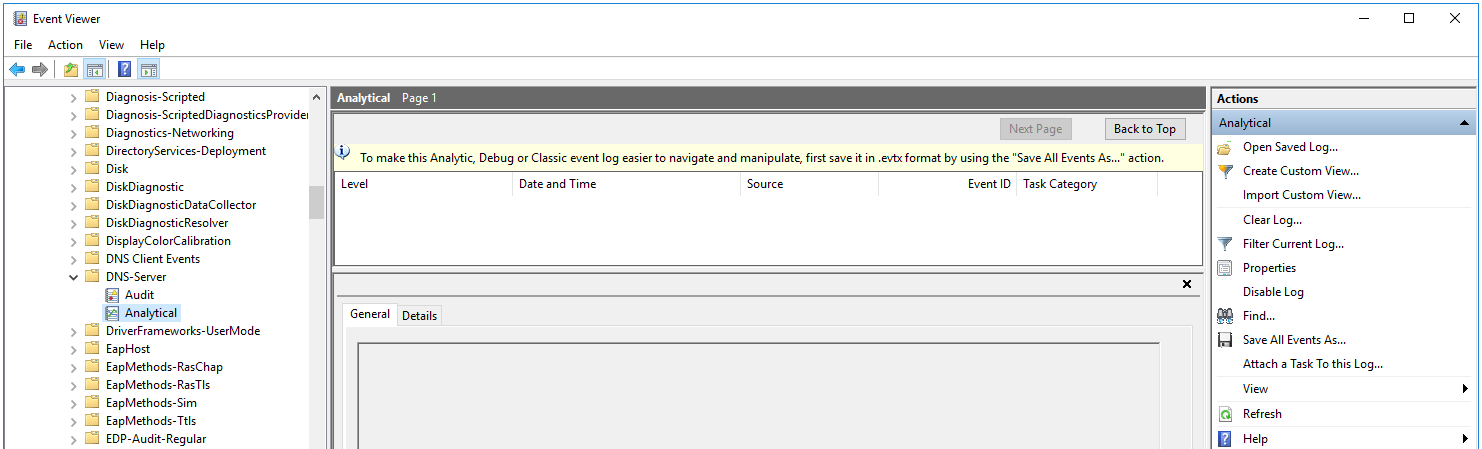
- Open the context menu of the Analytical log and select Properties.
- Start Computer management as administrator.
- This opens a window; in that window, go to the System Tools → Performance → Startup Event Trace Sessions folder.
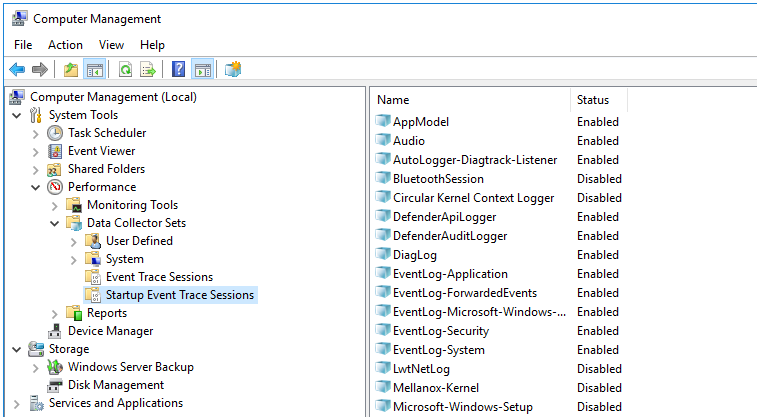
- Create a provider:
- Open the context menu of the Startup Event Trace Sessions folder and select Create → Data Collector Set.
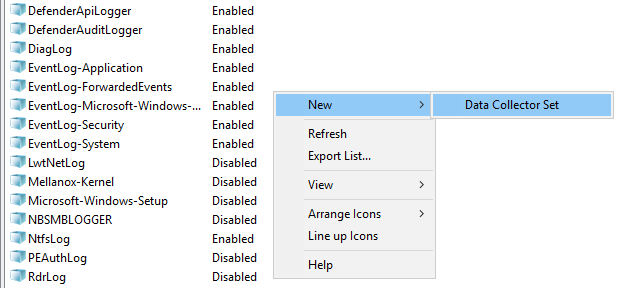
- This opens a window; in that window, enter the name of the provider and click Next.
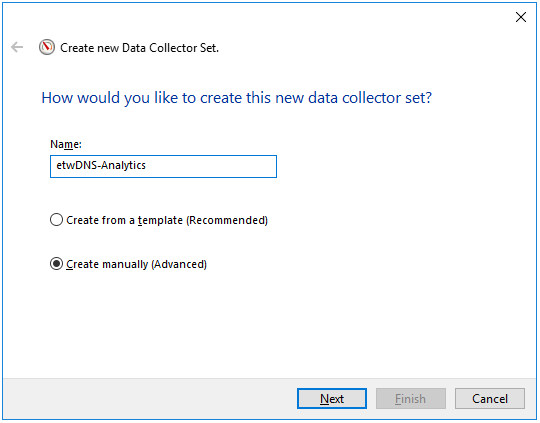
- Click Add... and in the displayed window, select the Microsoft-Windows-DNSServer provider.
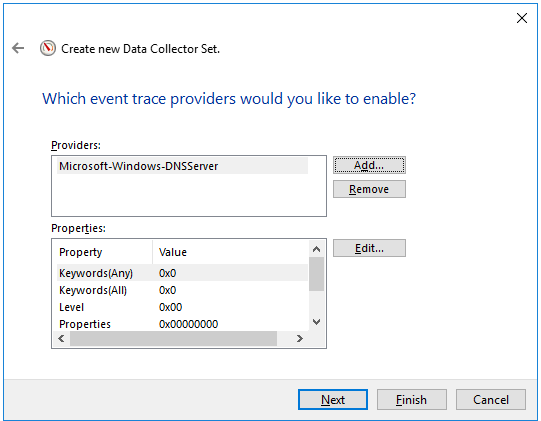
The KUMA agent with the ETW connector works only with System.Provider.Guid: {EB79061A-A566-4698-9119-3ED2807060E7} - Microsoft-Windows-DNSServer.
- Click Next twice, then click Finish.
- Open the context menu of the Startup Event Trace Sessions folder and select Create → Data Collector Set.
- Open the context menu of the created provider and select Start As Event Trace Session.
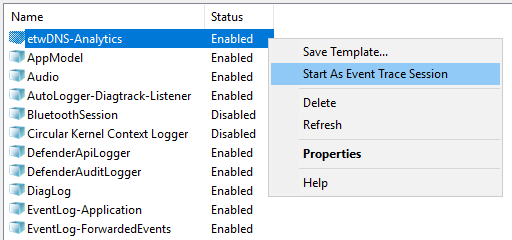
- Go to the Event Trace Sessions folder.
Event trace sessions are displayed.
- Open the context menu of the created event trace session and select Properties.
- This opens a window; in that window, select the Trace Sessions tab and in the Stream Mode drop-down list, select Real Time.
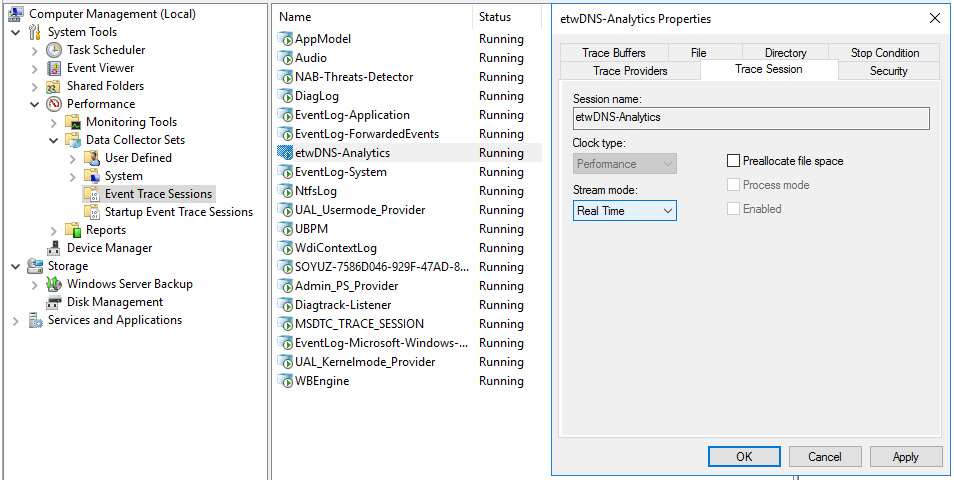
- Click Apply, then click OK.
DNS server event reception using the ETW connector is configured.
Page top
Configuring receipt of PostgreSQL events
KUMA lets you monitor and audit PostgreSQL events on Linux devices using rsyslog.
Events are audited using the pgAudit plugin. The plugin supports PostgreSQL 9.5 and later. For details about the pgAudit plugin, see https://github.com/pgaudit/pgaudit.
Configuring event receiving consists of the following steps:
- Installing the pdAudit plugin.
- Creating a KUMA collector for PostgreSQL events.
To receive PostgreSQL events using rsyslog, in the Collector Installation Wizard, at the Event parsing step, select the [OOTB] PostgreSQL pgAudit syslog normalizer.
- Installing a collector in the KUMA network infrastructure.
- Configuring the event source server.
- Verifying receipt of PostgreSQL events in the KUMA collector
You can verify that the PostgreSQL event source server is correctly configured in the Searching for related events section of the KUMA web interface.
Installing the pgAudit plugin
To install the pgAudit plugin:
- On the OS command line, run the following commands as a user with administrator rights:
sudo apt updatesudo apt -y install postgresql-<PostgreSQL version>-pgauditYou must select the plugin version to match the PostgresSQL version. For information about PostgreSQL versions and the matching plugin versions, see https://github.com/pgaudit/pgaudit#postgresql-version-compatibility.
Example:
sudo apt -y install postgresql-12-pgaudit - Find the postgres.conf configuration file. To do so, run the following command on the PostgreSQL command line:
show data_directoryThe response will indicate the location of the configuration file.
- Create a backup copy of the postgres.conf configuration file.
- Open the postgres.conf file and copy or replace the values in it with the values listed below.
```## pgAudit settingsshared_preload_libraries = 'pgaudit'## database logging settingslog_destination = 'syslog'## syslog facilitysyslog_facility = 'LOCAL0'## event identsyslog_ident = 'Postgres'## sequence numbers in syslogsyslog_sequence_numbers = on## split messages in syslogsyslog_split_messages = off## message encodinglc_messages = 'en_US.UTF-8'## min message level for loggingclient_min_messages = log## min error message level for logginglog_min_error_statement = info## log checkpoints (buffers, restarts)log_checkpoints = off## log query durationlog_duration = off## error description levellog_error_verbosity = default## user connections logginglog_connections = on## user disconnections logginglog_disconnections = on## log prefix formatlog_line_prefix = '%m|%a|%d|%p|%r|%i|%u| %e '## log_statementlog_statement = 'none'## hostname logging status. dns bane resolving affect#performance!log_hostname = off## logging collector buffer status#logging_collector = off## pg audit settingspgaudit.log_parameter = onpgaudit.log='ROLE, DDL, MISC, FUNCTION'``` - Restart the PostgreSQL service using the command:
sudo systemctl restart postgresql - To load the pgAudit plugin to PostgreSQL, run the following command on the PostgreSQL command line:
CREATE EXTENSION pgaudit
The pgAudit plugin is installed.
Page top
Configuring a Syslog server to send events
The rsyslog service is used to transmit events from the server to KUMA.
To configure the sending of events from the server where PostgreSQL is installed to the collector:
- To verify that the rsyslog service is installed on the event source server, run the following command as administrator:
sudo systemctl status rsyslog.serviceIf the rsyslog service is not installed on the server, install it by executing the following commands:
yum install rsyslogsudo systemctl enable rsyslog.servicesudo systemctl start rsyslog.service - In the /etc/rsyslog.d/ directory, create a pgsql-to-siem.conf file with the following content:
If $programname contains 'Postgres' then @<IP address of the collector>:<port of the collector>For example:If $programname contains 'Postgres' then @192.168.1.5:1514If you want to send events via TCP, the contents of the file must be as follows:
If $programname contains 'Postgres' then @@<IP address of the collector>:<port of the collector>Save changes to the pgsql-to-siem.conf configuration file.
- Add the following lines to the /etc/rsyslog.conf configuration file:
$IncludeConfig /etc/pgsql-to-siem.conf$RepeatedMsgReduction offSave changes to the /etc/rsyslog.conf configuration file.
- Restart the rsyslog service by executing the following command:
sudo systemctl restart rsyslog.service
Configuring receipt of IVK Kolchuga-K events
You can configure the receipt of events from the IVK Kolchuga-K system to the KUMA SIEM system.
Configuring event receiving consists of the following steps:
- Configuring the sending of IVK Kolchuga-K events to KUMA.
- Creating a KUMA collector for receiving events from the IVK Kolchuga-K system.
To receive IVK Kolchuga-K events using Syslog, in the Collector Installation Wizard, at the Event parsing step, select the [OOTB] Kolchuga-K syslog normalizer.
- Installing a KUMA collector for receiving IVK Kolchuga-K events.
- Verifying receipt of IVK Kolchuga-K events in KUMA.
You can verify that the IVK Kolchuga-K event source is configured correctly in the Searching for related events section of the KUMA web interface.
Configuring export of IVK Kolchuga-K events to KUMA
To configure the export of events of the IVK Kolchuga-K firewall via syslog to the KUMA collector:
- Connect to the firewall over SSH with administrator rights.
- Create a backup copy of the /etc/services and /etc/syslog.conf files.
- In the /etc/syslog.conf configuration file, specify the FQDN or IP address of the KUMA collector. For example:
*.* @kuma.example.com
or
*.* @192.168.0.100
Save changes to the configuration file /etc/syslog.conf.
- In the /etc/services configuration file, specify the port and protocol used by the KUMA collector. For example:
syslog 10514/udp
Save changes to the /etc/services configuration file.
- Restart the syslog server of the firewall:
service syslogd restart
Configuring receipt of CryptoPro NGate events
You can configure the receipt of CryptoPro NGate events in the KUMA SIEM system.
Configuring event receiving consists of the following steps:
- Configuring export of CryptoPro NGate events to KUMA.
- Creating a KUMA collector for receiving CryptoPro NGate events.
To receive CryptoPro NGate events using Syslog, in the Collector Installation Wizard, at the Event parsing step, select the [OOTB] NGate syslog normalizer.
- Creating a KUMA collector for receiving CryptoPro NGate events.
- Verifying receipt of CryptoPro NGate events in the KUMA collector.
You can verify that the CryptoPro NGate event source server is correctly configured in the Searching for related events section of the KUMA web interface.
Configuring export of CryptoPro NGate events to KUMA
To configure the sending of events from CryptoPro NGate to KUMA:
- Connect to the web interface of the NGate management system.
- Connect remote syslog servers to the management system. To do so:
- Open the page with the list of syslog servers: External Services → Syslog Server → Add Syslog Server.
- Enter the settings of the syslog server and click
 .
.
- Assign syslog servers to the configuration for recording logs of the cluster. To do so:
- In the Clusters → Summary section, select the cluster that you want to configure.
- On the Configurations tab, click the Configuration control for the relevant cluster to go to the configuration settings page.
In field
Syslog Serversof the configuration you are configuring, click
Assign.
Select the check boxes for syslog servers that you want to assign and click
the icon.You can assign an unlimited number of servers.
To add new syslog servers, click
 .
.Publish the configuration to activate the new settings.
Assign syslog servers to the management system for recording Administrator activity logs. To do so:
- Select the Management Center Settings menu item and on the page that is displayed, under Syslog servers, click Assign.
- In the Assign Syslog Servers to Management Center window, select the check box for those syslog servers that you want to assign, then click
 .
.You can assign an unlimited number of servers.
As a result, events of CryptoPro NGate are sent to KUMA.
Page top
Configuring receipt of Ideco UTM events
You can configure the receipt of Ideco UTM application events in KUMA via the Syslog protocol.
Configuring event receiving consists of the following steps:
- Configuring export of Ideco UTM events to KUMA.
- Creating a KUMA collector for receiving Ideco UTM.
To receive Ideco UTM events, in the Collector Installation Wizard, at the Event parsing step, select the [OOTB] Ideco UTM syslog normalizer.
- Creating a KUMA collector for receiving Ideco UTM events.
- Verifying receipt of Ideco UTM events in KUMA.
You can verify that the Ideco UTM event source server is correctly configured in the Searching for related events section of the KUMA web interface.
Configuring export of Ideco UTM events to KUMA
To configure the sending of events from Ideco UTM to KUMA:
- Connect to the Ideco UTM web interface under a user account that has administrative privileges.
- In the System message forwarding menu, move the Syslog toggle switch to the enabled position.
- For the IP address setting, specify the IP address of the KUMA collector.
- For the Port setting, enter the port that the KUMA collector is listening on.
- Click Save to apply the changes.
The forwarding of Ideco UTM events to KUMA is configured.
Page top
Configuring receipt of KWTS events
You can configure the receipt of events from the Kaspersky Web Traffic Security (KWTS) web traffic analysis and filtering system in KUMA.
Configuring event receiving consists of the following steps:
- Configuring export of KWTS events to KUMA.
- Creating a KUMA collector for receiving KWTS events.
To receive KWTS events, in the Collector Installation Wizard, at the Event parsing step, select the [OOTB] KWTS normalizer.
- Installing a KUMA collector for receiving KWTS events.
- Verifying receipt of KWTS events in the KUMA collector.
You can verify that KWTS event export is correctly configured in the Searching for related events section of the KUMA web interface.
Configuring export of KWTS events to KUMA
To configure the export of KWTS events to KUMA:
- Connect to the KWTS server over SSH as root.
- Before making changes, create backup copies of the following files:
- /opt/kaspersky/kwts/share/templates/core_settings/event_logger.json.template
- /etc/rsyslog.conf
- Make sure that the settings in the /opt/kaspersky/kwts/share/templates/core_settings/event_logger.json.template configuration file have the following values, and make changes if necessary:
"siemSettings":{"enabled": true,"facility": "Local5","logLevel": "Info","formatting":{ - Save your changes.
- To send events via UDP, make the following changes to the /etc/rsyslog.conf configuration file:
$WorkDirectory /var/lib/rsyslog$ActionQueueFileName ForwardToSIEM$ActionQueueMaxDiskSpace 1g$ActionQueueSaveOnShutdown on$ActionQueueType LinkedList$ActionResumeRetryCount -1local5.* @<<IP address of the KUMA collector>:<port of the collector>>If you want to send events over TCP, the last line should be as follows:
local5.* @@<<IP address of the KUMA collector>:<port of the collector>> - Save your changes.
- Restart the rsyslog service with the following command:
sudo systemctl restart rsyslog.service - Go to the KWTS web interface, to the Settings – Syslog tab and enable the Log information about traffic profile option.
- Click Save.
Configuring receipt of KLMS events
You can configure the receipt of events from the Kaspersky Linux Mail Server (KLMS) mail traffic analysis and filtering system to the KUMA SIEM system.
Configuring event receiving consists of the following steps:
- Depending on the version of KLMS you are using, select one of the following options:
- Creating a KUMA collector for receiving KLMS events
To receive KLMS events, in the Collector Installation Wizard, at the Event parsing step, select the [OOTB] KLMS syslog CEF normalizer.
- Installing a KUMA collector for receiving KLMS events
- Verifying receipt of KLMS events in the KUMA collector
You can verify that the KLMS event source server is correctly configured in the Searching for related events section of the KUMA web interface.
Configuring export of KLMS events to KUMA
To configure the export of KLMS events to KUMA:
- Connect to the KLMS server over SSH and go to the Technical Support Mode menu.
- Use the klms-control utility to download the settings to the settings.xml file:
sudo /opt/kaspersky/klms/bin/klms-control --get-settings EventLogger -n -f /tmp/settings.xml - Make sure that the settings in the /tmp/settings.xml file have the following values; make changes if necessary:
<siemSettings><enabled>1</enabled><facility>Local1</facility>...</siemSettings> - Apply settings with the following command:
sudo /opt/kaspersky/klms/bin/klms-control --set-settings EventLogger -n -f /tmp/settings.xml - To send events via UDP, make the following changes to the /etc/rsyslog.conf configuration file:
$WorkDirectory /var/lib/rsyslog$ActionQueueFileName ForwardToSIEM$ActionQueueMaxDiskSpace 1g$ActionQueueSaveOnShutdown on$ActionQueueType LinkedList$ActionResumeRetryCount -1local1.* @<<IP address of the KUMA collector>:<port of the collector>>If you want to send events over TCP, the last line should be as follows:
local1.* @@<<IP address of the KUMA collector>:<port of the collector>> - Save your changes.
- Restart the rsyslog service with the following command:
sudo systemctl restart rsyslog.service
Configuring receipt of KSMG events
You can configure the receipt of events from the Kaspersky Secure Mail Gateway (KSMG) 1.1 mail traffic analysis and filtering system in the KUMA SIEM system.
Configuring event receiving consists of the following steps:
- Configuring export of KSMG events to KUMA
- Creating a KUMA collector for receiving KSMG events
To receive KSMG events, in the Collector Installation Wizard, at the Event parsing step, select the [OOTB] KSMG normalizer.
- Installing a KUMA collector for receiving KSMG events
- Verifying receipt of KSMG events in the KUMA collector
You can verify that the KSMG event source server is correctly configured in the Searching for related events section of the KUMA web interface.
Configuring export of KSMG events to KUMA
To configure the export of KSMG events to KUMA:
- Connect to the KSMG server via SSH using an account with administrator rights.
- Use the ksmg-control utility to download the settings to the settings.xml file:
sudo /opt/kaspersky/ksmg/bin/ksmg-control --get-settings EventLogger -n -f /tmp/settings.xml - Make sure that the settings in the /tmp/settings.xml file have the following values; make changes if necessary:
<siemSettings><enabled>1</enabled><facility>Local1</facility> - Apply settings with the following command:
sudo /opt/kaspersky/ksmg/bin/ksmg-control --set-settings EventLogger -n -f /tmp/settings.xml - To send events via UDP, make the following changes to the /etc/rsyslog.conf configuration file:
$WorkDirectory /var/lib/rsyslog$ActionQueueFileName ForwardToSIEM$ActionQueueMaxDiskSpace 1g$ActionQueueSaveOnShutdown on$ActionQueueType LinkedList$ActionResumeRetryCount -1local1.* @<<IP address of the KUMA collector>:<port of the collector>>If you want to send events over TCP, the last line should be as follows:
local1.* @@<<IP address of the KUMA collector>:<port of the collector>> - Save your changes.
- Restart the rsyslog service with the following command:
sudo systemctl restart rsyslog.service
Configuring the receipt of KICS for Networks events
You can configure the receipt of events from Kaspersky Industrial CyberSecurity for Networks (KICS for Networks) 4.2 in KUMA.
Configuring event receiving consists of the following steps:
- Creating a KICS for Networks connector for sending events to KUMA.
- Configuring export of KICS for Networks events to KUMA.
- Creating and installing a KUMA collector to receive KICS for Networks events.
- Verifying receipt of KICS for Networks events in the KUMA collector.
You can verify that KICS for Networks event export is correctly configured in the Searching for related events section of the KUMA web interface.
Creating a KICS for Networks connector for sending events to KUMA
To create a connector for sending events in the web interface of KICS for Networks:
- Log in to the KICS for Networks web interface using an administrator account.
- Go to the Settings → Connectors section.
- Click the Add connector button.
- Specify the following settings:
- In the Connector type drop-down list, select SIEM.
- In the Connector name field, specify a name for the connector.
- In the Server address field, enter the IP address of the KICS for Networks Server.
- In the Connector deployment node drop-down list, select the node on which you are installing the connector.
You can specify any name.
- In the User name field, specify the user name for KUMA to use for connecting to the application through the connector. You must specify the name of one of the KICS for Networks users.
- In the SIEM server address field, enter the IP address of the KUMA collector server.
- In the Port number field, enter the port number of the KUMA collector.
- In the Transport protocol drop-down list, select TCP or UDP.
- Select the Allow sending audit entries check box.
- Select the Allow sending application entries check box.
- Click the Save button.
The connector is created. It is displayed in the table of KICS for Networks connectors with the Running status.
The KICS for Networks connector for sending events to KUMA is ready for use.
Page top
Configuring export of KICS for Networks events to KUMA
To configure the sending of security events from KICS for Networks to KUMA:
- Log in to the KICS for Networks web interface using an administrator account.
- Go to the Settings → Event types section.
- Select the check boxes for the types of events that you want to send to KUMA.
- Click Select connectors.
- This opens a window; in that window, select the connector that you created for sending events to KUMA.
- Click OK.
Events of selected types will be sent to KUMA. In the Event types table, such events are marked with a check box in the column with the connector name.
Page top
Creating a KUMA collector to receive KICS for Networks events
After configuring the event export settings, you must create a collector for KICS for Networks events in the KUMA web interface.
For details on creating a KUMA collector, refer to Creating a collector.
When creating a collector in the KUMA web interface, you must:
- At the Transport step, select the transport protocol type matching the type you selected when you created the connector in KICS for Networks at step 4i (TCP or UDP) and the port number matching the port number you specified at step 4h.
- At the Event parsing step, select the [OOTB] KICS4Net v3.х normalizer.
- At the Routing step, make sure that the following destinations are added to the collector resource set:
- storage—used to transmit data to the storage.
- correlator—used to transmit data to the correlator.
If destinations have not been added to the collector, you must create them.
- At the last step of the wizard, a command is displayed in the lower part of the window, which you can use to install the service on the server that you want to receive events. Copy this command and use it when installing the second part of the collector.
Configuring receipt of PT NAD events
You can configure the receipt of PT NAD events in the KUMA SIEM system.
Configuring event receiving consists of the following steps:
- Configuring export of PT NAD events to KUMA.
- Creating a KUMA collector for receiving PT NAD events.
To receive PT NAD events using Syslog, in the Collector Installation Wizard, at the Event parsing step, select the [OOTB] PT NAD json normalizer.
- Installing a KUMA collector for receiving PT NAD events.
- Verifying receipt of PT NAD events in the KUMA collector.
You can verify that the PT NAD event source server is correctly configured in the Searching for related events section of the KUMA web interface.
Configuring export of PT NAD events to KUMA
Configuring the export of events from PT NAD 11 to KUMA over Syslog involves the following steps:
- Configuring the ptdpi-worker@notifier module.
- Configuring the sending of syslog messages with information about activities, attacks and indicators of compromise.
Configuring the ptdpi-worker@notifier module.
To enable the sending of information about detected information security threats, you must configure the ptdpi-worker@notifier module.
In a multi-server configuration, these instructions must be followed on the primary server.
To configure the ptdpi-worker@notifier module:
- Open the /opt/ptsecurity/etc/ptdpi.settings.yaml file:
sudo nano /opt/ptsecurity/etc/ptdpi.settings.yaml - In the General settings group of settings, uncomment the 'workers' setting and add 'notifier' to its list of values.
For example:
workers: ad alert dns es hosts notifier - To the end of the file, append a line of the form: notifier.yaml.nad_web_url: <URL of the PT NAD web interface>
For example:
notifier.yaml.nad_web_url: https://ptnad.example.comThe ptdpi-worker@notifier module uses the specified URL to generate links to session and activity cards when sending messages.
- Restart the sensor:
sudo ptdpictl restart-all
The ptdpi-worker@notifier module is configured.
Configuring the sending of syslog messages with information about activities, attacks and indicators of compromise
The settings listed in the following instructions may not be present in the configuration file. If a setting is missing, you must add it to the file.
In a multi-server PT NAD configuration, edit the settings on the primary server.
To configure the sending of syslog messages with information about activities, attacks and indicators of compromise:
- Open the /opt/ptsecurity/etc/ptdpi.settings.yaml file:
sudo nano /opt/ptsecurity/etc/ptdpi.settings.yaml - By default, PT NAD sends activity information in Russian. To receive information in English, change the value of the notifier.yaml.syslog_notifier.locale setting to
en.For example:
notifier.yaml.syslog_notifier.locale: en - In the notifier.yaml.syslog_notifier.addresses setting, add a section with settings for sending events to KUMA.
The <Connection name> setting can only contain Latin letters, numerals, and the underscore character.
For the 'address' setting, specify the IP address of the KUMA collector.
Other settings can be omitted, in which case the default values are used.
notifier.yaml.syslog_notifier.addresses:<Connection name>:address: <For sending to a remote server, specify protocol: UDP (default) or TCP, address and port; for local connection, specify Unix domain socket>doc_types: [<Comma-separated message types ('alert' for information about attacks, 'detection' for activities, and 'reputation' for information about indicators of compromise). By default, all types of messages are sent>]facility: <Numeric value of the subject category>ident: <software tag><Connection name>:...The following is an example configuration of sending syslog messages with information about activities, attacks, and indicators of compromise to two remote servers via TCP and UDP without writing to the local log:
notifier.yaml.syslog_notifier.addresses:remote1:address: tcp://198.51.100.1:1514remote2:address: udp://198.51.100.2:2514 - Save your changes in the /opt/ptsecurity/etc/ptdpi.settings.yaml.
- Restart the ptdpi-worker@notifier module:
sudo ptdpictl restart-worker notifier
The sending of events to KUMA via Syslog is configured.
Page top
Configuring receipt of events using the MariaDB Audit Plugin
KUMA allows auditing events using the MariaDB Audit Plugin. The plugin supports MySQL 5.7 and MariaDB. The audit plugin does not support MySQL 8. Detailed information about the plugin is available on the official MariaDB website.
We recommend using MariaDB Audit Plugin version 1.2 or later.
Configuring event receiving consists of the following steps:
- Configuring the MariaDB Audit Plugin to send MySQL events and configuring the Syslog server to send events.
- Configuring the MariaDB Audit Plugin to send MariaDB events and configuring the Syslog server to send events.
- Creating a KUMA Collector for MySQL 5.7 and MariaDB Events.
To receive MySQL 5.7 and MariaDB events using the MariaDB Audit Plugin, in the KUMA Collector Installation Wizard, at the Event parsing step, in the Normalizer field, select [OOTB] MariaDB Audit Plugin syslog.
- Installing a collector in the KUMA network infrastructure.
- Verifying receipt of MySQL and MariaDB events by the KUMA collector.
To verify that the MySQL and MariaDB event source server is configured correctly, you can search for related events.
Configuring the MariaDB Audit Plugin to send MySQL events
The MariaDB Audit Plugin is supported for MySQL 5.7 versions up to 5.7.30 and is bundled with MariaDB.
To configure MySQL 5.7 event reporting using the MariaDB Audit Plugin:
- Download the MariaDB distribution kit and extract it.
You can download the MariaDB distribution kit from the official MariaDB website. The operating system of the MariaDB distribution must be the same as the operating system on which MySQL 5.7 is running.
- Connect to MySQL 5.7 using an account with administrator rights by running the following command:
mysql -u<username>-p - To get the directory where the MySQL 5.7 plugins are located, on the MySQL 5.7 command line, run the following command:
SHOW GLOBAL VARIABLES LIKE 'plugin_dir' - In the directory obtained at step 3, copy the MariaDB Audit Plugin from
<directory to which the distribution kit was extracted>/mariadb-server-<version>/lib/plugins/server_audit.so. - On the operating system command line, run the following command:
chmod 755<directory to which the distribution kit was extracted>server_audit.soFor example:
chmod 755 /usr/lib64/mysql/plugin/server_audit.so - On the MySQL 5.7 command line, run the following command:
install plugin server_audit soname 'server_audit.so' - Create a backup copy of the /etc/mysql/mysql.conf.d/mysqld.cnf configuration file.
- In the configuration file /etc/mysql/mysql.conf.d/mysqld.cnf, in the
[mysqld]section, add the following lines:server_audit_logging=1server_audit_events=connect,table,query_ddl,query_dml,query_dclserver_audit_output_type=SYSLOGserver_audit_syslog_facility=LOG_SYSLOGIf you want to disable event export for certain audit event groups, remove some of the values from the
server_audit_eventssetting. Descriptions of settings are available on the MariaDB Audit Plugin vendor's website. - Save changes to the configuration file.
- Restart the MariaDB service by running one of the following commands:
systemctl restart mysqldfor a system with systemd initialization.service mysqld restartfor a system with init initialization.
MariaDB Audit Plugin for MySQL 5.7 is configured. If necessary, you can run the following commands on the MySQL 5.7 command line:
show pluginsto check the list of current plugins.SHOW GLOBAL VARIABLES LIKE 'server_audit%'to check the current audit settings.
Configuring the MariaDB Audit Plugin to send MariaDB Events
The MariaDB Audit Plugin is included in the MariaDB distribution kit starting with versions 5.5.37 and 10.0.10.
To configure MariaDB event export using the MariaDB Audit Plugin:
- Connect to MariaDB using an account with administrator rights by running the following command:
mysql -u<username>-p - To check if the plugin is present in the directory where operating system plugins are located, run the following command on the MariaDB command line:
SHOW GLOBAL VARIABLES LIKE 'plugin_dir' - On the operating system command line, run the following command:
ll<directory obtained by the previous command>| grep server_audit.soIf the command output is empty and the plugin is not present in the directory, you can either copy the MariaDB Audit Plugin to that directory or use a newer version of MariaDB.
- On the MariaDB command line, run the following command:
install plugin server_audit soname 'server_audit.so' - Create a backup copy of the /etc/mysql/my.cnf configuration file.
- In the /etc/mysql/my.cnf configuration file, in the
[mysqld]section, add the following lines:server_audit_logging=1server_audit_events=connect,table,query_ddl,query_dml,query_dclserver_audit_output_type=SYSLOGserver_audit_syslog_facility=LOG_SYSLOGIf you want to disable event export for certain audit event groups, remove some of the values from the
server_audit_eventssetting. Descriptions of settings are available on the MariaDB Audit Plugin vendor's website. - Save changes to the configuration file.
- Restart the MariaDB service by running one of the following commands:
systemctl restart mariadbfor a system with systemd initialization.service mariadb restartfor a system with init initialization.
MariaDB Audit Plugin for MariaDB is configured. If necessary, you can run the following commands on the MariaDB command line:
show pluginsto check the list of current plugins.SHOW GLOBAL VARIABLES LIKE 'server_audit%'to check the current audit settings.
Configuring a Syslog server to send events
The rsyslog service is used to transmit events from the server to the collector.
To configure the sending of events from the server where MySQL or MariaDB is installed to the collector:
- Before making any changes, create a backup copy of the /etc/rsyslog.conf configuration file.
- To send events via UDP, add the following line to the /etc/rsyslog.conf configuration file:
*.* @<IP address of the KUMA collector>:<port of the KUMA collector>For example:
*.* @192.168.1.5:1514If you want to send events over TCP, the line should be as follows:
*.* @@192.168.1.5:2514Save changes to the /etc/rsyslog.conf configuration file.
- Restart the rsyslog service by executing the following command:
sudo systemctl restart rsyslog.service
Configuring receipt of Apache Cassandra events
KUMA allows receiving information about Apache Cassandra events.
Configuring event receiving consists of the following steps:
- Configuring Apache Cassandra event logging in KUMA.
- Creating a KUMA collector for Apache Cassandra events.
To receive Apache Cassandra events, in the KUMA Collector Installation Wizard, at the Transport step, select a file type connector; at the Event parsing step, in the Normalizer field, select [OOTB] Apache Cassandra file.
- Installing a collector in the KUMA network infrastructure.
- Verifying receipt of Apache Cassandra events in the KUMA collector.
To verify that the Apache Cassandra event source server is configured correctly, you can search for related events.
Configuring Apache Cassandra event logging in KUMA
To configuring Apache Cassandra event logging in KUMA:
- Make sure that the server where Apache Cassandra is installed has 5 GB of free disk space.
- Connect to the Apache Cassandra server using an account with administrator rights.
- Before making changes, create backup copies of the following configuration files:
- /etc/cassandra/cassandra.yaml
- /etc/cassandra/logback.xml
- Make sure that the settings in the /etc/cassandra/cassandra.yaml configuration file have the following values; make changes if necessary:
- in the
audit_logging_optionssection, set theenabledsetting totrue. - in the
loggersection, set theclass_namesetting toFileAuditLogger.
- in the
- Add the following lines to the /etc/cassandra/logback.xml configuration file:
<!-- Audit Logging (FileAuditLogger) rolling file appender to audit.log --><appender name="AUDIT" class="ch.qos.logback.core.rolling.RollingFileAppender"><file>${cassandra.logdir}/audit/audit.log</file><rollingPolicy class="ch.qos.logback.core.rolling.SizeAndTimeBasedRollingPolicy"><!-- rollover daily --><fileNamePattern>${cassandra.logdir}/audit/audit.log.%d{yyyy-MM-dd}.%i.zip</fileNamePattern><!-- each file should be at most 50MB, keep 30 days worth of history, but at most 5GB --><maxFileSize>50MB</maxFileSize><maxHistory>30</maxHistory><totalSizeCap>5GB</totalSizeCap></rollingPolicy><encoder><pattern>%-5level [%thread] %date{ISO8601} %F:%L - %replace(%msg){'\n', ' '}%n</pattern></encoder></appender><!-- Audit Logging additivity to redirect audt logging events to audit/audit.log --><logger name="org.apache.cassandra.audit" additivity="false" level="INFO"><appender-ref ref="AUDIT"/></logger> - Save changes to the configuration file.
- Restart the Apache Cassandra service using the following commands:
sudo systemctl stop cassandra.servicesudo systemctl start cassandra.service
- After restarting, check the status of Apache Cassandra using the following command:
sudo systemctl status cassandra.serviceMake sure that the command output contains the following sequence of characters:
Active: active (running)
Apache Cassandra event export is configured. Events are located in the /var/log/cassandra/audit/ directory, in the audit.log file (${cassandra.logdir}/audit/audit.log).
Page top
Configuring receipt of FreeIPA events
You can configure the receipt of FreeIPA events in KUMA via the Syslog protocol.
Configuring event receiving consists of the following steps:
- Configuring export of FreeIPA events to KUMA.
- Creating a KUMA collector for receiving FreeIPA events.
To receive FreeIPA events, in the KUMA Collector Setup Wizard, at the Event parsing step, in the Normalizer field, select [OOTB] FreeIPA.
- Installing the KUMA collector in the network infrastructure.
- Verifying receipt of FreeIPA events by KUMA.
To verify that the FreeIPA event source server is configured correctly, you can search for related events.
Configuring export of FreeIPA events to KUMA
To configure the export of FreeIPA events to KUMA via the Syslog protocol in JSON format:
- Connect to the FreeIPA server via SSH using an account with administrator rights.
- In the /etc/rsyslog.d/ directory, create a file named freeipa-to-siem.conf.
- Add the following lines to the /etc/rsyslog.d/freeipa-to-siem.conf configuration file:
$ModLoad imfileinput(type="imfile"File="/var/log/httpd/error_log"Tag="tag_FreeIPA_log_httpd")input(type="imfile"File="/var/log/dirsrv/slapd-*/audit"Tag="tag_FreeIPA_log_audit"StartMsg.regex="^time:")input(type="imfile"File="/var/log/dirsrv/slapd-*/errors"Tag="tag_FreeIPA_log_errors")input(type="imfile"File="/var/log/dirsrv/slapd-*/access"Tag="tag_FreeIPA_log_access")input(type="imfile"File="/var/log/krb5kdc.log"Tag="tag_FreeIPA_log_krb5kdc")template(name="ls_json" type="list" option.json="on") {constant(value="{")constant(value="\"@timestamp\":\"") property(name="timegenerated" dateFormat="rfc3339")constant(value="\",\"@version\":\"1")constant(value="\",\"message\":\"") property(name="msg")constant(value="\",\"host\":\"") property(name="fromhost")constant(value="\",\"host_ip\":\"") property(name="fromhost-ip")constant(value="\",\"logsource\":\"") property(name="fromhost")constant(value="\",\"severity_label\":\"") property(name="syslogseverity-text")constant(value="\",\"severity\":\"") property(name="syslogseverity")constant(value="\",\"facility_label\":\"") property(name="syslogfacility-text")constant(value="\",\"facility\":\"") property(name="syslogfacility")constant(value="\",\"program\":\"") property(name="programname")constant(value="\",\"pid\":\"") property(name="procid")constant(value="\",\"syslogtag\":\"") property(name="syslogtag")constant(value="\"}\n")}if $syslogtag contains 'tag_FreeIPA_log' then {action(type="omfwd"target="<IP address of KUMA collector>"port="<port of KUMA collector>"protocol="<udp or tcp>"template="ls_json")stop} - Add the following line to the /etc/rsyslog.conf configuration file:
$RepeatedMsgReduction off - Save changes to the configuration file.
- Restart the rsyslog service by executing the following command:
sudo systemctl restart rsyslog.service
Configuring receipt of VipNet TIAS events
You can configure the receipt of ViPNet TIAS events in KUMA via the Syslog protocol.
Configuring event receiving consists of the following steps:
- Configuring export of ViPNet TIAS events to KUMA.
- Creating a KUMA collector for receiving ViPNet TIAS events.
To receive ViPNet TIAS events using Syslog, in the Collector Installation Wizard, at the Event parsing step, select the [OOTB] Syslog-CEF normalizer.
- Installing a KUMA collector for receiving ViPNet TIAS events.
- Verifying receipt of ViPNet TIAS events in KUMA.
You can verify that ViPNet TIAS event source server is correctly configured in the Searching for related events section of the KUMA web interface.
Configuring export of ViPNet TIAS events to KUMA
To configure the export of ViPNet TIAS events to KUMA via the syslog protocol:
- Connect to the ViPNet TIAS web interface under a user account with administrator rights.
- Go to the Management – Integrations section.
- On the Integration page, go to the Syslog tab.
- In the toolbar of the list of receiving servers, click New server.
- This opens the new server card; in that card:
- In the Server address field, enter the IP address or domain name of the KUMA collector.
For example, 10.1.2.3 or syslog.siem.ru
- In the Port field, specify the inbound port of the KUMA collector. The default port number is 514.
- In the Protocol list, select the transport layer protocol that the KUMA collector is listening on. UDP is selected by default.
- In the Organization list, use the check boxes to select the organizations of the ViPNet TIAS infrastructure.
Messages are sent only for incidents detected based on events received from sensors of selected organizations of the infrastructure.
- In the Status list, use check boxes to select incident statuses.
Messages are sent only when selected statuses are assigned to incidents.
- In the Severity level list, use check boxes to select the severity levels of the incidents.
Messages are sent only about incidents with the selected severity levels. By default, only the high severity level is selected in the list.
- In the UI language list, select the language in which you want to receive information about incidents in messages. Russian is selected by default.
- In the Server address field, enter the IP address or domain name of the KUMA collector.
- Click Add.
- In the toolbar of the list, enable the Do not send incident information in CEF format toggle switch.
As a result, when new incidents are detected or the statuses of previously detected incidents change, depending on the statuses selected during configuration, the corresponding information is sent to the specified addresses of receiving servers via the syslog protocol in CEF format.
- Click Save changes.
Export of events to the KUMA collector is configured.
Page top
Configuring receipt of Nextcloud events
You can configure the receipt of Nextcloud 26.0.4 events in the KUMA SIEM system.
Configuring event receiving consists of the following steps:
- Configuring audit of Nextcloud events.
- Configuring a Syslog server to send events.
The rsyslog service is used to transmit events from the server to the collector.
- Creating a KUMA collector for receiving Nextcloud events.
To receive Nextcloud events, in the Collector Installation Wizard, at the Event parsing step, select the [OOTB] Nextcloud syslog normalizer, and at the Transport step select the tcp or udp connector type.
- Installing KUMA collector for receiving Nextcloud events
- Verifying receipt of Nextcloud events in the KUMA collector
You can verify that the Nextcloud event source server is correctly configured in the Searching for related events section of the KUMA web interface.
Configuring audit of Nextcloud events
To configure the export of Nextcloud events to KUMA:
- On the server where Nextcloud is installed, create a backup copy of the
/home/localuser/www/nextcloud/config/config.phpconfiguration file. - Edit the
/home/localuser/www/nextcloud/config/config.phpNextcloud configuration file. - Edit the settings as follows:
'log_type' => 'syslog','syslog_tag' => 'Nextcloud','logfile' => '','loglevel' => 0,'log.condition' => ['apps' => ['admin_audit'],], - Restart the Nextcloud service:
sudo service restart nextcloud
Export of events to the KUMA collector is configured.
Page top
Configuring a Syslog server to send Nextcloud events
To configure the sending of events from the server where Nextcloud is installed to the collector:
- In the /etc/rsyslog.d/ directory, create a Nextcloud-to-siem.conf file with the following content:
If $programname contains 'Nextcloud' then @<IP address of the collector>:<port of the collector>Example:
If $programname contains 'Nextcloud' then @192.168.1.5:1514If you want to send events via TCP, the contents of the file must be as follows:
If $programname contains 'Nextcloud' then @<IP address of the collector>:<port of the collector> - Save changes to the Nextcloud-to-siem.conf configuration file.
- Create a backup copy of the /etc/rsyslog.conf file.
- Add the following lines to the /etc/rsyslog.conf configuration file:
$IncludeConfig /etc/Nextcloud-to-siem.conf$RepeatedMsgReduction off - Save your changes.
- Restart the rsyslog service by executing the following command:
sudo systemctl restart rsyslog.service
The export of Nextcloud events to the collector is configured.
Page top
Configuring receipt of Snort events
You can configure the receipt of Snort 3 events in the KUMA SIEM system.
Configuring event receiving consists of the following steps:
- Configuring logging of Snort events.
- Creating a KUMA collector for receiving Snort events.
To receive Snort events, in the Collector Installation Wizard, at the Event parsing step, select the [OOTB] Snort 3 json file normalizer, and at the Transport step, select the file connector type.
- Installing a KUMA collector for receiving Snort events
- Verifying receipt of Snort events in the KUMA collector
You can verify that the Snort event source server is correctly configured in the Searching for related events section of the KUMA web interface.
Configuring logging of Snort events
Make sure that the server running Snort has at least 500 MB of free disk space for storing a single Snort event log.
When the log reaches 500 MB, Snort automatically creates a new file with a name that includes the current time in unixtime format.
We recommend monitoring disk space usage.
To configure Snort event logging:
- Connect to the server where Snort is installed using an account with administrative privileges.
- Edit the Snort configuration file. To do so, run the following command on the command line:
sudo vi /usr/local/etc/snort/snort.lua - In the configuration file, edit the alert_json block:
alert_json ={file = true,limit = 500,fields = 'seconds action class b64_data dir dst_addr dst_ap dst_port eth_dst eth_len \eth_src eth_type gid icmp_code icmp_id icmp_seq icmp_type iface ip_id ip_len msg mpls \pkt_gen pkt_len pkt_num priority proto rev rule service sid src_addr src_ap src_port \target tcp_ack tcp_flags tcp_len tcp_seq tcp_win tos ttl udp_len vlan timestamp',} - To complete the configuration, run the following command:
sudo /usr/local/bin/snort -c /usr/local/etc/snort/snort.lua -s 65535 -k none -l /var/log/snort -i<name of the interface that Snort is listening on>-m 0x1b
As a result, Snort events are logged to /var/log/snort/alert_json.txt.
Page top
Configuring receipt of Suricata events
You can configure the receipt of Suricata 7.0.1 events in the KUMA SIEM system.
Configuring event receiving consists of the following steps:
- Configuring export of Suricata events to KUMA
- Creating a KUMA collector for receiving Suricata events.
To receive Suricata events, in the Collector Installation Wizard, at the Event parsing step, select the [OOTB] Suricata json file normalizer, and at the Transport step, select the file connector type.
- Installing KUMA collector for receiving Suricata events
- Verifying receipt of Suricata events in the KUMA collector
You can verify that the Suricata event source server is correctly configured in the Searching for related events section of the KUMA web interface.
Configuring audit of Suricata events.
To configure Suricata event logging:
- Connect via SSH to the server that has administrative accounts.
- Create a backup copy of the /etc/suricata/suricata.yaml file.
- Set the following values in the eve-log section of the /etc/suricata/suricata.yaml configuration file:
- eve-log:enabled: yesfiletype: regular #regular|syslog|unix_dgram|unix_stream|redisfilename: eve.json - Save your changes to the /etc/suricata/suricata.yaml configuration file.
As a result, Suricata events are logged to the /usr/local/var/log/suricata/eve.json file.
Suricata does not support limiting the size of the eve.json event file. If necessary, you can manage the log size by using rotation. For example, to configure hourly log rotation, add the following lines to the configuration file:
outputs:
- eve-log:
filename: eve-%Y-%m-%d-%H:%M.json
rotate-interval: hour
Configuring receipt of FreeRADIUS events
You can configure the receipt of FreeRADIUS 3.0.26 events in the KUMA SIEM system.
Configuring event receiving consists of the following steps:
- Configuring audit of FreeRADIUS events.
- Configuring a Syslog server to send FreeRADIUS events.
- Creating a KUMA collector for receiving FreeRADIUS events.
To receive FreeRADIUS events, in the Collector Installation Wizard, at the Event parsing step, select the [OOTB] FreeRADIUS syslog normalizer, and at the Transport step, select the tcp or udp connector type.
- Installing KUMA collector for receiving FreeRADIUS events.
- Verifying receipt of FreeRADIUS events in the KUMA collector.
You can verify that the FreeRADIUS event source server is correctly configured in the Searching for related events section of the KUMA web interface.
Configuring audit of FreeRADIUS events
To configure event audit in the FreeRADIUS system:
- Connect to the server where the FreeRADIUS system is installed using an account with administrative privileges.
- Create a backup copy of the FreeRADIUS configuration file:
sudo cp /etc/freeradius/3.0/radiusd.conf /etc/freeradius /3.0/radiusd.conf.bak - Open the FreeRADIUS configuration file for editing:
sudo nano /etc/freeradius/3.0/radiusd.conf - In the 'log' section, edit the settings as follows:
destination = syslogsyslog_facility = daemonstripped_names = noauth = yesauth_badpass = yesauth_goodpass = yes - Save the configuration file.
FreeRADIUS event audit is configured.
Page top
Configuring a Syslog server to send FreeRADIUS events
The rsyslog service is used to transmit events from the FreeRADIUS server to the KUMA collector.
To configure the sending of events from the server where FreeRADIUS is installed to the collector:
- In the /etc/rsyslog.d/ directory, create the FreeRADIUS-to-siem.conf file and add the following line to it:
If $programname contains 'radiusd' then @<IP address of the collector>:<port of the collector>If you want to send events via TCP, the contents of the file must be as follows:
If $programname contains 'radiusd' then @<IP address of the collector>:<port of the collector> - Create a backup copy of the /etc/rsyslog.conf file.
- Add the following lines to the /etc/rsyslog.conf configuration file:
$IncludeConfig /etc/FreeRADIUS-to-siem.conf$RepeatedMsgReduction off - Save your changes.
- Restart the rsyslog service:
sudo systemctl restart rsyslog.service
The export of events from the FreeRADIUS server to the KUMA collector is configured.
Page top
Configuring receipt of VMware vCenter events
You can configure the receipt of VMware vCenter events in the KUMA SIEM system.
Configuring event receiving consists of the following steps:
- Configuring the connection to VMware vCenter.
- Creating a KUMA collector for receiving VMware vCenter events.
To receive VMware vCenter events, in the Collector Installation Wizard, at the Transport step, select the vmware connector type. Specify the required settings:
- The URL at which the VMware API is available, for example, https://vmware-server.com:6440.
- VMware credentials — a secret that specifies the username and password for connecting to the VMware API.
At the Event parsing step, select the [OOTB] VMware vCenter API normalizer.
- Installing a KUMA collector for receiving VMware vCenter events.
- Verifying receipt of VMware vCenter events in the KUMA collector.
You can verify that the VMware vCenter event source server is correctly configured in the Searching for related events section of the KUMA web interface.
Configuring the connection to VMware vCenter
To configure a connection to VMware vCenter to receive events:
- Connect to the VMware vCenter web interface under a user account that has administrative privileges.
- Go to the Security&Users section and select Users.
- Create a user account.
- Go to the Roles section and assign the Read-only: See details of objects role, but not make changes role to the created account.
You will use the credentials of this user account in the secret of the collector.
For details about creating user accounts, refer to the VMware vCenter documentation.
The connection to VMware vCenter for receiving events is configured.
Page top
Configuring receipt of zVirt events
You can configure the receipt of zVirt 3.1 events in the KUMA SIEM system.
Configuring event receiving consists of the following steps:
- Configuring export of zVirt events to KUMA.
- Creating a KUMA collector for receiving zVirt events.
To receive zVirt events, in the Collector Installation Wizard, at the Event parsing step, select the [OOTB] OrionSoft zVirt syslog normalizer, and at the Transport step, select the tcp or udp connector type.
- Installing KUMA collector for receiving zVirt events
- Verifying receipt of zVirt events in the KUMA collector
You can verify that the zVirt event source server is correctly configured in the Searching for related events section of the KUMA web interface.
Configuring export of zVirt events
ZVirt can send events to external systems in Hosted Engine installation mode.
To configure the export of zVirt events to KUMA:
- In the zVirt web interface, under Resources, select Virtual machines.
- Select the machine that is running the HostedEngine virtual machine and click Edit.
- In the Edit virtual machine window, go to the Logging section.
- Select the Determine Syslog server address check box.
- In the text box, enter the collector information in the following format:
<IP address or FQDN of the KUMA collector>:<port of the KUMA collector>. - If you want to use TCP instead of UDP for sending logs, select the Use TCP connection check box.
Event export is configured.
Page top
Configuring receipt of Zeek IDS events
You can configure the receipt of Zeek IDS 1.8 events in the KUMA SIEM system.
Configuring event receiving consists of the following steps:
- Conversion of the Zeek IDS event log format.
The KUMA normalizer supports Zeek IDS logs in the JSON format. To send events to the KUMA normalizer, log files must be converted to the JSON format.
- Creating a KUMA collector for receiving Zeek IDS events.
To receive Zeek IDS events, in the Collector Installation Wizard, at the Event parsing step, select the [OOTB] ZEEK IDS json file normalizer, and at the Transport step, select the file connector type.
- Installing KUMA collector for receiving Zeek IDS events
- Verifying receipt of Zeek IDS events in the KUMA collector
You can verify that the Zeek IDS event source server is correctly configured in the Searching for related events section of the KUMA web interface.
Conversion of the Zeek IDS event log format
By default, Zeek IDS events are logged in files in the /opt/zeek/logs/current directory.
The "[OOTB] ZEEK IDS json file" normalizer supports Zeek IDS logs in the JSON format. To send events to the KUMA normalizer, log files must be converted to the JSON format.
This procedure must be repeated every time before receiving Zeek IDS events.
To convert the Zeek IDS event log format:
- Connect to the server where Zeek IDS is installed using an account with administrative privileges.
- Create the directory where JSON event logs must be stored:
sudo mkdir /opt/zeek/logs/zeek-json - Change to this directory:
sudo cd /opt/zeek/logs/zeek-json - Run the command that uses the jq utility to convert the original event log format to the target format:
jq . -c<path to the log file to be converted to a different format>>><new file name>.logExample:
jq . -c /opt/zeek/logs/current/conn.log >> conn.log
As a result of running the command, a new file is created in the /opt/zeek/logs/zeek-json directory if this file did not exist before. If the file was already present in the current directory, new information is appended to the end of the file.
Page top
Configuring Windows event reception using Kaspersky Endpoint Security for Windows
In KES for Windows, starting from version 12.6, events can be sent from Windows logs to a KUMA collector. In this way, KUMA can get events from Windows logs (a limited set of EventIDs of Microsoft products is supported) from all hosts with KES for Windows 12.6 without installing KUMA agents on such hosts. To activate the functionality, you need:
- A valid KUMA license
- KSC 14.2 or later
- KES for Windows version 12.6 or later
Configuring event receiving consists of the following steps:
- Importing the normalizer into KUMA.
In KUMA, you must configure getting updates through Kaspersky update servers.
Click Import resources and in the list of normalizers available for installation, select [OOTB] Microsoft Products via KES WIN.
- Creating a KUMA collector for receiving Windows events.
To receive Windows events, at the Transport step, select TCP or UDP and specify the port number that the collector must listen on. At the Event parsing step, select the [OOTB] Microsoft Products via KES WIN normalizer. At the Event filtering step, select the [OOTB] Microsoft Products via KES WIN - Event filter for collector filter.
- Requesting a key from Technical Support.
If your license did not include a key for activating the functionality of sending Windows logs to the KUMA collector, send the following message to Technical Support: "We have purchased a KUMA license and are using KES for Windows version 12.6. We want to activate the functionality of sending Windows logs to the KUMA collector. Please provide a key file to activate the functionality." New KUMA users do not need to make a Technical Support request because new users get 2 keys with licenses for KUMA and for activating the KES for Windows functionality.
In response to your message, you will get a key file.
- Configuration on the side of KSC and KES for Windows.
A key file that activates the functionality of sending Windows events to KUMA collectors must be imported into KSC and distributed to KES endpoints in accordance with the instructions. You must also add KUMA server addresses to the KES policy and specify network connection settings.
- Verifying receipt of Windows events in the KUMA collector
You can verify that the Windows event source server is correctly configured in the Searching for related events section of the KUMA web interface.
Microsoft product events transmitted by KES for Windows are listed in the following table:
Event log
Event identifier
System
12
13
7040
7045
42
104
107
109
1074
6005
6006
7034
7036
8003
Security
1102
4614
4649
4696
4698
4704
4706
4713
4715
4717
4720
4723
4724
4725
4726
4727
4728
4729
4738
4739
4740
4741
4742
4756
4757
4765
4766
4767
4768
4769
4770
4771
4775
4776
4778
4780
4781
4794
4817
4876
4877
4882
4885
4886
4887
4890
4891
4898
4904
4905
4928
4950
4964
5136
5137
5138
5139
5141
5142
5143
5144
5155
5376
5377
5632
5888
5890
6416
4622
4648
4662
4672
4697
4702
4719
4732
4733
4798
4946
4947
4948
4949
5145
4616
4625
4663
4624
4799
5140
1008
1105
2722
4615
4618
4626
4627
4634
4647
4653
4654
4656
4657
4658
4659
4660
4661
4664
4666
4667
4670
4673
4674
4688
4689
4690
4691
4692
4693
4694
4695
4699
4700
4701
4703
4705
4707
4714
4716
4718
4730
4731
4734
4737
4743
4744
4745
4746
4747
4748
4749
4750
4751
4752
4753
4754
4755
4758
4759
4760
4761
4762
4763
4764
4772
4773
4774
4777
4779
4782
4783
4784
4785
4786
4787
4788
4789
4790
4791
4792
4793
4797
4800
4801
4802
4803
4818
4819
4820
4821
4822
4823
4824
4825
4826
4865
4866
4867
4868
4869
4870
4871
4872
4873
4874
4875
4883
4884
4888
4892
4893
4896
4906
4907
4908
4911
4912
4913
4929
4930
4931
4932
4933
4935
4944
4945
4951
4953
4956
4957
4958
4981
4982
4983
4984
4985
5024
5031
5033
5039
5049
5051
5056
5057
5058
5059
5060
5061
5063
5064
5065
5066
5067
5068
5069
5070
5071
5122
5123
5146
5147
5152
5153
5154
5156
5157
5158
5159
5168
5378
5379
5380
5381
5382
5447
5448
5451
5452
5459
5461
5472
5474
5477
5478
5483
5484
5633
6144
6145
6272
6273
6274
6276
6278
6279
6280
6281
6410
6419
6420
6421
6422
6423
6424
6889
PowerShell
4100
4103
4104
4105
4106
8193
8194
8197
24577
24595
24596
24597
24598
24599
53249
53250
53504
MS SQL Server
615
919
958
1945
2007
2812
3406
3407
3421
3454
5084
5579
5701
5703
6253
8128
9013
9666
15268
15457
17104
17110
17111
17125
17137
17152
17164
17176
17177
17199
17201
17550
17551
17561
17663
18264
18265
18456
18488
18496
19030
19031
19032
26022
26037
26048
26067
33090
49903
49904
Microsoft Defender
1006
1015
1116
1117
1000
1001
2000
5000
5001
5002
5004
5007
5010
5012
Terminal Server
1149
21
22
24
25
39
40
Microsoft Active Directory Federation Service (AD FS)
106
217
251
335
342
349
358
364
381
385
400
401
417
424
435
436
Sysmon
1
2
3
4
5
6
7
8
9
10
11
12
13
14
15
16
17
18
19
20
21
22
23
24
25
26
27
28
29
255
Microsoft Active Directory Domain Service (AD DS)
1213
1317
1644
2041
2889
Configuring receipt of Codemaster Mirada events
You can configure the receipt of Сodemaster Mirada events in the KUMA SIEM system.
Configuring event receiving consists of the following steps:
- Configuring audit of the Codemaster Mirada system
- Creating a KUMA collector for receiving Codemaster Mirada events.
To receive Codemaster Mirada events, in the Collector Installation Wizard, at the Event parsing step, select the [OOTB] Codemaster Mirada syslog normalizer, and at the Transport step, select the tcp or udp connector type.
- Installing a collector in the KUMA network infrastructure.
- Verifying receipt of Codemaster Mirada events in the KUMA collector
You can verify that the Codemaster Mirada event source server is correctly configured in the Events section of the KUMA web interface.
Configuring audit of the Codemaster Mirada system
The Codemaster Mirada system can send events over the Syslog protocol.
To configure event audit in the Codemaster Mirada system:
- Connect to the Codemaster Mirada web interface under a user account that has administrative privileges.
- Go to the Settings → Syslog section.
- Enable the event transmission service using the toggle switch.
- Select the type and format of the protocol by clicking the dot-in-a-circle icon.
- In the Host field, specify the IP address of the KUMA collector.
- In the Protocol field, specify the UDP or TCP transport protocol.
- In the Port field, specify the port that the KUMA collector is listening on.
The default port is 514.
- In the Format field, specify the RFC 3164 standard.
- Click Save in the lower part of the page to save the changes.
Configuring receipt of Postfix events
You can configure the receipt of Postfix events in KUMA. Integration is only possible when sending events via syslog using the TCP protocol. The resources described in this article are available for KUMA 3.0 and newer versions.
Configuring event receiving consists of the following steps:
- Configuring Postfix to send events.
- Creating a KUMA collector for receiving Postfix events.
- Verifying receipt of Postfix events in the KUMA collector
You can verify that the Postfix event source server is correctly configured in the Searching for related events section of the KUMA web interface.
The Postfix system generates events in two formats:
- Multi-line events containing information about messages (with a unique ID). These events have the following form:
<syslog PRI> time host process_name: ID: information from base event 1
<syslog PRI> time host process_name: id: info from base event 2
- Single-line events containing information about errors (without an ID). These events have the following form:
<syslog PRI> time host process_name: severity: basic information for parsing
A set of KUMA resources is used to process Postfix events; this resource set must be applied when creating a collector:
- Normalizer
- Aggregation rule
- Filters for destinations
The collector aggregates multi-line base events based on event ID, normalizes them, and sends the aggregated event to the storage and the correlator.
The aggregated event has the following form:
Service information from the aggregation rule: ID: information from base event 1, information from base event 2, information from base event n
After aggregation, the received event is sent to the same collector where the aggregated event is normalized.
Processing algorithm for Postfix events
The following algorithm was implemented to process Postfix events:
- Initial normalization
At this stage, initial normalization is performed for base events received via syslog that begin with the "<" character. The events are brought to a format suitable for subsequent aggregation: the first character is extracted from the event and put into the FlexString1 field, the identifier is put into the ExternalID field, and the host name is put into the DeviceHostName field. Basic normalization is performed in the main normalizer.
- Checking for aggregation
The event is examined to see if it is aggregated or not. As a result, non-aggregated events (the first character is not "{" and the ID is not empty) have an aggregation rule applied, and then aggregated events are sent to re-normalization.
- Applying the aggregation rule
At this stage, the aggregation rule is applied to the events, the base events are collated and take the following form:
Service information from the aggregation rule: ID: information from base event 1, information from base event 2, information from base event n
- After aggregation, the collated event is sent back to the same collector to subject the aggregated event to normalization.
To close the event processing loop, you must specify the same collector as the destination. In the diagram, the destination is named "Loop" to draw attention to the event processing loop. You can give an arbitrary name to your destination.
- Normalization of the aggregated event
Normalization of the aggregated event that begins with a "{" character is performed in the following extra normalizers: Aggregated events, Aggregated events. Message KV parser, Aggregated events. Message regex 1, Aggregated events. Message regex 2.
- Sending to storage and the correlator
Aggregated and normalized events are sent to storage and the correlator.
The following figure shows the flow chart of Postfix event processing.
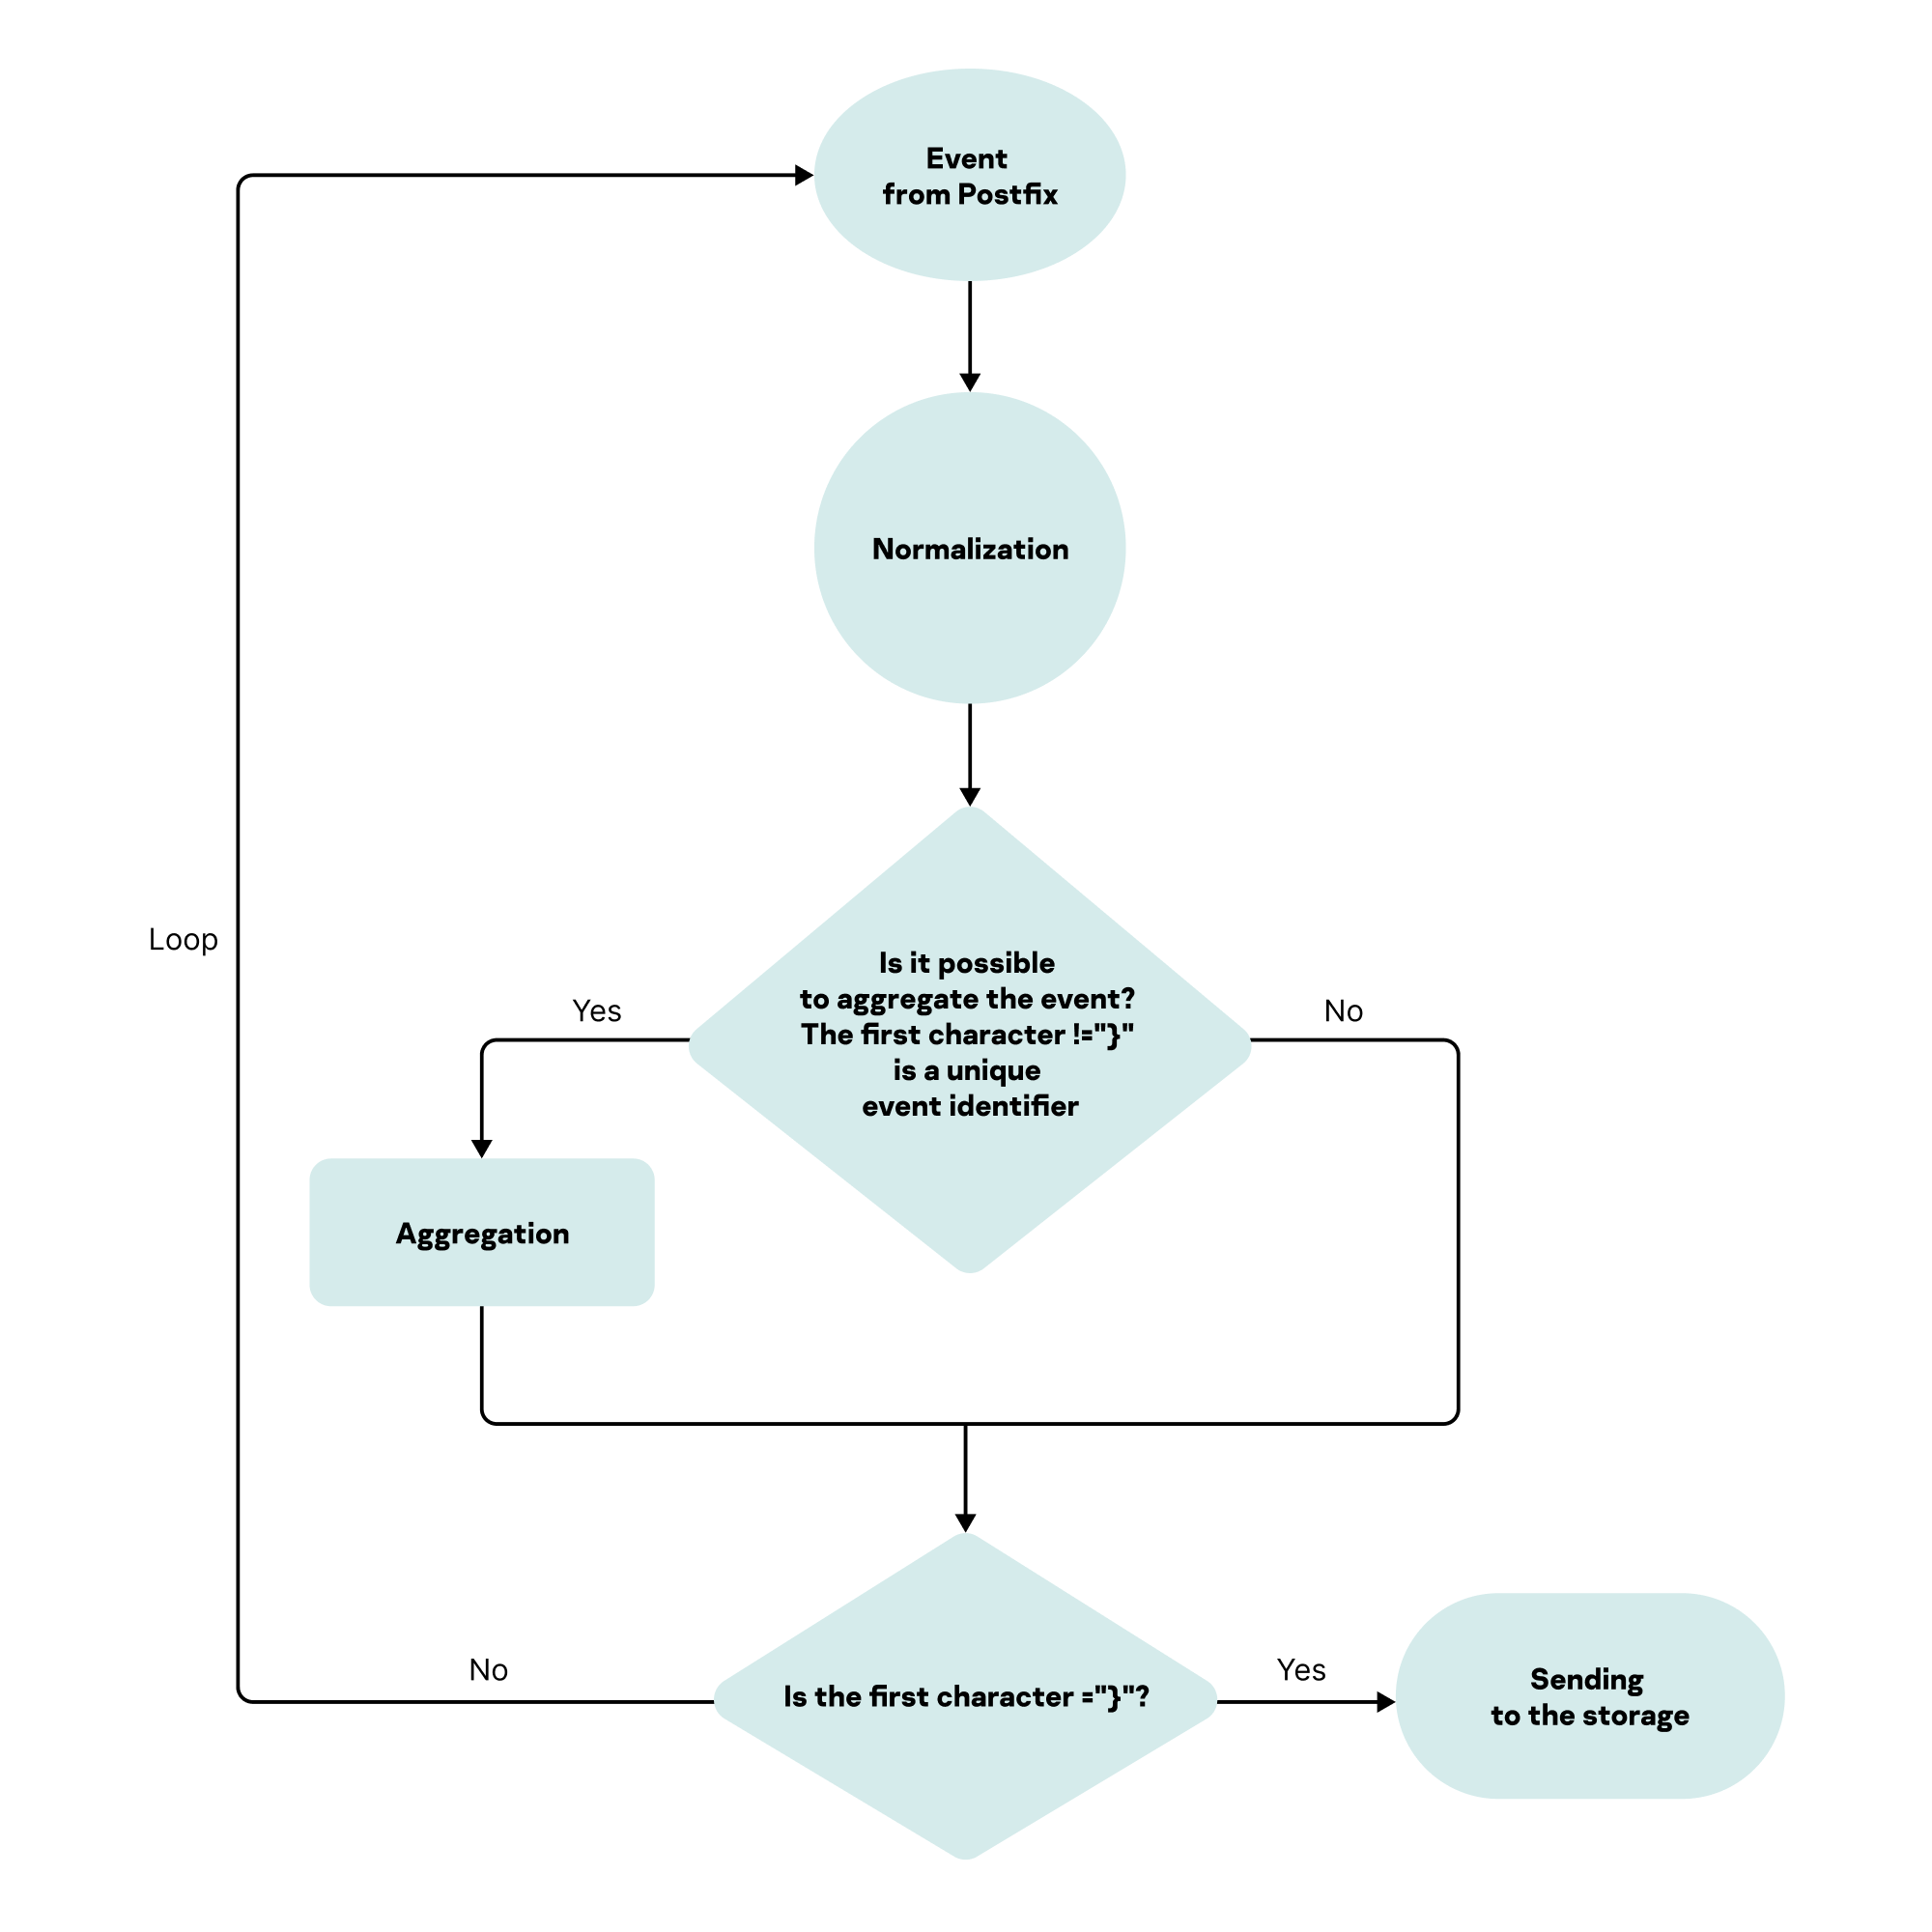
Configuring Postfix to send events
By default, audit events of the Postfix system are output to /var/log/maillog or /var/log/mail.
To send events to KUMA:
- Create a backup copy of the /etc/rsyslog.conf file.
- Open the /etc/rsyslog.conf file for editing.
- Add the following line to the end of the /etc/rsyslog.conf file:
mail.* @@<IP address of the KUMA collector>:<port of the KUMA collector> - Save the /etc/rsyslog.conf file.
- Restart the rsyslog service:
sudo systemctl restart rsyslog
Configuring a KUMA collector for receiving and processing Postfix events
To configure a KUMA collector for receiving Postfix events:
- Import the [OOTB] Postfix package from the KUMA repository. The package is available for KUMA 3.0 and newer versions.
- Create a new collector, and in the Collector Installation Wizard, configure the following:
- At the Transport step, in the Type field, select the tcp type, and in the URL field, specify the FQDN or IP address and port of the collector.
- At the Event parsing step, click Add event parsing, and in the displayed Basic event parsing window, in the Normalizer drop-down list, select the [OOTB] Postfix syslog normalizer.
- At the Event aggregation step, click Add aggregation rule, and in the displayed Event aggregation window, in the Aggregation rule drop-down list, select [OOTB] Postfix. Aggregation rule.
- At the Routing step, click Add and in the displayed Create destination window, create three destination points one by one—the same collector with the name
Loop, a storage, and a correlator.- Create a destination named
Loopwith the following parameters.- On the Basic settings tab, in the Type drop-down list, select the tcp transport type; in the URL field, specify the FQDN or IP address and port of the collector that you specified before at step 2.1 of these instructions.
- On the Advanced settings tab, in the Filter drop-down list, select the Postfix. Filter for event aggregation filter.
This configuration is necessary to send the aggregated event to the same collector for subsequent normalization.
- Create a correlator destination:
- On the Basic settings tab, in the Type drop-down list, select correlator and fill in the URL field.
- On the Advanced settings tab, in the Filter drop-down list, select the Postfix. Aggregated events to storage and correlator filter.
- Create a storage destination:
- On the Basic settings tab, in the Type drop-down list, select storage and fill in the URL field.
- On the Advanced settings tab, in the Filter drop-down list, select the Postfix. Aggregated events to storage and correlator filter.
This configuration is necessary to send the aggregated normalized event to storage and the correlator.
- Create a destination named
- Click the Create button.
The collector service is created with the settings specified in the KUMA web interface. The command for installing the service on the server is displayed.
- Copy the collector installation command and run it on the relevant server.
The collector is configured to receive and process Postfix events.
Page top
Configuring receipt of CommuniGate Pro events
You can configure the receipt of CommuniGate Pro 6.1 events in KUMA. Integration is only possible when sending events via syslog using the TCP protocol. The resources described in this article are available for KUMA 3.0 and newer versions. Processing of SIP module events is supported (such events contain the "SIPDATA" character sequence).
Configuring event receiving consists of the following steps:
- Configuring CommuniGate Pro to send events
- Configuring the KUMA collector for receiving CommuniGate Pro events
- Verifying receipt of CommuniGate Pro events in the KUMA collector
You can verify that the CommuniGate Pro event source server is correctly configured in the Searching for related events section of the KUMA web interface.
The CommuniGate Pro system generates an audit event as several separate records that look like this:
<event code> timestamp ID direction: information from base event 1
<event code> timestamp ID direction: information from base event 2
<event code> timestamp ID direction: base information n
A set of KUMA resources is used to process CommuniGate Pro events; this resource set must be applied when creating a collector:
- Normalizer
- Aggregation rule
- Filters for destinations
The collector aggregates multi-line base events based on event ID, normalizes them, and sends the aggregated event to the storage and the correlator.
The aggregated event has the following form:
Service information from the aggregation rule: ID: information from base event 1, information from base event 2, information from base event n
After aggregation, the received event is sent to the same collector where the aggregated event is normalized.
Processing algorithm for CommuniGate Pro events
The following algorithm was implemented to process CommuniGate Pro events:
- Initial normalization
At this stage, the initial normalization of base events is performed. The first character in the base event is a numeral. The events are brought to a format suitable for subsequent aggregation: the first character is extracted from the event and put into the DeviceCustomString1 field, the identifier is put into the ExternalID field, and the host name is put into the DeviceHostName field. Basic normalization is performed in the main normalizer.
- Checking for aggregation
The event is examined to see if it is aggregated or not. As a result, non-aggregated events (the first character is a numeral) have an aggregation rule applied, and then aggregated events are sent to re-normalization. Aggregation is performed using the [OOTB] CommuniGate Pro. Aggregation rule.
- Applying the aggregation rule
At this stage, the aggregation rule is applied to the events, the base events are collated and take the following form:
Service information from the aggregation rule: ID: information from base event 1, information from base event 2, information from base event n
After aggregation, the collated event is sent back to the same collector to subject the aggregated event to normalization.
To close the event processing loop, you must specify the same collector as the destination. In the diagram, the destination is named "Loop" to draw attention to the event processing loop. You can give an arbitrary name to your destination.
- Normalization of the aggregated event
Normalization of the aggregated event that begins with a "{" character is performed in the following extra normalizers: Aggregated events, Aggregated events - kv part.
- Sending to storage and the correlator
Aggregated and normalized events are sent to storage and the correlator.
The following figure shows the flow chart of CommuniGate Pro event processing.
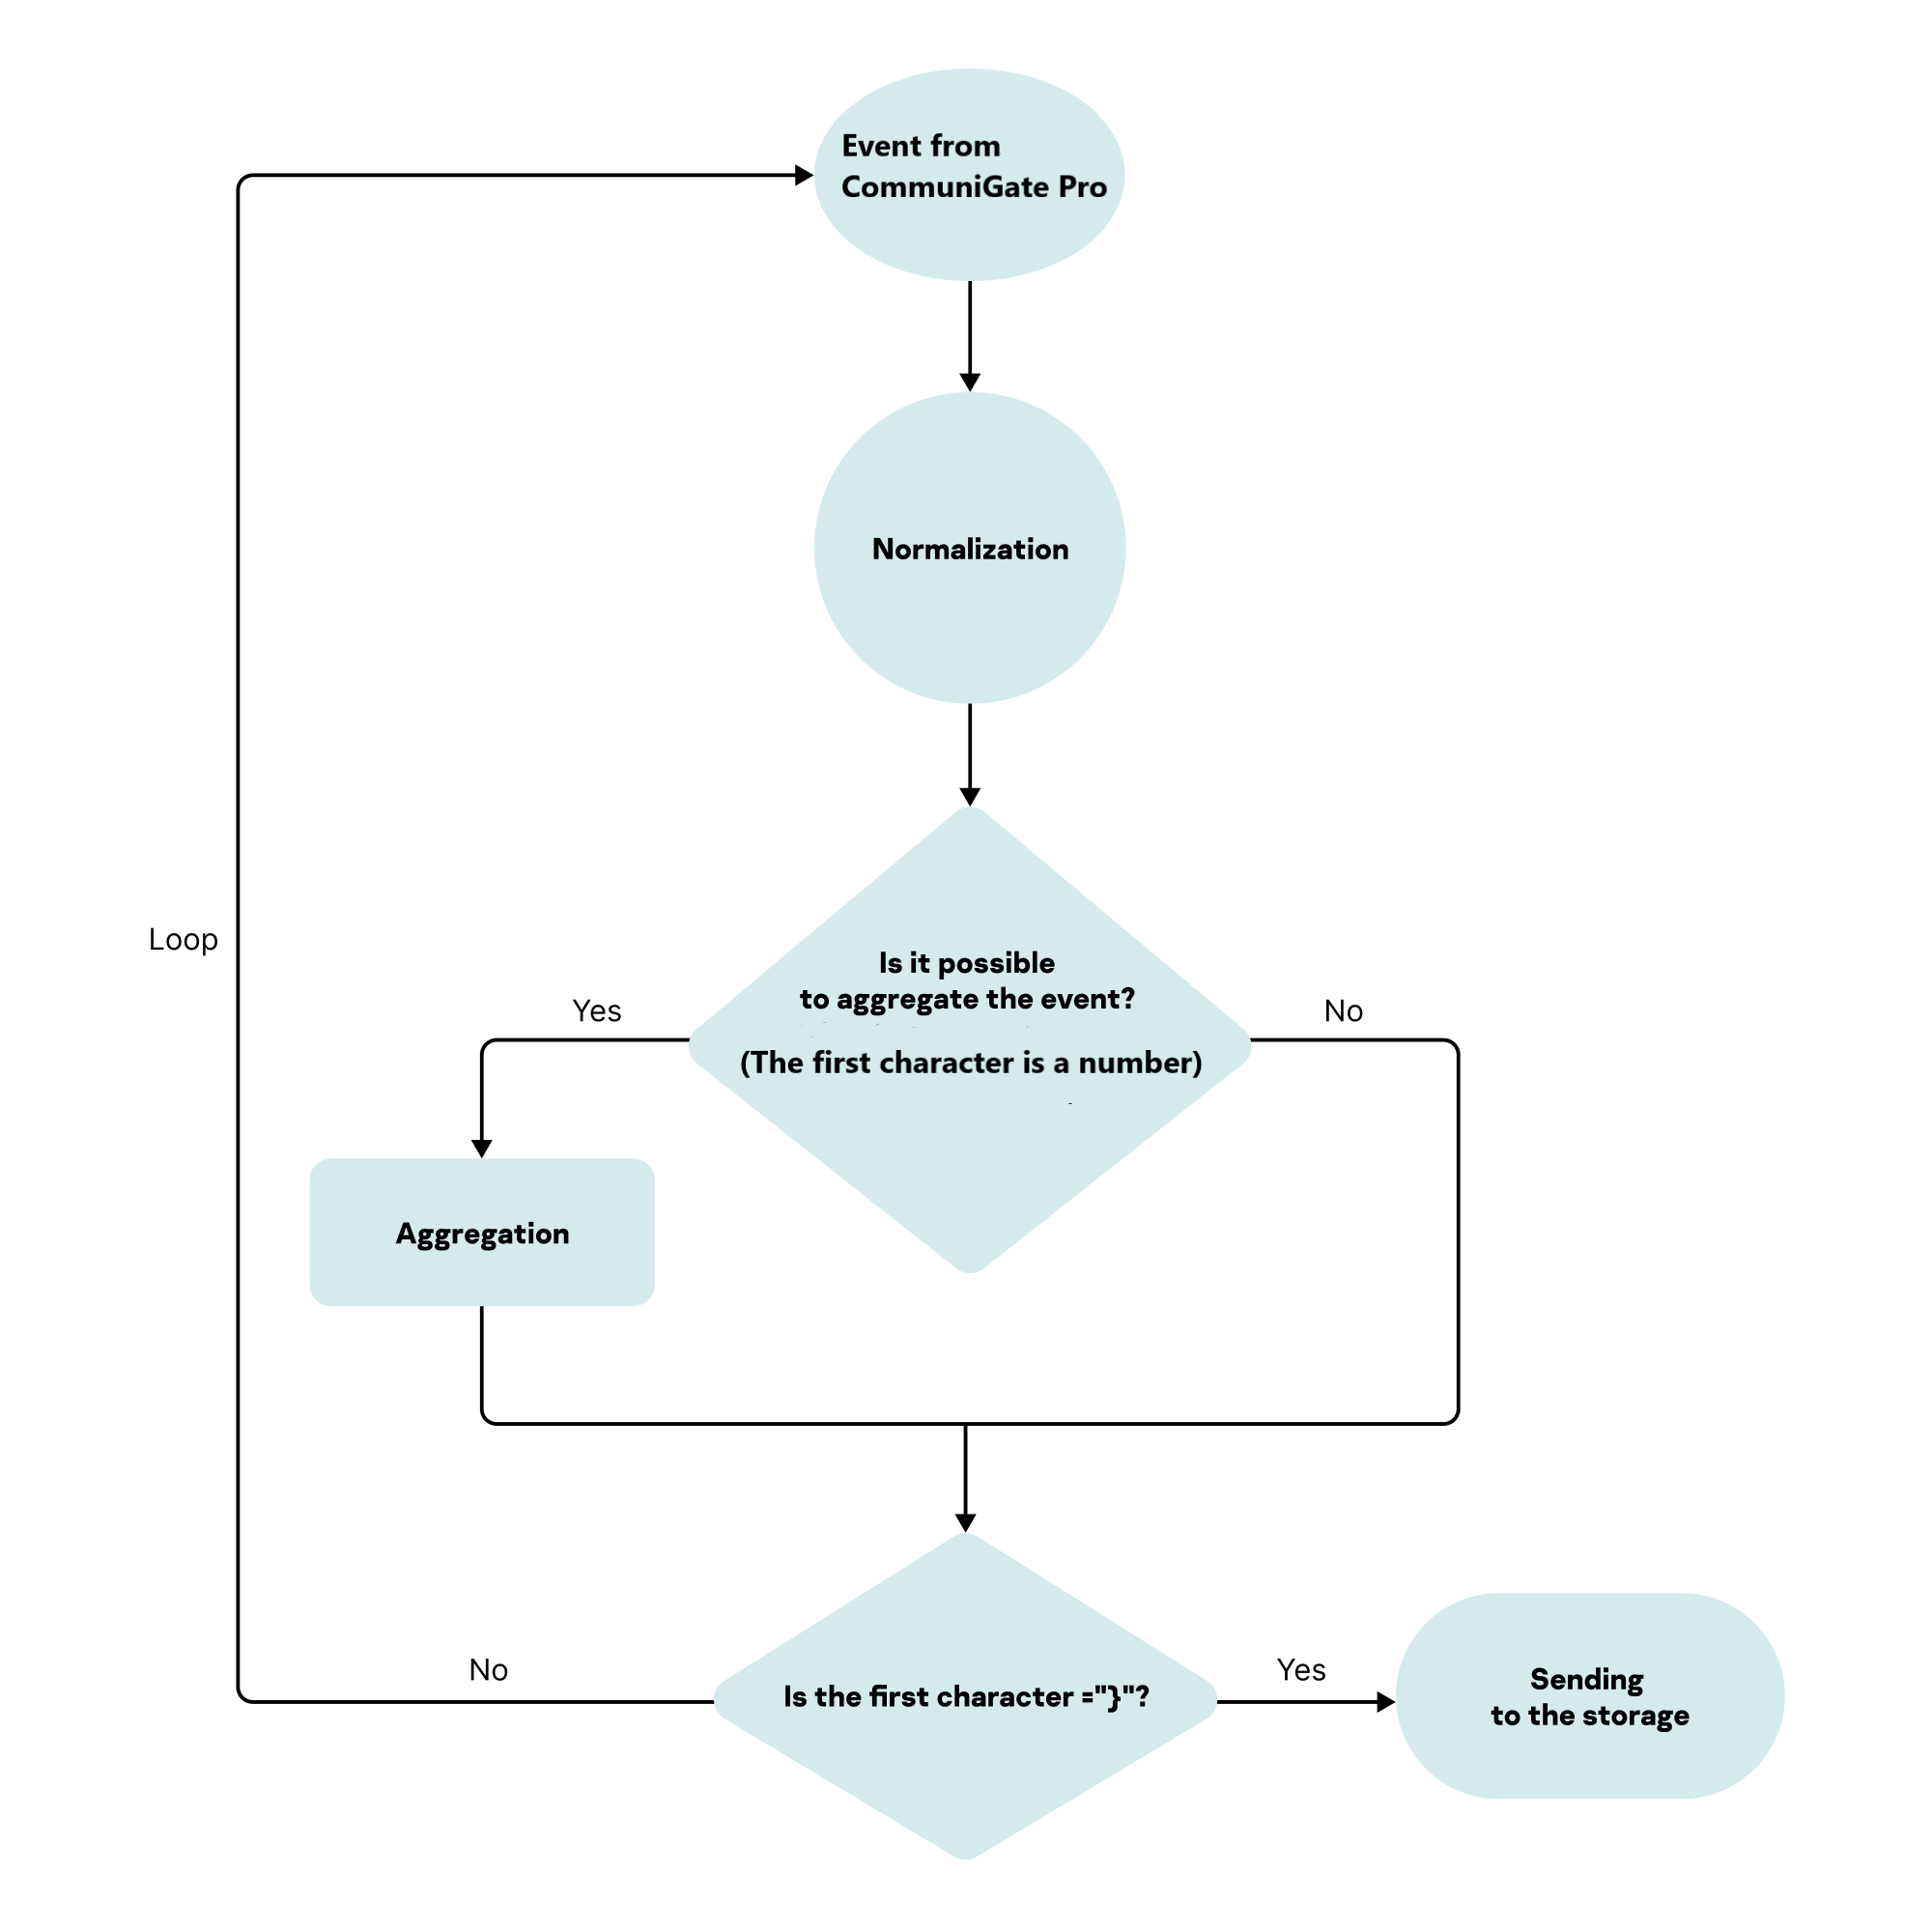
Configuring CommuniGate Pro to send events
By default, CommuniGate Pro audit events are sent to .log files in the /var/CommuniGate/SystemLogs/ directory.
To send events to KUMA, you need to install the KUMA agent on the CommuniGate Pro server and configure it to read .log in the /var/CommuniGate/SystemLogs/ directory and send them to the KUMA collector over TCP.
To create an agent that will read and send events to KUMA:
- In the KUMA web console, go to Resources and services → Agents and click Add.
- This opens the Create agent window; in that window, on the Basic settings tab, in the Name field, specify the agent name.
- On the Config #1 tab, fill in the following fields:
- In the Connector group of settings on the Basic settings tab, set the following values for the connector:
- In the Name field, enter a name, for example,
CommuniGate file. - In the Type drop-down list, select file.
- In the File path field, enter the following value:
/var/CommuniGate/SystemLogs/.*.log
- In the Name field, enter a name, for example,
- In the Destinations group of settings on the Basic settings tab, set the following values for the destination:
- In the Name field, enter a name, for example,
CommuniGate TCP collector. - In the Type drop-down list, select tcp.
- In the URL field, enter the FQDN or IP address and port of the KUMA collector.
- In the Name field, enter a name, for example,
- In the Connector group of settings on the Basic settings tab, set the following values for the connector:
- Click the Create button.
- When the agent service is created in KUMA, install the agent on the network infrastructure devices from which you want to send data to the collector.
Configuring a KUMA collector for receiving and processing CommuniGate Pro events
To configure a KUMA collector for receiving CommuniGate Pro events:
- Import the [OOTB] CommuniGate Pro package from the KUMA repository. The package is available for KUMA 3.0 and newer versions.
- Create a new collector, and in the Collector Installation Wizard, configure the following:
- At the Transport step, in the Type field, select the tcp type, and in the URL field, specify the FQDN or IP address and port of the collector.
- At the Event parsing step, click Add event parsing, and in the displayed Basic event parsing window, in the Normalizer drop-down list, select the [OOTB] CommuniGate Pro normalizer.
- At the Event aggregation step, click Add aggregation rule, and in the displayed Event aggregation window, in the Aggregation rule drop-down list, select [OOTB] CommuniGate Pro. Aggregation rule.
- At the Routing step, click Add and in the displayed Create destination window, create three destination points one by one—the same collector with the name
Loop, a storage, and a correlator.- Create a destination named
Loopwith the following parameters.
- On the Basic settings tab, in the Type drop-down list, select the tcp transport type; in the URL field, specify the FQDN or IP address and port of the collector that you specified before at step 2.1 of these instructions.
- On the Advanced settings tab, in the Filter drop-down list, select the [OOTB] CommuniGate Pro. Filter for event aggregation filter.
This configuration is necessary to send the aggregated event to the same collector for subsequent normalization.
- Create a correlator destination:
- On the Basic settings tab, in the Type drop-down list, select correlator and fill in the URL field.
- On the Advanced settings tab, in the Filter drop-down list, select the [OOTB] CommuniGate Pro. Aggregated events to storage and correlator filter.
- Create a storage destination:
- On the Basic settings tab, in the Type drop-down list, select storage and fill in the URL field.
- On the Advanced settings tab, in the Filter drop-down list, select the [OOTB] CommuniGate Pro. Aggregated events to storage and correlator filter.
This configuration is necessary to send the aggregated normalized event to storage and the correlator.
- Create a destination named
- Click the Create button.
The collector service is created with the settings specified in the KUMA web interface. The command for installing the service on the server is displayed.
- Copy the collector installation command and run it on the relevant server.
The collector is configured to receive and process CommuniGate Pro events.
Page top
Configuring receipt of Yandex Cloud events
You can configure the receipt of Yandex Cloud events in KUMA. The normalizer supports processing configuration-level audit events stored in .json files.
Configuring event receiving consists of the following steps:
- Configuring audit of Yandex Cloud events.
- Configuring export of Yandex Cloud events.
- Configuring a KUMA collector for receiving and processing Yandex Cloud events.
To receive Yandex Cloud events in the KUMA Collector Installation Wizard:
- In the KUMA Collector Installation Wizard, at the Transport step, select the connector of the file type.
- In the URL field, enter
/var/log/yandex-cloud/<audit_trail_id>/*/*/*/*.json, where <audit_trail_id> is the ID of the audit. - At the Event parsing step, in the Normalizer field, select [OOTB] Yandex Cloud.
- Installing a collector in the KUMA network infrastructure.
- Verifying receipt of Yandex Cloud events in the KUMA collector
To verify that the Yandex Cloud event source server is configured correctly, you can search for related events.
Configuring audit of Yandex Cloud events
Configuring event export involves the following steps:
- Preparing the environment for working with Yandex Cloud.
- Creating a bucket for audit logs.
- Creating an encryption key in the Key Management Service.
- Enabling bucket encryption.
- Creating service accounts.
- Creating a static key.
- Assigning roles to service accounts.
- Creating an audit trail.
Preparing the environment for working with Yandex Cloud.
To manage the configuration, you need Yandex Cloud CLI; install and initialize it.
Note: by default, audit is performed in the Yandex Cloud folder specified in the CLI profile. You can specify a different folder using the --folder-name or --folder-id parameter.
To configure the audit, you need an active billing account because a fee is charged for using the Yandex Cloud infrastructure.
To configure Yandex Cloud audit, you need an active billing account:
- Go to the management console, then log in to Yandex Cloud or register.
- On the Yandex Cloud Billing page, make sure that you have a billing account connected and that it has the ACTIVE or TRIAL_ACTIVE status. If you do not have a billing account, create one.
If you have an active billing account, you can create or select a Yandex Cloud folder in which your infrastructure will work, on the cloud page.
Creating a bucket for audit logs
To create a bucket:
- In the management console, go to the folder in which you want to create the bucket, for example, example-folder.
- Select the Object Storage service.
- Click Create bucket.
- On the bucket creation page:
- Enter the bucket name in accordance with the naming rules, for example kumabucket.
- If necessary, limit the maximum size of the bucket. Size 0 means no limit and is equivalent to the enabled No limit option.
- Select the type of access: Restricted.
- Select the default storage class.
- Click Create bucket.
The bucket is created.
Creating an encryption key in the Key Management Service
To create an encryption key:
- In the management console, go to the example-folder folder.
- Select the Key Management Service.
- Click the Create key button and specify the following settings:
- Name (for example, kuma-kms).
- Encryption algorithm, AES-256.
- Keep default values for the rest of the settings.
- Click Create.
The encryption key is created.
Enabling bucket encryption
To enable bucket encryption:
- In the management console, go to the bucket you created earlier.
- In the left pane, select Encryption.
- In the KMS key field, select the kuma-kms key.
- Click Save.
Bucket encryption is enabled.
Creating service accounts
To create service accounts (a separate account for the trail and a separate account for the bucket):
- Create the sa-kuma service account:
- In the management console, go to the example-folder folder.
- In the upper part of the scree, go to the Service accounts tab.
- Click Create service account and enter the name of the service account, for example, sa-kuma, making sure the name complies with the naming rules:
- length: 3 to 63 characters
- may contain lower-case letters of the Latin alphabet, numerals, and hyphens
- the first character must be a letter, the last character may not be a hyphen.
- Click Create.
- Create the sa-kuma-bucket service account:
- In the management console, go to the example-folder folder.
- In the upper part of the scree, go to the Service accounts tab.
- Click Create service account and enter the name of the service account, for example, sa-kuma-bucket, making sure the name complies with the naming rules:
- length: 3 to 63 characters
- may contain lower-case letters of the Latin alphabet, numerals, and hyphens
- the first character must be a letter, the last character may not be a hyphen.
- Click Create.
The service accounts are created.
Creating a static key
You will need the key ID and the private key when mounting the bucket. You can create a key using the management console or the CLI.
To create a key using the management console:
- In the management console, go to the example-folder folder.
- In the upper part of the screen, go to the Service accounts tab.
- Select the sa-kuma-bucket service account and click the row with its name.
- In the upper panel, click Create new key.
- Select Create static access key.
- Enter a description for the key and click Create.
- Save the ID and the secret key.
The static access key is created. The key value will become unavailable when you close the dialog.
To create a key using the CLI:
- Create an access key for the sa-kuma-bucket service account:
yc iam access-key create --service-account-name sa-kuma-bucketResult:
access_key:id: aje*******k2uservice_account_id: aje*******usmcreated_at: "2022-09-22T14:37:51Z"key_id: 0n8*******0YQsecret: JyT*******zMP1 - Save the key_id and the key from the 'secret' value. You will not be able to get the key value again.
The access key is created.
Assigning roles to service accounts
To assign the audit-trails.viewer, storage.uploader, and kms.keys.encrypterDecrypter roles to the sa-kuma service account:
- In the CLI, assign the audit-trails.viewer role to the folder:
yc resource-manager folder add-access-binding \--role audit-trails.viewer \--id <folder_id> \--service-account-id <service_account_id>Where:
--roleis the assigned role.--idis the ID of the 'example-folder' folder.--service-account-idis the ID of the sa-kuma service account.
- Assign the storage.uploader role to the folder with the bucket:
yc resource-manager folder add-access-binding \--role storage.uploader \--id <folder_id> \--service-account-id <service_account_id>Where:
--roleis the assigned role.--idis the ID of the 'example-folder' folder.--service-account-idis the ID of the sa-kuma service account.
- Assign the kms.keys.encrypterDecrypter role to the kuma-kms encryption key:
yc kms symmetric-key add-access-binding \--role kms.keys.encrypterDecrypter \--id <key_id> \--service-account-id <service_account_id>Where:
--roleis the assigned role.--idis the ID of the kuma-kms KMS key.--service-account-idis the ID of the sa-kuma service account.
To assign the storage.viewer and kms.keys.encrypterDecrypter roles to the sa-kuma-bucket service account:
- In the CLI, assign the storage.viewer role to the folder:
yc resource-manager folder add-access-binding \--id <folder_id> \--role storage.viewer \--service-account-id <service_account_id>Where:
--idis the ID of the 'example-folder' folder.--roleis the assigned role.--service-account-idis the ID of the sa-kuma-bucket service account.
- Assign the kms.keys.encrypterDecrypter role to the kuma-kms encryption key:
yc kms symmetric-key add-access-binding \--role kms.keys.encrypterDecrypter \--id <key_id> \--service-account-id <service_account_id>Where:
--roleis the assigned role.--idis the ID of the kuma-kms KMS key.--service-account-idis the ID of the sa-kuma-bucket service account.
Creating an audit trail
To create an audit trail:
- In the management console, go to the example-folder folder.
- Select the Audit Trails service.
- Click Create trail and specify a name for the trail you are creating, for example, kuma-trail.
- In the Destination section, specify the parameters of the destination object:
- Destination: Object Storage.
- Bucket: The name of the bucket, for example kumabucket.
- Object prefix: Optional parameter used in the full name of the audit log file.
Use a prefix if you store audit logs and third-party data in the same bucket. Do not use the same prefix for logs and other objects in the bucket because this may cause logs and third-party objects to overwrite each other.
- Encryption key: specify the kuma-kms encryption key that the bucket is encrypted with.
- In the Service account section, select sa-kuma.
- In the Collecting management events section, specify the settings for collecting management events audit logs:
- Collecting events: Select Enabled.
- Resource: Select Folder.
- Folder: Does not require filling, contains the name of the current folder.
- In the Collecting data events, in the Collecting events field, select Disabled.
- Click Create.
Configuring export of Yandex Cloud events
The bucket must be mounted on the server on which the KUMA collector will be installed.
To mount the bucket:
- On the server, create a directory for the 'kuma' user:
sudo mkdir /home/kuma - On the server, create a file with a static access key for the sa-kuma-bucket service account and grant appropriate access permissions to the 'kuma' user:
sudo bash -c 'echo <access_key_ID>:<secret_access_key> > /home/kuma/.passwd-s3fs'sudo chmod 600 /home/kuma/.passwd-s3fssudo chown -R kuma:kuma /home/kuma - Install the s3fs package:
sudo apt install s3fs - Create a directory where the bucket must be mounted and grant permissions to the kuma user:
sudo mkdir /var/log/yandex-cloud/sudo chown kuma:kuma /var/log/yandex-cloud/ - Mount the bucket:
sudo s3fs kumabucket /var/log/yandex-cloud -o passwd_file=/home/kuma/.passwd-s3fs -o url=https://storage.yandexcloud.net -o use_path_request_style -o uid=$(id -u kuma) -o gid=$(id -g kuma)You can configure the bucket to be mounted at operating system startup by adding a line to /etc/fstab, for example:
s3fs#kumabucket /var/log/yandex-cloud fuse _netdev,uid=<kuma_uid>,gid=<kuma_gid>,use_path_request_style,url=https://storage.yandexcloud.net,passwd_file=/home/kuma/.passwd-s3fs 0 0Where:
<kuma_uid> is the ID of the 'kuma' operating system user.
<kuma_gid> is the ID of the 'kuma' group of operating system users.
To find out the kuma_uid and kuma_gid, run the following command in the console:
id kuma - Verify that the bucket is mounted:
sudo ls /var/log/yandex-cloud/If everything is configured correctly, the command returns <audit_trail_id>, where <audit_trail_id> is the audit trail ID.
Export of Yandex Cloud events is configured. Events will be located in directories in .json files:
/var/log/yandex-cloud/{audit_trail_id}/{year}/{month}/{day}/*.json
Page top
Configuring receipt of Microsoft 365 events
You can configure the receipt of events from the Microsoft 365 (Office 365) cloud solution in KUMA.
Configuring event receiving consists of the following steps:
- Configuring access to Office 365 management APIshttps://learn.microsoft.com/en-us/office/office-365-management-api/get-started-with-office-365-management-apisusing standard Microsoft methods
To receive events in KUMA, grant the necessary set of API permissions:
Microsoft.Graph
Directory.Read.All
Office 365 management API
ActivityFeed.Read
ActivityFeed.Read.Dlp
- Creating a KUMA collector
To receive Microsoft 365 events, create a collector with the following parameters:
- At the Transport step, specify the office365 connector type.
- At the Parsing events step, specify the [OOTB] Microsoft Office 365 json normalizer.
- Installing a collector in a KUMA network infrastructure
- Verifying receipt of Windows Microsoft 365 in the KUMA collector
To verify that the Microsoft 365 event source server is configured correctly, you can search for related events.
Configuring receipt of the Kontinent encryption system events
The KUMA distribution kit includes the kuma-kont utility, which consists of an executable file and a configuration file. Supported operating systems include Astra Linux, Ubuntu 22.04 LTS, and RED OS 7.3.4 and 8. This utility allows lets you connect to the MSSQL database, receive events of the Kontinent encryption system, and send data to the KUMA collector in JSON format. Data import is supported for Kontinent 3.9.2.
Configuring the retrieval of Kontinent events from an MSSQL database and sending them to the KUMA collector involves the following steps:
- Preparing to receive Kontinent events.
At this step, you need to create a KUMA collector that will receive events, and also create a user in the MSSQL database.
- Configuring the kuma-kont utility.
At this step, you need to create the configuration file of the utility and the service of the utility.
- Starting the kuma-kont utility.
After activation, the utility starts exporting events from the MSSQL database and sending them to the KUMA collector. It keeps a log in the kuma-kont.log file.
Preparing to receive Kontinent events
- Creating a KUMA collector.
- Creating a KUMA collector for Kontinent 3.9 events.
To receive audit events of the Kontinent 3.9 system using the Collector Installation Wizard, at the Event parsing step, select the [OOTB] SecurityCode Continent 3.9 json normalizer. On the Transport tab, you also need to specify the port and protocol that are specified in the kuma-kont-config.yaml configuration file in the KUMA Collector group of settings.
- Installing a collector in the KUMA network infrastructure.
- Creating a KUMA collector for Kontinent 3.9 events.
- Creating an account in the MS SQL DBMS.
Create an account in the database with the minimum necessary rights to connect and read data from the following tables: ALERTLOG, SERVERACCESSLOG, SYSTEMLOG, PACKETLOG, FILTERS.
- Ensuring network connectivity.
You must ensure network connectivity between the server on which the utility is running and the database server of the Kontinent system, as well as between the server on which the utility is running and the KUMA collector server.
Configuring the kuma-kont utility
Configuring the kuma-kont utility involves the following steps:
- Creating the kuma-kont-config.yaml configuration file.
- Creating the kuma-kont service.
Creating the kuma-kont-config.yaml configuration file
To create the kuma-kont-config.yaml configuration file:
- Go to the KUMA installer directory by executing the following command:
cd kuma-ansible-installer/roles/kuma/files - Extract the kuma-kont.tar archive:
tar -xvf kuma-kont.tar - Go to the directory of the utility:
cd kuma-kont - Copy the kuma-kont-config-template.yaml template to create a configuration file named kuma-kont-config.yaml:
cp kuma-kont-config-template.yaml kuma-kont-config.yaml - Change read permissions for the configuration file:
sudo chown <user name>:<group> kuma-kont-config.yamlsudo chmod 600 kuma-kont-config.yamlReplace <user name> with the operating system user name that the service will use.
- Edit the settings in the kuma-kont-config.yaml configuration file.
Specify the values of the following settings:
- General settings: state_file, log_file_path.
- Kontinent Database: name, user, password, host, port.
- KUMA Collector: address, port, protocol.
An example of configuration is given in the kuma-kont-config-template.yaml file.
- Save the changes to the file.
The configuration file is created.
Creating the service
To create the kuma-kont service:
- Change the execution permissions for the executable file:
sudo chown <user name>:<group> <path to executable file>sudo chmod 700 <path to executable file> - Create the /etc/systemd/system/kuma-kont.service file with the following contents:
[Unit]Description=Connector Kontinent 3.9After=network.target[Service]User=<user name>ExecStart=<path to executable file> --config <path to configuration file>Restart=alwaysRestartSec=10[Install]WantedBy=multi-user.targetReplace <user name> with the user name of the operating system user that the service will use.
- Specify the path to the executable file.
Specify the path to the kuma-kont executable file in the ExecStart field.
For example, if the kuma-kont file is located in the /usr/bin/ directory, leave the default value.
- Specify the path to the configuration file.
Specify the path to the kuma-kont-config.yaml configuration file in the ExecStart field. For example, if the kuma-kont-config.yaml file is located in the /path/to/ directory, specify that path.
Example kuma-kont.service file
[Unit]Description=Continent ServiceAfter=network.target[Service]User=user-exampleExecStart=./usr/bin/kuma-kont --config /path/to/kuma-kont-config.yamlRestart=alwaysRestartSec=10[Install]WantedBy=multi-user.target - Load the systemd configuration:
sudo systemctl daemon-reload - Make the service run at startup:
sudo systemctl enable kuma-kont
The kuma-kont utility will be started as a service at system startup.
Page top
Starting and managing the kuma-kont service
To start the utility service, run the following command:
sudo systemctl start kuma-kont
The collection of events from the MSSQL database begins and the events are sent to the KUMA collector.
The utility service can be controlled using the following commands:
- Start the kuma-kont service:
sudo systemctl start kuma-kont - Stop the kuma-kont service:
sudo systemctl stop kuma-kont - Restart the kuma-kont service:
sudo systemctl restart kuma-kont
You can also send events using the kuma-kont utility running as an application. To start sending events to the KUMA collector, you need to run the following command while in the directory with the executable file:
./kuma-kont --config <path to the kuma-kont-config.yaml file>
Behavior when connection is lost
Connection to the MSSQL database.
If the connection to the MSSQL database is lost, the utility tries to reconnect to it every n seconds (where n is equal to the value of the poll_interval setting in the configuration file) until the connection is restored.
Connection to the KUMA collector
If the TCP protocol is used to send events, when the connection to the KUMA collector is lost, the utility also attempts to restore it. The interval between connection attempts increases until it reaches one hour, and subsequent reconnection attempts are made once per hour.
Known limitations
The event from the AlertLog table with AL_CATEGORY=5 is not fully decoded.
Settings in the kuma-kont-config.yaml configuration file
The table lists the settings that you can specify in the kuma-kont-config.yaml file.
Settings in the kuma-kont-config.yaml configuration file
Setting |
Description |
|---|---|
|
Optional setting in the General settings group. Used when debug level log output is required. If false, only start and stop messages are included, as well as errors that occurred during the sending process. Available values:
Default setting: false. |
|
An optional setting in the General settings group. This setting determines whether the utility reconnects to the database to make each request. Available values:
Default setting: false. |
|
Required setting in the General settings group. Absolute path to the JSON file in which the state of the processed logs is saved. The file is created automatically at this path. Make sure the user has sufficient permissions to write to this directory. Example: /home/user/kuma-kont/state.json |
|
Required setting in the General settings group. Absolute path to the log file for recording connector activity. The file is created automatically at this path. Make sure the user has sufficient permissions to write to this directory. Example: /home/user/kuma-kont/kuma-kont.log |
|
An optional setting in the General settings group. Database polling interval. The default value is 10 seconds. For high EPS, we recommend a value less than 15 seconds. |
|
Required setting in the Kontinent Database group. Name of the database in which Kontinent logs are received. |
|
Required setting in the Kontinent Database group. Name of the database user. |
|
Required setting in the Kontinent Database group. Password of the database user. |
|
Required setting in the Kontinent Database group. URL of the database server. |
|
Required setting in the Kontinent Database group. Port of the database server. Make sure it is accessible from the server where the utility is installed. |
|
Optional setting in the Kontinent Database group. Limit on the number of events that can be downloaded from the database as part of one poll. By default, 100,000 events per database poll. If EPS is high, we recommend a value equal or greater than this. |
|
Optional setting in the Last Id group. Specifies the event of the AlertLog type from which you want to start sending events to the KUMA collector. Only works on first run or when the state file does not exit. The default value is 0. |
|
Optional setting in the Last Id group. Specifies the event of the PacketLog type from which you want to start sending events to the KUMA collector. Only works on first run or when the state file does not exit. The default value is 0. |
|
Optional setting in the Last Id group. Specifies the event of the ServerAccessLog type from which you want to start sending events to the KUMA collector. Only works on first run or when the state file does not exit. The default value is 0. |
|
Optional setting in the Last Id group. Specifies the event of the SystemLog type from which you want to start sending events to the KUMA collector. Only works on first run or when the state file does not exit. The default value is 0. |
|
Required setting in the KUMA Collector group. Fully qualified domain name (FQDN) or IP address of the server where the KUMA collector is installed. |
|
Required setting in the KUMA Collector group. Port of the KUMA collector. |
|
Required setting in the KUMA Collector group. Data transfer protocol used by the KUMA collector. If the udp protocol is used, events are not resent if connection to the KUMA collector is lost. Available values:
|
Configuring receipt of VK WorkSpace Mail events
KUMA allows monitoring VK WorkSpace Mail 1.23 events received in syslog format.
Configuring event receiving consists of the following steps:
- Configuring the export of VK WorkSpace Mail events
- Creating a KUMA collector for VK WorkSpace Mail events.
To receive VK WorkSpace Mail audit events using the Collector Installation Wizard, select the [OOTB] VK WorkSpace Mail syslog normalizer at the Event parsing step. Also, on the Transport tab, you need to specify the port and protocol in accordance with steps 2.2, 2.3 of the Configuring the export of VK WorkSpace Mail events instructions.
- Installing a collector in the KUMA network infrastructure.
- Verifying receipt of VK WorkSpace Mail events in the KUMA collector.
You can verify that the VK WorkSpace Mail event source server is correctly configured in the Searching for related events section of the KUMA web interface.
Configuring the export of VK WorkSpace Mail events
To configure the export of events to KUMA:
- Go to the Settings for duplicating user actions to external storage menu.
- Select the Duplicate user actions to syslog check box.
- In the Syslog server address field, enter the IP address or FQDN of the KUMA collector.
- In the Syslog server port field, specify the port that the KUMA collector is listening on.
- In Syslog protocol, TCP or UDP field, select the communication protocol.
- In the Syslog data ID field, specify bein.
The export of VK WorkSpace Mail events is configured.
Page top
Source status
In KUMA, you can monitor the state of the sources of data received by collectors. There can be multiple sources of events on one server, and data from multiple sources can be received by one collector.
You can configure automatic identification of event sources using one of the following sets of fields:
- Custom set of fields. You can specify from 1 to 9 fields in the order you want. TenantID does not need to be specified separately, it is determined automatically.
- Apply default mapping — DeviceProduct, DeviceHostName, DeviceAddress, DeviceProcessName. The field order cannot be changed.
Sources are identified if the following fields in events are not empty: the DeviceProduct field, the DeviceAddress and/or DeviceHostname field, and the TenantID field (you do not need to specify the TenantID field, it is determined automatically). The DeviceProcessName field can be empty. If the DeviceProcessName field is not empty, and the other required fields are filled, a new source is identified.
Identification of event sources depending on non-empty event fields
DeviceProduct
DeviceHostName
DeviceAddress
DeviceProcessName
TenantID (determined automatically)
+
+
+
Source 1 identified
+
+
+
Source 2 identified
+
+
+
+
Source 3 identified
+
+
+
+
Source 4 identified
+
+
+
+
Source 5 identified
+
+
+
+
+
Source 6 identified
+
+
+
Source not identified
+
+
+
Source not identified
+
+
+
Source not identified
+
+
+
Source not identified
Only one set of fields is applied for the entire installation. When upgrading to a new KUMA version, the default set of fields is applied. Only a user with the General Administrator role can configure the set of fields for identifying an event source. After you save changes to the set of fields, previously identified event sources are deleted from the KUMA web interface and from the database. If necessary, you can revert to using a set of fields to determine default event sources. For the edited settings to take effect and KUMA to begin identifying sources based on the new settings, you must restart the collectors.
To identify event sources:
- In the KUMA web interface, go to the Source status section.
- This opens the Source status window; in that window, click the wrench button.
- This opens the Settings of event source detection window; in that window, in the Grouping fields for source detection drop-down list, select the event fields by which you want to identify event sources.
You can specify from 1 to 9 fields in the order you want. In a custom configuration, KUMA identifies sources in which the TenantID field is filled (you do not need to specify this field separately, it is determined automatically) and at least one field from the Identical fields for source identification is filled. For numeric fields, 0 is considered an empty value. If a single numeric field is selected for source identification, and the value of the numeric field is 0, the source is not detected.
After you save the modified set of fields, an audit event is created and all previously identified sources are deleted from the KUMA web interface and from the database; assigned policies are disabled.
- If you want to go back to the list of fields for identifying the default event source, click Apply default mapping. The default field order cannot be changed. If you manually specify the fields in the wrong order, an error is displayed and the save settings button becomes unavailable. The correct default sequence of fields is DeviceProduct, DeviceHostName, DeviceAddress, DeviceProcessName. Minimum configuration for identifying event sources using the default set of events: non-empty values in the DeviceProduct field, the DeviceAddress and/or DeviceHostName field, and the TenantID field (TenantID is determined automatically).
- Click Save.
- Restart the collectors to apply the changes and begin identifying event sources by the specified list of fields.
Source identification is configured.
To view events that are associated with an event source:
- In the KUMA web interface, go to the Source status section.
- This opens the List of event sources window; in that window, select your event source in the list, and in the Name column, expand the menu for the selected event source, click the Events for <number> days button.
KUMA takes you to the Events section, where you can view a list of events for the selected source over the last 5 minutes. Values of fields configured in the event source identification settings are automatically specified in the query. If necessary, in the Events section, you can change the time period in the query and click Run query again to view the queried data for the specified time period.
Limitations
- In a configuration with the default field set, KUMA registers the event source only if the raw event contains the DeviceProduct field and the DeviceAddress and/or DeviceHostName fields.
If the raw event does not contain the DeviceProduct field and the DeviceAddress and/or DeviceHostName fields, you can:
- Configure enrichment in the normalizer: on the Enrichment tab of the normalizer, select the Event data type, specify the Source field setting, and for the Target field, select the DeviceProduct + DeviceAddress and/or DeviceHostName and click OK.
- Use an enrichment rule: select the Event data source type, specify the Source field setting, and as the Target field, select DeviceProduct + DeviceAddress and/or DeviceHostName, then click Create. The created enrichment rule must be linked to the collector at the Event enrichment step.
KUMA will perform enrichment and register the event source.
- If KUMA receives events with identical values of the fields that identify the source, KUMA registers different sources if the following conditions are satisfied:
- The values of the required fields are identical, but different tenants are determined for the events.
- The values of the required fields are identical, but one of the events has an optional DeviceProcessName field specified.
- The values of the required fields are identical, but the data in these fields have different character case.
If you want KUMA to log such events under the same source, you can further configure the fields in the normalizer.
Lists of sources are generated in collectors, merged in the KUMA Core, and displayed in the application web interface under Source status on the List of event sources tab. Data is updated every minute.
The rate and number of incoming events serve as an important indicator of the state of the observed system. You can configure monitoring policies such that changes are tracked automatically and notifications are automatically created when indicators reach specific boundary values. Monitoring policies are displayed in the KUMA web interface under Source status on the Monitoring policies tab.
When monitoring policies are triggered, monitoring events are created and include data about the source of events.
List of event sources
Sources of events are displayed in the table under Source status → List of event sources. One page can display up to 250 sources. You can sort the table by clicking the column heading of the relevant parameter and selecting Ascending or Descending.
You can use the Search field to search for event sources. The search is performed using regular expressions (RE2). You can also filter the table by the Status or Monitoring policy columns by clicking the heading of the relevant column and selecting the values that you want to display.
If necessary, you can configure the interval for updating data in the table. Available update periods: 1 minute, 5 minutes, 15 minutes, 30 minutes, 1 hour. The default value is No refresh. You may need to configure the update period to track changes made to the list of sources.
Viewing information about event sources
In the Source status → List of event sources section, information about event sources is displayed in the following columns:
- Status—status of the event source:
- Green—events are being received within the limits of the assigned monitoring policies.
- Red—the frequency or number of incoming events go beyond the boundaries defined in at least one assigned monitoring policy.
- Gray—monitoring policies have not been assigned to the source of events.
If the status is red, an event of the Monitoring type generated. The monitoring event is generated in the tenant that owns the event source and is sent to the storage of the Main tenant (the storage must already be deployed in the Main tenant). If you have access to the tenant of the event source and do not have access to the Main tenant, you can still search for monitoring events in the storage of the Main tenant; the monitoring events of the tenants available to you will be displayed for you. You can also configure notifications to be sent to an arbitrary email address.
The table can be filtered by status.
- Name—name of the event source. The name is generated automatically from the values of fields configured in the event source identification settings.
You can rename an event source in the table of event sources by hovering over its name and clicking the pencil
 icon. The name can contain no more than 128 Unicode characters.
 - Host name or IP address—name or IP address of the host from which the events originate if the DeviceHostName or DeviceAddress fields are specified in the event source identification settings.
- Monitoring policy—list of the monitoring policies assigned to the event source.
If you want to filter the list of event sources by applied monitoring policies, click the name of this column and select one or more monitoring policies. If necessary, you can find policies in the list using the Search field.
You can view information about all monitoring policies assigned to an event source by clicking the row of the source. This opens a window that displays the settings of monitoring policies, as well as the status of the source according to each policy. If several monitoring policies are assigned to the source, the red status in the table of sources in this window lets you identify the policy that was triggered. You can also see which policies are enabled and which are disabled, and when the disabled policies will be enabled again.
- Stream—frequency at which events are received from the event source. If only monitoring policies of the byCount type or monitoring policies of different types are assigned to the source, this value is displayed as the number of events. If only monitoring policies of the byEPS type are assigned to the source, or no policies are assigned, the value is displayed as the number of events per second.
- Tenant—the tenant that owns the events received from the event source.
Managing event sources
You can select one or more event sources by selecting the check boxes in the first column of the table. You can select multiple event sources at once for performing group operations by selecting the check box in the heading of the first column and selecting Select all or Select all in page. The Select all in page option applies only to event sources displayed in the list: if only 500 out of 1500 sources are displayed in the list, then group actions to download, enable or disable policies, or delete event sources are applied only to the selected 500 sources. If you want to perform an action on all sources in the table, select Select all.
If you select sources of events, the following buttons become available:
- The Enable policy button enables the monitoring policy for event sources. You must select policies in the displayed window to apply them.
- You can use the Disable policy to disable the monitoring policy for event sources. When disabling a policy, you must specify if want to disable the policy temporarily or forever.
- The Update policy button applies the monitoring policies that are enabled for the event sources, or change the monitoring policies that are already assigned. When a policy is updated, a task is started in the task manager.
This button becomes available after you change the monitoring policies assigned to event sources.
- You can click the Remove button to remove an event source from the table. The statistics on this source will also be removed. If a collector continues to receive data from the source, the event source will re-appear in the table but its old statistics will not be taken into account.
If you want to delete all event sources, but some time has passed since the table was last refreshed, sources added during this time may not be displayed in the table, but they will be deleted regardless.
If you delete more than 100,000 event sources to which a filter or search was applied, only the first 100,000 event sources will be deleted. You can select all filtered event sources again and delete them, and then repeat this until you have deleted all event sources that you intended to delete. You can delete over 100,000 event sources if no filters or searches are applied to them by selecting sources using the Select all button.
- You can click CSV to download the data of the selected event sources to a CSV file.
The
Streamfield is downloaded only if a monitoring policy has been assigned to the event source; in that case, the unit of measurement taken from the policy is specified in the downloaded file. If no policy is assigned an emptyStreamfield is the expected behavior. - You can click the Chart button to plot a chart of incoming events for the last seven days for the selected event sources. You can select up to five event sources.
.
Downloading event source information to a CSV file
You can download information about one or more event sources and the monitoring policies applied to them to a CSV file in UTF-8 encoding. If multiple monitoring policies are applied to a source, in the file for that source, each monitoring policy and its parameters starts on a new line. For each monitoring policy applied to a source, the following parameters are exported to the file: Status, Name, Monitoring policy, Lower limit, Upper limit, Stream, Tenant.
To download event source information to a CSV file:
- In the KUMA web console, in the Source status → List of event sources section, select one or more event sources in the table by selecting the check boxes in the first column next to the relevant sources.
In the lower left part of the table, you can find the number of selected sources and the total number of sources in the table. You can select up to 150,000 event sources.
You can select several event sources by clicking the check box in the heading of the first column selecting one of the following options:
- Select all to select all event sources on all pages of the table. If you have used search to filter sources, this will select all sources that match the search query.
- Select all in page to select all event sources on the currently displayed page. If you have used search to filter sources, this will select all sources on the currently displayed page that match the search query.
- Click the CSV button in the upper part of the table.
Depending on the size of your browser window, the CSV button may be found in the additional menu that you can open by clicking on the icon with the three dots
 .
.A new event source export task is created in the task manager.
- Go to the Task manager section and find the created task.
When the file is ready, the Status column of the task displays the Completed status.
- Click the task type name and select Download from the drop-down list.
The CSV file with event source information is downloaded in accordance with your browser settings. The default file name is event-source-list.csv.
Viewing the dynamics of incoming events
You can examine the dynamics of events received from a source over the last seven days, taking into account the applied monitoring policies, in one of the following ways:
- View the graph for an individual event source.
- Plot a chart based on graphs for several (up to five) sources.
You can view the graph for a single event source in the KUMA web console in the Source status → List of event sources section by clicking the arrow icon ![]() in the row of the relevant event source. The graph of incoming events is displayed under the row of the source.
in the row of the relevant event source. The graph of incoming events is displayed under the row of the source.
The data in the graph is displayed as follows:
- The data is displayed for the days on which the events were received. The maximum period is seven days.
In the upper left corner above the graph, the number of days is displayed, and in the upper right corner, the data display period is displayed. You can click the Events for <number> days button to go to the Events section and view the list of events for the selected source.
- The X-axis represents days, and the Y-axis represents the frequency of events (EPS).
- The lines represent the average, maximum, and minimum number of events for every 15-minute period during the last seven days.
If you want to view the number of events at a specific time, hover over a point on the graph. A tooltip is displayed with the average, maximum, and minimum event count at a specific date and time.
You can also plot a chart of incoming events based on graphs for several event sources, for example, if you need to compare the activity of event sources of the same type that should behave in a similar way, but in fact behave in different ways.
To plot a chart based on graphs for multiple event sources:
- In the KUMA web console, in the Source status → List of event sources section, select one or more event sources in the table by selecting the check boxes in the first column next to the relevant sources.
You can plot a chart for up to 5 event sources at the same time.
- Click the Chart button in the upper part of the table.
Depending on the size of your browser window, the Chart button may be found in the additional menu that you can open by clicking on the icon with the three dots
.The displayed Chart pane contains a chart of incoming events for all selected sources as well as a table that displays the current number of events, the maximum number of events, and the average number of events for each source, calculated based on the data from the chart. You can compare how the data for the selected sources relates to each other over time.
The data in the chart is displayed as follows:
- The data is displayed for the days on which the events were received. The maximum period is seven days.
In the upper right corner above the chart, the data display period is displayed.
- The X-axis represents days, and the Y-axis represents the frequency of events (EPS).
- The lines in the chart represent the average number of incoming events from the selected event sources for every 15-minute interval during the last seven days.
You can hover over the chart to view the average number of events for each source at a specific time.
- The data is displayed for the days on which the events were received. The maximum period is seven days.
- If necessary, clear the check boxes in the table below the chart next to the event sources that you want to hide in the chart.
- If you want to display the diagram in more detail, click the two arrows
 icon to open the panel in full screen mode and zoom in on the diagram.
Monitoring policies
The rate and number of incoming events serve as an important indicator of the state of the system. For example, you can detect when there are too many events, too few, or none at all. Monitoring policies are designed to detect such situations. In a policy, you can specify a lower threshold, an optional upper threshold, and the way the events are counted: by frequency or by total number.
The policy must be applied to the event source. You can apply one or more monitoring policies to a source. After applying the policy, you can monitor the status of the source on the List of event sources tab.
Policies for monitoring the sources of events are displayed in the table under Source status → Monitoring policies. You can sort the table by clicking the column header of the relevant setting. The maximum size of the policy list is not limited.
In the Sources column, you can click the Show button to view all event sources to which the policy is applied. When you click this button, you are taken to the List of event sources section, and the table of sources is filtered by the selected policy.
Algorithm of monitoring policies
Monitoring policies are applied to an event source in accordance with the following algorithm:
- The event stream is counted at the collector.
- The KUMA Core server gets information about the stream from the collectors every 15 seconds.
- The obtained data is stored on the KUMA Core server in the Victoria Metrics time series database, and the data storage depth on the KUMA Core server is 15 days.
- An inventory of event sources is taken once per minute.
- The stream is counted separately for each event source in accordance with the following rules:
- If a monitoring policy is applied to the event source, the displayed maximum number of events is calculated in accordance with the currently applied monitoring policies for the time interval specified in the policy.
Depending on the policy type, the number of the event stream is counted as the number of events (for the byCount policy type) or as the number events per second (EPS, for the byEPS policy type). You can look up how the stream is counted for the applied policy in the Stream column on the List of event sources page.
- If no monitoring policy is applied to the event source, the number for the event stream corresponds to the last value.
- If a monitoring policy is applied to the event source, the displayed maximum number of events is calculated in accordance with the currently applied monitoring policies for the time interval specified in the policy.
- Once a minute, the application checks if any monitoring policies exist that must be applied to event sources or stopped according to the monitoring policy schedule.
- Once a minute, the stream of events is checked for compliance with policy settings.
If the event stream from the source crosses the thresholds specified in the monitoring policy, information about this is recorded in the following way:
- A notification about a monitoring policy getting triggered is sent to the email addresses specified in the policy. For each policy, you can also configure a notification template.
- A stream monitoring informational event of type
5(Type=5) is generated. The fields of the event are described in the table below.Fields of the monitoring event
Event field name
Field value
ID
Unique ID of the event.
Timestamp
Event time.
Type
Type of the audit event. For the audit event, the value is
5(monitoring).Name
Name of the monitoring policy.
DeviceProduct
KUMADeviceCustomString1
The value from the
valuefield in the notification. Displays the value of the metric for which the notification was sent.
The generated monitoring event is sent to the following resources:
- All storages of the Main tenant
- All correlators of the Main tenant
- All correlators of the tenant in which the event source is located
Adding a monitoring policy
To add a new monitoring policy:
- In the KUMA web interface, under Source status → Monitoring policies, click Add policy and configure the monitoring policy in the displayed window:
- In the Policy name field, enter a name for the policy you are creating. The name must contain from 1 to 128 Unicode characters and must be unique within the selected tenant.
We recommend choosing a name that reflects the configured schedule of the monitoring policy.
- In the Tenant drop-down list, select the tenant that will own the policy. Your tenant selection determines the specific sources of events that can covered by the monitoring policy.
- In the Type field, select one of the following monitoring policy types:
- by count—by the number of events over a certain period of time.
- by EPS—by the number of events per second (EPS) over a certain period of time. The average value over the entire period is calculated. You can additionally track spikes during specific periods.
- In the Count interval field, specify the period during which the monitoring policy must take into account the data from the monitoring source. You can use the drop-down list on the right to select a value in minutes, hours, or days. The maximum value is 14 days.
- If you selected the by EPS policy type, in the Control interval, minutes field, specify the control time interval (in minutes) within which the number of events must cross the threshold for the monitoring policy to trigger:
- If, during this time period, all checks (performed once per minute) find that the stream is crossing the threshold, the monitoring policy is triggered.
- If, during this time period, one of the checks (performed once per minute) finds that the stream is within the thresholds, the monitoring policy is not triggered, and the count of check results is reset.
If you do not specify the frequency of measurement, the monitoring policy is triggered immediately after the stream is found to cross the threshold.
- In the Lower limit and Upper limit fields, define the boundaries representing normal behavior. Deviations outside of these boundaries will trigger the monitoring policy, create an alert, and forward notifications.
The Lower limit setting is required.
- In the Evaluation interval field, specify the frequency with which the VMalert service will query VictoriaMetrics for policy data while the policy is being applied to the event source. You can use the drop-down list on the right to select a value in minutes, hours, or days. The default interval is 5 minutes.
When specifying the evaluation interval, keep in mind the policy schedule. For example, if you configured the policy to be applied once every few hours, we do not recommend configuring a short interval and causing excessive load on VictoriaMetrics.
- If necessary, in the Send notifications field, specify the email addresses to which notifications about the activation of the KUMA monitoring policy must be sent. To add an address, enter it in the field and press Enter or click Add. You can specify multiple email addresses.
To forward notifications, you must configure a connection to the SMTP server.
- In the Notification template drop-down list, select the template that you want to use for notifications. If necessary, click the Create new button to start creating a new notification template.
By default, the basic notification template is selected. You can reset the template selection and switch to the base template by clicking the X icon.
- In the Schedule section, configure how often you want to apply the monitoring policy to event sources. By default, the policy is applied every week, every day, from 00:00 to 23:59. To configure the monitoring policy schedule, do some of the following:
- If you want to apply the monitoring policy weekly on specific days of the week:
- Enable the Configure schedule by days of the week toggle switch.
- In the Days of the week drop-down list, select the days of the week on which you want the policy to be applied to the source.
If you want to clear the selection, click the X icon.
- In the Time field, specify the start and end time of the policy, with minute precision.
The policy applicability interval is inclusive of its bounds; for example, if the end time is set to 23:59, the policy will be applied until 23:59:59.999. The default interval is 00:00 to 23:59. The start time must be earlier than the end time.
- If you want to add another period, click the Add period button and repeat steps 'b' and 'c'.
You can add any number of periods.
- If you want to apply the monitoring policy weekly on specific calendar dates:
- Enable the Configure schedule by days of the month toggle switch.
- Click the Days of the month field and use the calendar to select the dates on which you want to apply the policy to the source. You can select a period of several days or an individual day. The start date of the period must be earlier than the end date of the period.
The dates are configured without a year value, so the policy will be applied annually on the specified days until you delete this period. If you want to clear the selection, click the X icon.
- In the Time field, specify the start and end time of the policy, with minute precision.
The policy applicability interval is inclusive of its bounds; for example, if the end time is set to 23:59, the policy will be applied until 23:59:59.999. The default interval is 00:00 to 23:59. The start time must be earlier than the end time.
- If you want to add another period, click the Add period button and repeat steps 'b' and 'c'.
You can add any number of periods.
If you applied a schedule by day of the week and by day of the month at the same time, the day-of-the-month policy is applied first.
- If you want to apply the monitoring policy weekly on specific days of the week:
- Click Add.
The monitoring policy will be added.
Editing monitoring policies
The Source status → Monitoring policies section displays the added monitoring policies and their settings that you specified when creating the policy. You can click a policy to display a sidebar with all of its settings. If necessary, you can edit the policy settings in this sidebar.
If a monitoring policy is applied to an event source, if you edit certain policy settings, you may need to update the policy to apply the changes. Every 30 minutes, KUMA checks if any monitoring policies require updating, and if that is the case, it automatically runs a task to update those monitoring policies. You can also run the update task manually by clicking the Update policy button at the top of the table. One task updates all policies that need updating.
The Update policy button becomes active only if some monitoring policies need updating. Information about whether the policy needs updating is displayed in the table of monitoring policies in the Policy update status as one of the following statuses:
- Update required if one of the following monitoring policy settings was edited, but the changes have not been applied to event sources:
- Policy name
- Type.
- Lower limit
- Upper limit
- Count interval
- Control interval
- Evaluation interval
- Updated in any of the following cases:
- After editing the policy, the task to apply the policy was started, and the changes were applied to event sources.
- You have edited one of the following policy settings, which does not require starting the update task:
- Send notifications
- Notification template
- Schedule
In this case, the edited policy settings are applied to event sources after a minute. Changes of the Notification template setting are applied instantly.
- The modified monitoring policy is not applied to event sources.
The date and time when the policy was last applied to event sources is displayed in the Policy last applied column.
While the policy update task is running, the Update policy button is unavailable for all users. If another user has edited the settings of the policy that necessitate an update, the Update policy button becomes active for you only after you refresh the page or edit the policy or an event source.
Applying monitoring policies
To apply monitoring policies to event sources:
- In the KUMA web console, in the Source status → List of event sources section, select one or more event sources in the table by selecting the check boxes in the first column next to the relevant sources. You can select several event sources by clicking the check box in the heading of the first column and selecting one of the following options:
- Select all to select all event sources on all pages of the table. If you have used search to filter sources, this will select all sources that match the search query.
- Select all in page to select all event sources that are loaded on the currently displayed page. If you have used search to filter sources, this will select all sources on the currently displayed page that match the search query.
In the lower left part of the table, you can find the number of selected sources and the total number of sources in the table.
After you select the event sources to which you want to apply the monitoring policy, the Enable policy button becomes available on the toolbar.
- Click Apply policy.
- This opens the Apply policy window; in that window, select one or more monitoring policies that you want to apply to the selected event sources. The table lists only monitoring policies that you can assign to the selected sources: policies that belong to the same tenant or to the Shared tenant, if you have access to it. If no shared policies exist for the selected event sources and you do not have access to the Shared tenant, the policy table is empty.
To select all available policies, you can select the check box in the heading of the first column. You can also use context search by policy name or sort the policies by clicking the heading of the column by which you want to sort the table and selecting Ascending or Descending.
Search and sorting is not available for the Sources, Schedule, Policy update status, Policy last applied columns.
- Click Apply.
- In the table of sources, click Update policy to apply the changes to event sources.
The monitoring policies are applied to the selected event sources; the status of these sources changes to green. The names of the policies applied to the sources are displayed in the Monitoring policy column. A message is also displayed indicating the number of sources to which the policies have been applied. If the monitoring policy is triggered for an event source, the new status of that source is displayed after you manually refresh the page or it is refreshed automatically. We recommend configuring an automatic data refresh period to keep track of changes in the list of sources.
If you have selected more than 100,000 event sources and applied one or more policies to them, these policies are applied only to the first 100,000 sources to which these policies have not yet been applied. If you need to apply policies to the remaining sources, you can do one of the following:
- Select all sources again and apply the policies to them.
- Filter the table of sources by any parameter so that the table displays less than 100,000 sources, then apply the policies to them.
Repeat the action until the policies have been applied to all the sources that you need.
Disabling monitoring policies
To disable monitoring policies for event sources:
- In the KUMA web console, in the Source status → List of event sources section, select one or more event sources in the table by selecting the check boxes in the first column next to the relevant sources.
In the lower left part of the table, you can find the number of selected sources and the total number of sources in the table. After you select the event sources to which monitoring policies are applied in the list, the Disable policy button becomes available on the toolbar.
You can select several event sources by clicking the check box in the heading of the first column and selecting one of the following options:
- Select all to select all event sources on all pages of the table. If you have used search to filter sources, this will select all sources that match the search query.
- Select all in page to select all event sources that are loaded on the currently displayed page. If you have used search to filter sources, this will select all sources on the currently displayed page that match the search query.
- Click Disable policy.
- This opens the Disable policy window; in that window, select one or more monitoring policies that you want to disable for the selected event sources. The table lists all monitoring policies applied to at least one of the selected event sources.
To select all available policies, you can select the check box in the heading of the first column. You can also use context search or sort the policies by clicking the heading of the column by which you want to sort the table and selecting Ascending or Descending.
Search and sorting is not available for the Sources, Schedule, Policy update status, Policy last applied columns.
- In the settings section above the policy table, do one of the following:
- If you want to temporarily suspend the policies, select For the specified time and specify the time in minutes, hours, or days after which the selected policies will be reapplied to event sources. Maximum values:
- For days: 30
- For hours: 743
- For minutes: 44579
- If you want to permanently disable the selected policies for event sources, select Until manually enabled.
The default selection is For the specified time, and the value is set to 5 minutes.
- If you want to temporarily suspend the policies, select For the specified time and specify the time in minutes, hours, or days after which the selected policies will be reapplied to event sources. Maximum values:
- Click Disable.
- In the table of sources, click Update policy to apply the changes to event sources.
The monitoring policies are disabled for selected event sources or suspended for the specified time. The status of these sources in the table changes to gray. A message is displayed indicating the number of sources for which the policies have been disabled.
If you have selected more than 100,000 event sources and disabled one or more policies for them, these policies are disabled only for the first 100,000 sources to which these policies are applied. If you need to disable policies for the remaining sources, you can do one of the following:
- Select all sources again and disable the policies for them.
- Filter the table of sources by any parameter so that the table displays less than 100,000 sources, then disable the policies for them.
Repeat the action until the policies have been disabled for all the sources that you need.
Adding a new monitoring policy based on an existing policy
To create a new monitoring policy based on an existing policy:
- In the KUMA web interface, in the Source status → Monitoring policies section, select the monitoring policy that you want to base the new policy on.
If necessary, you can find monitoring policies in the list using the Search field. The search will be carried out in the following columns: Name, Tenant, Type, Schedule (name of the day and time).
- Click Duplicate policy.
- This opens the Add policy window, in which you can edit policy settings.
By default,
- copyis appended to the name of the new policy. The rest of the settings are the same as in the policy that you are duplicating. - Click the Add button to create the new policy.
The monitoring policy is created based on an existing policy.
Deleting monitoring policies
To delete a monitoring policy:
- In the KUMA web interface, in the Source status → Monitoring policies section, select one or more monitoring policies that you want to delete.
If necessary, you can find monitoring policies in the list using the Search field. The search will be carried out in the following columns: Name, Tenant, Type, Schedule (name of the day and time).
- Click Delete policy and confirm the action.
The selected monitoring policies are deleted.
You cannot remove predefined monitoring policies or policies that are assigned to data sources.
Page top
Managing assets
Assets represent the computers of the organization. After adding assets to KUMA, their IDs are added to enriched events, and, when analyzing events, you get additional information about your organization's computers.
You can view information about assets, search for assets by specified criteria, edit or delete assets, and export asset data to a CSV file.
Asset categories
You can categorize the assets and then use the categories in filter conditions or correlation rules. For example, you can create alerts of a higher severity level for assets from a higher-severity category. By default, all assets fall into the Uncategorized assets category. A device can be added to multiple categories.
By default, KUMA asset categories have the following severity levels: Low, Medium, High, Critical. You can create custom categories, categories can be nested.
Categories can be populated in the following ways:
- Manually
- Active: dynamic if the asset meets the specified conditions. For example, the moment the asset is upgraded to a specified OS version or placed in a specified subnet, the asset is moved to the specified category. If you specified a relative period and selected the frequency of categorization, for example, hourly, every time categorization starts, the condition will consider asset information that is up-to-date at the time of starting the categorization.
- Reactive—When a correlation rule is triggered, the asset is moved to the specified group.
In KUMA, assets are categorized by tenant and by category. Assets are arranged in a tree structure, where the tenants are located at the root, and the asset categories branch from them. You can view the tree of tenants and categories in the Assets → All assets section of the KUMA web interface. When a tree node is selected, the assets assigned to it are displayed in the right part of the window. Assets from the subcategories of the selected category are displayed if you specify that you want to display assets recursively. You can select the check boxes next to the tenants whose assets you want to view.
To open the context menu of a category, hover the mouse cursor over the category and click the ellipsis icon that is displayed to the right of the category name. The following actions are available in the context menu:
Category context menu items
Action |
Description |
|---|---|
Show assets |
Display assets of the selected category in the right part of the window. |
Show assets recursively |
View assets from subcategories of the selected category. If you want to exit recursive viewing mode, select another category to view. |
Show info |
View information about the selected category in the Category information details area displayed in the right part of the web interface window. |
Start categorization |
Start automatic binding of assets to the selected category. This option is available for categories that have active categorization. |
Add subcategory |
Add a subcategory to the selected category. |
Edit category |
Edit the selected category. |
Delete category |
Delete the selected category. You can only delete categories that have no assets or subcategories. Otherwise the Delete category option is inactive. |
Pin as tab |
Display the selected category on a separate tab. You can undo this action by selecting Unpin as tab in the context menu of the relevant category. |
Adding an asset category
To add an asset category:
- Open the Assets section in the KUMA web interface.
- Open the category creation window:
- Click the Add category button.
- If you want to create a subcategory, select Add subcategory in the context menu of the parent category.
The Add category details area appears in the right part of the web interface window.
- Add information about the category:
- In the Name field, enter the name of the category. The name must contain 1 to 128 Unicode characters.
- In the Parent field, indicate the position of the category within the categories tree hierarchy:
- Click the tree (
 ) button.
This opens the Select categories window showing the categories tree. If you are creating a new category and not a subcategory, the window may show multiple asset category trees, one for each tenant that you can access. Your tenant selection in this window cannot be undone.
- Select the parent category for the category you are creating.
- Click Save.
Selected category appears in Parent fields.
- Click the tree (
- The Tenant field displays the tenant whose structure contains your selected parent category. The tenant category cannot be changed.
- Assign a severity to the category in the Severity drop-down list.
- If necessary, in the Description field, you can add a note consisting of up to 256 Unicode characters.
- In the Categorization kind drop-down list, select how the category will be populated with assets. Depending on your selection, you may need to specify additional settings:
- Manually—assets can only be manually linked to a category.
- Active—assets will be assigned to a category at regular intervals if they satisfy the defined filter.
- Reactive—the category will be filled with assets by using correlation rules.
- Click Save.
The new category will be added to the asset categories tree.
Page top
Configuring the table of assets
In KUMA, you can configure the contents and order of columns displayed in the assets table. These settings are stored locally on your machine.
To configure the settings for displaying the assets table:
- Open the Assets section in the KUMA web interface.
- Click the gear (
 ) icon in the upper-right corner of the assets table.
 - In the drop-down list, select the check boxes next to the parameters that you want to view in the table:
- FQDN
- IP address
- Asset source
- Owner
- MAC address
- Created by
- Updated
- Tenant
- CII category
- Archived
- Status
- Score ML
When you select a check box, the assets table is updated and a new column is added. When a check box is cleared, the column disappears. The table can be sorted based on multiple columns.
- If you need to change the order of columns, click the left mouse button on the column name and drag it to the desired location in the table.
The assets table display settings are configured.
Page top
Searching assets
KUMA has two asset search modes. You can switch between the search modes using the buttons in the upper left part of the window:
 – simple search by the following asset settings: Name, FQDN, IP address, MAC address, and Owner.
 – advanced search for assets using filters by conditions and condition groups.
You can select the check boxes next to the found assets to export their data to a CSV file.
Simple search
To find an asset using simple search:
- In the Assets section of the KUMA web interface, click the button.
The Search field is displayed at the top of the window.
- Enter your search query in the Search field and press ENTER or click the icon.
The table displays the assets with the Name, FQDN, IP address, MAC address, and Owner settings matching the search criteria.
Advanced search
To find an asset using advanced search:
- In the Assets section of the KUMA web interface, click the button.
The asset filtering settings are displayed in the upper part of the window.
- Specify the asset filtering settings and click the Search button.
For details on asset filtering settings, see the table below.
The table displays the assets that meet the search criteria.
An advanced asset search is performed using the filtering conditions that can be specified in the upper part of the window:
- You can use the Add condition button to add a string containing fields for identifying the condition.
- You can use the Add group button to add a group of filters. Group operators can be switched between AND, OR, and NOT.
- Conditions and condition groups can be dragged with the mouse.
- Conditions, groups, and filters can be deleted by using the button.
- You can collapse the filtering options by clicking the Collapse button. In this case, the resulting search expression is displayed. Clicking it displays the search criteria in full again.
- The filtering options can be reset by clicking the Clear button.
- The condition operators and available values of the right operand depend on the selected left operand:
Left operand
Available operators
Right operand
Build number
=, ilike
An arbitrary value.
OS
=, ilike
An arbitrary value.
IP address
inSubnet, inRange
An arbitrary value or a range of values.
The filtering condition for the inSubnet operator is met if the IP address in the left operand is included in the subnet that is specified in the right operand. For example, the subnet for the IP address 10.80.16.206 should be specified in the right operand using slash notation as follows:
10.80.16.206/25.FQDN
=, ilike
An arbitrary value.
CVE
=, in
An arbitrary value.
CVSS
>, >=, =, <=, <
A number from 0 to 10 (possible severity levels of the asset's CVE vulnerability).
Not applicable to vulnerabilities from Kaspersky Security Center.
CVE count
>, >=, =, <=, <
Number. The number of unique vulnerabilities with the CVE attribute for the asset. Vulnerabilities without CVEs do not count towards this figure.
For searching by the number of CVEs of a certain severity level, you can use a combined condition. For example:
CVE count >= 1
CVSS >= 6.5
Software
=, ilike
An arbitrary value.
Software version
=, ilike, in
An arbitrary value. Version (build) number of the software installed on the asset.
Asset source
in
- Kaspersky Security Center.
- KICS/KATA.
- Created manually
in
- Information resource is not a CII object.
- CII object without a significance category.
- CII object of the third category of significance.
- CII object of the second category of significance.
- CII object of the first category of significance.
RAM (bytes)
=, >, >=, <, <=
Number.
Number of disks
=, >, >=, <, <=
Number.
Number of network cards
=, >, >=, <, <=
Number.
Disk free bytes
=, >, >=, <, <=
Number.
KSC group
=, ilike
An arbitrary value. Name of the Kaspersky Security Center administration group in which the asset is placed.
Anti-virus databases last updated
>=, <=
For searching, the time is specified as UTC time, and then converted in the KUMA interface to the local time zone set in the browser.
You can specify the date and time for this operand in one of the following ways:
- Select the exact date in the calendar.
- Select a period relative to the present time in the Relative period list.
- Enter a value manually: an exact date and time or a relative period, or a combination of both.
For details, check the Using time values subsection below.
Last update of the information
>=, <=
For searching, the time is specified as UTC time, and then converted in the KUMA interface to the local time zone set in the browser.
You can specify the date and time for this operand in one of the following ways:
- Select the exact date in the calendar.
- Select a period relative to the present time in the Relative period list.
- Enter a value manually: an exact date and time or a relative period, or a combination of both.
For details, see the Using time values subsection below.
Protection last updated
>=, <=
For searching, the time is specified as UTC time, and then converted in the KUMA interface to the local time zone set in the browser.
You can specify the date and time for this operand in one of the following ways:
- Select the exact date in the calendar.
- Select a period relative to the present time in the Relative period list.
- Enter a value manually: an exact date and time or a relative period, or a combination of both.
For details, check the Using time values subsection below.
System last started
>=, <=
For searching, the time is specified as UTC time, and then converted in the KUMA interface to the local time zone set in the browser.
You can specify the date and time for this operand in one of the following ways:
- Select the exact date in the calendar.
- Select a period relative to the present time in the Relative period list.
- Enter a value manually: an exact date and time or a relative period, or a combination of both.
For details, see the Using time values subsection below.
KSC extended status
in
- Host with Network Agent installed is online, but Network Agent is inactive.
- Anti-virus application is installed, but real-time protection is not running.
- Anti-virus application is installed but not running.
- Number of viruses detected is too high.
- Anti-virus application is installed but the real-time protection status differs from the one set by the security administrator.
- Anti-virus application is not installed.
- Full scan for viruses performed too long ago.
- Anti-virus bases were updated too long ago.
- Network Agent has been inactive too long.
- Old license.
- Number of uncured objects is too high.
- Reboot is required.
- One or more incompatible applications are installed on the host.
- Host has one or more vulnerabilities.
- Last search for operating system updates was performed too long ago on the host.
- The host does not have the proper encryption status.
- Mobile device settings do not meet the requirements of the security policy.
- There are unhandled incidents.
- Host status was suggested by the managed product (HSDP).
- Host is out of disk space, either synchronization errors occur, or disk space is running out.
Real-time protection status
=
- Suspended.
- Starting.
- Running (if anti-virus application does not support categories of state Running).
- Running with maximum protection.
- Running for maximum speed.
- Running with recommended settings.
- Running with custom settings.
- Error.
Encryption status
=
- Encryption rules are not configured on the host.
- Encryption is in progress.
- Encryption was canceled by the user.
- Encryption error occurred.
- All host encryption rules are met.
- Encryption is in progress, the host must be restarted.
- Encrypted files without specified encryption rules are detected on the host.
Spam protection status
=
- Unknown.
- Stopped.
- Suspended.
- Starting.
- Running.
- Error.
- Not installed.
- No license.
Anti-virus protection status of mail servers
=
- Unknown.
- Stopped.
- Suspended.
- Starting.
- Running.
- Error.
- Not installed.
- No license.
Data Leakage Prevention status
=
- Unknown.
- Stopped.
- Suspended.
- Starting.
Running.
- Error.
- Not installed.
- No license.
KSC extended status ID
=
- OK
- Critical.
- Warning.
Endpoint Sensor status
=
- Unknown.
- Stopped.
- Suspended.
- Starting.
- Running.
- Error.
- Not installed.
- No license.
Last visible
>=, <=
For searching, the time is specified as UTC time, and then converted in the KUMA interface to the local time zone set in the browser.
You can specify the date and time for this operand in one of the following ways:
- Select the exact date in the calendar.
- Select a period relative to the present time in the Relative period list.
- Enter a value manually: an exact date and time or a relative period, or a combination of both.
For details, check the Using time values subsection below.
Score ML
=, >, >=, <, <=
Number. Asset score assigned by AI services.
Status
=, in
Asset status assigned by AI services:
- Low.
- Medium.
- High.
- Critical.
Custom asset field
=, ilike
An arbitrary value. Search custom fields of assets.
Using time values
Some conditions, for example, Anti-virus databases last updated or System last started, use date and time as the operand value. For these conditions, you can use an exact date and time or a relative period.
To specify a date and time value:
- Select an operand, an operator and click the date field.
- Do one of the following:
- Select the exact date in the calendar.
By default, the current time is automatically added to the selected date, with millisecond precision. Changing the date in the calendar does not change the specified time. The date and time are displayed in the time zone of the browser. If necessary, you can edit the date and time in the field.
- In the Relative period list, select a relative period.
The period is calculated relative to the start time of the current search and takes into account asset information that is up-to-date at that moment. For example, for the condition Anti-virus databases last updated, you can select 1 hour and the >= operator to find those assets for which the anti-virus databases have not been updated for more than 1 hour.
- In the date and time field, enter a value manually.
You can enter an exact date and time in the DD.MM.YYYY HH:mm:ss.SSS format for the Russian localization and YYYY-MM-DD HH:mm:ss.SSS for the English localization or a relative period as a formula. You can also combine these methods if necessary.
If you do not specify milliseconds when entering the exact date, 000 is substituted automatically.
In the relative period formulas, you can use the now parameter for the current date and time and the interval parameterization language: +, -, / (rounding to the nearest), as well as time units: y (year), M (month), w (week), d (day), h (hour), m (minute), s (second).
For example, for the Information last updated condition, you can specify now-2d with the >= operator and now-1d with the >= operator to find assets whose information was updated during the day before the search was started; alternatively, you can specify now/w with the <= operator to find assets whose information was updated between the beginning of the first day of the current week (00:00:00:000 UTC) and now.
KUMA stores time values in UTC, but in the user interface time is converted to the time zone of your browser. This is relevant to the relative periods: Today, Yesterday, This week, and This month. For example, if the time zone in your browser is UTC+3, and you select Today as the period, the category will cover assets from 03:00:00.000 until now, not from 00:00:00.000 until now.
If you want to take your time zone into account when selecting a relative period, such as Today, Yesterday, This week, or This month, you need to manually add a time offset in the date and time field by adding or subtracting the correct number of hours. For example, if your browser's time zone is UTC+3 and you want the categorization to cover the Yesterday period, you need to change the value to now-1d/d-3h. If you want the categorization to cover the Today period, change the value to now/d-3h.
- Select the exact date in the calendar.
Exporting asset data
You can export data about the assets displayed in the assets table as a CSV file.
To export asset data:
- Configure the assets table.
Only the data specified in the table is written to the file. The display order of the asset table columns is preserved in the exported file.
- Find the desired assets and select the check boxes next to them.
You can select all the assets in the table at a time by selecting the check box in the left part of the assets table header.
- Click the Export CSV button.
The asset data is written to the assets_<export date>_<export time>.csv file. The file is downloaded according to your browser settings.
Page top
Viewing asset details
To view information about an asset, open the asset information window in one of the following ways:
- In the KUMA web interface, select Assets → select a category with the relevant assets → select an asset.
- In the KUMA web interface, select Alerts → click the link with the relevant alert → select the asset in the Related endpoints section.
- In the KUMA web interface, select Events → search and filter events → select the relevant event → click the link in one of the following fields: SourceAssetID, DestinationAssetID, or DeviceAssetID.
The following information may be displayed in the asset details window:
- Name—asset name.
Assets imported into KUMA retain the names that were assigned to them at the source. You can change these names in the KUMA web interface.
- Tenant—the name of the tenant that owns the asset.
- Asset source—source of information about the asset. There may be several sources. For instance, information can be added in the KUMA web interface or by using the API, or it can be imported from Kaspersky Security Center, KICS/KATA, and MaxPatrol reports.
When using multiple sources to add information about the same asset to KUMA, you should take into account the rules for merging asset data.
- Created—date and time when the asset was added to KUMA.
- Updated—date and time when the asset information was most recently modified.
- Owner—owner of the asset, if provided.
- IP address—IP address of the asset (if any).
If there are several assets with identical IP addresses in KUMA, the asset that was added the latest is returned in all cases when assets are searched by IP address. If assets with identical IP addresses can coexist in your organization's network, plan accordingly and use additional attributes to identify the assets. For example, this may become important during correlation.
- FQDN—Fully Qualified Domain Name of the asset, if provided.
- MAC address—MAC address of the asset (if any).
- Operating system—operating system of the asset.
- Related alerts—alerts associated with the asset (if any).
To view the list of alerts related to an asset, click the Find in Alerts link. This opens the Alerts tab with the search expression set to filter all assets with the corresponding asset ID.
- Software info and Hardware info—if the asset software and hardware parameters are provided, they are displayed in this section.
- Asset vulnerability information:
- Kaspersky Security Center vulnerabilities—vulnerabilities of the asset, if provided. This information is available for the assets imported from Kaspersky Security Center.
You can learn more about the vulnerability by clicking the
 icon, which opens the Kaspersky Threats portal. You can also update the vulnerabilities list by clicking the Update link and requesting updated information from Kaspersky Security Center.
 - KICS/KATA vulnerabilities—vulnerabilities of the asset, if any. This information is available for the assets imported from KICS/KATA.
- Kaspersky Security Center vulnerabilities—vulnerabilities of the asset, if provided. This information is available for the assets imported from Kaspersky Security Center.
- Asset source information:
- Last visible—time when information about the asset was last received from Kaspersky Security Center. This information is available for the assets imported from Kaspersky Security Center.
- Host ID—ID of the Kaspersky Security Center Network Agent from which the asset information was received. This information is available for the assets imported from Kaspersky Security Center. This ID is used to determine the uniqueness of the asset in Kaspersky Security Center.
- KICS/KATA server IP address and KICS/KATA connector ID—data on the KICS/KATA instance from which the asset was imported.
- Custom fields—data written to the asset custom fields.
- Additional information about the protection settings of an asset with Kaspersky Endpoint Security for Windows or Kaspersky Endpoint Security for Linux installed:
- KSC extended status ID – asset status. It can have the following values:
- OK
- Critical
- Warning
- KSC extended status – information about the asset status. For example, Anti-virus databases were updated too long ago.
- Real-time protection status – status of Kaspersky applications installed on the asset. For example: Running (if anti-virus application does not support categories of state Running).
- Encryption status – information about asset encryption. For example: Host doesn't have any encryption rules.
- Spam protection status – status of anti-spam protection. For example, Starting.
- Anti-virus protection status of mail servers – status of the virus protection of mail servers. For example, Starting.
- Data Leakage Prevention status – status of data leak protection. For example, Starting.
- Endpoint Sensor status – status of data leak protection. For example, Starting.
- Anti-virus databases last updated – the version of the downloaded anti-virus databases.
- Protection last updated – the time when the anti-virus databases were last updated.
- System last started – the time when the system was last started.
This information is displayed if the asset was imported from Kaspersky Security Center.
- KSC extended status ID – asset status. It can have the following values:
- Categories—categories associated with the asset (if any).
- CII category—information about whether an asset is a critical information infrastructure (CII) object.
By clicking the Move to KSC group button, you can move the asset that you are viewing between Kaspersky Security Center administration groups. You can also click the Start task drop-down list to run tasks available on the asset:
- By clicking the KSC response button, you can start a Kaspersky Security Center task on the asset.
- By clicking the KEDR response button, you can run a Kaspersky Endpoint Detection and Response task on the asset.
- By clicking the Refresh KSC asset button, you can run a task to refresh information about the asset from Kaspersky Security Center.
The tasks are available when integrated with Kaspersky Security Center and when integrated with Kaspersky Endpoint Detection and Response.
Page top
Adding assets
You can add asset information to KUMA in the following ways:
- Manually.
You can add an asset using the KUMA web interface or the API. In this case, you must manually specify the following information: address, FQDN, name and version of the operating system, hardware information. Information about the vulnerabilities of assets cannot be added through the web interface. You can provide information about vulnerabilities if you add assets using the API.
- Import assets.
You can import assets from Kaspersky Security Center, KICS/KATA, and MaxPatrol reports.
- Import assets.
When adding assets, assets that already exist in KUMA can be merged with the assets being added.
Asset merging algorithm:
- Checking the uniqueness of assets in Kaspersky Security Center or KICS/KATA assets.
- The uniqueness of an asset imported from Kaspersky Security Center is determined by the Host ID parameter, which contains the Kaspersky Security Center Network Agent Network Agent identifier. If two assets' IDs differ, they are considered to be separate assets and are not merged.
- The uniqueness of an asset imported from KICS/KATA is determined by the combination of the IP address, KICS/KATA server IP address, and KICS/KATA connector ID parameters. If any of the parameters of two assets differ they are considered to be separate assets and are not merged.
If the compared assets match, the algorithm is performed further.
- Make sure that the values in the IP, MAC, and FQDN fields match.
If at least two of the specified fields match, the assets are combined, provided that the other fields are blank.
Possible matches:
- The FQDN and IP address of the assets match. The MAC field is blank.
The check is performed against the entire array of IP address values. If the IP address of an asset is included in the FQDN, the values are considered to match.
- The FQDN and MAC address of the assets match. The IP field is blank.
The check is performed against the entire array of MAC address values. If at least one value of the array fully matches the FQDN, the values are considered to match.
- The IP address and MAC address of the assets match. The FQDN field is blank.
The check is performed against the entire array of IP- and MAC address values. If at least one value in the arrays is fully matched, the values are considered to match.
- The FQDN and IP address of the assets match. The MAC field is blank.
- Make sure that the values of at least one of the IP, MAC, or FQDN fields match, provided that the other two fields are not filled in for one or both assets.
Assets are merged if the values in the field match. For example, if the FQDN and IP address are specified for a KUMA asset, but only the IP address with the same value is specified for an imported asset, the fields match. In this case, the assets are merged.
For each field, verification is performed separately and ends on the first match.
Examples of asset field comparison are displayed here.
Information about assets can be generated from various sources. If the added asset and the KUMA asset contain data received from the same source, this data is overwritten. For example, a Kaspersky Security Center asset receives a fully qualified domain name, software information, and host ID when imported into KUMA. When importing an asset from Kaspersky Security Center with an equivalent fully qualified domain name, all this data will be overwritten (if it has been defined for the added asset). All fields in which the data can be refreshed are listed in the Updatable data table.
Updatable data
Field name |
Update procedure |
|---|---|
Name |
Selected according to the following priority:
|
Owner |
The first value from the sources is selected according to the following priority:
|
IP address |
The data is merged. If the array of addresses contains identical addresses, the copy of the duplicate address is deleted. |
FQDN |
The first value from the sources is selected according to the following priority:
|
MAC address |
The data is merged. If the array of addresses contains identical addresses, one of the duplicate addresses is deleted. |
Operating system |
The first value from the sources is selected according to the following priority:
|
Vulnerabilities |
KUMA asset data is supplemented with information from the added assets. In the asset details, data is grouped by the name of the source. Vulnerabilities are eliminated for each source separately. |
Software info |
Data from KICS/KATA is always recorded (if available). For other sources, the first value is selected according to the following priority:
|
Hardware info |
The first value from the sources is selected according to the following priority:
|
The updated data is displayed in the asset details. You can view asset details in the KUMA web interface.
This data may be overwritten when new assets are added. If the data used to generate asset information is not updated from sources for more than 30 days, the asset is deleted. The next time you add an asset from the same sources, a new asset is created.
If the KUMA web interface is used to edit asset information that was received from Kaspersky Security Center or KICS/KATA, you can edit the following asset information:
- Name.
- Category.
If asset information was added manually, you can edit the following asset data when editing these assets in the KUMA web interface:
- Name.
- Name of the tenant that owns the asset.
- IP address.
- Fully qualified domain name.
- MAC address.
- Owner.
- Category.
- Operating system.
- Hardware info.
Asset data cannot be edited via the REST API. When importing from the REST API, the data is updated according to the rules for merging asset details provided above.
Adding asset information in the KUMA web interface
To add an asset in the KUMA web interface:
- In the Assets section of the KUMA web interface, click the Add asset button.
The Add asset details area opens in the right part of the window.
- Enter the asset parameters:
- Asset name (required)
- Tenant (required)
- IP address and/or FQDN (required) You can specify multiple FQDNs separated by commas.
- MAC address
- Owner
- If required, assign one or multiple categories to the asset:
- Click the tree () button.
Select categories window opens.
- Select the check boxes next to the categories that should be assigned to the asset. You can use the plus (
 ) and minus (
 ) icons to expand or collapse the lists of categories.
 - Click Save.
The selected categories appear in the Categories fields.
- Click the tree (
- If required, add information about the operating system installed on the asset in the Software section.
- If required, add information about asset hardware in the Hardware info section.
- Click Add.
The asset is created and displayed in the assets table in the category assigned to it or in the Uncategorized assets category.
Page top
Importing asset information and asset vulnerability information from Kaspersky Security Center
All assets that are protected by Kaspersky Security Center are registered in it. You can import into KUMA the information about assets or vulnerabilities of assets that Kaspersky Security Center protects. To do so, you need to configure integration between the applications in advance.
In Kaspersky Security Center integration settings, you can configure the frequency of automatic import of information about assets, and, if necessary, import assets manually. Importing assets manually does not affect the time of the next scheduled import. From the Kaspersky Security Center database, KUMA imports information about devices with installed Kaspersky Security Center Network Agent that has connected to Kaspersky Security Center, that is, has a non-empty 'Connection time' field in the SQL database.
KUMA imports the following device information received from Kaspersky Security Center Network Agents:
- Basic information about the asset: name, address, time of connection to Kaspersky Security Center, hardware information, protection status, anti-virus database versions
- Information about asset attributes: vulnerabilities; software, including the operating system; owners of the asset
By default, basic asset information is imported every hour, and information about asset attributes is imported every 12 hours. Attribute information is imported only for existing assets, not for new or deleted assets.
During the next import of information from Kaspersky Security Center, if KUMA does not receive data about a previously added asset, such an asset is marked as archived. If no information about this asset is received within the next 30 days, the asset is deleted.
KUMA does not import Kaspersky Security Center assets with the Last visible parameter greater than 30 days.
If Kaspersky Security Center encounters errors while running the import tasks, KUMA displays such errors. If basic asset information is not available in KUMA during the import of asset attribute information (for example, if the assets were deleted during the import), the task completes without errors, but the attribute information for these assets is not loaded.
KUMA provides the following ways of importing information about assets or asset vulnerabilities from KSC:
- Importing asset information and asset vulnerability information for assets of all KSC Servers.
- Importing asset information and asset vulnerability information for assets of an individual KSC Server.
Importing asset information from MaxPatrol
You can import asset information from the MaxPatrol system into KUMA.
You can use the following import arrangements:
- Importing from reports about scan results of network devices of the MaxPatrol 8 system.
The import is performed through the API using the maxpatrol-tool on the server where the KUMA Core is installed. The tool is included in the KUMA distribution kit and is located in the installer archive in the /kuma-ansible-installer/roles/kuma/files directory.
- Importing data from MaxPatrol VM.
Data is imported via the API using the kuma_pvtm utility. The tool is included in the KUMA distribution kit and is located in the installer archive in the /kuma-ansible-installer/roles/kuma/files directory.
Imported assets are displayed in the KUMA web interface in the Assets section. If necessary, you can edit the settings of assets.
Page top
Importing data from MaxPatrol reports
Importing asset information form a report is supported for MaxPatrol 8.
To import asset information from a MaxPatrol report:
- In MaxPatrol, generate a network asset scan report in XML file format and copy the report file to the KUMA Core server. For more details about scan tasks and output file formats, refer to the MaxPatrol documentation.
Data cannot be imported from reports in SIEM integration file format. The XML file format must be selected.
- Create a file with the token for accessing the KUMA REST API. For convenience, it is recommended to place it into the MaxPatrol report folder. The file must not contain anything except the token.
Requirements imposed on accounts for which the API token is generated:
- General administrator, Tenant administrator, Tier 2 analyst, or Tier 1 analyst role.
- Access to the tenant into which the assets will be imported.
- Permissions for using API requests GET /users/whoami and POST /api/v1/assets/import have been configured.
To import assets from MaxPatrol, it is recommended to create a separate user with the minimum necessary set of rights to use API requests.
- Copy the maxpatrol-tool to the server hosting the KUMA Core and make the tool's file executable by running the following command:
chmod +x <path to the maxpatrol-tool file on the server hosting the KUMA Core> - Run the maxpatrol-tool:
./maxpatrol-tool --kuma-rest <KUMA REST API server address and port> --token <path and name of API token file> --tenant <name of tenant where assets will reside> <path and name of MaxPatrol report file> --cert <path to the KUMA Core certificate file>You can download the Core certificate in the KUMA web interface.
Example:
./maxpatrol-tool --kuma-rest example.kuma.com:7223 --token token.txt --tenant Main example.xml --cert /tmp/ca.certYou can use additional flags and commands for import operations. For example, the command
--verbose, -vwill display a full report on the received assets. A detailed description of the available flags and commands is provided in the table titled Flags and commands of maxpatrol-tool. You can also use the--helpcommand to view information on the available flags and commands.
The asset information will be imported from the MaxPatrol report to KUMA. The console displays information on the number of new and updated assets.
Example:
|
The tool works as follows when importing assets:
- KUMA overwrites the data of assets imported through the API, and deletes information about their resolved vulnerabilities.
- KUMA skips assets with invalid data. Error information is displayed when using the
--verboseflag. - If there are assets with identical IP addresses and fully qualified domain names (FQDN) in the same MaxPatrol report, these assets are merged. The information about their vulnerabilities and software is also merged into one asset.
When uploading assets from MaxPatrol, assets that have equivalent IP addresses and fully qualified domain names (FQDN) that were previously imported from Kaspersky Security Center are overwritten.
To avoid this problem, you must configure range-based asset filtering by running the following command:
--ignore <IP address ranges>or-i <IP address ranges>Assets that satisfy the filtering criteria are not uploaded. For a description of this command, please refer to the table titled Flags and commands of maxpatrol-tool.
Flags and commands of maxpatrol-tool
Flags and commands |
Description |
|---|---|
|
Address (with the port) of KUMA Core server where assets will be imported. For example, Port 7223 is used for API requests by default. You can change the port if necessary. |
|
Path and name of the file containing the token used to access the REST API. This file must contain only the token. The account for which you are generating an API token must have the General administrator, Tenant administrator, Tier 2 administrator, or Tier 1 administrator role. |
|
Name of the KUMA tenant in which the assets from the MaxPatrol report will be imported. |
|
This command uses DNS to enrich IP addresses with FQDNs from the specified ranges if the FQDNs for these addresses were not already specified. Example: |
|
Address of the DNS server that the tool must contact to receive FQDN information. Example: |
|
Address ranges of assets that should be skipped during import. Example: |
|
Output of the complete report on received assets and any errors that occurred during the import process. |
|
Get reference information on the tool or a command. Examples:
|
|
Get information about the version of the maxpatrol-tool. |
|
Creation of an autocompletion script for the specified shell. |
|
Path to the KUMA Core certificate. By default, the certificate is located in the folder with the application installed: /opt/kaspersky/kuma/core/certificates/ca.cert. |
Examples:
./maxpatrol-tool --kuma-rest example.kuma.com:7223 --token token.txt --tenant Main example.xml --cert /example-directory/ca.cert– import assets to KUMA from MaxPatrol report example.xml../maxpatrol-tool help—get reference information on the tool.
Possible errors
Error message |
Description |
|---|---|
must provide path to xml file to import assets |
The path to the MaxPatrol report file was not specified. |
incorrect IP address format |
Invalid IP address format. This error may arise when incorrect IP ranges are indicated. |
no tenants match specified name |
No suitable tenants were found for the specified tenant name using the REST API. |
unexpected number of tenants (%v) match specified name. Tenants are: %v |
KUMA returned more than one tenant for the specified tenant name. |
could not parse file due to error: %w |
Error reading the XML file containing the MaxPatrol report. |
error decoding token: %w |
Error reading the API token file. |
error when importing files to KUMA: %w |
Error transferring asset information to KUMA. |
skipped asset with no FQDN and IP address |
One of the assets in the report did not have an FQDN or IP address. Information about this asset was not sent to KUMA. |
skipped asset with invalid FQDN: %v |
One of the assets in the report had an incorrect FQDN. Information about this asset was not sent to KUMA. |
skipped asset with invalid IP address: %v |
One of the assets in the report had an incorrect IP address. Information about this asset was not sent to KUMA. |
KUMA response: %v |
An error occurred with the specified report when importing asset information. |
unexpected status code %v |
An unexpected HTTP code was received when importing asset information from KUMA. |
Importing asset information from MaxPatrol VM
The KUMA distribution kit includes the kuma-ptvm utility, which consists of an executable file and a configuration file. The utility is supported on Windows and Linux operating systems. The utility allows you to connect to the MaxPatrol VM API to get data about devices and their attributes, including vulnerabilities, and also lets you edit asset data and import data using the KUMA API. Data import is supported for MaxPatrol VM 1.1, 2.6.
Configuring the import of asset information from MaxPatrol VM to KUMA involves the following steps:
- Preparing KUMA and MaxPatrol VM.
You must create user accounts and a KUMA token for API operations.
- Creating a configuration file with data export and import settings.
- Importing asset data into KUMA using the kuma-ptvm utility:
- The data is exported from MaxPatrol VM and saved in the directory of the utility. Information for each tenant is saved to a separate file in JSON format.
If necessary, you can edit the received files.
- Information from files is imported into KUMA.
- The data is exported from MaxPatrol VM and saved in the directory of the utility. Information for each tenant is saved to a separate file in JSON format.
When re-importing existing assets, assets that already exist in KUMA are overwritten. In this way, fixed vulnerabilities are removed.
Known limitations
If the same IP address is specified for two assets with different FQDNs, KUMA imports such assets as two different assets; the assets are not combined.
If an asset has two softwares with the same data in the name, version, vendor fields, KUMA imports this data as one software, despite the different software installation paths in the asset.
If you set strict_import to false in the kuma-ptvm-config.yaml configuration file, data from MaxPatrol is imported for all assets, including those without fields that KUMA requires and those with field values that KUMA does not allow. If the FQDN of an asset contains a space or underscore ("_"), data for such assets is not imported into KUMA, and the log indicates that the assets were skipped during import.
If an error occurs during import, error details are logged and the import stops.
Preparatory actions
- Create a separate user account in KUMA and in MaxPatrol VM with the minimum necessary set of permissions to use API requests.
- Create user accounts for which you will lager generate an API token.
Requirements imposed on accounts for which the API token is generated:
- General administrator, Tenant administrator, Tier 2 analyst, or Tier 1 analyst role.
- Access to the tenant into which the assets will be imported.
- In the user account, under API access rights, the check box is selected for POST/api/v1/assets/import.
- Generate a token for access to the KUMA REST API.
Creating the configuration file
To create the configuration file:
- Go to the KUMA installer folder by executing the following command:
cd kuma-ansible-installer/roles/kuma/files/ - Extract the kuma-ptvm.tar.gz archive by running the following command:
tar -xvf kuma-ptvm.tar.gz - Copy the kuma-ptvm-config-template.yaml template to create a configuration file named kuma-ptvm-config.yaml:
cp kuma-ptvm-config-template.yaml kuma-ptvm-config.yaml - Edit the settings in the kuma-ptvm-config.yaml configuration file.
- Save the changes to the file.
The configuration file will be created. Go to the Importing asset data step.
Importing asset data
To import asset information:
- If you want to import asset information from MaxPatrol VM into KUMA without intermediate verification of the exported data, run the kuma-ptvm utility with the following options:
./kuma-ptvm --config <path to the kuma-ptvm-config.yaml file> --download --upload - If you want to check the correctness of data exported from MaxPatrol VM before importing it into KUMA:
- Run the kuma-ptvm utility with the following options:
./kuma-ptvm --config <path to the kuma-ptvm-config.yaml file> --downloadFor each tenant specified in the configuration file, a separate file is created with a name of the form <KUMA tenant ID>.JSON. Also, during export, a 'tenants' file is created, containing a list of JSON files to be uploaded to KUMA. All files are saved in the utility's directory.
- Review the exported asset files and if necessary, make the following edits:
- Assign assets to their corresponding tenants.
- Manually transfer asset data from the 'default' tenant file to the files of the relevant tenants.
- In the 'tenants' file, edit the list of tenants whose assets you want to import into KUMA.
- Import asset information into KUMA:
./kuma-ptvm --config <path to the kuma-ptvm-config.yaml file> --upload
To view information about the available commands of the utility, run the --help command.
- Run the kuma-ptvm utility with the following options:
The asset information is imported from MaxPatrol VM to KUMA. The console displays information on the number of new and updated assets.
Possible errors
When running the kuma-ptvm utility, the tls: failed to verify certificate: x509: certificate is valid for localhost error may be returned.
Solution.
- Issue a certificate in accordance with the MaxPatrol documentation. We recommend resolving the error in this way.
- Disable certificate validation.
To disable certificate validation, add the following line to the configuration file in the 'MaxPatrol settings' section:
ignore_server_cert: true
As a result, the utility is started without errors.
Page top
Settings of the kuma-ptvm-config.yaml configuration file
The table lists the settings that you can specify in the kuma-ptvm-config.yaml file.
Description of settings in the kuma-ptvm-config.yaml configuration file
Setting |
Description |
Values |
|---|---|---|
|
An optional setting in the 'General settings' group. Logging level. |
Available values:
Default setting: |
|
An optional setting in the 'General settings' group. Data for assets that have changed during the specified period is exported from MaxPatrol. |
No limitations apply. Default setting: |
|
Optional setting in the 'General settings' group. When exporting assets from MaxPatrol, check if the required fields for KUMA are filled. Do not export unverified assets from MaxPatrol. |
Available values:
Default setting: We recommend specifying |
|
Required setting in the 'KUMA settings' group. URL of the KUMA API server. For example, kuma-example.com:7223 |
- |
|
Required setting in the 'KUMA settings' group. KUMA API token. |
- |
|
Optional setting in the 'KUMA settings' group. Validation of the KUMA certificate. |
Available values:
This setting is not included in the configuration file template. You can manually add this setting with a true value, which will prevent the kuma-ptvm utility from validating the certificate at startup. |
|
Required setting in the 'MaxPatrol VM' group. URL of the MaxPatrol API server. |
- |
|
Required setting in the 'MaxPatrol VM' group. MaxPatrol API user name. |
- |
|
Required setting in the 'MaxPatrol VM' group. MaxPatrol API user password. |
- |
|
Required setting in the 'MaxPatrol VM settings' group. MaxPatrol API secret. |
- |
|
Optional setting in the 'MaxPatrol VM settings' group. Validation of the MaxPatrol certificate. |
Available values:
This setting is not included in the configuration file template. You can manually add this setting with a true value if the We recommend issuing a certificate in accordance with the MaxPatrol documentation as the preferred way of resolving the error. |
|
Optional setting in the 'Vulnerability filter' group. Export from MaxPatrol only assets with vulnerabilities for which exploits are known. |
Available values:
Default setting: |
|
Optional setting in the 'Vulnerability filter' group. Import only vulnerabilities of the specified level or higher. |
Available values:
Default value: |
|
Required setting in the 'Tenant map' group. Tenant ID in KUMA. Assets are assigned to tenants in the order in which tenants are specified in the configuration file: the higher a tenant is in the list, the higher its priority. This means you can specify overlapping subnets. |
- |
|
Optional setting in the 'Tenant map' group. Regular expression for searching the FQDN of an asset. |
- |
|
Optional setting in the 'Tenant map' group. One or more subnets. |
- |
|
Optional setting. The default KUMA tenant for data about assets that could not be allocated to tenants specified in the 'Tenants' group of settings. |
- |
Importing asset information from KICS for Networks
After configuring KICS for Networks integration, tasks to obtain data about KICS for Networks assets are created automatically. This occurs:
- Immediately after creating a new integration.
- Immediately after changing the settings of an existing integration.
- According to a regular schedule every several hours. Every 12 hours by default. The schedule can be changed.
Account data update tasks can be created manually.
To start a task to update KICS/KATA asset information for a tenant:
- In the KUMA web interface, open the Settings → KICS/KATA section.
- Select the relevant tenant.
This opens the KICS/KATA server integration window.
- Click the Import assets button.
A task to receive account data from the selected tenant is added to the Task manager section of the KUMA web interface.
Page top
Examples of asset field comparison during import
Each imported asset is compared to the matching KUMA asset.
Checking for two-field value match in the IP, MAC, and FQDN fields
Compared assets |
Compared fields |
||
|---|---|---|---|
FQDN |
IP |
MAC |
|
KUMA asset |
Filled in |
Filled in |
Empty |
Imported asset 1 |
Filled in, matching |
Filled in, matching |
Filled in |
Imported asset 2 |
Filled in, matching |
Filled in, matching |
Empty |
Imported asset 3 |
Filled in, matching |
Empty |
Filled in |
Imported asset 4 |
Empty |
Filled in, matching |
Filled in |
Imported asset 5 |
Filled in, matching |
Empty |
Empty |
Imported asset 6 |
Empty |
Empty |
Filled in |
Comparison results:
- Imported asset 1 and KUMA asset: the FQDN and IP fields are filled in and match, no conflict in the MAC fields between the two assets. The assets are merged.
- Imported asset 2 and KUMA asset: the FQDN and IP fields are filled in and match. The assets are merged.
- Imported asset 3 and KUMA asset: the FQDN and MAC fields are filled in and match, no conflict in the IP fields between the two assets. The assets are merged.
- Imported asset 4 and KUMA asset: the IP fields are filled in and match, no conflict in the FQDN and MAC fields between the two assets. The assets are merged.
- Imported asset 5 and KUMA asset: the FQDN fields are filled in and match, no conflict in the IP and MAC fields between the two assets. The assets are merged.
- Imported asset 6 and KUMA asset: no matching fields. The assets are not merged.
Checking for single-field value match in the IP, MAC, and FQDN fields
Compared assets |
Compared fields |
||
|---|---|---|---|
FQDN |
IP |
MAC |
|
KUMA asset |
Empty |
Filled in |
Empty |
Imported asset 1 |
Filled in |
Filled in, matching |
Yes |
Imported asset 2 |
Filled in |
Filled in, matching |
Empty |
Imported asset 3 |
Filled in |
Empty |
Filled in |
Imported asset 4 |
Empty |
Empty |
Filled in |
Comparison results:
- Imported asset 1 and KUMA asset: the IP fields are filled in and match, no conflict in the FQDN and MAC fields between the two assets. The assets are merged.
- Imported asset 2 and KUMA asset: the IP fields are filled in and match, no conflict in the FQDN and MAC fields between the two assets. The assets are merged.
- Imported asset 3 and KUMA asset: no matching fields. The assets are not merged.
- Imported asset 4 and KUMA asset: no matching fields. The assets are not merged.
Assigning a category to an asset
To assign a category to one asset:
- In the KUMA web interface, go to the Assets section.
- Select the category with the relevant assets.
The assets table is displayed.
- Select an asset.
- In the opened window, click the Edit button.
- In the Categories field, click the button.
- Select a category.
If you want to move an asset to the Uncategorized assets section, you must delete the existing categories for the asset by clicking the
button. - Click the Save button.
The category will be assigned.
To assign a category to multiple assets:
- In the KUMA web interface, go to the Assets section.
- Select the category with the relevant assets.
The assets table is displayed.
- Select the check boxes next to the assets for which you want to change the category.
- Click the Link to category button.
- In the opened window, select a category.
- Click the Save button.
The category will be assigned.
Do not assign the Categorized assets category to assets.
Linking a group of assets to a category
To link a group of assets to a category:
- In the Assets section of the KUMA web interface, select the check box in the heading of the table of assets.
- Select all assets visible on the page or all assets that match the selection condition.
The Link to category button becomes active and opens the available categories.
- Click the Link to category button and select one or more categories to link to.
- Click OK.
Assets are linked to the selected categories or folder.
Unlinking a group of assets from a category
To unlink a group of assets from a category:
- Select one category (tenant) in the navigation pane.
The list of assets in that category is displayed.
The Clean category button is added to the folder properties.
- In the context menu of the category, select Clean category.
A dialog box is displayed with a confirmation prompt and the number of assets that will be unlinked.
This option lets you unlink all assets in the selected category, not only those that are visible on the page. Assets in child categories are not unlinked.
- In the dialog box, click OK.
All selected assets aer unlinked from the selected category.
Editing the parameters of assets
In KUMA, you can edit asset parameters. All the parameters of manually added assets can be edited. For assets imported from Kaspersky Security Center, you can only change the name of the asset and its category.
To change the parameters of an asset:
- In the Assets section of the KUMA web interface, click the asset that you want to edit.
The Asset details area opens in the right part of the window.
- Click the Edit button.
The Edit asset window opens.
- Make the changes you need in the available fields:
- Asset name (required) This is the only field available for editing if the asset was imported from Kaspersky Security Center or KICS/KATA.
- IP address and/or FQDN (required) You can specify multiple FQDNs separated by commas.
- MAC address
- Owner
- Software info:
- OS name
- OS build
- Hardware info:
- Custom fields.
- CII category.
- Assign or change the category of the asset:
- Click the tree () button.
Select categories window opens.
- Select the check boxes next to the categories that should be assigned to the asset.
- Click Save.
The selected categories appear in the Categories fields.
You can also select the asset and then drag and drop it into the relevant category. This category will be added to the list of asset categories.
Do not assign the
Categorized assetscategory to assets. - Click the tree (
- Click the Save button.
Asset parameters have been changed.
Page top
Archiving assets
In KUMA, the archival functionality is available for the following types of assets:
- For assets imported from KSC and KICS.
If KUMA did not receive information about the asset, at the time of import, the asset is automatically archived and is stored in the database for the time specified in the Archived assets retention period setting. The default setting is 0 days. This means that archived assets are stored indefinitely. An archived asset becomes active if KUMA receives information about the asset from the source before the retention period for archived assets expires.
- Combined assets
When importing, KUMA performs a check for uniqueness among assets imported from KSC and KICS, and among manually added assets. If the fields of an imported asset and a manually added asset match, the assets are combined into a single asset, which is considered imported and can become archived.
Assets added manually in the console or using the API are not archived.
An asset becomes archived under the following conditions:
- KUMA did not receive information about the asset from Kaspersky Security Center or KICS/KATA.
- Disabled integration with Kaspersky Security Center.
If you disable integration with Kaspersky Security Center, the asset is considered active for 30 days. After 30 days, the asset is automatically archived and is stored in the database for the time specified in the Archived assets retention period.
An asset is not updated in the following cases:
- Information about the Kaspersky Security Center asset has not been updated for more than the retention period of archived assets.
- Information about the asset does not exist in Kaspersky Security Center or KICS/KATA.
- Connection with the Kaspersky Security Center server has not been established for more than 30 days.
Archived assets that participate in dynamic categorization remain archived. An archived asset can have its CII category assigned or changed. If such an asset ends up in an alert or incident, the CII category of the alert or incident also changes, which may affect the visibility of the alert or incident for users with restricted CII access.
To configure the archived assets retention period:
- In the KUMA web interface, select the Settings → Assets section.
This opens the Assets window.
- Enter the new value in the Archived assets retention period field.
The default setting is 0 days. This means that archived assets are stored indefinitely.
- Click Save.
The retention period for archived assets is configured.
Information about the archived asset remains available for viewing in the alert and incident card.
To view an archived asset card:
- In the KUMA web interface, select the Alerts or Incidents section.
A list of alerts or incidents is displayed.
- Open the alert or incident card linked to the archived asset.
You can view the information in the archived asset card.
Deleting assets
If you no longer need to receive information from an asset or information about the asset has not been updated for a long time, you can have KUMA delete the asset. Deletion can be performed by the General administrator, Tenant administrator, Tier 2 analysts, and Tier 1 analysts. If an asset was deleted, but KUMA once again begins receiving information about that asset from Kaspersky Security Center, KUMA recreates the asset with a new ID.
In KUMA, you can delete assets in the following ways:
- Automatically.
KUMA automatically deletes only archived assets. KUMA deletes an archived asset if the information about the asset has not been updated for longer than the retention period of archived assets.
- Manually.
To delete an asset manually:
- In KUMA web interface, in the Assets section, click the asset that you want to delete.
This opens the Asset information window in the right-hand part of the web interface.
- Click the Delete button.
A confirmation window opens.
- Click OK.
The asset is deleted and no longer appears in the alert or incident card.
Page top
Bulk deletion of assets
In the KUMA web interface, you can select multiple assets using a filter and delete all selected assets.
To delete assets, you must have rights to delete assets.
Bulk deletion of assets
To delete all selected assets:
- In the Assets section of the KUMA web interface, select the category that contains the relevant assets.
A table of assets is displayed.
- Select the check box in the heading of the table of assets.
You can delete all assets or all assets currently displayed on the page.
- Click Select all in page or Select all.
The Delete button becomes active.
- Click the Delete button.
This opens a window prompting you to confirm deletion and telling you that deleted assets will not be available in alerts, incidents, and widgets.
In the lower part of the page, the number of assets selected for deletion is displayed.
- Click OK.
If you clicked Select all, you must enter the displayed generated string into the text box in the window to confirm deletion.
All selected assets are deleted.
Deleting asset folders
To delete a folder, you can either unlink all assets from the folder (which unlinks the assets but not does not delete them) and then delete the folder itself, or delete all assets and then delete the folder.
Page top
Updating third-party applications and fixing vulnerabilities on Kaspersky Security Center assets
You can update third-party applications (including Microsoft applications) that are installed on Kaspersky Security Center assets, and fix vulnerabilities in these applications.
First you need to create the Install required updates and fix vulnerabilities task on the selected Kaspersky Security Center Administration Server with the following settings:
- Application—Kaspersky Security Center.
- Task type—Install required updates and fix vulnerabilities.
- Devices to which the task will be assigned—you need to assign the task to the root administration group.
- Rules for installing updates:
- Install approved updates only.
- Fix vulnerabilities with a severity level equal to or higher than (optional setting).
If this setting is enabled, updates fix only those vulnerabilities for which the severity level set by Kaspersky is equal to or higher than the value selected in the list (Medium, High, or Critical). Vulnerabilities with a severity level lower than the selected value are not fixed.
- Scheduled start—the task run schedule.
For details on how to create a task, please refer to the Kaspersky Security Center Help Guide.
The Install required updates and fix vulnerabilities task is available with a Vulnerability and Patch Management license.
Next, you need to install updates for third-party applications and fix vulnerabilities on assets in KUMA.
To install updates and fix vulnerabilities in third-party applications on an asset in KUMA:
- Open the asset details window in one of the following ways:
- In the KUMA web interface, select Assets → select a category with the relevant assets → select an asset.
- In the KUMA web interface, select Alerts → click the link with the relevant alert → select the asset in the Related endpoints section.
- In the KUMA web interface, select Events → search and filter events → select the relevant event → click the link in one of the following fields: SourceAssetID, DestinationAssetID, or DeviceAssetID.
- In the asset details window, expand the list of Kaspersky Security Center vulnerabilities.
- Select the check boxes next to the applications that you want to update.
- Click the Upload updates link.
- In the opened window, select the check box next to the ID of the vulnerability that you want to fix.
- If No is displayed in the EULA accepted column for the selected ID, click the Approve updates button.
- Click the link in the EULA URL column and carefully read the text of the End User License Agreement.
- If you agree to it, click the Accept selected EULAs button in the KUMA web interface.
The ID of the vulnerability for which the EULA was accepted shows Yes in the EULA accepted successfully column.
- Repeat steps 7–10 for each required vulnerability ID.
- Click OK.
Updates will be uploaded and installed on the assets managed by the Administration Server where the task was started, and on the assets of all secondary Administration Servers.
The terms of the End User License Agreement for updates and vulnerability patches must be accepted on each secondary Administration Server separately.
Updates are installed on assets where the vulnerability was detected.
You can update the list of vulnerabilities for an asset in the asset details window by clicking the Update link.
Page top
Moving assets to a selected administration group
You can move assets to a selected administration group of Kaspersky Security Center. In this case, the group policies and tasks will be applied to the assets. For more details on Kaspersky Security Center tasks and policies, please refer to the Kaspersky Security Center Help Guide.
Administration groups are added to KUMA when the hierarchy is loaded during import of assets from Kaspersky Security Center. First, you need to configure KUMA integration with Kaspersky Security Center.
To move an asset to a selected administration group:
- Open the asset details window in one of the following ways:
- In the KUMA web interface, select Assets → select a category with the relevant assets → select an asset.
- In the KUMA web interface, select Alerts → click the link with the relevant alert → select the asset in the Related endpoints section.
- In the asset details window, click the Move to KSC group button.
- Click the Move to KSC group button.
- Select the group in the opened window.
The selected group must be owned by the same tenant as the asset.
- Click the Save button.
The selected asset will be moved.
To move multiple assets to a selected administration group:
- In the KUMA web interface, select the Assets section.
- Select the category with the relevant assets.
- Select the check boxes next to the assets that you want to move to the group.
- Click the Move to KSC group button.
The button is active if all selected assets belong to the same Administration Server.
- Select the group in the opened window.
- Click the Save button.
The selected assets will be moved.
The specific group of an asset is displayed in the asset details.
Kaspersky Security Center assets information is updated in KUMA when information about assets is imported from Kaspersky Security Center. This means that a situation may arise when assets have been moved between administration groups in Kaspersky Security Center, but this information is not yet displayed in KUMA. When an attempt is made to move such an asset to an administration group in which it is already located, KUMA returns the Failed to move assets to another KSC group error.
Page top
Asset audit
KUMA can be configured to generate asset audit events under the following conditions:
- Asset was added to KUMA. The application monitors manual asset creation, as well as creation during import via the REST API and during import from Kaspersky Security Center or KICS/KATA.
- Asset parameters have been changed. A change in the value of the following asset fields is monitored:
- Name
- IP address
- MAC address
- FQDN
- Operating system
Fields may be changed when an asset is updated during import.
- Asset was deleted from KUMA. The application monitors manual deletion of assets, as well as automatic deletion of assets imported from Kaspersky Security Center and KICS/KATA, whose data stopped coming.
- Vulnerability info was added to the asset. The application monitors the appearance of new vulnerability data for assets. Information about vulnerabilities can be added to an asset, for example, when importing assets from Kaspersky Security Center or KICS/KATA.
- Asset vulnerability was resolved. The application monitors the removal of vulnerability information from an asset. A vulnerability is considered to be resolved if data about this vulnerability is no longer received from any sources from which information about its occurrence was previously obtained.
- Asset was added to a category. The application monitors the assignment of an asset category to an asset.
- Asset was removed from a category. The application monitors the deletion of an asset from an asset category.
By default, if asset audit is enabled, under the conditions described above, KUMA creates not only audit events (Type = 4), but also base events (Type = 1).
Asset audit events can be sent to storage or to correlators, for example.
Configuring an asset audit
To configure an asset audit:
- In the KUMA web interface, open Settings → Asset audit.
- Perform one of the following actions with the tenant for which you want to configure asset audit:
- Add the tenant by using the Add tenant button if this is the first time you are configuring asset audit for the relevant tenant.
In the opened Asset audit window, select a name for the new tenant.
- Select an existing tenant in the table if asset audit has already been configured for the relevant tenant.
In the opened Asset audit window, the tenant name is already defined and cannot be edited.
- Clone the settings of an existing tenant to create a copy of the conditions configuration for the tenant for which you are configuring asset audit for the first time. To do so, select the check box next to the tenant whose configuration you need to copy and click Clone. In the opened Asset audit window, select the name of the tenant to use the copied configuration.
- Add the tenant by using the Add tenant button if this is the first time you are configuring asset audit for the relevant tenant.
- For each condition for generating asset audit events, select the destination to where the created events will be sent:
- In the settings block of the relevant type of asset audit events, use the Add destination drop-down list to select the type of destination to which the created events should be sent:
- Select Storage if you want events to be sent to storage.
- Select Correlator if you want events to be sent to the correlator.
- Select Other if you want to select a different destination.
This type of resource includes correlator and storage services that were created in previous versions of the program.
In the Add destination window that opens you must define the settings for event forwarding.
- Use the Destination drop-down list to select an existing destination or select Create if you want to create a new destination.
If you are creating a new destination, fill in the settings as indicated in the destination description.
- Click Save.
A destination has been added to the condition for generating asset audit events. Multiple destinations can be added for each condition.
- In the settings block of the relevant type of asset audit events, use the Add destination drop-down list to select the type of destination to which the created events should be sent:
- Click Save.
The asset audit has been configured. Asset audit events will be generated for those conditions for which destinations have been added. Click Save.
Page top
Storing and searching asset audit events
Asset audit events are considered to be base events and do not replace audit events. Asset audit events can be searched based on the following parameters:
Event field |
Value |
DeviceVendor |
|
DeviceProduct |
|
DeviceEventCategory |
|
Enabling and disabling an asset audit
You can enable or disable asset audit for a tenant:
To enable or disable an asset audit for a tenant:
- In the KUMA web interface, open the Settings → Asset audit section and select the tenant for which you want to enable or disable asset audit.
The Asset audit window opens.
- Select or clear the Disabled check box in the upper part of the window.
- Click Save.
By default, when asset audit is enabled in KUMA, when an audit condition occurs, two types of events are simultaneously created: a base event and an audit event.
You can disable the generation of base events with audit events.
To enable or disable the creation of base events for an individual condition:
- In the KUMA web interface, open the Settings → Asset audit section and select the tenant for which you want to enable or disable a condition for generating asset audit events.
The Asset audit window opens.
- Select or clear the Disabled check box next to the relevant conditions.
- Click Save.
For conditions with the Disabled check box selected, only audit events are created, and base events are not created.
Page top
Custom asset fields
In addition to the existing fields of the asset data model, you can create custom asset fields. Data from the custom asset fields is displayed when you view information about the asset. Custom fields can be filled in with data either manually or using the API.
You can create or edit the custom fields in the KUMA web interface in the Settings → Assets section, in the Custom fields table. The table has the following columns:
- Name – the name of the custom field that is displayed when you view information about the asset.
- Default value – the value that is written to the custom field when an asset is added to KUMA.
- Mask – a regular expression to which the value in the custom field must match.
To create a custom asset field:
- In the KUMA web interface, in the Settings → Assets section, click the Add field button.
An empty row is added to the Custom fields table. You can add multiple rows with the custom field settings at once.
- Fill in the columns with the settings of the custom field:
- Name (required)–from 1 to 128 characters in Unicode encoding.
- Default value–from 1 to 1,024 Unicode characters.
- Mask–from 1 to 1,024 Unicode characters.
- Click Save.
A custom field is added to the asset data model.
To delete or edit a custom asset field:
- In the KUMA web interface, open Settings → Assets.
- Make the necessary changes in the Custom fields table:
- To delete a custom field, click the icon next to the row with the settings of the required field. Deleting a field also deletes the data written in this field for all assets.
- You can change the values of the field settings. Changing the default value does not affect the data written in the asset fields before.
- To change the display order of the fields, drag the lines with the mouse by the icon
- To delete a custom field, click the
- Click Save.
The changes are made.
Page top
Critical information infrastructure assets
In KUMA, you can tag assets related to the critical information infrastructure (CII) of the Russian Federation. This allows you to restrict the KUMA users capabilities to handle alerts and incidents, which are associated with the assets related to the CII objects.
You can assign the CII category to assets if the license with the GosSOPKA module is active in KUMA.
General administrators and users with the Access to CII facilities check box selected in their profiles can assign the CII category to an asset. If none of these conditions are met, the following restrictions apply to the user:
- The CII category group of settings is not displayed in the Asset details and Edit asset windows. You cannot view or change the CII category of an asset.
- Alerts and incidents associated with the assets of the CII category are not available for viewing. You cannot perform any actions on such alerts and incidents; they are not displayed in the table of alerts and incidents.
- The CII column is not displayed in the Alerts and Incidents tables.
- Search and closing of the alerts using the REST API is not available.
The CII category of an asset is displayed in the Asset details window in the CII category group of settings.
To change the CII category of an asset:
- In the KUMA web interface, in the Assets section, select the required asset.
The Asset details window opens.
- Click the Edit button and select one of the available values in the drop-down list:
- Information resource is not a CII object – default value, indicating that the asset does not have a CII category. The users with the Access to CII facilities check box cleared in their profiles can work with such assets and the alerts and incidents related to these assets.
- CII object without a significance category.
- CII object of the third category of significance.
- CII object of the second category of significance.
- CII object of the first category of significance.
- Click Save.
Integration with other solutions
In this section, you'll learn how to integrate KUMA with other solutions to enrich its functionality.
Integration with Kaspersky Security Center
You can configure integration with selected Kaspersky Security Center servers for one, several, or all KUMA tenants. If Kaspersky Security Center integration is enabled, you can import information about the assets protected by this application, manage assets using tasks, and import events from the Kaspersky Security Center event database.
First, you need to make sure that the relevant Kaspersky Security Center server allows an incoming connection for the server hosting KUMA.
Configuring KUMA integration with Kaspersky Security Center includes the following steps:
- Creating a user account in the Kaspersky Security Center Administration Console
The credentials of this account are used when creating a secret to establish a connection with Kaspersky Security Center.
The secret (account role in Kaspersky Security Center) for integrating KUMA with Kaspersky Security Center must be created with consideration of how the hierarchy of the Administration Server is organized (availability of virtual servers, server administration features, etc) and types of devices that the Administration Server will manage (OS, type: servers, mobile devices, etc). All these nuances are regulated and configured on the Kaspersky Security Center side.
The following actions can be performed in KUMA on assets from Kaspersky Security Center:
- Starting a task of the Update type.
- Starting a task of the Virus Scan type.
- Moving assets between Kaspersky Security Center groups.
- Accepting software updates (to fix a vulnerability of an asset in Kaspersky Security Center).
To be able to perform the actions listed above, you can use a predefined account in Kaspersky Security Center with the Main Administrator role. In this case, you do not need to add permissions manually.
You can also use the "Kaspersky Endpoint Security Administrator" predefined role in Kaspersky Security Center, but in that case, you must additionally grant access to the following functionality:
- Management of administration groups
- Vulnerability and patch management
Some additional permissions may be required depending on the configuration of Kaspersky Security Center.
Minimum permissions for integration with Kaspersky Security Center:
- "Access objects regardless of their ACLs" allows you to import Kaspersky Security Center assets into KUMA.
- "Management of administration groups" allows you to move assets between groups in Kaspersky Security Center from the KUMA interface.
- "Basic functionality" allows you to create and run tasks on Kaspersky Endpoint Security hosts.
For more details about creating a user account and assigning permissions to a user, please refer to the Kaspersky Security Center Help Guide.
- Creating a secret of the credentials type for connecting to Kaspersky Security Center
- Configuring Kaspersky Security Center integration settings
- Creating a connection to the Kaspersky Security Center server for importing information about assets
If you want to import information about assets registered on Kaspersky Security Center servers into KUMA, you need to create a separate connection to each Kaspersky Security Center server for each selected tenant.
If integration is disabled for the tenant or there is no connection to Kaspersky Security Center, an error is displayed in the KUMA web interface when attempting to import information about assets. In this case, the import process does not start.
Configuring Kaspersky Security Center integration settings
To configure the settings for integration with Kaspersky Security Center:
- Open the KUMA web interface and select Settings → Kaspersky Security Center.
The Kaspersky Security Center integration by tenant window opens.
- Select the tenant for which you want to configure integration with Kaspersky Security Center.
The Kaspersky Security Center integration window opens.
- Enable or disable integration with Kaspersky Security Center for the tenant:
- If you want to enable integration, clear the Disabled check box.
- If you want to disable integration, select the Disabled check box.
This check box is cleared by default.
- Specify intervals for automatic import of asset information and asset vulnerability information from Kaspersky Security Center:
- In the KSC assets, hardware information field, enter the interval in hours for the automatic import of information about the basic attributes of assets (protection status, anti-virus database version, hardware). and must be an integer. The default setting is
1(1 hour). - In the KSC assets attributes (vulnerabilities, software, owners) field, enter the interval in hours for automatic import of information about other attributes of assets (vulnerabilities, software, owners). and must be an integer. The default setting is
12(12 hours).Importing the information about asset attributes (vulnerabilities, software, owners) may involve downloading a large amount of data, which may take a longer time to complete, we recommend setting a longer interval than for the hardware information import.
If necessary, you can manually import asset information and asset vulnerability information from Kaspersky Security Center.
- In the KSC assets, hardware information field, enter the interval in hours for the automatic import of information about the basic attributes of assets (protection status, anti-virus database version, hardware). and must be an integer. The default setting is
- Click the Save button.
The Kaspersky Security Center integration settings for the selected tenant will be configured.
If the tenant you need is missing from the list of tenants, you need to add the tenant to the list of tenants.
Page top
Adding a tenant to the list for Kaspersky Security Center integration
To add a tenant to the list of tenants for integration with Kaspersky Security Center:
- Open the KUMA web interface and select Settings → Kaspersky Security Center.
The Kaspersky Security Center integration by tenant window opens.
- Click the Add tenant button.
The Kaspersky Security Center integration window opens.
- In the Tenant drop-down list, select the tenant that you need to add.
- Click the Save button.
The selected tenant will be added to the list of tenants for integration with Kaspersky Security Center.
Page top
Creating Kaspersky Security Center connection
To create a new Kaspersky Security Center connection:
- Open the KUMA web interface and select Settings → Kaspersky Security Center.
The Kaspersky Security Center integration by tenant window opens.
- Select the tenant for which you want to create a connection to Kaspersky Security Center.
- Click the Add connection button and define the values for the following settings:
- Name (required)—the name of the connection. The name can contain 1 to 128 Unicode characters.
- URL (required)—the URL of the Kaspersky Security Center server in hostname:port or IPv4:port format.
- In the Secret drop-down list, select the secret with the Kaspersky Security Center account credentials or create a new secret.
- Click the plus (
 ) icon.
The secret window is displayed.
- Enter information about the secret:
- In the Name field, choose a name for the added secret.
- In the Tenant drop-down list, select the tenant that will own the Kaspersky Security Center account credentials.
- In the Type drop-down list, select credentials.
- In the User and Password fields, enter the account credentials for your Kaspersky Security Center server.
- If you want, enter a Description of the secret.
- Click Save.
You can change the selected secret by clicking
 .
. - Click the plus (
- Disabled—the state of the connection to the selected Kaspersky Security Center server. If the check box is selected, the connection to the selected server is inactive. If this is the case, you cannot use this connection to connect to the Kaspersky Security Center server.
This check box is cleared by default.
- If you want KUMA to import only assets that are connected to secondary servers or included in groups:
- Click the Load hierarchy button.
- Select the check boxes next to the names of the secondary servers and groups from which you want to import asset information.
- If you want to import assets only from new groups, select the Import assets from new groups check box.
If no check boxes are selected, information about all assets of the selected Kaspersky Security Center server is uploaded during the import.
- Click Save.
The connection to the Kaspersky Security Center server is now created. It can be used to import information about assets from Kaspersky Security Center to KUMA and to create asset-related tasks in Kaspersky Security Center from KUMA.
Page top
Editing Kaspersky Security Center connection
To edit a Kaspersky Security Center connection:
- Open the KUMA web interface and select Settings → Kaspersky Security Center.
The Kaspersky Security Center integration by tenant window opens.
- Select the tenant for which you want to configure integration with Kaspersky Security Center.
The Kaspersky Security Center integration window opens.
- Click the Kaspersky Security Center connection you want to change.
The window with the selected Kaspersky Security Center connection parameters opens.
- Make the necessary changes to the settings.
- Click the Save button.
The Kaspersky Security Center connection will be changed.
Page top
Deleting Kaspersky Security Center connection
To delete a Kaspersky Security Center connection:
- Open the KUMA web interface and select Settings → Kaspersky Security Center.
The Kaspersky Security Center integration by tenant window opens.
- Select the tenant for which you want to configure integration with Kaspersky Security Center.
The Kaspersky Security Center integration window opens.
- Select the Kaspersky Security Center connection that you want to delete.
- Click the Delete button.
The Kaspersky Security Center connection will be deleted.
Page top
Importing events from the Kaspersky Security Center database
In KUMA, you can receive events from the Kaspersky Security Center SQL database. Events are received using the collector, which uses the following resources:
- Predefined [OOTB] KSC MSSQL, [OOTB] KSC MySQL, or [OOTB] KSC PostgreSQL connector.
- Predefined [OOTB] KSC from SQL normalizer.
Configuring the import of events from Kaspersky Security Center involves the following steps:
- Create a copy of the predefined connector.
The settings of the predefined connector are not editable, therefore, to configure the connection to the database server, you must create a copy of the predefined connector.
- Creating a collector:
- In the web interface.
- On the server.
To configure the import of events from Kaspersky Security Center:
- Create a copy of the predefined connector corresponding to the type of database used by Kaspersky Security Center:
- In the KUMA web interface, in the Resources → Connectors section, find the relevant predefined connector in the folder hierarchy, select the check box next to that connector, and click Duplicate.
- This opens the Create connector window; in that window, on the Basic settings tab, in the Default query field, if necessary, replace the KAV database name with the name of the Kaspersky Security Center database you are using.
An example of a query to the Kaspersky Security Center SQL database
- Place the cursor in the URL field and in the displayed list, click in the line of the secret that you are using.
- This opens the Secret window; in that window, in the URL field, specify the server connection address in the following format:
sqlserver://user:password@kscdb.example.com:1433/databasewhere:
user—user account with public and db_datareader rights to the required database.password—user account password.kscdb.example.com:1433—address and port of the database server.database—name of the Kaspersky Security Center database. 'KAV' by default.
Click Save.
- In the Create connector window, in the Connection section, in the Query field, replace the 'KAV' database name with the name of the Kaspersky Security Center database you are using.
You must do this if you want to use the ID column to which the query refers.
Click Save.
- Install the collector in the web interface:
- Start the Collector Installation Wizard in one of the following ways:
- In the KUMA web interface, in the Resources section, click Add event source.
- In the KUMA web interface in the Resources → Collectors section click Add collector.
- At step 1 of the Installation Wizard, Connect event sources, specify the collector name and select the tenant.
- At step 2 of the Installation Wizard, Transport, select the copy of the connector that you created at step 1.
- At step 3 of the Installation Wizard, Event parsing, on the Parsing schemes tab, click Add event parsing.
- This opens the Basic event parsing window; in that window, on the Normalization scheme tab, select [OOTB] KSC from SQL in the Normalizer drop-down list and click OK.
- If necessary, specify the other settings in accordance with your requirements for the collector. For the purpose of importing events, editing settings at the remaining steps of the Installation Wizard is optional.
- At step 8 of the Installation Wizard, Setup validation, click Create and save service.
The lower part of the window displays the command that you must use to install the collector on the server. Copy this command to the clipboard.
- Close the Collector Installation Wizard by clicking Save collector.
- Start the Collector Installation Wizard in one of the following ways:
- Install the collector on the server.
To do so, on the server on which you want to receive Kaspersky Security Center events, run the command that you copied to the clipboard after creating the collector in the web interface.
As a result, the collector is installed and can receive events from the SQL database of Kaspersky Security Center.
You can view Kaspersky Security Center events in the Events section of the web interface.
Page top
Kaspersky Endpoint Detection and Response integration
Kaspersky Endpoint Detection and Response (hereinafter also referred to as "KEDR") is a functional unit of Kaspersky Anti Targeted Attack Platform that protects assets in an enterprise LAN.
You can configure KUMA integration with Kaspersky Endpoint Detection and Response 4.0 or later to manage threat response actions on assets connected to Kaspersky Endpoint Detection and Response servers, and on Kaspersky Security Center assets. Commands to perform operations are received by the Kaspersky Endpoint Detection and Response server, which then relays those commands to the Kaspersky Endpoint Agent installed on assets.
To manage Kaspersky Endpoint Detection and Response actions on Kaspersky Security Center assets, the fully qualified domain name (FQDN) must be specified for the asset in the system (the "Full device name" field). Otherwise, no response actions can be started.
You can also import events to KUMA and receive information about Kaspersky Endpoint Detection and Response alerts (for more details, see the Configuring integration with an SIEM system section of the Kaspersky Anti Targeted Attack Platform online help).
When KUMA is integrated with Kaspersky Endpoint Detection and Response, you can perform the following operations on Kaspersky Endpoint Detection and Response assets that have Kaspersky Endpoint Agent:
- Manage network isolation of assets.
- Manage prevention rules.
- Start applications.
To get instructions on configuring integration for response action management, contact your account manager or Technical Support.
Importing Kaspersky Endpoint Detection and Response events using the kafka connector
When importing events from Kaspersky Endpoint Detection and Response, telemetry is transmitted in clear text and may be intercepted by an intruder.
Kaspersky Endpoint Detection and Response 4.0, 4.1, 5.0, and 5.1 events can be imported to KUMA using a Kafka connector.
Several limitations are applicable to the import of events from Kaspersky Endpoint Detection and Response 4.0 and 4.1:
- Import of events is available if the KATA and KEDR license keys are used in Kaspersky Endpoint Detection and Response.
- Import of events is not available if the Sensor component installed on a separate server is used as part of Kaspersky Endpoint Detection and Response.
To import events, perform the actions in Kaspersky Endpoint Detection and Response and in KUMA.
Importing events from Kaspersky Endpoint Detection and Response 4.0 or 4.1
To import Kaspersky Endpoint Detection and Response 4.0 or 4.1 events to KUMA:
In Kaspersky Endpoint Detection and Response:
- Use SSH or a terminal to log in to the management console of the Central Node server from which you want to export events.
- When prompted by the system, enter the administrator account name and the password that was set during installation of Kaspersky Endpoint Detection and Response.
The application component administrator menu is displayed.
- In the application component administrator menu, select Technical Support Mode.
- Press Enter.
The Technical Support Mode confirmation window opens.
- Confirm that you want to operate the application in Technical Support Mode. To do so, select Yes and press Enter.
- Run the following command:
sudo -i - In the
/etc/sysconfig/apt-servicesconfiguration file, in theKAFKA_PORTSfield, delete the value10000.If Secondary Central Node servers or the Sensor component installed on a separate server are connected to the Central Node server, you need to allow the connection with the server where you modified the configuration file via port 10000.
We do not recommend using this port for any external connections other than KUMA. To restrict connections over port 10000 only for KUMA, run the following command:
iptables -I INPUT -p tcp ! -s KUMA_IP_address --dport 10000 -j DROP - In the configuration file
/usr/bin/apt-start-sedr-iptablesadd the value10000in theWEB_PORTSfield, separated by a comma without a space. - Run the following command:
sudo sh /usr/bin/apt-start-sedr-iptables
Preparations for exporting events on the Kaspersky Endpoint Detection and Response side are now complete.
In KUMA:
- On the KUMA server, add the IP address of the Central Node server in the format
<IP address> centralnodeto one of the following files:%WINDIR%\System32\drivers\etc\hosts—for Windows./etc/hosts file—for Linux.
- In the KUMA web interface, create a connector of the Kafka type.
When creating a connector, specify the following parameters:
- In the URL field, specify
<Central Node server IP address>:10000. - In the Topic field, specify
EndpointEnrichedEventsTopic. - In the Consumer group field, specify any unique name.
- In the URL field, specify
- In the KUMA web interface, create a collector.
Use the connector created at the previous step as the transport for the collector. Use "[OOTB] KEDR telemetry" as the normalizer for the collector.
If the collector is successfully created and installed, Kaspersky Endpoint Detection and Response events will be imported into KUMA. You can find and view these events in the events table.
Importing events from Kaspersky Endpoint Detection and Response 5.0 and 5.1
Several limitations apply when importing events from Kaspersky Endpoint Detection and Response 5.0 and 5.1:
- Import of events is available only for the non-high-availability version of Kaspersky Endpoint Detection and Response.
- Import of events is available if the KATA and KEDR license keys are used in Kaspersky Endpoint Detection and Response.
- Import of events is not available if the Sensor component installed on a separate server is used as part of Kaspersky Endpoint Detection and Response.
To import Kaspersky Endpoint Detection and Response 5.0 or 5.1 events to KUMA:
In Kaspersky Endpoint Detection and Response:
- Use SSH or a terminal to log in to the management console of the Central Node server from which you want to export events.
- When prompted by the system, enter the administrator account name and the password that was set during installation of Kaspersky Endpoint Detection and Response.
The application component administrator menu is displayed.
- In the application component administrator menu, select Technical Support Mode.
- Press Enter.
The Technical Support Mode confirmation window opens.
- Confirm that you want to operate the application in Technical Support Mode. To do so, select Yes and press Enter.
- In the
/usr/local/lib/python3.8/dist-packages/firewall/create_iptables_rules.pyconfiguration file, specify the additional port10000for theWEB_PORTSconstant:WEB_PORTS = f'10000,80,{AppPort.APT_AGENT_PORT},{AppPort.APT_GUI_PORT}'You do not need to perform this step for Kaspersky Endpoint Detection and Response 5.1 because the port is specified by default. - Run the following commands:
kata-firewall stopkata-firewall start --cluster-subnet <network mask for addressing cluster servers>
Preparations for exporting events on the Kaspersky Endpoint Detection and Response side are now complete.
In KUMA:
- On the KUMA server, add the IP address of the Central Node server in the format
<IP address> kafka.services.external.dyn.katato one of the following files:%WINDIR%\System32\drivers\etc\hosts—for Windows./etc/hosts file—for Linux.
- In the KUMA web interface, create a connector of the Kafka type.
When creating a connector, specify the following parameters:
- In the URL field, specify
<Central Node server IP address>:10000. - In the Topic field, specify
EndpointEnrichedEventsTopic. - In the Consumer group field, specify any unique name.
- In the URL field, specify
- In the KUMA web interface, create a collector.
Use the connector created at the previous step as the transport for the collector. It is recommended to use the [OOTB] KEDR telemetry normalizer as the normalizer for the collector.
If the collector is successfully created and installed, Kaspersky Endpoint Detection and Response events will be imported into KUMA. You can find and view these events in the events table.
Page top
Importing Kaspersky Endpoint Detection and Response events using the kata/edr connector
To use the kata/edr connector to import events of Kaspersky Endpoint Detection and Response 5.1 or earlier from hosts:
- Configure event receipt on the KUMA side. To do this, in KUMA, create and install a collector with the 'kata/edr' connector or edit an existing collector, then save the modified settings and restart the collector.
- On the KEDR side, accept the authorization request from KUMA to begin receiving events in KUMA.
As a result, the integration is configured and KEDR events start arriving in KUMA.
Creating a collector for receiving events from KEDR
To create a collector for receiving events from KEDR:
- In KUMA → Resources → Collectors, select Add collector.
- This opens the Create collector window; in that window, at step 1 Connect event sources, specify an arbitrary Collector name and in the drop-down list, select the appropriate Tenant.
- At step 2 Transport:
- On the Basic settings tab:
- In the Connector field, select Create or start typing the name of the connector if you want to use a previously created connector.
- In the Connector type drop-down list, select the kata/edr connector. After you select the kata/edr connector type, more fields to fill in are displayed.
- In the URL field, specify the address for connecting to the KEDR server in the following <
name or IP address of the host>:<connection port, 443 by default> format. If the KEDR solution is deployed in a cluster, you can click Add to add all nodes. KUMA will connect to each specified node in sequence. If the KEDR solution is installed in a distributed configuration, on the KUMA side, you must configure a separate collector for each KEDR server. - In the Secret field, select Create to create a new secret. This opens the Create secret window; in that window, specify the Name and click Generate and download a certificate and private encryption key.
As a result, the certificate.zip archive is downloaded to the browser's Downloads folder; the archive contains the 'key.pem' key file and the 'cert.pem' certificate file. Extract the archive. Click Upload certificate and select the cert.pem file. Click Upload private key and select the key.pem file. Click Create; the secret is added to the Secret drop-down list is automatically selected.
You can also select the created secret from the Secret list. KUMA uses the selected secret to connect to KEDR.
- The External ID field contains the ID for external systems. This ID is displayed in the KEDR web interface when authorizing the KUMA server. KUMA generates an ID automatically and the External ID field is automatically pre-populated.
- On the Advanced settings tab:
- To get detailed information in the collector log, move the Debug toggle switch to the enabled position.
- If necessary, in the Character encoding field, select the encoding of the source data to be converted to UTF-8. We only recommend configuring a conversion if you find invalid characters in the fields of the normalized event. By default, no value is selected.
- Specify the maximum Number of events per one request to KEDR. The default value is 0, which means that KUMA uses the value specified on the KEDR server. For details, refer to KATA Help. You can specify an arbitrary value that must not exceed the value on the KEDR side. If the value you specify exceeds the value of the Maximum number of events setting specified on the KEDR server, the KUMA collector log displays the Bad Request: max_events N is greater than the allowed value error.
- Fill in the Events fetch timeout field to receive events after a specified period of time. The default value is 0. This means that the default value of the KEDR server is applied. For details, please refer to KATA Help. This field specifies the time after which the KEDR server must send events to KUMA. The KEDR server uses two parameters: the maximum number of events and the events fetch timeout. Events are sent when the specified number of events is collected or the configured time elapses, whichever happens first. If the specified time has elapsed, but the specified number of events has not been collected, the KEDR server sends the events that it already has, without waiting for more.
- In the Client timeout field, specify how long KUMA must wait for a response from the KEDR server, in seconds. Default value: 1,800 s; displayed as 0. The client-side limit is specified in the Client timeout field. The Client timeout must be greater than the server's Events fetch timeout to wait for the server's response without interrupting the current event collection task with a new request. If the response from the KEDR server does not arrive in the end, KUMA repeats the request.
- In the KEDRQL filter field, specify the conditions for filtering the request. As a result, pre-filtered events are received from KEDR. For details about available filter fields, please refer to the KATA Help.
- On the Basic settings tab:
- At step 3 Parsing, click Add event parsing and select the "[ООТВ] KEDR telemetry" normalizer in the Basic event parsing window.
- To finish creating the collector in the web interface, click Create and save service. Then copy the collector installation command from the web interface and run this installation command on the command line on the server where you want to install the collector.
If you were editing an existing collector, click Save and restart services.
As a result, the collector is created and is ready to send requests; the collector is displayed in the Resources → Active services section with the yellow status until KEDR accepts an authorization request from KUMA.
Authorizing KUMA on the KEDR side
After the collector is created in KUMA, for requests from KUMA to start arriving to KEDR, the KUMA authorization request must be accepted on the KEDR side. With the authorization request accepted, the KUMA collector automatically sends scheduled requests to KEDR and waits for a response. While waiting, the status of the collector is yellow, and after receiving the first response to a request, the status of the collector turns green.
As a result, the integration is configured and you can view events arriving from KEDR in the KUMA → Events section.
The initial request fetches part of the historical events that had occurred before the integration was configured. Current events begin arriving after all of the historical events. If you change the value of the URL setting or the External ID of an existing collector, KEDR treats the next request as an initial request, and after starting the KUMA collector with the modified settings, you will receive part of the historical events all over again. If you do not want to receive historical events, go to the settings of the relevant collector, configure the mapping of the KEDR and KUMA timestamp fields in the normalizer, and specify a filter by timestamp at the 'Event filtering' step of the collector Installation Wizard — the timestamp of the event must be greater than the timestamp when the collector is started.
Possible errors and solutions
If in the collector log, you see the Conflict: An external system with the following ip and certificate digest already exists. Either delete it or provide a new certificate error, create a new secret with a new certificate in the connector of the collector.
If in the collector log, you see the Continuation token not found error in response to an event request, create a new connector, attach it to the collector and restart the collector; alternatively, create a new secret with a new certificate in the connector of the collector. If you do not want to receive events generated before the error occurred, configure a Timestamp filter in the collector.
Page top
Configuring the display of a link to a Kaspersky Endpoint Detection and Response detection in KUMA event details
When Kaspersky Endpoint Detection and Response detections are received, KUMA creates an alert for each detection. You can configure the display of a link to a Kaspersky Endpoint Detection and Response detection in KUMA alert information.
You can configure the display of a detection link if you use only one Central Node server in Kaspersky Endpoint Detection and Response. If Kaspersky Endpoint Detection and Response is used in a distributed solution mode, it is impossible to configure the display of the links to Kaspersky Endpoint Detection and Response detections in KUMA.
To configure the display of a link to a detection in KUMA alert details, you need to complete steps in the Kaspersky Endpoint Detection and Response web interface and KUMA.
In the Kaspersky Endpoint Detection and Response web interface, you need to configure the integration of the application with KUMA as a SIEM system. For details on configuring integration, refer to the Kaspersky Anti Targeted Attack Platform documentation, Configuring integration with a SIEM system section.
Configuring the display of a link in the KUMA web interface includes the following steps:
- Adding an asset that contains information about the Kaspersky Endpoint Detection and Response Central Node server from which you want to receive detections, and assigning a category to that asset.
- Creating a correlation rule.
- Creating a correlator.
You can use a pre-configured correlation rule. In this case configuring the display of a link in the KUMA web interface includes the following steps:
- Creating a correlator.
Select the
[OOTB] KATA Alertcorrelation rule. - Adding an asset that contains information about the Kaspersky Endpoint Detection and Response Central Node server from which you want to receive detections and assigning a category
KATA standAloneto that asset.
Step 1. Adding an asset and assigning a category to it
First, you need to create a category that will be assigned to the asset being added.
To add a category:
- In the KUMA web interface, select the Assets section.
- On the All assets tab, expand the category list of the tenant by clicking
 next to its name.
 - Select the required category or subcategory and click the Add category button.
The Add category details area appears in the right part of the web interface window.
- Define the category settings:
- In the Name field, enter the name of the category.
- In the Parent field, indicate the position of the category within the categories tree hierarchy. To do so, click the button and select a parent category for the category you are creating.
Selected category appears in Parent fields.
- If required, define the values for the following settings:
- Assign a severity to the category in the Severity drop-down list.
The specified severity is assigned to correlation events and alerts associated with the asset.
- If required, add a description for the category in the Description field.
- In the Categorization kind drop-down list, select how the category will be populated with assets. Depending on your selection, you may need to specify additional settings:
- Manually—assets can only be manually linked to a category.
- Active—assets will be assigned to a category at regular intervals if they satisfy the defined filter.
- Reactive—the category will be filled with assets by using correlation rules.
- Assign a severity to the category in the Severity drop-down list.
- Click the Save button.
To add an asset:
- In the KUMA web interface, select the Assets section.
- Click the Add asset button.
The Add asset details area opens in the right part of the window.
- Define the following asset parameters:
- In the Asset name field, enter an asset name.
- In the Tenant drop-down list, select the tenant that will own the asset.
- In the IP address field, specify the IP address of the Kaspersky Endpoint Detection and Response Central Node server from which you want to receive detections.
- In the Categories field, select the category that you added in the previous step.
If you are using a predefined correlation rule, you need to select the
KATA standAlonecategory. - If required, define the values for the following fields:
- In the FQDN field, specify the Fully Qualified Domain Name of the Kaspersky Endpoint Detection and Response server.
- In the MAC address field, specify the MAC address of the Central Node Kaspersky Endpoint Detection and Response Central Node server.
- In the Owner field, define the name of the asset owner.
- Click the Save button.
Step 2. Adding a correlation rule
To add a correlation rule:
- In the KUMA web interface, select the Resources section.
- Select Correlation rules and click the Create correlation rule button.
- On the General tab, specify the following settings:
- In the Name field, define the rule name.
- In the Type drop-down list, select simple.
- In the Propagated fields field, add the following fields: DeviceProduct, DeviceAddress, EventOutcome, SourceAssetID, DeviceAssetID.
- If required, define the values for the following fields:
- In the Rate limit field, define the maximum number of times per second that the rule will be triggered.
- In the Severity field, define the severity of alerts and correlation events that will be created as a result of the rule being triggered.
- In the Description field, provide any additional information.
- On the Selectors → Settings tab, specify the following settings:
- In the Filter drop-down list, select Create new.
- In the Conditions field, click the Add group button.
- In the operator field for the group you added, select AND.
- Add a condition for filtering by KATA value:
- In the Conditions field, click the Add condition button.
- In the condition field, select If.
- In the Left operand field, select Event fields.
- In the Event fields field, select DeviceProduct.
- In the Operator field, select =.
- In the Right operand field, select Constant.
- In the value field, enter KATA.
- Add a category filter condition:
- In the Conditions field, click the Add condition button.
- In the condition field, select If.
- In the Left operand field, select Event fields.
- In the Event fields field, select DeviceAssetID.
- In the Operator field, select inCategory.
- In the Right operand field, select Constant.
- Click the button.
- Select the category in which you placed the Kaspersky Endpoint Detection and Response Central Node server asset.
- Click the Save button.
- In the Conditions field, click the Add group button.
- In the operator field for the group you added, select OR.
- Add a condition for filtering by event class identifier:
- In the Conditions field, click the Add condition button.
- In the condition field, select If.
- In the Left operand field, select Event fields.
- In the Event fields field, select DeviceEventClassID.
- In the Operator field, select =.
- In the Right operand field, select Constant.
- In the Value field, enter taaScanning.
- Repeat steps 1–7 in F for each of the following event class IDs:
- file_web.
- file_mail.
- file_endpoint.
- file_external.
- ids.
- url_web.
- url_mail.
- dns.
- iocScanningEP.
- yaraScanningEP.
- On the Actions tab, specify the following settings:
- In the Actions section, open the On every event drop-down list.
- Select the Output check box.
- In the Enrichment section, click the Add enrichment button.
- In the Source kind drop-down list, select Template.
- In the Template field, enter https://{{.DeviceAddress}}:8443/katap/#/alerts?id={{.EventOutcome}}.
- In the Target field drop-down list, select DeviceExternalID.
- If necessary, turn on the Debug toggle switch to log information related to the operation of the resource.
- Click the Save button.
Step 3. Creating a correlator
You need to launch the Correlator Installation Wizard. At step 3 of the Wizard, you are required to select the correlation rule that you added by following this guide.
After the correlator is created, a link to these detections will be displayed in the details of alerts created when receiving detections from Kaspersky Endpoint Detection and Response. The link is displayed in the correlation event details (Related events section), in the DeviceExternalID field.
If you want the FQDN of the Kaspersky Endpoint Detection and Response Central Node server to be displayed in the DeviceHostName field, in the detection details, you need to create a DNS record for the server and create a DNS enrichment rule at step 4 of the Wizard.
Page top
Integration with Kaspersky CyberTrace
Kaspersky CyberTrace (hereinafter CyberTrace) is a tool that integrates threat data streams with SIEM solutions. It provides users with instant access to analytics data, increasing their awareness of security decisions.
You can integrate CyberTrace with KUMA in one of the following ways:
- Integrate CyberTrace indicator search feature to enrich KUMA events with information from CyberTrace data streams.
- Integrate the entire CyberTrace web interface into KUMA to get full access to CyberTrace.
Integration with the CyberTrace web interface requires the CyberTrace TIP Enterprise license.
You can also configure retroscan and event enrichment using CyberTrace. This allows KUMA to get notifications for events in which threat indicators had not been initially detected, but were discovered later after an update of the feeds. This can improve the accuracy of threat detection based on previously logged events.
Integrating CyberTrace indicator search
To integrate CyberTrace indicator search:
- Configure CyberTrace to receive and process KUMA requests.
You can configure the integration with KUMA immediately after installing CyberTrace in the Quick Start Wizard or later in the CyberTrace web interface.
- Create an event enrichment rule in KUMA.
In the enrichment rule, you can specify which data from CyberTrace you want to enrich the event with. We recommend selecting cybertrace-http as the source kind.
- Create a collector to receive events that you want to enrich with CyberTrace data.
- Link the enrichment rule to the collector.
- Save and create the service:
- If you linked the rule to a new collector, click Save and create, copy the collector ID in the opened window and use the copied ID to install the collector on the server using the command line interface.
- If you linked the rule to an existing collector, click Save and restart services to apply the settings.
The configuration of the integration of CyberTrace indicator search is complete and KUMA events will be enriched with CyberTrace data.
Example of testing CyberTrace data enrichment.
Configuring CyberTrace to receive and process requests
You can configure CyberTrace to receive and process requests from KUMA immediately after its installation in the Quick Start Wizard or later in the application web interface.
To configure CyberTrace to receive and process requests in the Quick Start Wizard:
- Wait for the CyberTrace Quick Start Wizard to start after the application is installed.
The wizard starts at step 1, Welcome to Kaspersky CyberTrace. You can go to the next step of the wizard by clicking Next.
- At step 2, Proxy settings, if your organization uses a proxy server, enter its connection settings. If your organization does not use a proxy server, leave all fields blank.
- At step 3, Licensing settings, select the method for adding a license key for CyberTrace: an activation code or a license key file. Depending on the selected method, specify the activation code or upload a license key file.
- At step 4, Service settings, keep default settings.
- At step 5, Data management settings:
- In the SIEM system drop-down list, select KUMA.
- Under Listen on, select the IP and port option.
- In the IP address field, enter
0.0.0.0. - In the Port field, enter the port to listen on for events. The default port is
9999. - Under Send detection alerts, in the IP address field, enter
127.0.0.1, and in the Port field, enter9998.
Leave the default values for everything else.
- At step 6, Certificate settings, select Commercial certificate and add a certificate that allows you to download data feeds from update servers.
- At step 7, Feeds settings, keep default settings.
CyberTrace is configured.
To configure CyberTrace to receive and process requests in the application web interface:
- In the window of the CyberTrace web interface, switch Data management mode: in the left menu, select System, and then in the displayed menu, select General.
- Select the Settings → General section.
- Under Listen on:
- Select IP and port.
- In the IP address field, enter
0.0.0.0. - In the Port field, enter the port to listen on for events. The default port is
9999.
- Select the Settings → Service alerts section.
- In the Service alert format field, enter
%Date% alert=%Alert%%RecordContext%. - In the Records context format field, enter
|%ParamName%=%ParamValue%. - Select the Settings → Detection alerts section.
- In the Alert format field, enter
Category=%Category%|MatchedIndicator=%MatchedIndicator%%RecordContext%. - On the Context tab, in the Actionable fields field, enter
%ParamName%:%ParamValue%. - Switch to the System management mode: in the left menu, select General, then in the displayed menu, select System.
- Select the Settings → Service section.
- Under Web interface, in the IP address or host name, enter
127.0.0.1. - In the upper toolbar, click Restart service.
- Restart the CyberTrace server.
CyberTrace is configured.
Page top
Creating event Enrichment rules
To create event enrichment rules:
- In the KUMA web interface, open the Resources → Enrichment rules section and in the left part of the window, select or create a folder for the new rule.
The list of available enrichment rules will be displayed.
- Click Add enrichment rule to create a new rule.
The enrichment rule window will be displayed.
- Enter the rule configuration parameters:
- In the Name field, enter a unique name for the rule. The name must contain 1 to 128 Unicode characters.
- In the Tenant drop-down list, select the tenant that will own this resource.
- In the Source kind drop-down list, select cybertrace-http.
- Specify the URL of the CyberTrace server to which you want to connect. For example, example.domain.com:9999.
- If necessary, use the Number of connections field to specify the maximum number of connections to the CyberTrace server that can be simultaneously established by KUMA. By default, this value is equal to the number of vCPUs of the KUMA Core server.
- In the RPS field, enter the number of requests to the CyberTrace server per second that KUMA can make. The default value is
1000. - In the Timeout field, specify the maximum number of seconds KUMA should wait for a response from the CyberTrace server. Until a response is received or the time expires, the event is not sent to the Correlator. If a response is received before the timeout, it is added to the
TIfield of the event and the event processing continues. The default value is30. - Under Mapping, you must specify the fields of events to be checked via CyberTrace, and define the rules for mapping fields of KUMA events to CyberTrace indicator types:
- In the KUMA field column, select the field whose value must be sent to CyberTrace.
- In the CyberTrace indicator column, select the CyberTrace indicator type for every field you selected:
- ip
- url
- hash
You must provide at least one string to the table. You can use the Add row button to add a string, or the
button to remove a string. - Use the Debug toggle switch to indicate whether or not to enable logging of service operations. Logging is disabled by default.
- If necessary, in the Description field, add up to 4,000 Unicode characters describing the resource.
- In the Filter section, you can specify conditions to identify events that will be processed using the enrichment rule. You can select an existing filter from the drop-down list or create a new filter.
Creating a filter in resources
To create a filter:
- In the Filter drop-down list, select Create new.
- If you want to keep the filter as a separate resource, select the Save filter check box. In this case, you will be able to use the created filter in various services. This check box is cleared by default.
- If you selected the Save filter check box, enter a name for the created filter resource in the Name field. Maximum length of the name: 128 Unicode characters.
- Under Conditions, specify the conditions that the events must meet:
- Click the Add condition button.
- In the Left operand and Right operand drop-down lists, specify the search parameters. Depending on the data source selected in the Right operand field, fields of additional parameters for identifying the value to be passed to the filter may be displayed. For example, when you select active list, you must specify the name of the active list, the entry key, and the entry key field.
- In the Operator drop-down list, select an operator.
- If you want the operator to be case-insensitive, select the do not match case check box. The selection of this check box does not apply to the InSubnet, InActiveList, InCategory or InActiveDirectoryGroup operators. This check box is cleared by default.
- If you want to add a negative condition, select If not from the If drop-down list.
You can add multiple conditions or a group of conditions.
- If you have added multiple conditions or groups of conditions, choose a selection condition (and, or, not) by clicking the AND button.
- If you want to add existing filters that are selected from the Select filter drop-down list, click the Add filter button. You can view the nested filter settings by clicking the button.
- Click Save.
A new enrichment rule will be created.
CyberTrace indicator search integration is now configured. You can now add the created enrichment rule to a collector. You must restart KUMA collectors to apply the new settings.
If any of the CyberTrace fields in the events details area contains "[{" or "}]" values, it means that information from CyberTrace data feed was processed incorrectly and it's possible that some of the data is not displayed. You can get all information from a data feed by copying value of the TI indicator event field from KUMA and searching for it in CyberTrace in the Indicators section. All information about the found indicator is displayed on the Indicator details page.
Integrating CyberTrace interface
You can integrate the CyberTrace web interface into the KUMA web interface. When this integration is enabled, the KUMA web interface includes a CyberTrace section that provides access to the CyberTrace web interface. You can configure the integration in the Settings → Kaspersky CyberTrace section of the KUMA web interface.
To integrate the CyberTrace web interface in KUMA:
- In the KUMA web interface, open Resources → Secrets.
The list of available secrets will be displayed.
- Click the Add secret button to create a new secret. This resource is used to store credentials of the CyberTrace server.
The secret window is displayed.
- Enter information about the secret:
- In the Name field, choose a name for the added secret. The name must contain 1 to 128 Unicode characters.
- In the Tenant drop-down list, select the tenant that will own this resource.
- In the Type drop-down list, select credentials.
- In the User and Password fields, enter credentials for your CyberTrace server.
- If necessary, in the Description field, add up to 4,000 Unicode characters describing the resource.
- Click Save.
The CyberTrace server credentials are now saved and can be used in other KUMA resources.
- In the KUMA web interface, open Settings → Kaspersky CyberTrace.
The window with CyberTrace integration parameters opens.
- Make the necessary changes to the following parameters:
- Disabled—clear this check box if you want to integrate the CyberTrace web interface into the KUMA web interface.
- Host (required)—enter the address of the CyberTrace server.
- Port (required)—enter the port of the CyberTrace server; the default port for managing the web interface is 443.
- In the Secret drop-down list, select the secret you created before.
- You can configure access to the CyberTrace web interface in the following ways:
- Use hostname or IP when logging into the KUMA web interface.
To do this, in the Allow hosts section, click Add host and in the field that is displayed, enter the IP or hostname of the device
on which the KUMA web interface is deployed.
- Use the FQDN when logging into the KUMA web interface.
If you are using the Mozilla Firefox browser to work with the application web interface, the CyberTrace section may fail to display data. In this case, configure the data display (see below).
- Use hostname or IP when logging into the KUMA web interface.
- Click Save.
CyberTrace is now integrated with KUMA, and the CyberTrace section is displayed in the KUMA web interface.
To configure the data display in the CyberTrace section when using the FQDN to log in to KUMA in Mozilla Firefox:
- Clear your browser cache.
- In the browser's address bar, enter the FQDN of the KUMA web interface with port number 7222 as follows: https://kuma.example.com:7222.
A window will open to warn you of a potential security threat.
- Click the Details button.
- In the lower part of the window, click the Accept risk and continue button.
An exclusion will be created for the URL of the KUMA web interface.
- In the browser's address bar, enter the URL of the KUMA web interface with port number 7220.
- Go to the CyberTrace section.
Data will be displayed in this section.
Updating CyberTrace deny list (Internal TI)
When the CyberTrace web interface is integrated into the KUMA web interface, you can update the CyberTrace denylist or Internal TI with information from KUMA events.
To update CyberTrace Internal TI:
- Open the event details area from the events table, Alert window, or correlation event window and click the link on a domain, web address, IP address, or file hash.
The context menu opens.
- Select Add to Internal TI of CyberTrace.
A confirmation window opens.
- If you want to confirm your actions and update the Internal TI with data from KUMA events, click Yes.
The selected object is now added to the CyberTrace denylist.
Page top
Integration with Kaspersky Threat Intelligence Portal
The Kaspersky Threat Intelligence Portal combines all of Kaspersky's knowledge about cyberthreats and how they are related to each other into a unified web service. When integrated with KUMA, it helps KUMA users to make faster and better-informed decisions, providing them with data about URLs, domains, IP addresses, WHOIS / DNS data.
Access to the Kaspersky Threat Intelligence Portal is provided based on a fee. License certificates are created by Kaspersky experts. To obtain a certificate for Kaspersky Threat Intelligence Portal, contact your Technical Account Manager.
Initializing integration
To integrate Kaspersky Threat Intelligence Portal into KUMA:
- In the KUMA web interface, open Resources → Secrets.
The list of available secrets will be displayed.
- Click the Add secret button to create a new secret. This resource is used to store credentials of your Kaspersky Threat Intelligence Portal account.
The secret window is displayed.
- Enter information about the secret:
- In the Name field, choose a name for the added secret.
- In the Tenant drop-down list, select the tenant that will own the created resource.
- In the Type drop-down list, select ktl.
- In the User and Password fields, enter credentials for your Kaspersky Threat Intelligence Portal account.
- If you want, enter a Description of the secret.
- Upload your Kaspersky Threat Intelligence Portal certificate key:
- Click the Upload PFX button and select the PFX file with your certificate.
The name of the selected file appears to the right of the Upload PFX button.
- Enter the password to the PFX file in the PFX password field.
- Click the Upload PFX button and select the PFX file with your certificate.
- Click Save.
The Kaspersky Threat Intelligence Portal account credentials are now saved and can be used in other KUMA resources.
- In the Settings section of the KUMA web interface, open the Kaspersky Threat Lookup tab.
The list of available connections will be displayed.
- Make sure the Disabled check box is cleared.
- In the Secret drop-down list, select the secret you created before.
You can create a new secret by clicking the button with the plus sign. The created secret will be saved in the Resources → Secrets section.
- If necessary, select a proxy server in the Proxy drop-down list.
- Click Save.
- After you save the settings, log in to the web interface and accept the Terms of Use. Otherwise, an error will be returned in the API.
The integration process of Kaspersky Threat Intelligence Portal with KUMA is completed.
Once Kaspersky Threat Intelligence Portal and KUMA are integrated, you can request additional information from the event details area about hosts, domains, URLs, IP addresses, and file hashes (MD5, SHA1, SHA256).
Page top
Requesting information from Kaspersky Threat Intelligence Portal
To request information from Kaspersky Threat Intelligence Portal:
- Open the event details area from the events table, alert window, or correlation event window and click the link on a domain, web address, IP address, or file hash.
The Threat Lookup enrichment area opens in the right part of the screen.
- Select check boxes next to the data types you want to request.
If neither check box is selected, all information types are requested.
- In the Maximum number of records in each data group field enter the number of entries per selected information type you want to receive. The default value is
10. - Click Request.
A ktl task has been created. When it is completed, events are enriched with data from Kaspersky Threat Intelligence Portal which can be viewed from the events table, Alert window, or correlation event window.
Page top
Viewing information from Kaspersky Threat Intelligence Portal
To view information from Kaspersky Threat Intelligence Portal:
Open the event details area from the events table, alert window, or correlation event window and click the link on a domain, web address, IP address, or file hash for which you previously requested information from Kaspersky Threat Intelligence Portal.
The event details area opens in the right part of the screen with data from Kaspersky Threat Intelligence Portal; the time when it was received is indicated at the bottom of the screen.
Information received from Kaspersky Threat Intelligence Portal is cached. If you click a domain, web address, IP address, or file hash in the event details pane for an event for which KUMA has information available, instead of the Threat Lookup enrichment window, the data from Kaspersky Threat Intelligence Portal is displayed, with the time when it was received indicated. You can update the data.
Page top
Updating information from Kaspersky Threat Intelligence Portal
To update information, received from Kaspersky Threat Intelligence Portal:
- Open the event details area from the events table, alert window, or correlation event window and click the link on a domain, web address, IP address, or file hash for which you previously requested information from Kaspersky Threat Intelligence Portal.
- Click Update in the event details area containing the data received from the Kaspersky Threat Intelligence Portal.
The Threat Lookup enrichment area opens in the right part of the screen.
- Select the check boxes next to the types of information you want to request.
If neither check box is selected, all information types are requested.
- In the Maximum number of records in each data group field enter the number of entries per selected information type you want to receive. The default value is
10. - Click Update.
The KTL task is created and the new data received from Kaspersky Threat Intelligence Portal is requested.
- Close the Threat Lookup enrichment window and the details area with KTL information.
- Open the event details area from the events table, Alert window or correlation event window and click the link on a domain, URL, IP address, or file hash for which you updated Kaspersky Threat Intelligence Portal information and select Show info from Threat Lookup.
The event details area opens on the right with data from Kaspersky Threat Intelligence Portal, indicating the time when it was received on the bottom of the screen.
Page top
Integration with R-Vision Security Orchestration, Automation and Response
R-Vision Security Orchestration, Automation and Response (hereinafter referred to as R-Vision SOAR) is a software platform used for automation of monitoring, processing, and responding to information security incidents. It aggregates cyberthreat data from various sources into a single database for further analysis and investigation to facilitate incident response capabilities.
R-Vision SOAR can be integrated with KUMA. When this integration is enabled, the creation of a KUMA alert triggers the creation of an incident in R-Vision SOAR. A KUMA alert and its R-Vision SOAR incident are interdependent. When the status of an incident in R-Vision SOAR is updated, the status of the corresponding KUMA alert is also changed.
Integration of R-Vision SOAR and KUMA is configured in both applications. In KUMA integration settings are available only for general administrators.
Mapping KUMA alert fields to R-Vision SOAR incident fields when transferring data via API
KUMA alert field |
R-Vision SOAR incident field |
|
|
|
|
|
|
(as a JSON file) |
|
Configuring integration in KUMA
This section describes integration of KUMA with R-Vision SOAR from the KUMA side.
Integration in KUMA is configured in the web interface under Settings → IRP / SOAR.
To configure integration with R-Vision SOAR:
- In the KUMA web interface, open Resources → Secrets.
The list of available secrets will be displayed.
- Click the Add secret button to create a new secret. This resource is used to store token for R-Vision SOAR API requests.
The secret window is displayed.
- Enter information about the secret:
- In the Name field, enter a name for the added secret. The name must contain 1 to 128 Unicode characters.
- In the Tenant drop-down list, select the tenant that will own the created resource.
- In the Type drop-down list, select token.
- In the Token field, enter your R-Vision SOAR API token.
You can obtain the token in the R-Vision SOAR web interface under Settings → Common → API.
- If necessary, in the Description field, add up to 4,000 Unicode characters describing the secret.
- Click Save.
The R-Vision SOAR API token is now saved and can be used in other KUMA resources.
- In the KUMA web interface, go to Settings → IRP / SOAR.
The window containing R-Vision SOAR integration settings opens.
- Make the necessary changes to the following parameters:
- Disabled—select this check box if you want to disable R-Vision SOAR integration with KUMA.
- In the Secret drop-down list, select the previously created secret.
You can create a new secret by clicking the button with the plus sign. The created secret will be saved in the Resources → Secrets section.
- URL (required)—URL of the R-Vision SOAR server host.
- Field name where KUMA alert IDs must be placed (required)—name of the R-Vision SOAR field where the ID of the KUMA alert must be written.
- Field name where KUMA alert URLs must be placed (required)—name of the R-Vision SOAR field where the link for accessing the KUMA alert should be written.
- Category (required)—category of R-Vision SOAR incident that is created after KUMA alert is received.
- KUMA event fields that must be sent to IRP / SOAR (required)—drop-down list for selecting the KUMA event fields that should be sent to R-Vision SOAR.
- Severity group of settings (required)—used to map KUMA severity values to R-Vision SOAR severity values.
- Click Save.
In KUMA integration with R-Vision SOAR is now configured. If integration is also configured in R-Vision SOAR, when alerts appear in KUMA, information about those alerts will be sent to R-Vision SOAR to create an incident. The Details on alert section in the KUMA web interface displays a link to R-Vision SOAR.
If you are working with multiple tenants and want to integrate with R-Vision SOAR, the names of tenants must match the abbreviated names of companies in R-Vision SOAR.
Page top
Configuring integration in R-Vision SOAR
This section describes KUMA integration with R-Vision SOAR from the R-Vision SOAR side.
Integration in R-Vision SOAR is configured in the Settings section of the R-Vision SOAR web interface. For details on configuring R-Vision SOAR, please refer to the documentation on this application.
Configuring integration with KUMA consists of the following steps:
- Configuring R-Vision SOAR user role
- Assign the Incident manager system role to the R-Vision SOAR user utilized for integration. The role is assigned when a user is selected in the R-Vision SOAR web interface in the Settings → Common → System users section. The role is added in the System Roles block of settings.
R-Vision SOAR version 4.0 user with the Incident Manager role
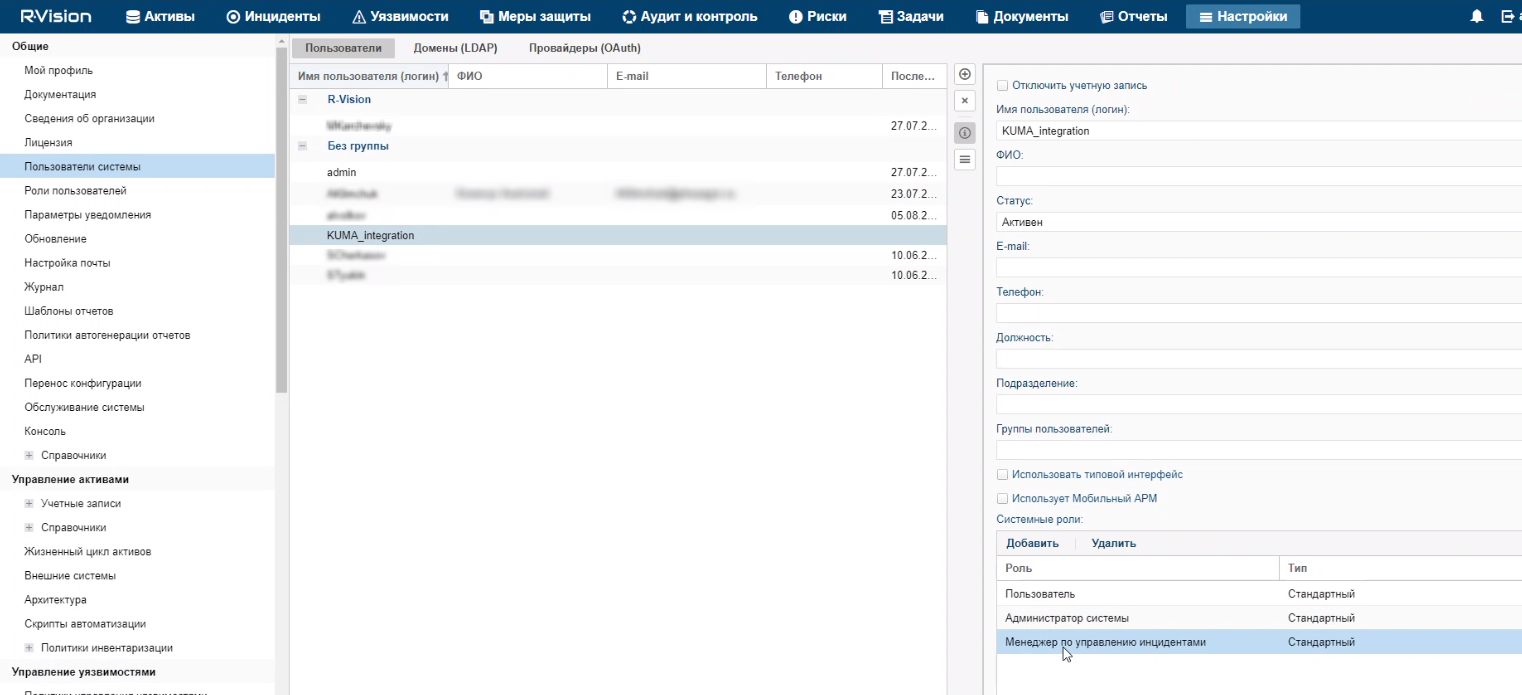
R-Vision SOAR version 5.0 user with the Incident Manager role
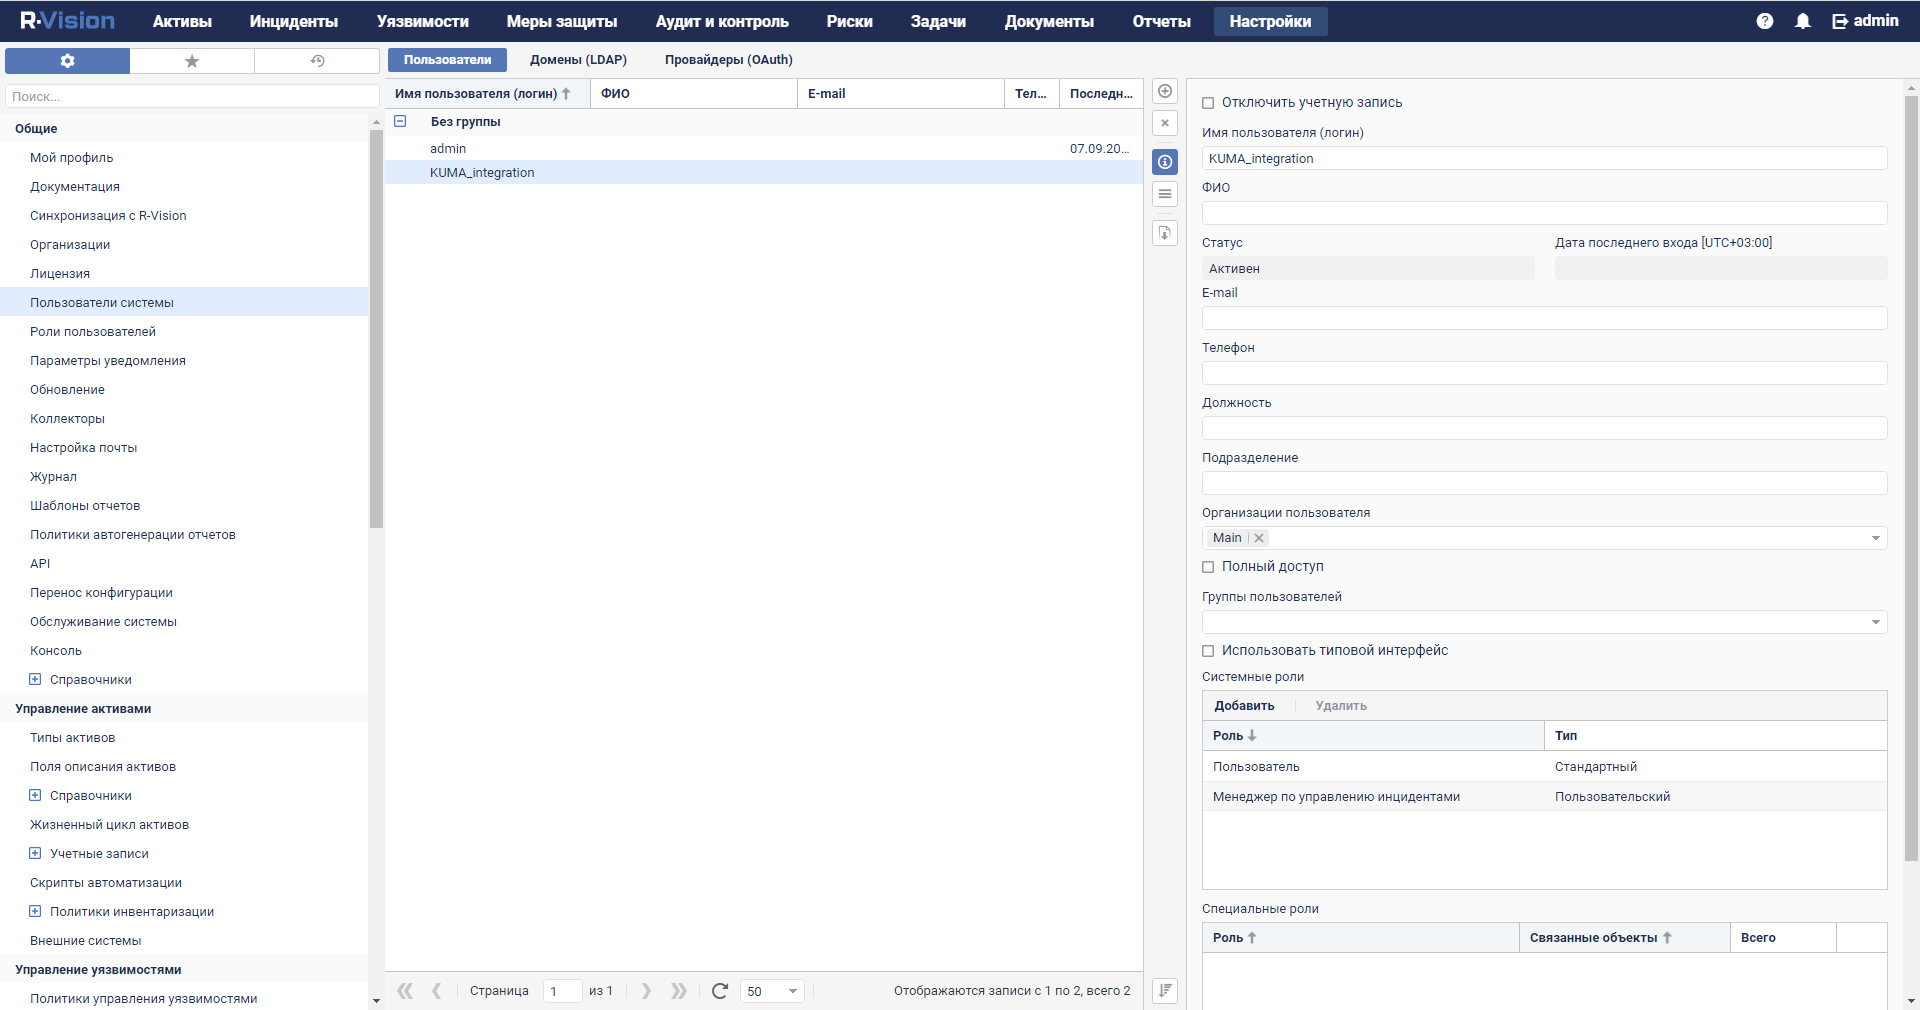
- Make sure that the API token of the R-Vision SOAR user utilized for integration is indicated in the secret in the KUMA web interface. The token is displayed in the R-Vision SOAR web interface under Settings → Common → API.
API token in R-Vision SOAR version 4.0
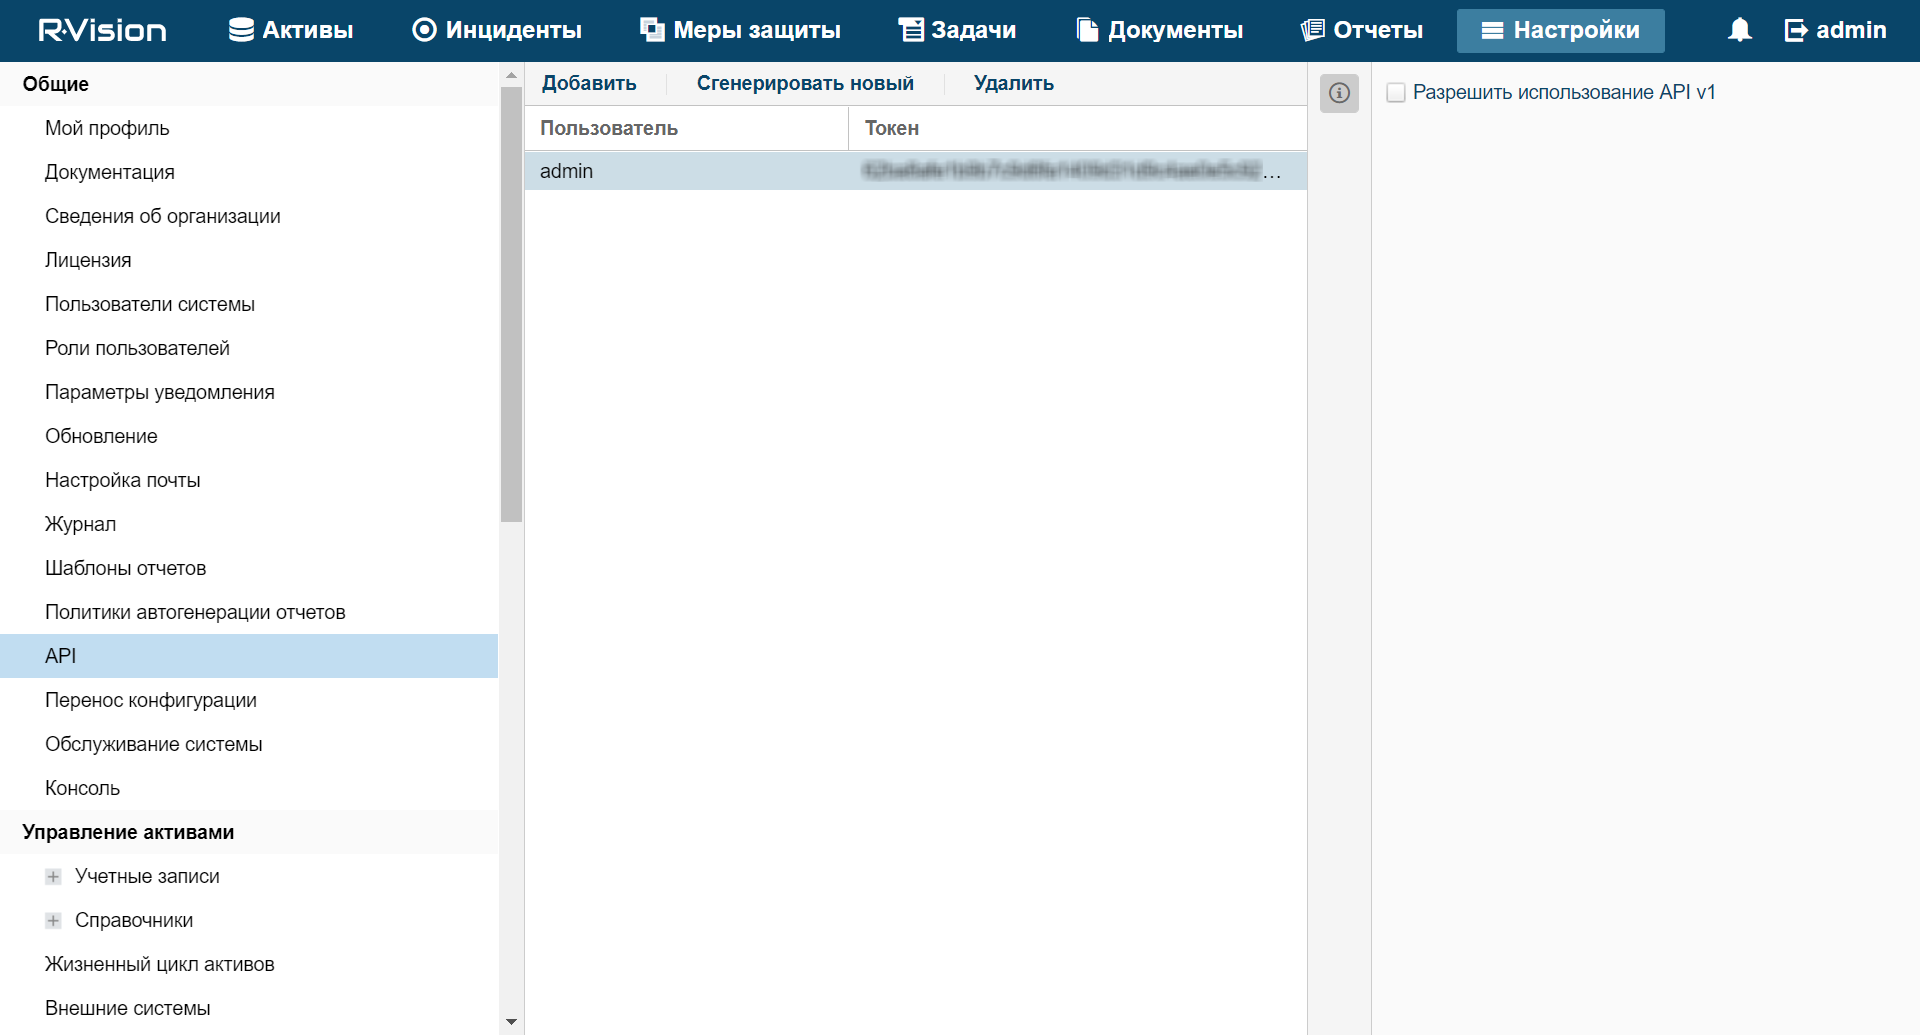
API token in R-Vision SOAR version 5.0
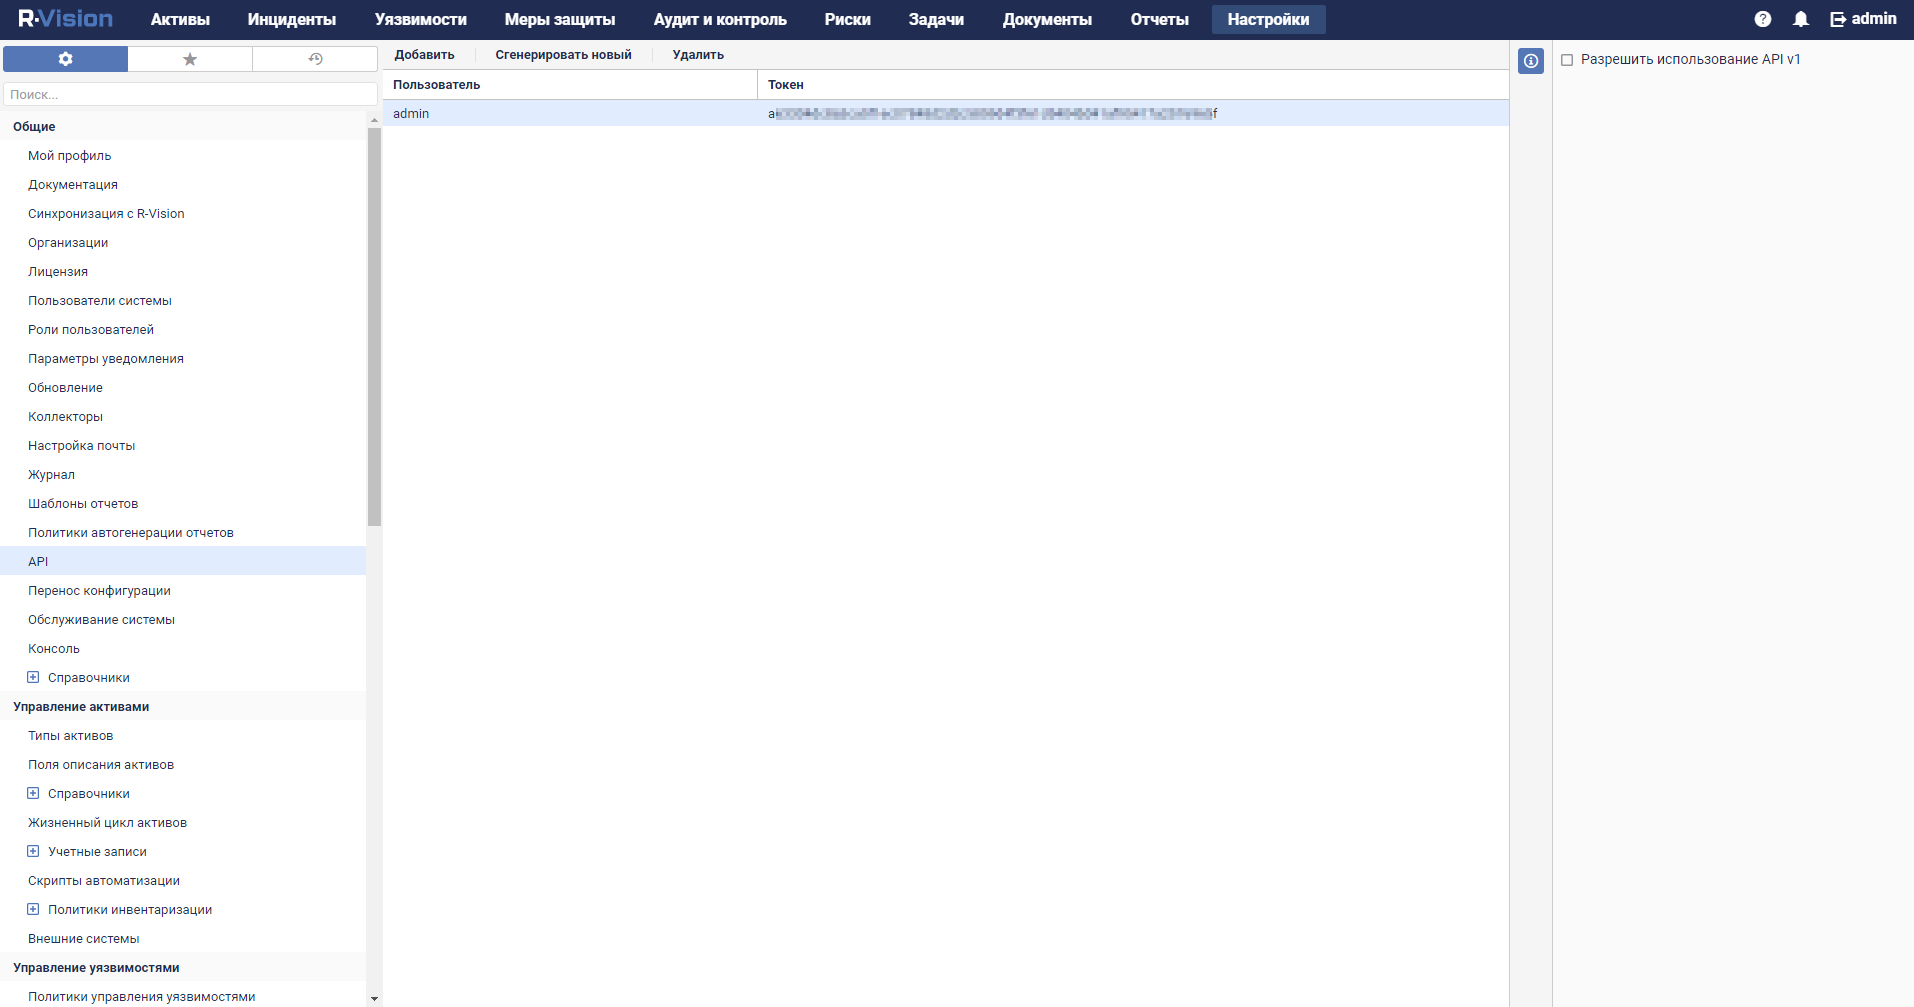
- Assign the Incident manager system role to the R-Vision SOAR user utilized for integration. The role is assigned when a user is selected in the R-Vision SOAR web interface in the Settings → Common → System users section. The role is added in the System Roles block of settings.
- Configuring R-Vision SOAR incident fields and KUMA alert fields
- Add the ALERT_ID and ALERT_URL incident fields.
- Configure the category of R-Vision SOAR incidents created based on KUMA alerts. You can do this in the R-Vision SOAR web interface, in the Settings → Incident management → Incident categories section. Add a new incident category or edit an existing incident category by indicating the previously created
Alert IDandAlert URLincident fields under Category fields. TheAlert IDfield can be hidden.Incident categories with data from KUMA alerts in R-Vision SOAR version 4.0
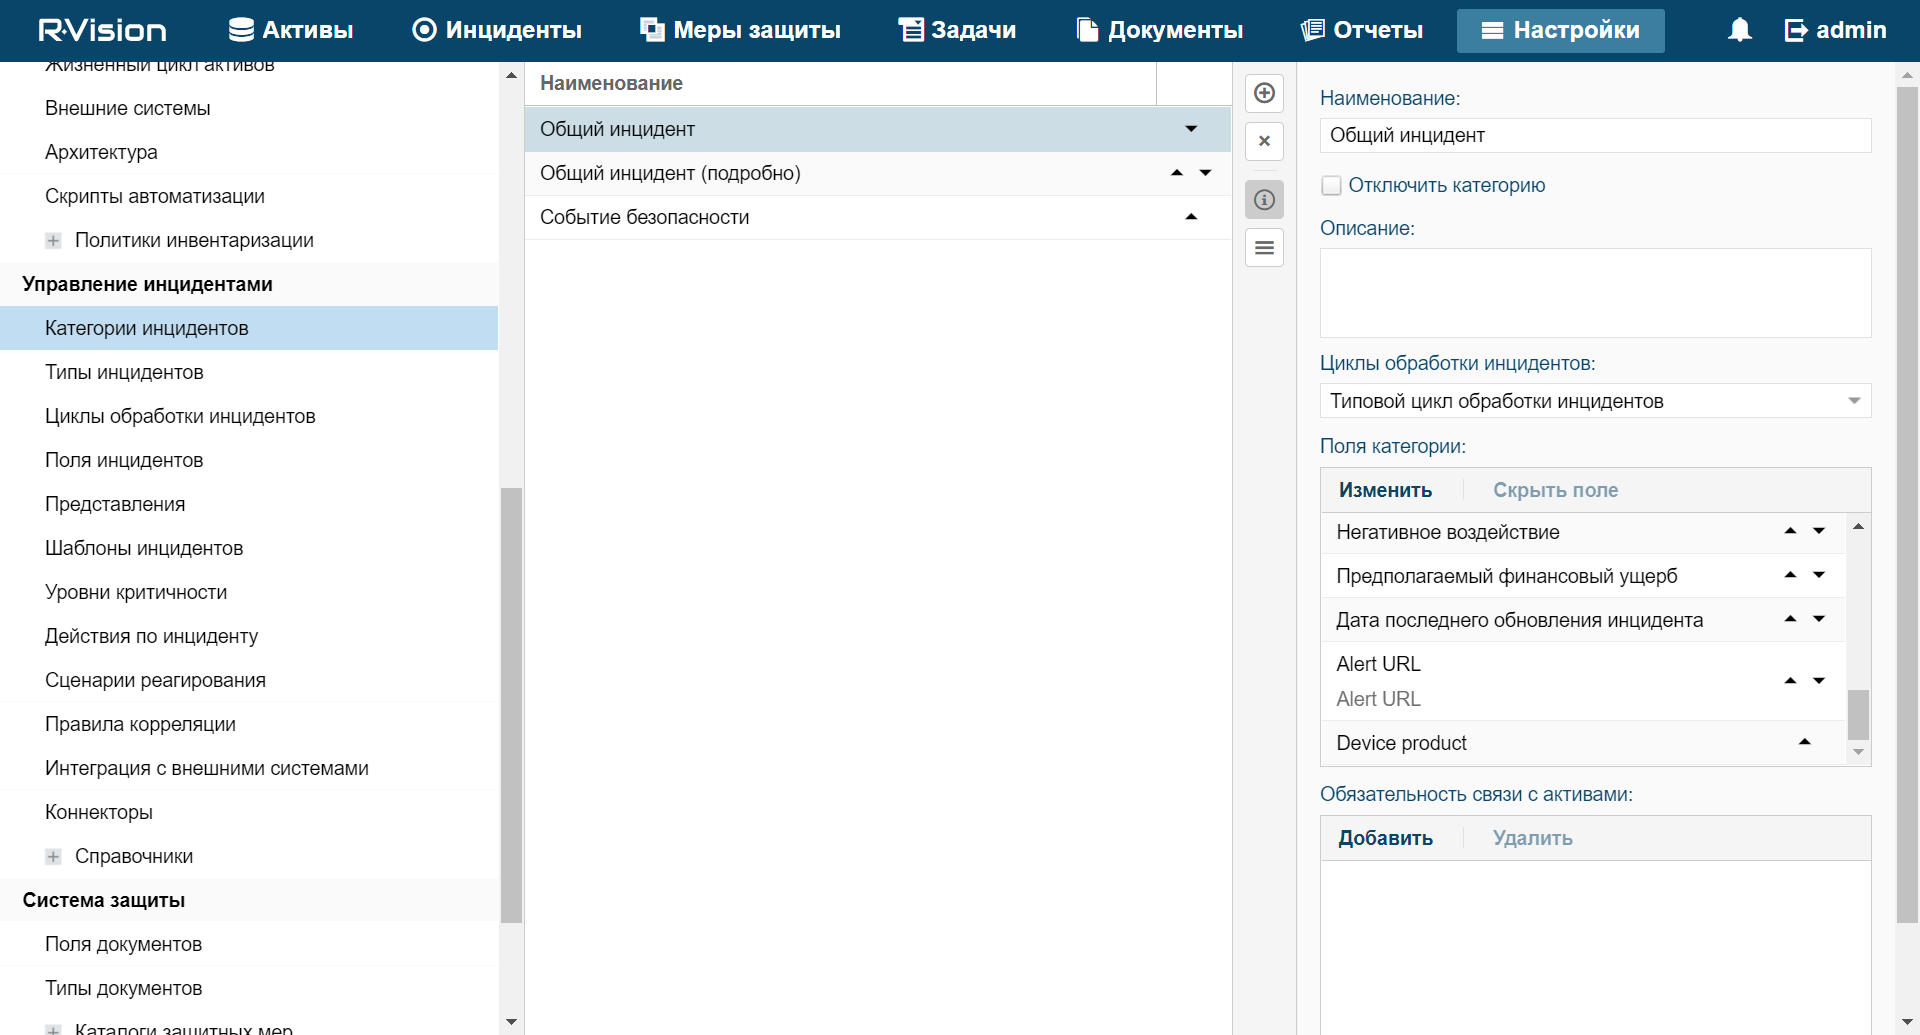
Incident categories with data from KUMA alerts in R-Vision SOAR version 5.0
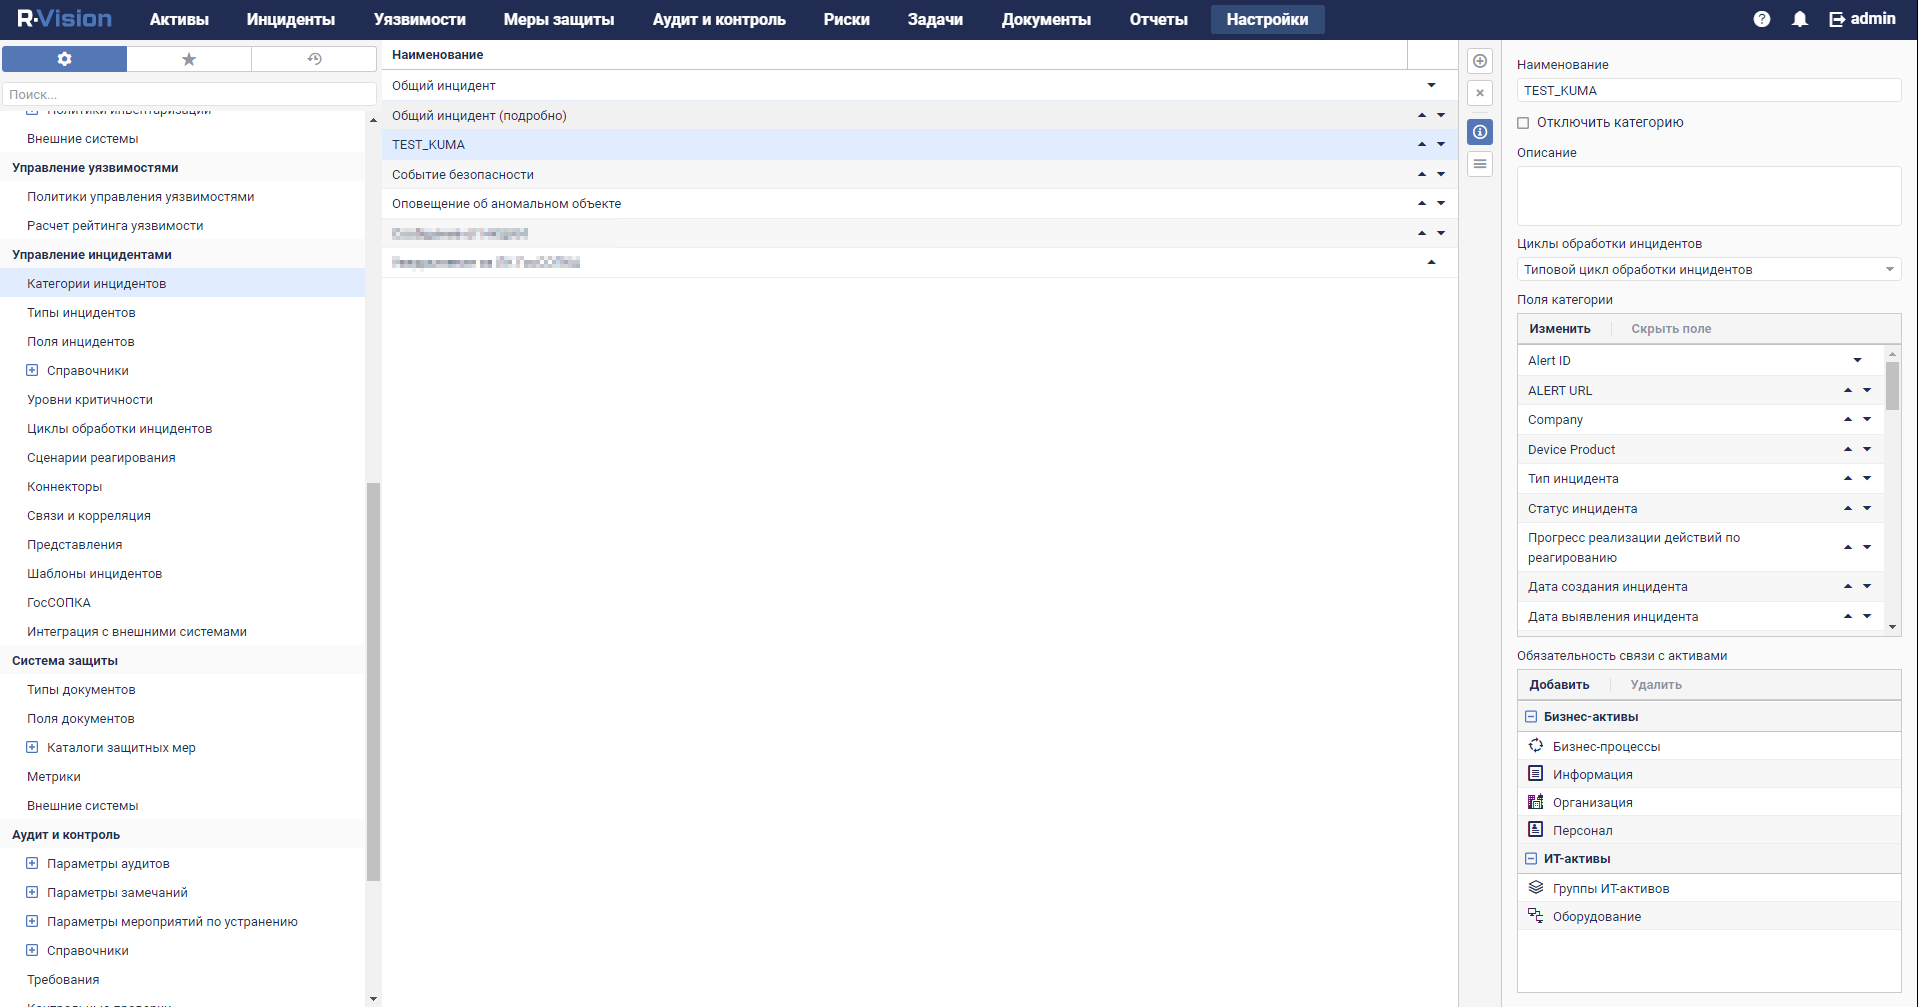
- Block editing of previously created
Alert IDandAlert URLincident fields. In the R-Vision SOAR web interface, under Settings → Incident management → Presentation, select the category of R-Vision SOAR incidents that will be created based on KUMA alerts and put a lock icon next to theAlert IDandAlert URLincident fields.The Alert URL field is not editable in R-Vision SOAR version 4.0
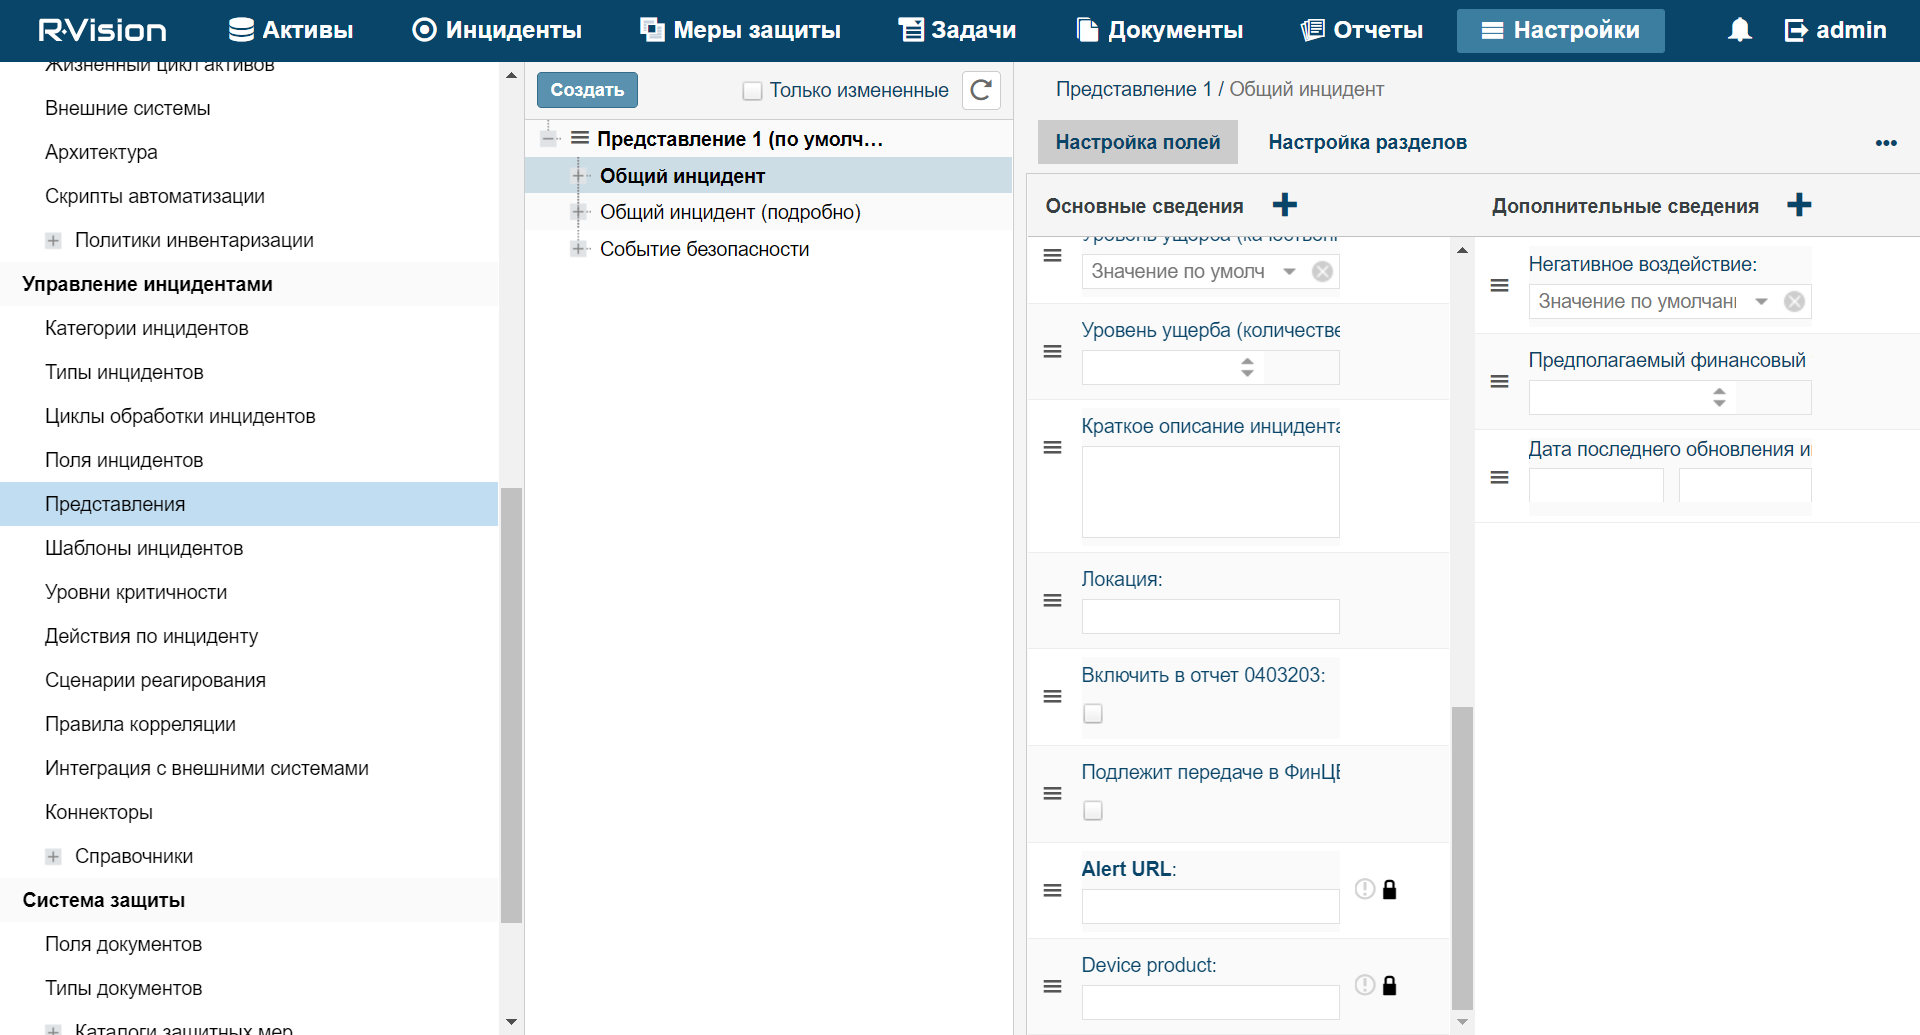
The Alert URL field is not editable in R-Vision SOAR version 5.0
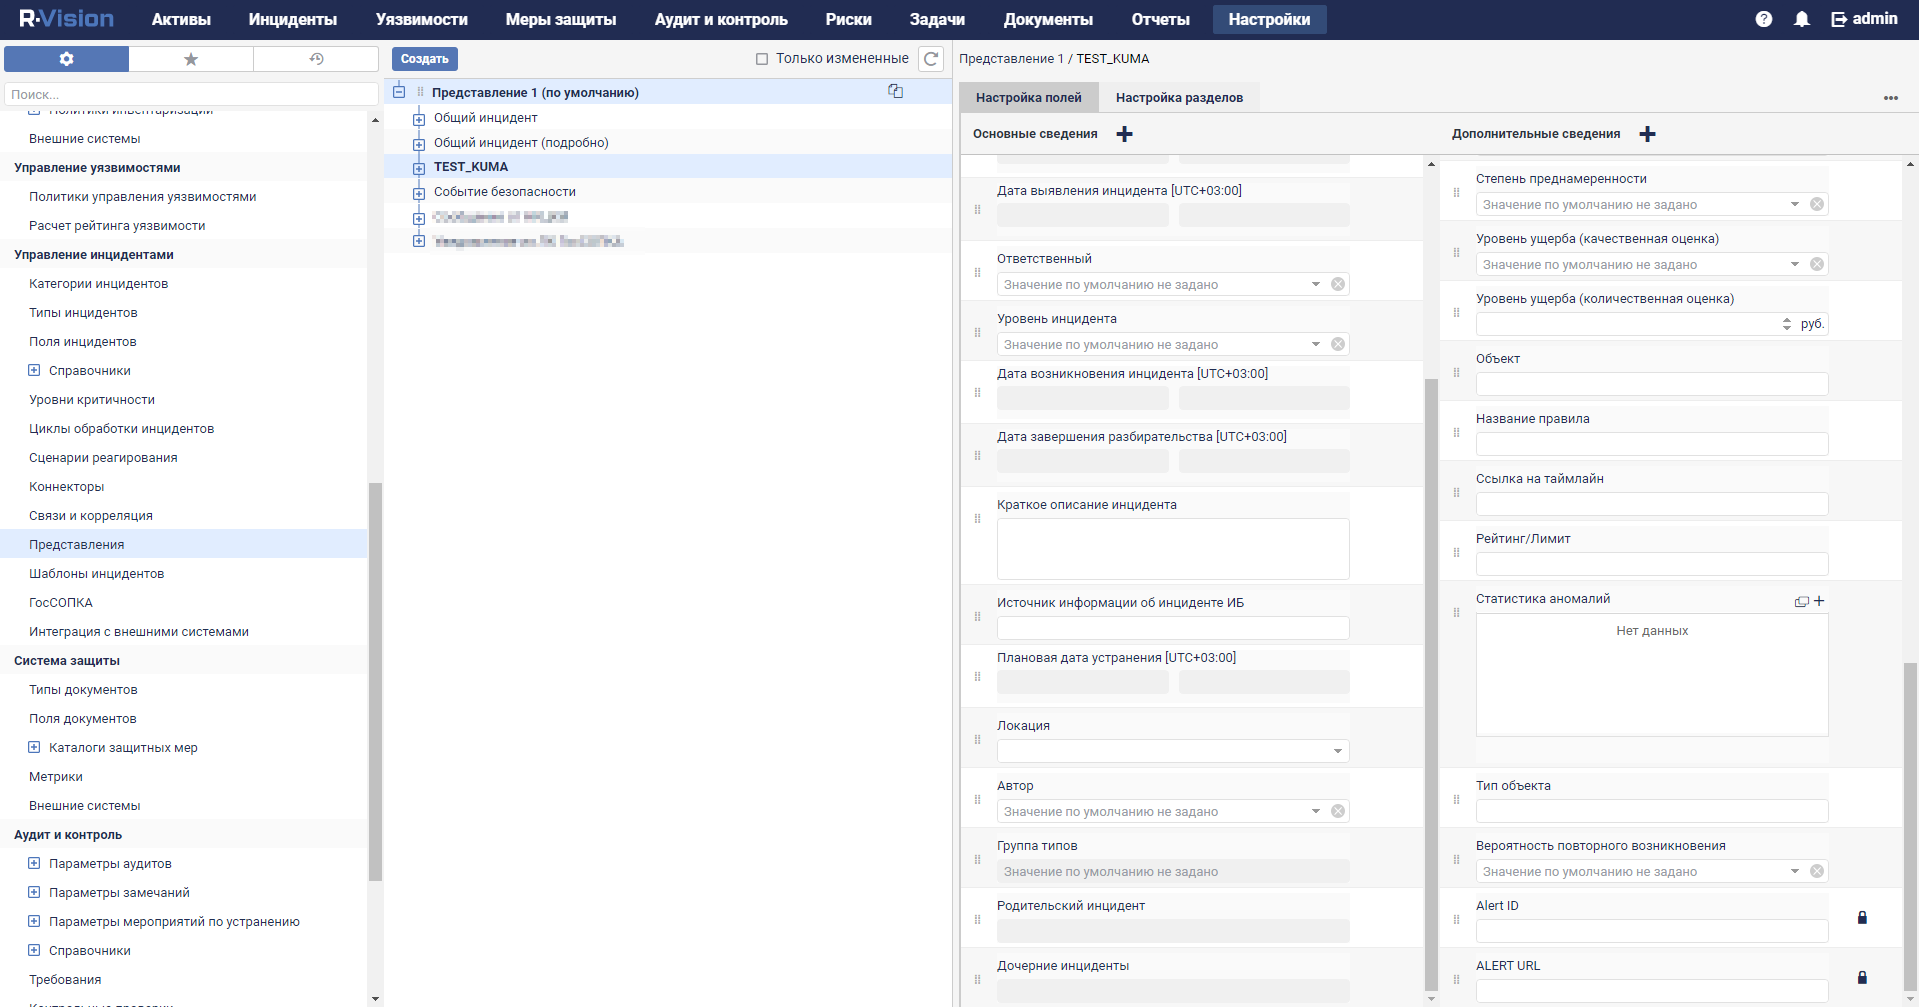
- Creating R-Vision SOAR collector and connector
- Creating a rule to close a KUMA alert
Create a rule for sending KUMA alert closing request when R-Vision SOAR incident is closed.
Integration with KUMA is now configured in R-Vision SOAR. If integration is also configured in KUMA, when alerts appear in KUMA, information about those alerts is sent to R-Vision SOAR to create an incident. The Details on alert section in the KUMA web interface displays a link to R-Vision SOAR.
Adding the ALERT_ID and ALERT_URL incident fields
To add the ALERT_ID incident field in the R-Vision SOAR:
- In the R-Vision SOAR web interface, under Settings → Incident management → Incident fields, select the No group group of fields.
- Click the plus icon in the right part of the screen.
The right part of the screen will display the settings area for the incident field you are creating.
- In the Title field, enter the name of the field (for example:
Alert ID). - In the Type drop-down list, select Text field.
- In the Parsing Tag field, enter
ALERT_ID.
ALERT_ID field added to R-Vision SOAR incident.
ALERT_ID field in R-Vision SOAR version 4.0
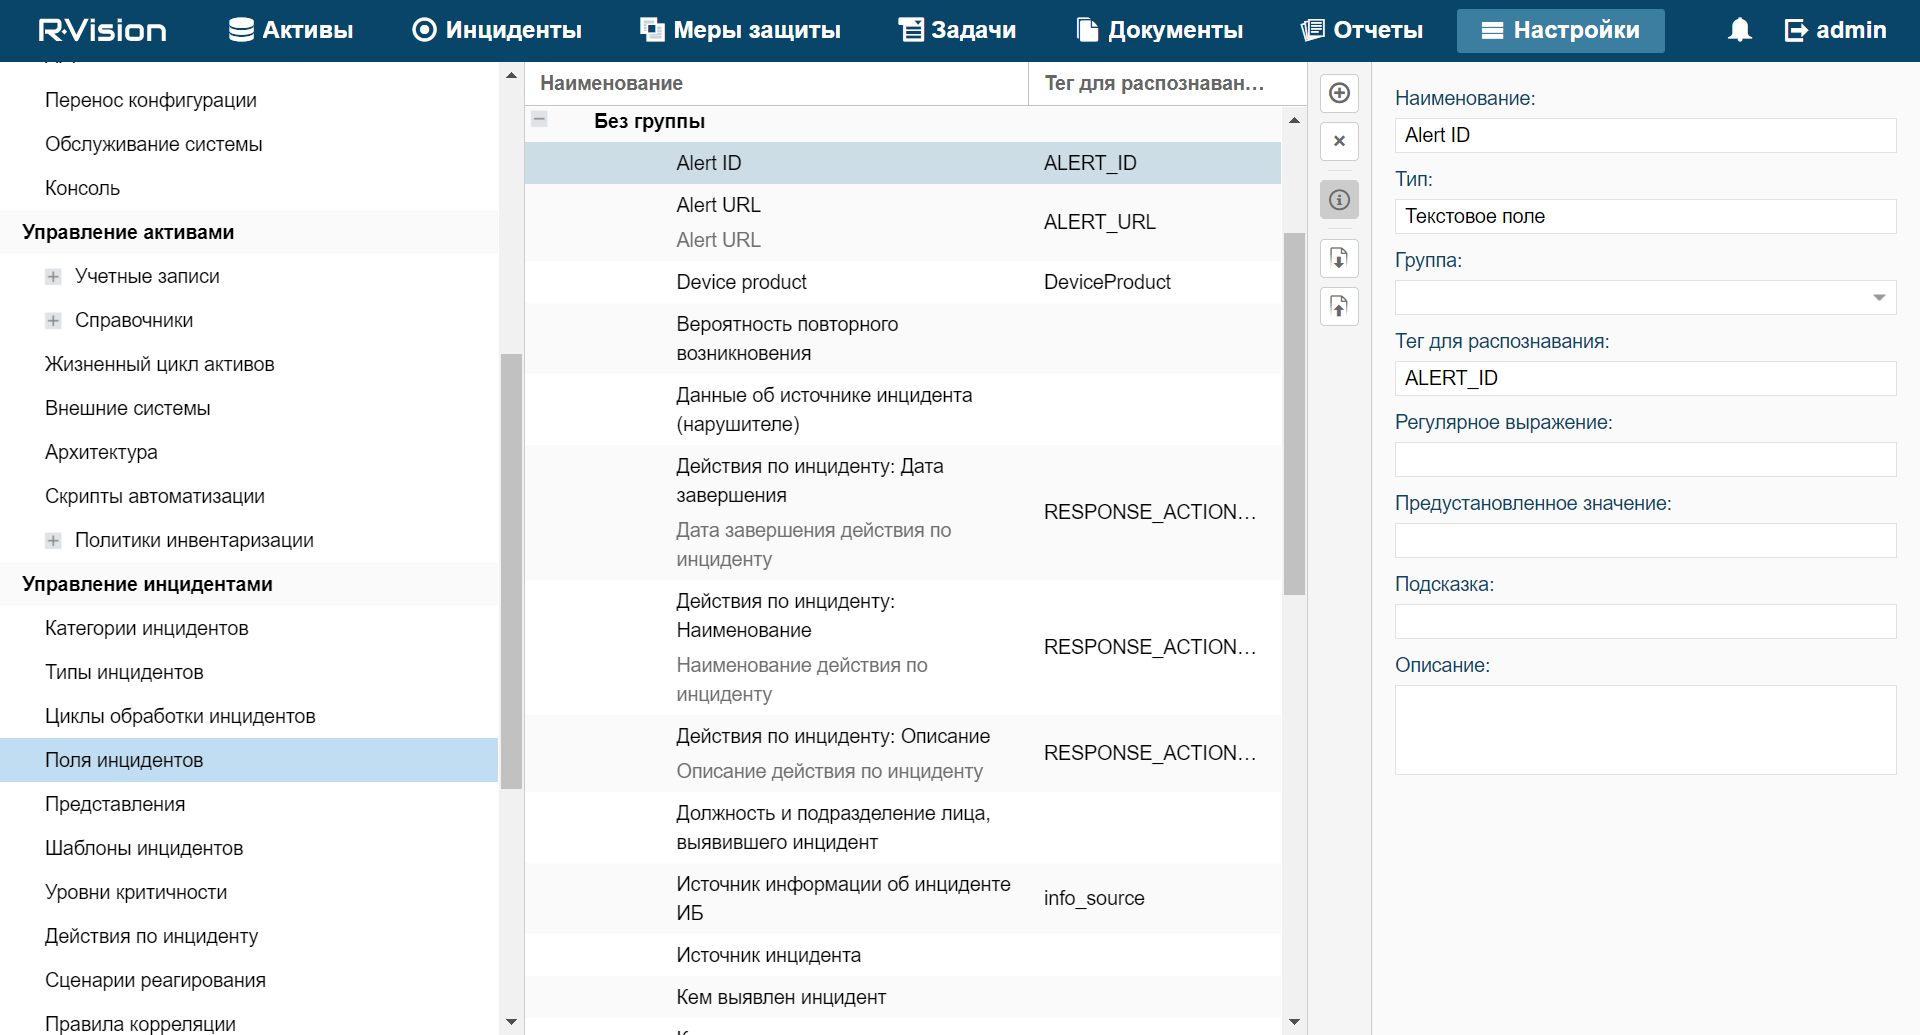
ALERT_ID field in R-Vision SOAR version 5.0
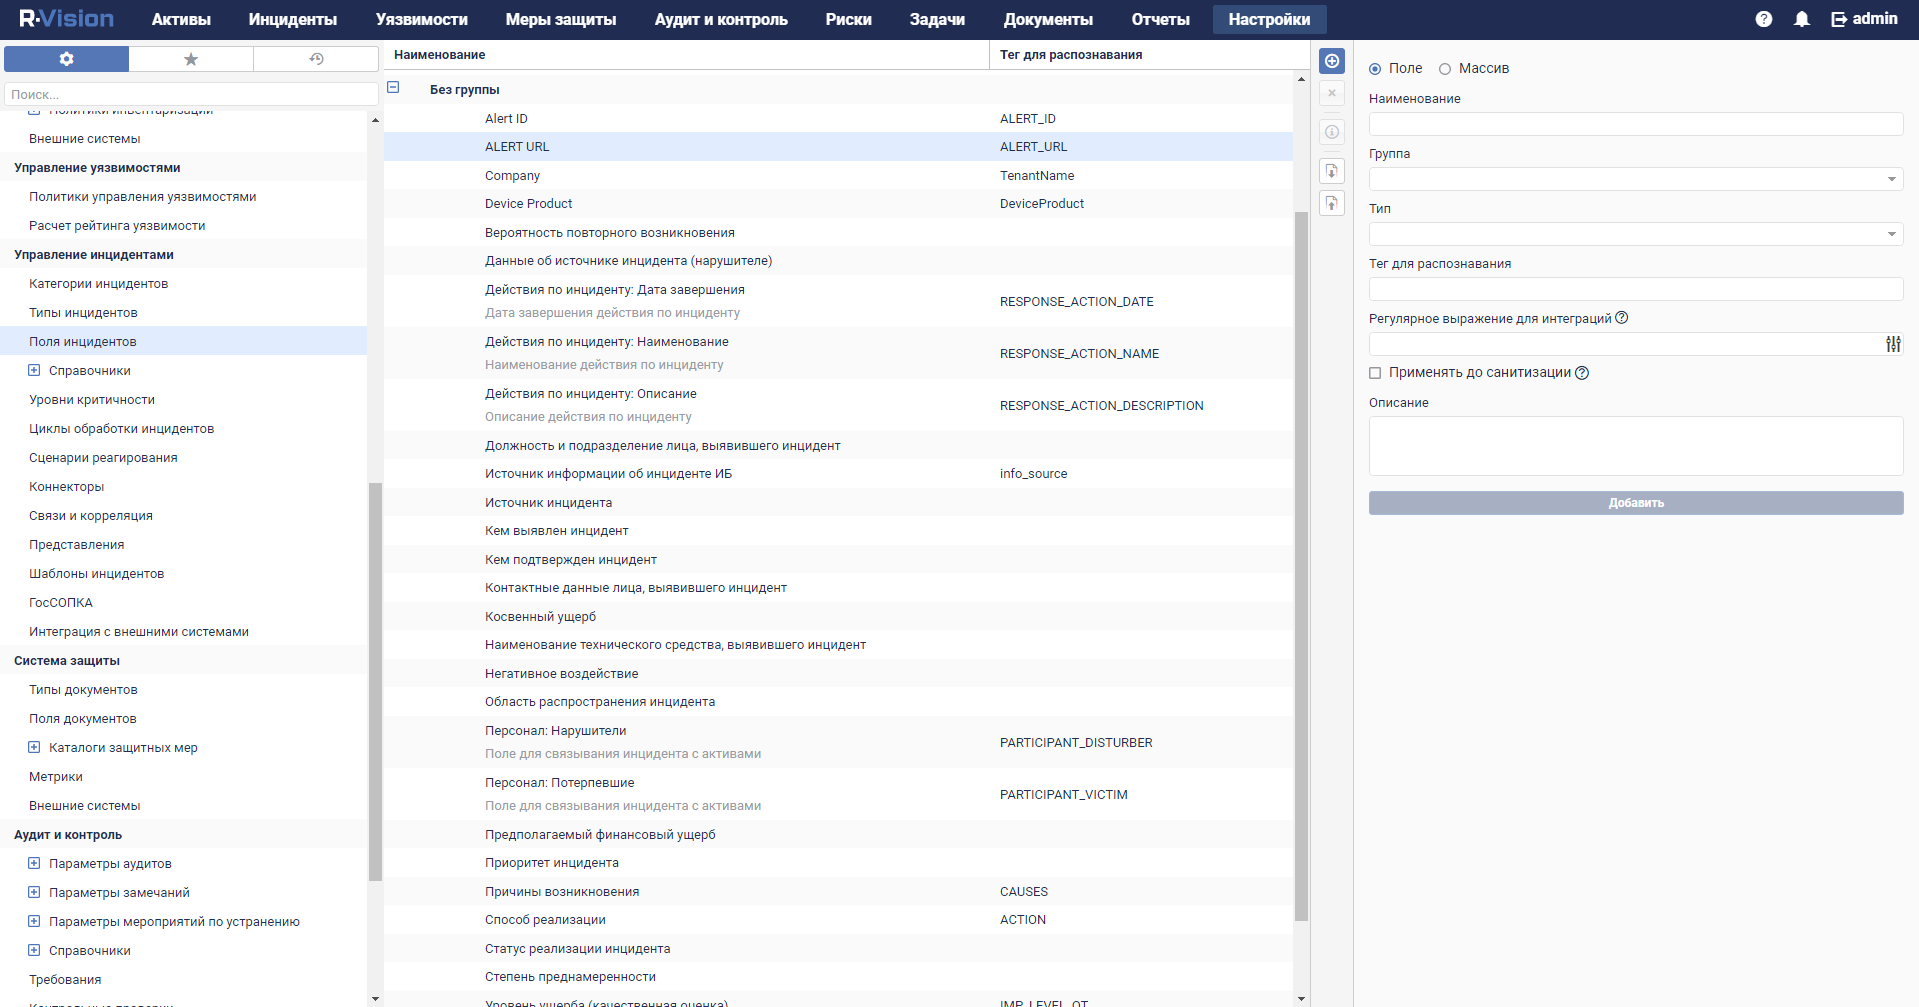
To add the ALERT_URL incident field in R-Vision SOAR:
- In the R-Vision SOAR web interface, under Settings → Incident management → Incident fields, select the No group group of fields.
- Click the plus icon in the right part of the screen.
The right part of the screen will display the settings area for the incident field you are creating.
- In the Title field, enter the name of the field (for example:
Alert URL). - In the Type drop-down list, select Text field.
- In the Parsing Tag field, enter
ALERT_URL. - Select the Display links and Display URL as links check boxes.
ALERT_URL field added to R-Vision SOAR incident.
ALERT_URL field in R-Vision SOAR version 4.0
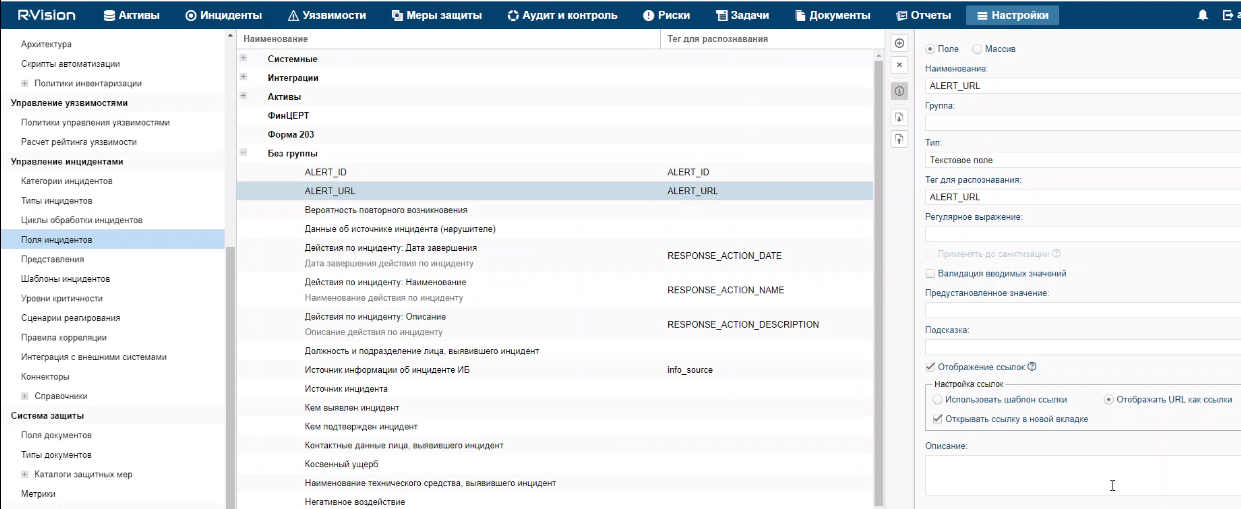
ALERT_URL field in R-Vision SOAR version 5.0
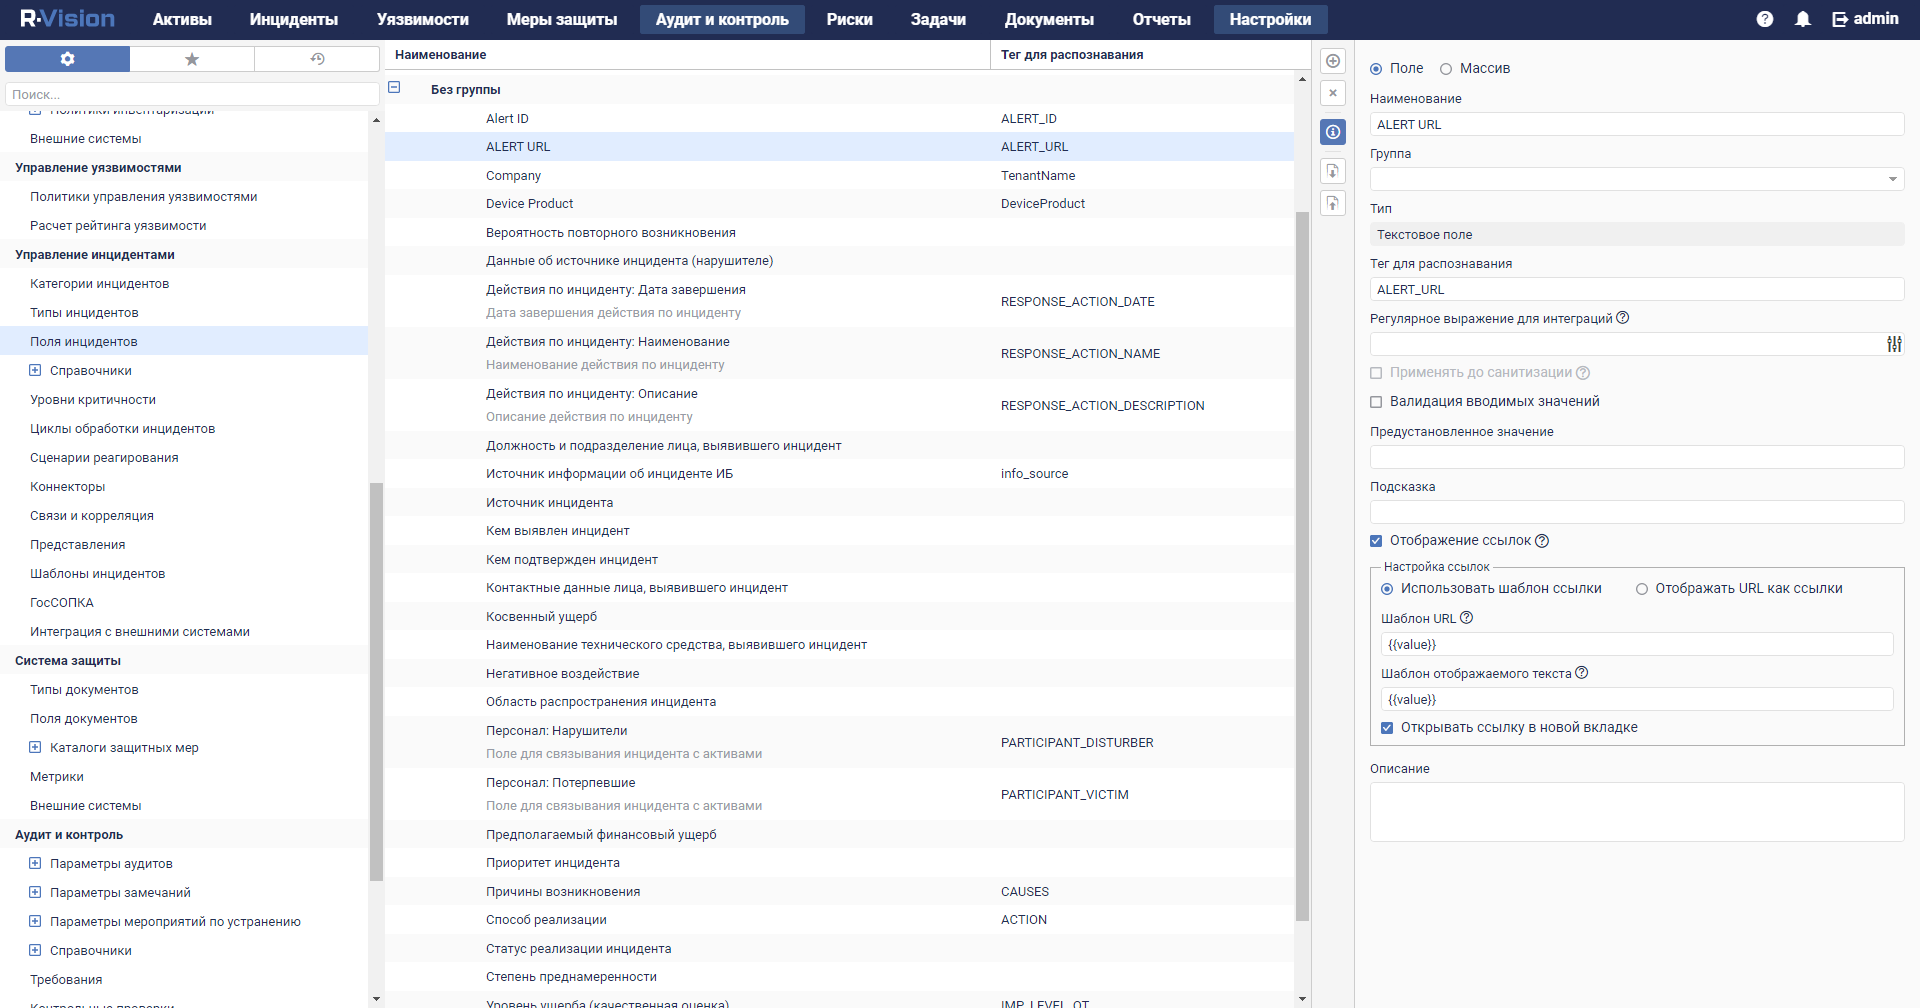
If necessary, you can likewise configure the display of other data from a KUMA alert in an R-Vision SOAR incident.
Page top
Creating a collector in R-Vision SOAR
To create a collector in R-Vision SOAR:
- In the R-Vision SOAR web interface, under Settings → Common → Collectors, click the plus icon.
- Specify the collector name in the Name field (for example,
Main collector). - In the Collector address field, enter the IP address or hostname where the R-Vision SOAR is installed (for example,
127.0.0.1). - In the Port field type
3001. - Click Add.
- On the Organizations tab, select the organization for which you want to add integration with KUMA and select the Default collector and Response collector check boxes.
The R-Vision SOAR collector is created.
Page top
Creating connector in R-Vision SOAR
To create connector in R-Vision SOAR:
- In the R-Vision SOAR web interface, under Settings → Incident management → Connectors, click the plus icon.
- In the Type drop-down list, select REST.
- In the Name field, specify the connector name, such as
KUMA. - In the URL field type API request to close an alert in the format
<KUMA Core server FQDN>:<Port used for API requests (7223 by default)>/api/v1/alerts/close.Example:
https://kuma-example.com:7223/api/v1/alerts/close - In the Authorization type drop-down list, select Token.
- In the Auth header field type
Authorization. - In the Auth value field enter the token of KUMA user with general administrator role in the following format:
Bearer <KUMA General administrator token> - In the Collector drop-down list select previously created collector.
- Click Save.
The connector has been created.
Connector in R-Vision SOAR version 4.0
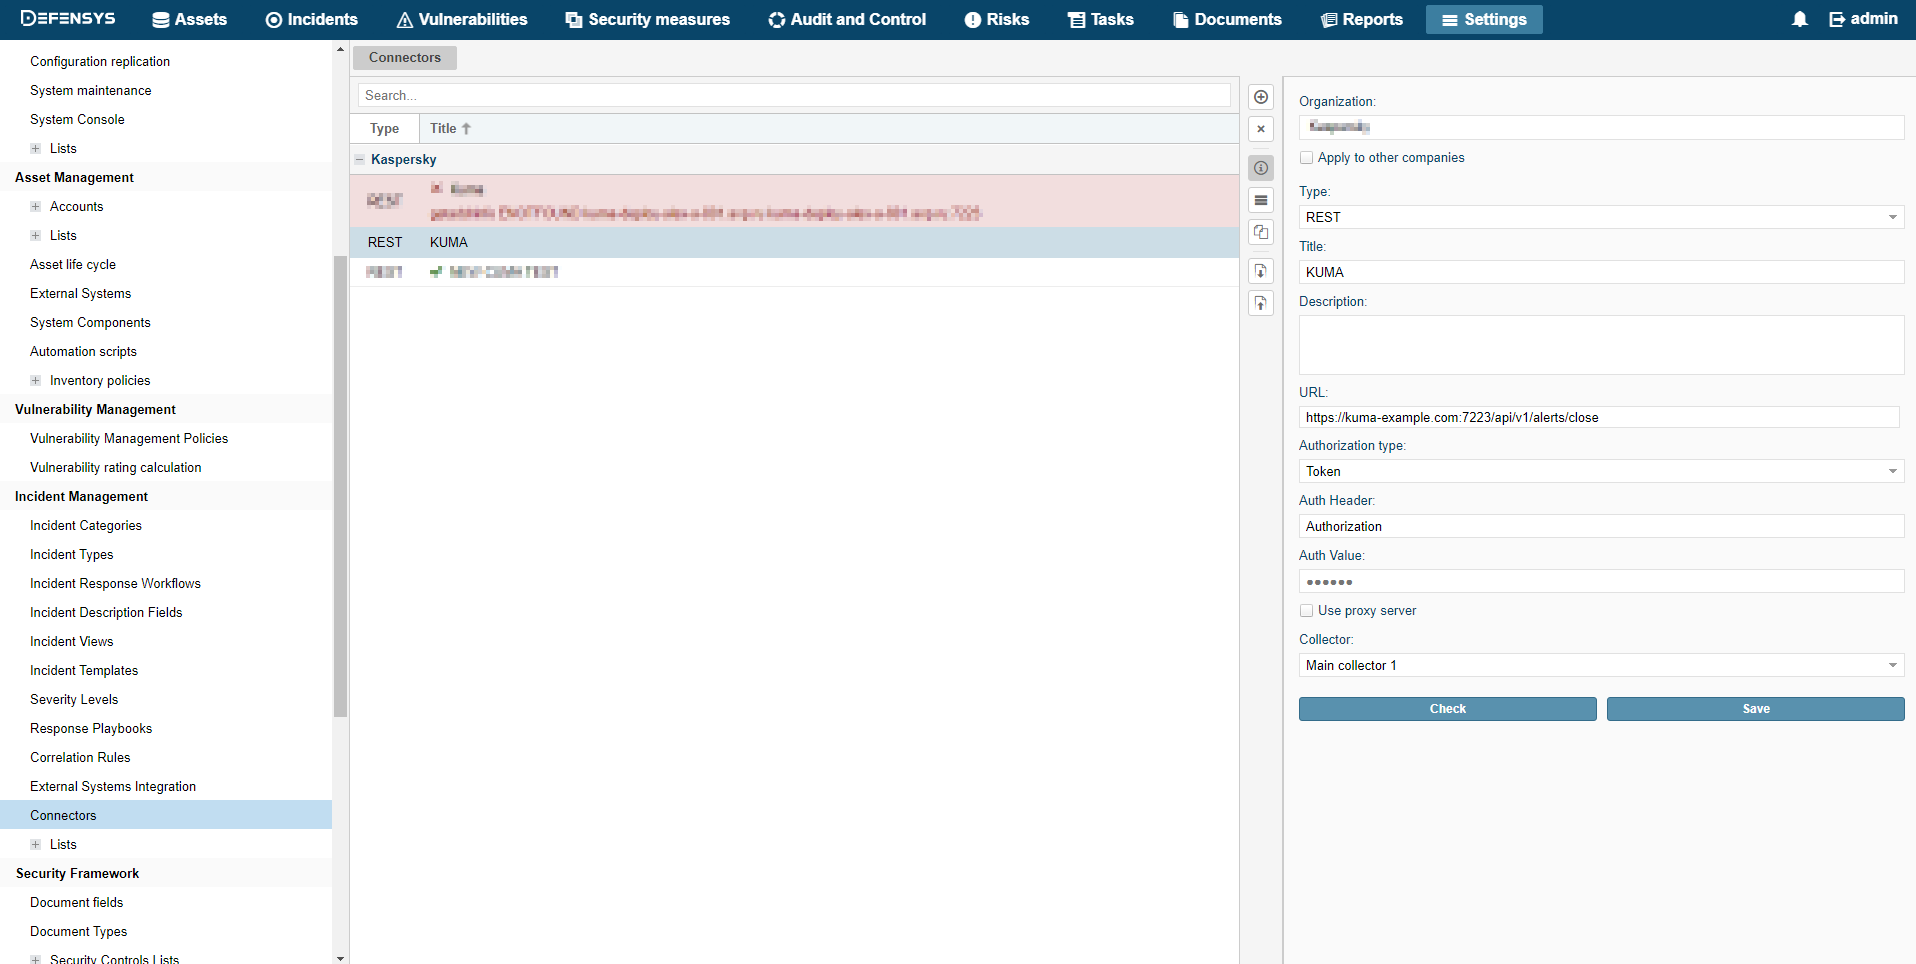
Connector in R-Vision SOAR version 5.0
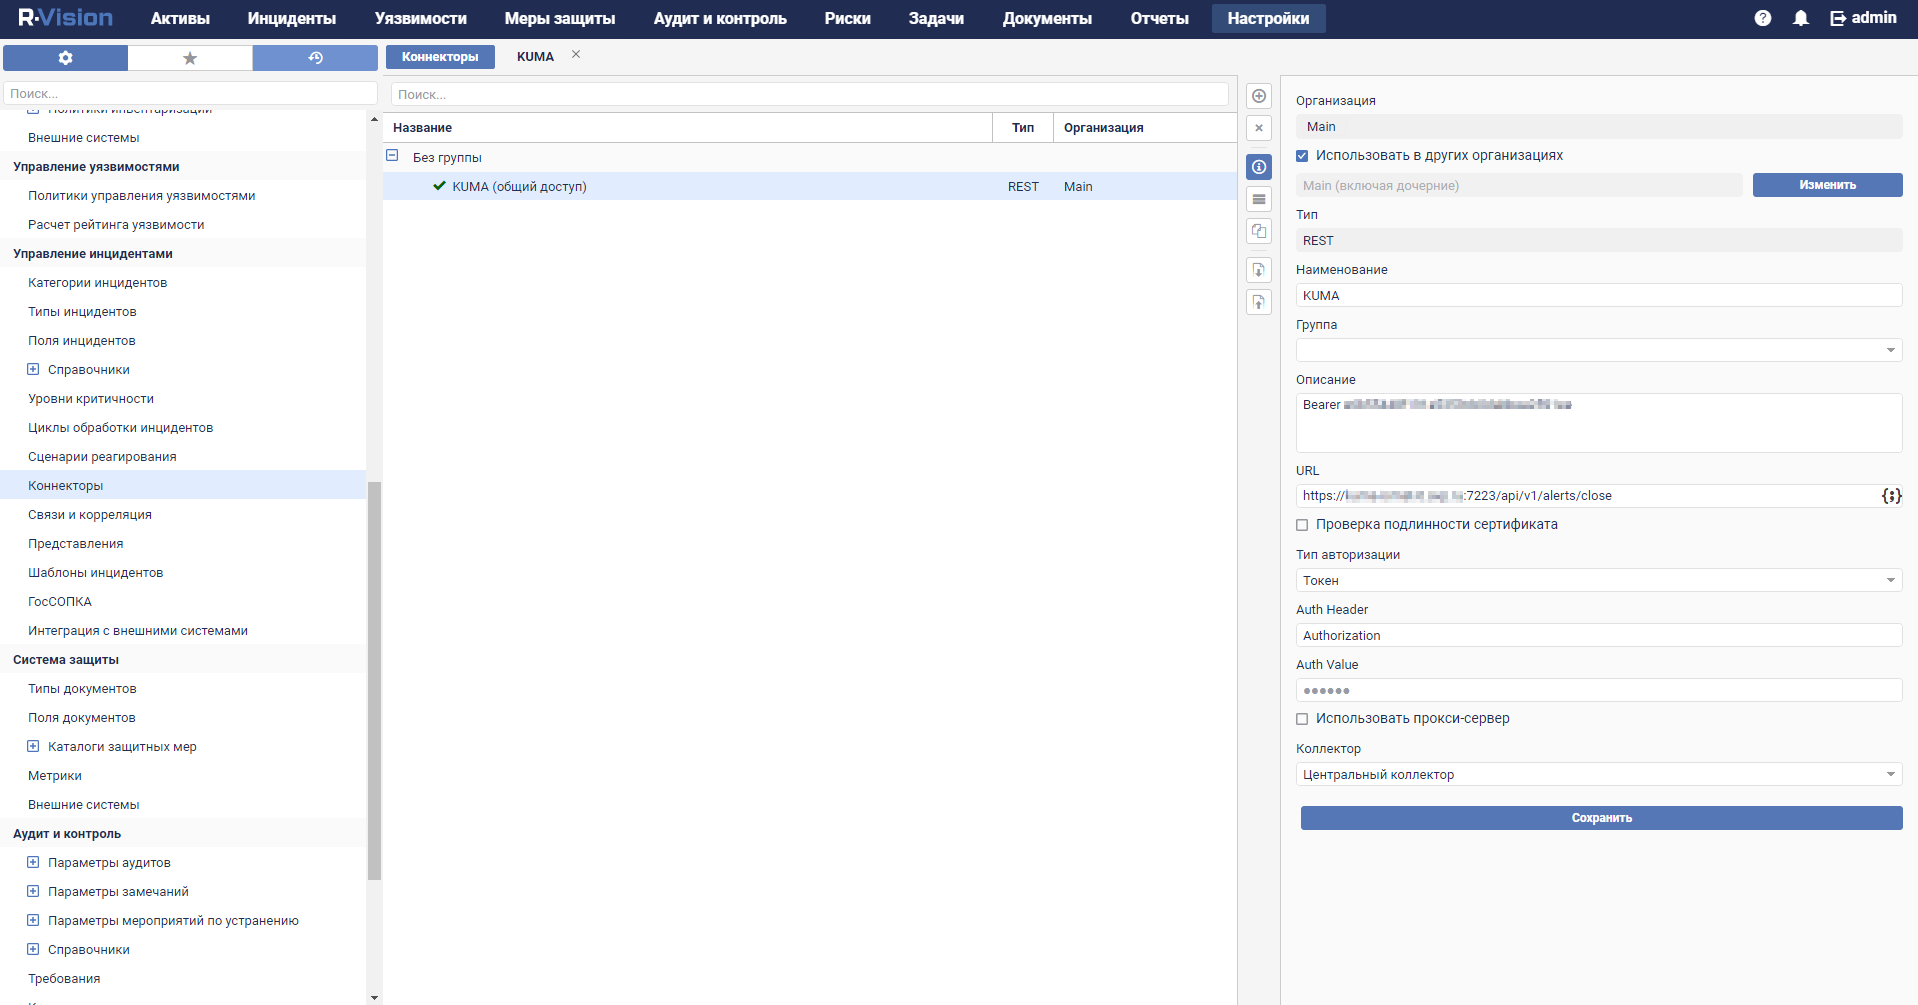
When connector is created you must configure sending API queries for closing alerts in KUMA.
To configure API queries in R-Vision SOAR:
- In the R-Vision SOAR web interface, under Settings → Incident management → Connectors, open for editing the newly created connector.
- In the request type drop-down list, select POST.
- In the Params field type API request to close an alert in the format
<KUMA Core server FQDN>:<Port used for API requests (7223 by default)>/api/v1/alerts/close.Example:
https://kuma-example.com:7223/api/v1/alerts/close - On the HEADERS tab, add the following keys and values:
- Key
Content-Type; value:application/json. - Key
Authorization; value:Bearer <KUMA general administrator token>.The token of the KUMA general administrator can be obtained in the KUMA web interface under Settings → Users.
- Key
- On the BODY → Raw tab, enter the contents of the API request body:
{"id":"{{tag.ALERT_ID}}","reason":"<Reason for closing the alert. Available values: "Incorrect Correlation Rule", "Incorrect Data", "Responded".> "} - Click Save.
The connector is configured.
Connector in R-Vision SOAR version 4.0
API request header
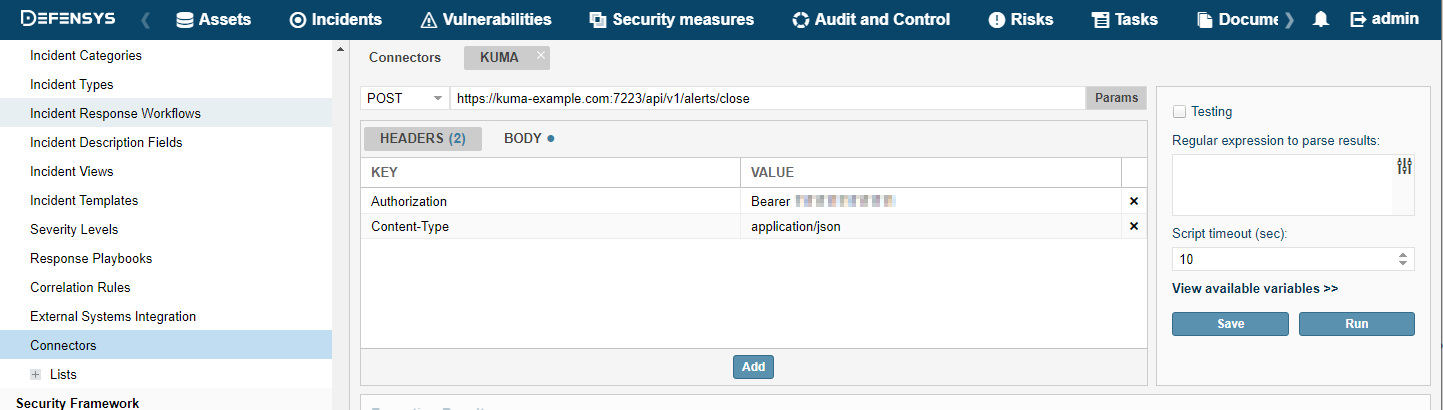
API request body
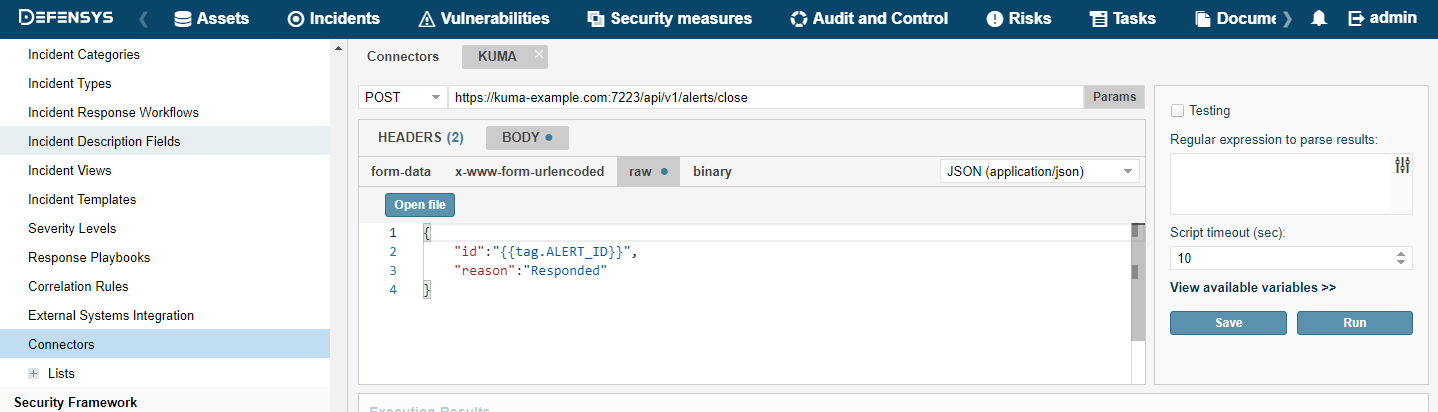
Connector in R-Vision SOAR version 5.0
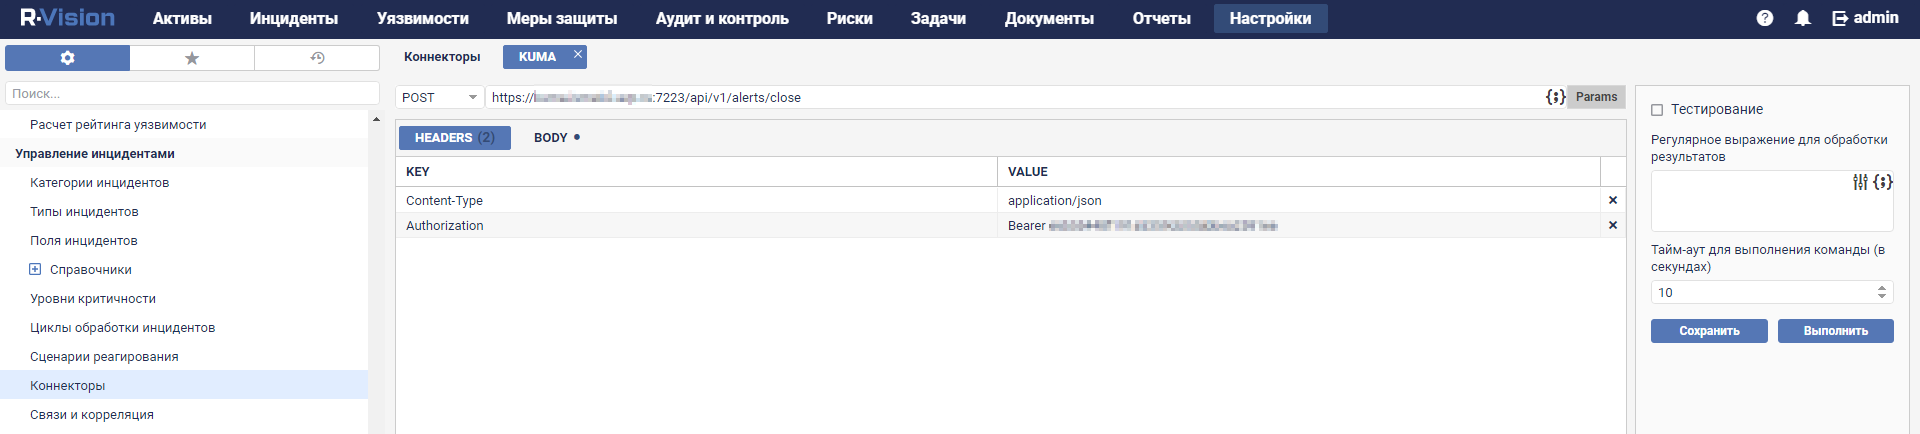
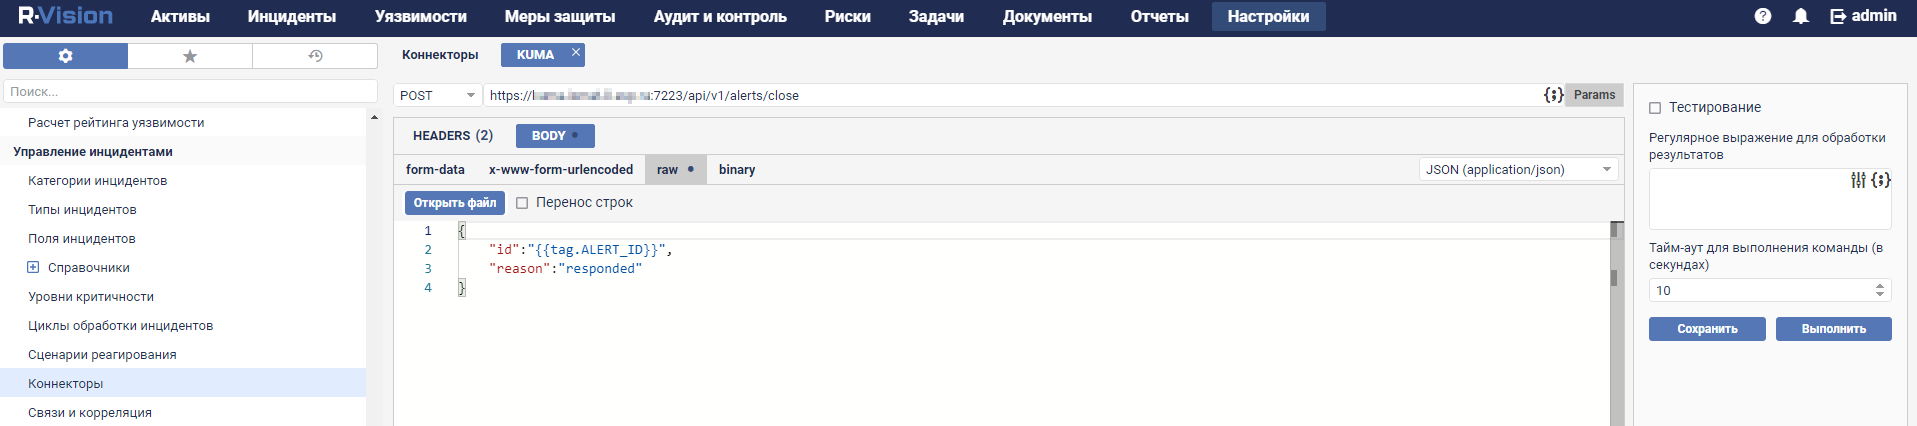
Creating rule for closing KUMA alert when R-Vision SOAR incident is closed
To create a rule for sending an alert closing request to KUMA when an R-Vision SOAR incident is closed:
- In the R-Vision SOAR web interface, under Settings → Incident management → Response playbooks, click the plus icon.
- In the Name field, type the name of the rule, for example,
Close alert. - In the Group drop-down list select All playbooks.
- Under Autostart criteria, click Add and enter the conditions for triggering the rule in the opened window:
- In the Type drop-down list, select Field value.
- In the Field drop-down list, select Incident status.
- Select the Closed status.
- Click Add.
Rule trigger conditions are added. The rule will trigger when an incident is closed.
- Under Incident Response Actions, click Add → Run connector. In the opened window, select the connector that should be run when the rule is triggered:
- In the Connector drop-down list select previously created connector.
- Click Add.
Connector added to the rule.
- Click Add.
A rule is created for sending a KUMA alert closing request when an R-Vision SOAR incident is closed.
R-Vision IRP version 4.0 playbook rule
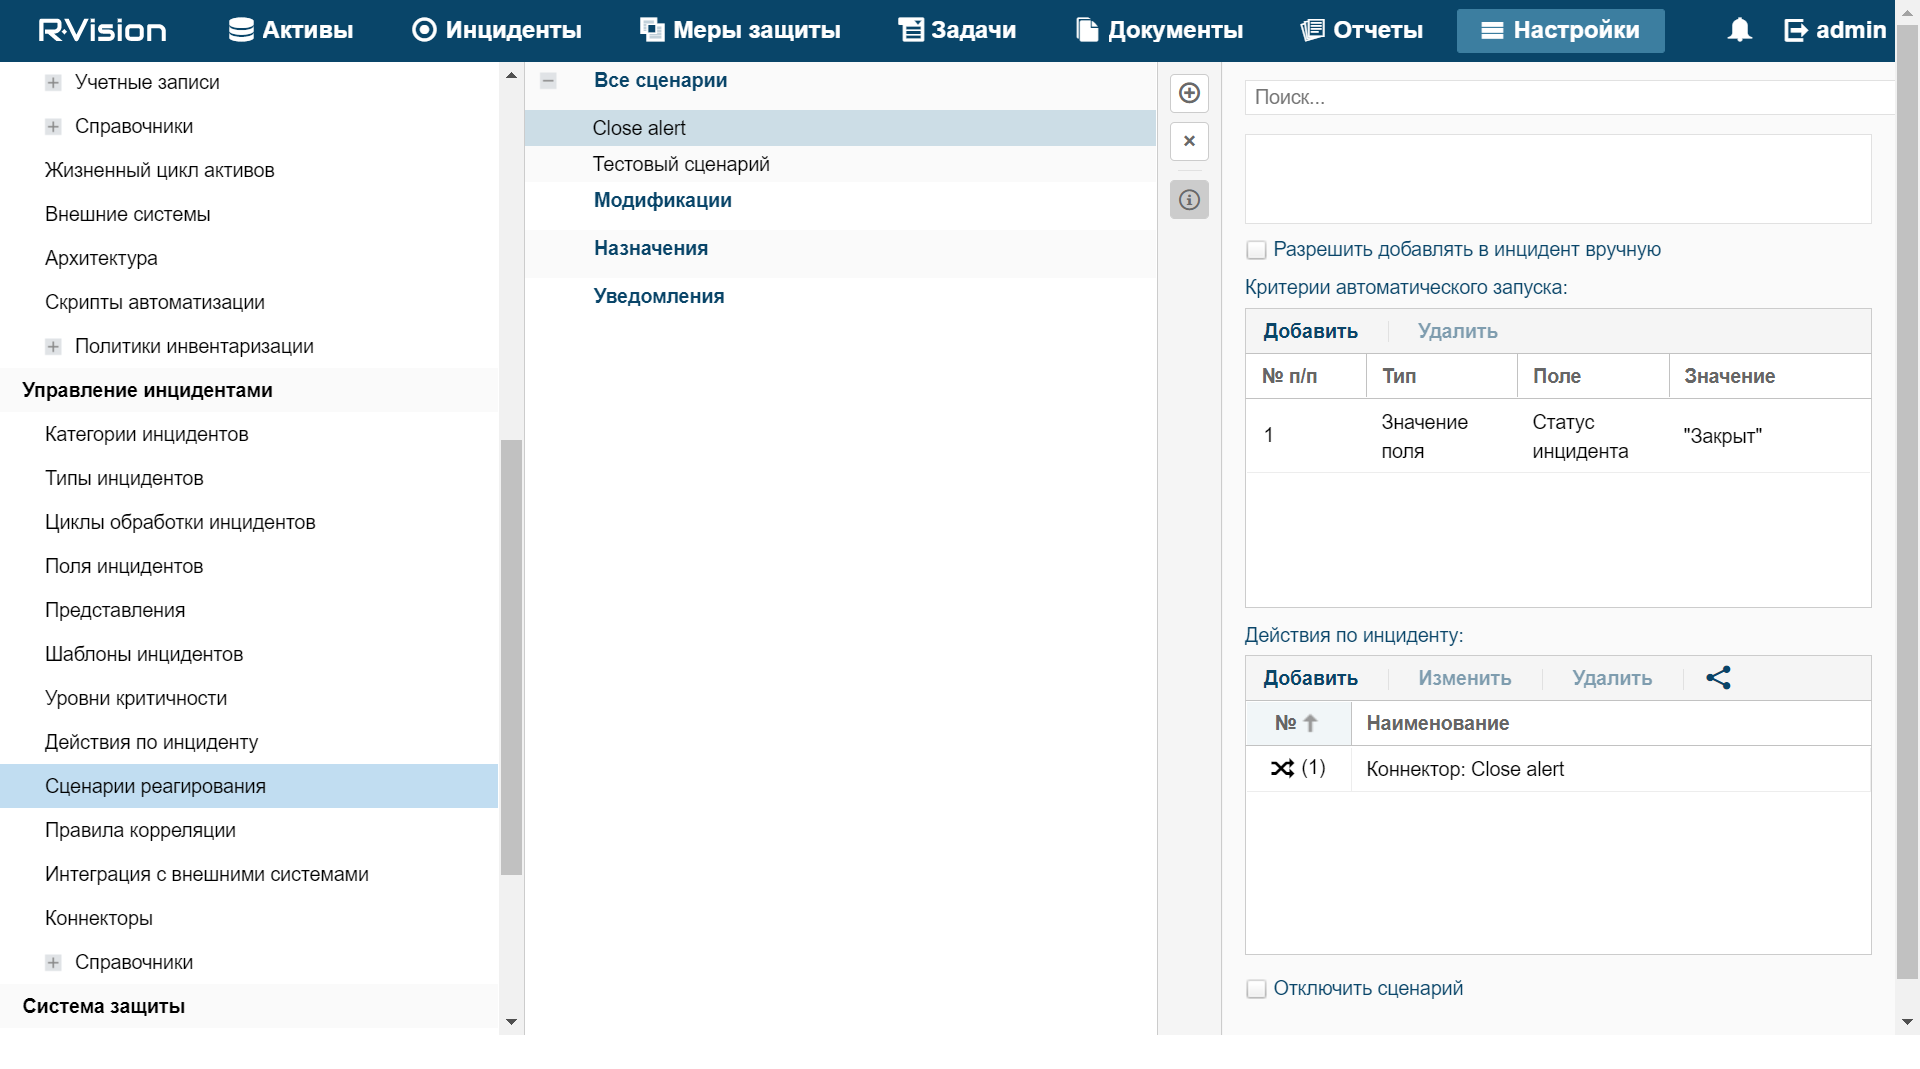
R-Vision SOAR version 5.0 playbook rule
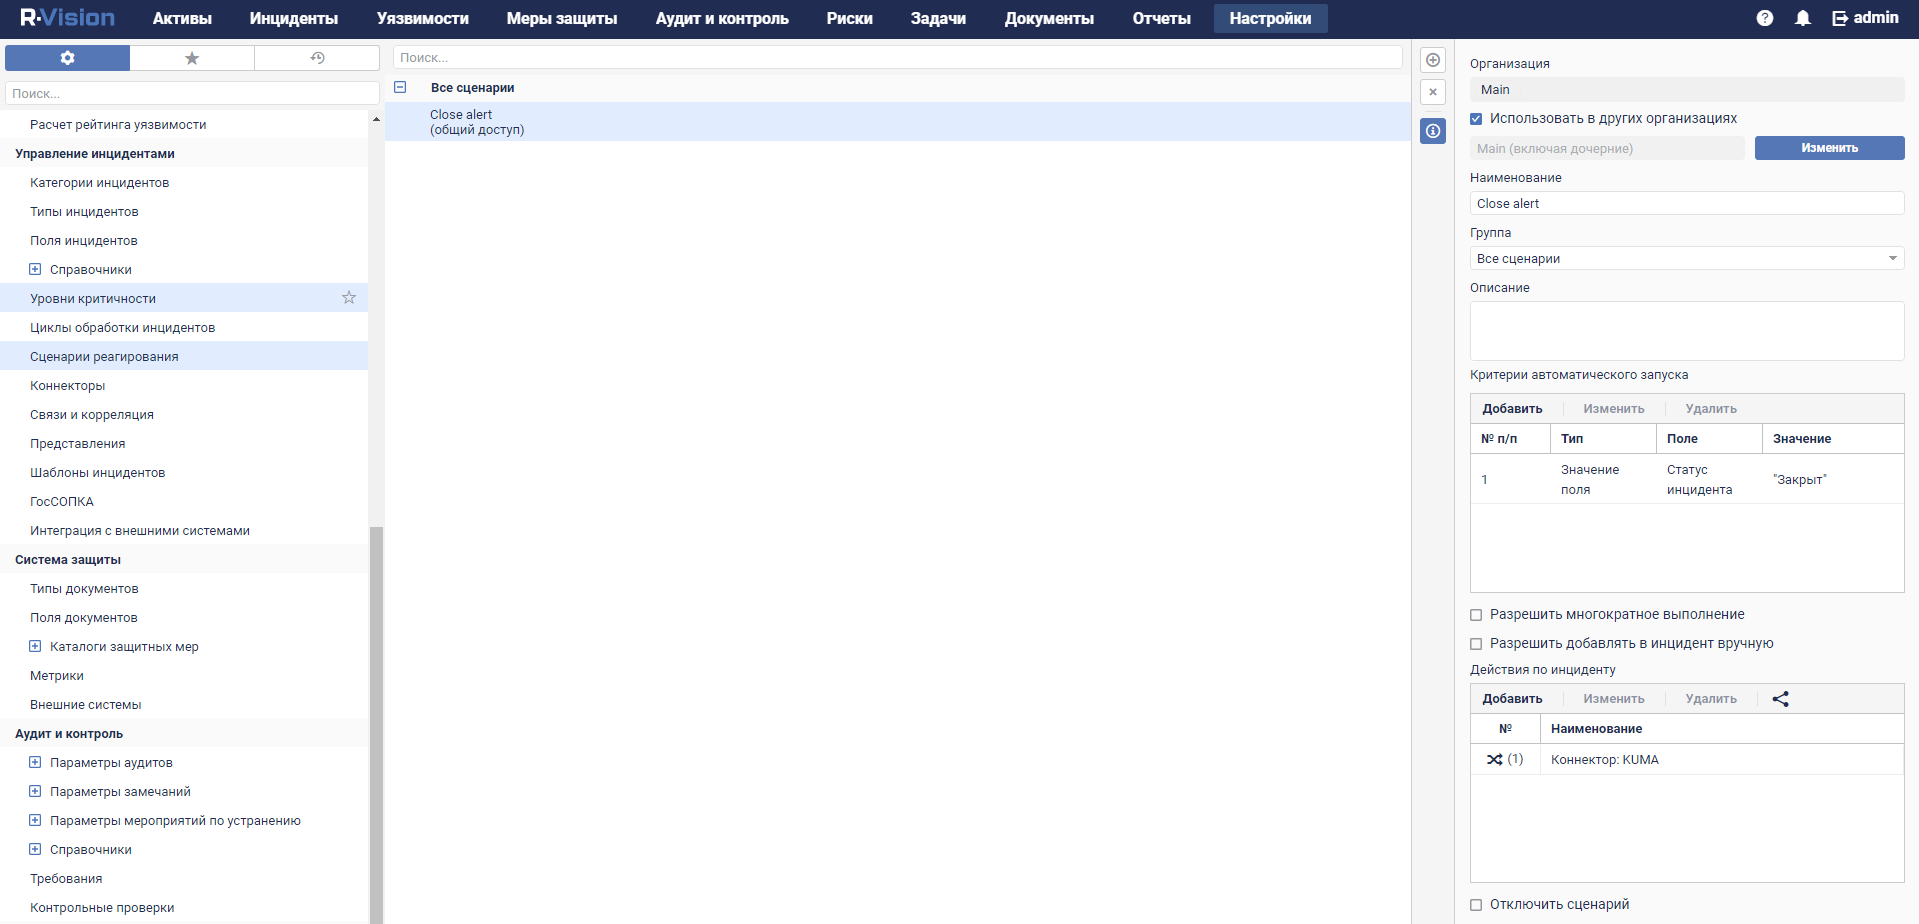
Managing alerts using R-Vision SOAR
After integration of KUMA and R-Vision SOAR is configured, data on KUMA alerts starts coming into R-Vision SOAR. Changes of alert parameters in KUMA are reflected in R-Vision SOAR. Any changes in the statuses of alerts in KUMA or R-Vision SOAR (except closing an alert) are also reflected in the other system.
Alert management scenarios when KUMA and R-Vision SOAR are integrated:
- Send cyberthreat data from KUMA to R-Vision SOAR
Data on detected alerts is automatically sent from KUMA to R-Vision SOAR. An incident is also created in R-Vision SOAR.
The following information about the KUMA alert is sent to R-Vision SOAR:
- ID.
- Name.
- Status.
- Date of the first event related to the alert.
- Date of the last detection related to the alert.
- User account name or email address of the security officer assigned to process the alert.
- Alert severity.
- Category of the R-Vision SOAR incident corresponding to the KUMA alert.
- Hierarchical list of events related to the alert.
- List of alert-related assets (internal and external).
- List of users related to the alert.
- Alert change log.
- Link to the alert in KUMA.
- Investigate cyberthreats in KUMA
Initial processing of an alert is performed in KUMA. The security officer can update and change any parameters of an alert except its ID and name. Any changes are reflected in the R-Vision SOAR incident card.
If a cyberthreat turns out to be a false positive and its alert is closed in KUMA, its corresponding incident in R-Vision SOAR is also automatically closed.
- Close incident in R-Vision SOAR
After all necessary work is completed on an incident and the course of the investigation is recorded in R-Vision SOAR, the incident is closed. The corresponding KUMA alert is also automatically closed.
- Open a previously closed incident
If active monitoring detects that an incident was not completely resolved or if additional information comes up, this incident is re-opened in R-Vision SOAR. However, the alert remains closed in KUMA.
The security officer can use a link to navigate from an R-Vision SOAR incident to the corresponding alert in KUMA and make the necessary changes to any of its parameters except the ID, name, and status of the alert. Any changes are reflected in the R-Vision SOAR incident card.
Further analysis is performed in R-Vision SOAR. When the investigation is complete and the incident is closed again in R-Vision SOAR, the status of the corresponding alert in KUMA remains closed.
- Request additional data from the source system as part of the response playbook or manually
If additional information is required from KUMA when analyzing incidents in R-Vision SOAR, in R-Vision SOAR, you can create a search request to KUMA (for example, you can request telemetry data, reputation, host information). This request is sent via KUMA REST API and the response is recorded in the R-Vision SOAR incident card for further analysis and reporting.
This same sequence of actions is performed during automatic processing if it is not possible to immediately save all information on an incident during an import.
Integration with Active Directory, Active Directory Federation Services and FreeIPA
You can integrate KUMA with the Active Directory, Active Directory Federation Services, and FreeIPA services used in your organization.
You can configure a connection to the Active Directory catalog service over the LDAP protocol. This lets you use information from Active Directory in correlation rules for enrichment of events and alerts, and for analytics.
If you configure a connection to a domain controller server, you can use domain authorization. In this case, you can bind the domain groups of users to the KUMA role filters. The users belonging to these groups will be able to use their domain account credentials to log in to the KUMA web interface and will obtain access to application sections based on their assigned role.
It is recommended to create the groups of users in Actions Active Directory, Active Directory Federation Services, or FreeIPA in advance if you want to provide such groups with the capability for authorization using their domain account in the KUMA web interface. An email address must be indicated in the properties of a user account in Active Directory.
Connecting over LDAP
LDAP connections are created and managed under Settings → LDAP server in the KUMA web interface. The LDAP server integration by tenant section shows the tenants for which LDAP connections were created. Tenants can be created or deleted.
If you select a tenant, the LDAP server integration window opens to show a table containing existing LDAP connections. Connections can be created or edited. In this window, you can change the frequency of queries sent to LDAP servers and set the retention period for obsolete data.
After integration is enabled, information about Active Directory accounts becomes available in the alert window, the correlation events detailed view window, and the incidents window. If you click an account name in the Related users section of the window, the Account details window opens with the data imported from Active Directory.
Data from LDAP can also be used when enriching events in collectors and in analytics.
Imported Active Directory attributes
For details about Active Directory attributes, please refer to the Microsoft documentation.
Enabling and disabling LDAP integration
You can enable or disable all LDAP connections of the tenant at the same time, or enable and disable an LDAP connection individually.
To enable or disable all LDAP connections of a tenant:
- In the KUMA web interface, open Settings → LDAP server and select the tenant for which you want to enable or disable all LDAP connections.
The LDAP server integration by tenant window opens.
- Select or clear the Disabled check box.
- Click Save.
To enable or disable a specific LDAP connection:
- In the KUMA web interface, open Settings → LDAP server and select the tenant for which you want to enable or disable an LDAP connection.
The LDAP server integration window opens.
- Select the relevant connection and either select or clear the Disabled check box in the opened window.
- Click Save.
Adding a tenant to the LDAP server integration list
To add a tenant to the list of tenants for integration with an LDAP server:
- Open the KUMA web interface and select Settings → LDAP server.
The LDAP server integration by tenant window opens.
- Click the Add tenant button.
The LDAP server integration window is displayed.
- In the Tenant drop-down list, select the tenant that you need to add.
- Click Save.
The selected tenant is added to the LDAP server integration list.
To delete a tenant from the list of tenants for integration with an LDAP server:
- Open the KUMA web interface and select Settings → LDAP server.
The LDAP server integration by tenant window is displayed.
- Select the check box next to the tenant that you need to delete, and click Delete.
- Confirm deletion of the tenant.
The selected tenant is deleted from the LDAP server integration list.
Page top
Creating an LDAP server connection
To create a new LDAP connection to Active Directory:
- In the KUMA web interface, open Settings → LDAP server.
- Select or create a tenant for which you want to create a LDAP connection.
The LDAP server integration by tenant window opens.
- Click the Add connection button.
The Connection parameters window opens.
- Add a secret containing the account credentials for connecting to the Active Directory server. To do so:
- If you previously added a secret, in the Secret drop-down list, select the existing secret (with the credentials type).
You can change the selected secret by clicking the pencil (
) icon. - If you want to create a new secret, click the plus () icon.
The Secret window opens.
- In the Name (required) field, enter the name of the secret containing 1 to 128 Unicode characters.
- In the User and Password (required) fields, enter the account credentials for connecting to the Active Directory server.
You can enter the user name in one of the following formats: <user name>@<domain> or <domain><user name>.
- In the Description field, enter a description of up to 4,000 Unicode characters.
- Click the Save button.
- If you previously added a secret, in the Secret drop-down list, select the existing secret (with the credentials type).
- In the Name (required) field, enter the unique name of the LDAP connection.
The length of the string must be 1 to 128 Unicode characters.
- In the URL (required) field, enter the address of the domain controller in the format
<hostname or IP address of server>:<port>.In case of server availability issues, you can specify multiple servers with domain controllers by separating them with commas. All of the specified servers must reside in the same domain.
- If you want to use TLS encryption for the connection with the domain controller, select one of the following options from the Type drop-down list:
- startTLS.
When the
method is used, first it establishes an unencrypted connection over port 389, then it sends an encryption request. If the STARTTLS command ends with an error, the connection is terminated.Make sure that port 389 is open. Otherwise, a connection with the domain controller will be impossible.
- LDAPS.
When using LDAPS, an encrypted connection is immediately established over port 636.
- insecure.
When using an encrypted connection, it is impossible to specify an IP address as a URL.
- startTLS.
- If you enabled TLS encryption at the previous step, add a TLS certificate. You must use the certificate of the certification authority that signed the LDAP server certificate. You may not use custom certificates. To add a certificate:
- If you previously uploaded a certificate, select it from the Certificate drop-down list.
If no certificate was previously added, the drop-down list shows No data.
- If you want to upload a new certificate, click the plus icon (
 ) on the right of the Certificate list.
The Secret window opens.
- In the Name field, enter the name that will be displayed in the list of certificates after the certificate is added.
- Click the Upload certificate file button to add the file containing the Active Directory certificate. X.509 certificate public keys in Base64 are supported.
- If necessary, provide any relevant information about the certificate in the Description field.
- Click the Save button.
The certificate will be uploaded and displayed in the Certificate list.
- If you previously uploaded a certificate, select it from the Certificate drop-down list.
- In the Timeout in seconds field, indicate the amount of time to wait for a response from the domain controller server.
If multiple addresses are indicated in the URL field, KUMA will wait the specified number of seconds for a response from the first server. If no response is received during that time, the application will contact the next server, and so on. If none of the indicated servers responds during the specified amount of time, the connection will be terminated with an error.
- In the Base DN field, enter the base distinguished name of the directory in which you need to run the search query.
- In the Custom AD Account Attributes field, specify the additional attributes that you want to use to enrich events.
- Select the Disabled check box if you do not want to use this LDAP connection.
This check box is cleared by default.
- Click the Save button.
The LDAP connection to Active Directory will be created and displayed in the LDAP server integration window.
Account information from Active Directory will be requested immediately after the connection is saved, and then it will be updated at the specified frequency.
If you want to use multiple LDAP connections simultaneously for one tenant, you need to make sure that the domain controller address indicated in each of these connections is unique. Otherwise KUMA lets you enable only one of these connections. When checking the domain controller address, the application does not check whether the port is unique.
Page top
Creating a copy of an LDAP server connection
You can create an LDAP connection by copying an existing connection. In this case, all settings of the original connection are duplicated in the newly created connection.
To copy an LDAP connection:
- In the KUMA web interface, open Settings → LDAP server and select the tenant for which you want to copy an LDAP connection.
The LDAP server integration window opens.
- Select the relevant connection.
- In the opened Connection parameters window, click the Duplicate connection button.
The New Connection window opens. The word
copywill be added to the connection name. - If necessary, change the relevant settings.
- Click the Save button.
The new connection is created.
If you want to use multiple LDAP connections simultaneously for one tenant, you need to make sure that the domain controller address indicated in each of these connections is unique. Otherwise KUMA lets you enable only one of these connections. When checking the domain controller address, the application does not check whether the port is unique.
Page top
Changing an LDAP server connection
To change an LDAP server connection:
- Open the KUMA web interface and select Settings → LDAP server.
The LDAP server integration by tenant window opens.
- Select the tenant for which you want to change the LDAP server connection.
The LDAP server integration window opens.
- Click the LDAP server connection that you want to change.
The window with the settings of the selected LDAP server connection opens.
- Make the necessary changes to the settings.
- Click the Save button.
The LDAP server connection is changed. Restart the KUMA services that use LDAP server data enrichment for the changes to take effect.
Page top
Changing the data update frequency
KUMA queries the LDAP server to update account data. This occurs:
- Immediately after creating a new connection.
- Immediately after changing the settings of an existing connection.
- According to a regular schedule every several hours. Every 12 hours by default.
- Whenever a user creates a task to update account data.
When querying LDAP servers, a task is created in the Task manager section of the KUMA web interface.
To change the schedule of KUMA queries to LDAP servers:
- In the KUMA web interface, open Settings → LDAP server → LDAP server integration by tenant.
- Select the relevant tenant.
The LDAP server integration window opens.
- In the Data refresh interval field, specify the required frequency in hours. The default value is 12.
The query schedule has been changed.
Page top
Changing the data storage period
Received user account data is stored in KUMA for 90 days by default if information about these accounts is no longer received from the Active Directory server. After this period, the data is deleted.
After KUMA account data is deleted, new and existing events are no longer enriched with this information. Account information will also be unavailable in alerts. If you want to view information about accounts throughout the entire period of alert storage, you must set the account data storage period to be longer than the alert storage period.
To change the storage period for the account data:
- In the KUMA web interface, open Settings → LDAP server → LDAP server integration by tenant.
- Select the relevant tenant.
The LDAP server integration window opens.
- In the Data storage time field, specify the number of days you need to store data received from the LDAP server.
The account data storage period is changed.
Page top
Starting account data update tasks
After a connection to an Active Directory server is created, tasks to obtain account data are created automatically. This occurs:
- Immediately after creating a new connection.
- Immediately after changing the settings of an existing connection.
- According to a regular schedule every several hours. Every 12 hours by default. The schedule can be changed.
Account data update tasks can be created manually. You can download data for all connections or for one connection of the required tenant.
To start an account data update task for all LDAP connections of a tenant:
- In the KUMA web interface, open Settings → LDAP server → LDAP server integration by tenant.
- Select the relevant tenant.
The LDAP server integration window opens.
- Click the Import accounts button.
A task to receive account data from the selected tenant is added to the Task manager section of the KUMA web interface.
To start an account data update task for one LDAP connection of a tenant:
- In the KUMA web interface, open Settings → LDAP server → LDAP server integration by tenant.
- Select the relevant tenant.
The LDAP server integration window opens.
- Select the relevant LDAP server connection.
The Connection parameters window opens.
- Click the Import accounts button.
A task to receive account data from the selected connection of the tenant is added to the Task manager section of the KUMA web interface.
Page top
Deleting an LDAP server connection
To delete LDAP connection to Active Directory:
- In the KUMA web interface, open Settings → LDAP server and select the tenant that owns the relevant LDAP connection.
The LDAP server integration window opens.
- Click the LDAP connection that you want to delete and click the Delete button.
- Confirm deletion of the connection.
The LDAP connection to Active Directory will be deleted.
Page top
Authentication using domain accounts
To enable users to perform authentication in the KUMA web interface using their own domain account credentials, perform the following configuration steps.
- Enable domain authentication if it is disabled.
Domain authorization is enabled by default, but a connection to the domain is not configured.
- Configure a connection to the domain controller.
The following connections are available:
The AD and ADFS connection settings can be configured at the same time.
You can connect to one domain only.
- Add groups of user roles.
You can specify a domain group for each KUMA role. After performing authentication using their domain accounts, the users from this group get access to the KUMA web interface in accordance with the specified role.
The application checks whether the user's group matches the specified filter in the following order of precedence of roles in the KUMA web interface: Junior analyst → Tier 1 analyst → Tier 2 analyst → Tenant administrator → General administrator. Upon the first match, the application assigns a role to the user and does not check any further. If a user matches two groups in the same tenant, the role with the most privileges is used. If multiple groups are matched for different tenants, the user will be assigned the specified role in each tenant.
After their first authentication, all domain users gain access to the default space, which is specified in the Spaces permissions section.
Special considerations for logging in after configuring domain authentication
For successful authentication, the following conditions must be met:
- FreeIPA: when logging into the system, the user must capitalize the domain name in the login. Example: user@FREEIPA.COM.
- AD/ADFS: when logging into the system, the user must specify UserPrincipalName in the login. Example: user@domain.ru.
If you complete all the configuration steps but the users are not able to use their domain accounts for authentication in the KUMA web interface, it is recommended to check the configuration for the following issues:
- An email address is not indicated in the properties of the user account in Active Directory. If this is the case, an error message is displayed during the user's first authentication attempt and a KUMA account is not created.
- There is already an existing local KUMA account with the email address indicated in the domain account properties. If this is the case, the error message is displayed when the user attempts to perform authentication with the domain account.
- Domain authorization is disabled in the KUMA settings.
- An error occurred when entering the group of roles.
- The domain user name contains a space.
Enabling and disabling domain authentication
Domain authorization is enabled by default, but a connection to the domain is not configured. If you want to temporarily suspend domain authentication after configuring a connection, you can disable it in the KUMA web interface without deleting the previously defined values of settings. If necessary, you can enable authentication again at any time.
To enable or disable domain authorization of users in the KUMA web interface:
- In the application web interface, select Settings → Domain authorization.
- In the Authorization type drop-down list, select one of the options:
- FreeIPA
- AD/ADFS
- Do one of the following:
- To disable domain authentication, select the Disabled check box in the upper part of the workspace.
- To enable domain authentication, clear the Disabled check box in the upper part of the workspace.
- Click the Save button.
The selected settings are saved and applied.
Page top
Configuring connection between KUMA and FreeIPA
You can connect only to one FreeIPA domain. To do so, you must configure a connection to the domain controller.
To configure a connection to a FreeIPA domain controller:
- In the application web interface, select Settings → Domain authorization.
- In the Authorization type drop-down list, select FreeIPA.
- Under FreeIPA, in the Base DN field, enter the DistinguishedName of the root record to search for access groups in the FreeIPA catalog service. Record format: dc=example,dc=com.
- In the URL field, indicate the address of the domain controller in the format
<hostname or IP address of server>:<port>.In case of server availability issues, you can specify up to three servers with domain controllers by separating them with commas. All of the specified servers must reside in the same domain.
- If you want to use TLS encryption for the connection with the domain controller, select one of the following options from the TLS mode drop-down list:
- startTLS.
When the startTLS method is used, first it establishes an unencrypted connection over port 389, then it sends an encryption request. If the STARTTLS command ends with an error, the connection is terminated.
Make sure that port 389 is open. Otherwise, a connection with the domain controller will be impossible.
- LDAPS.
When using LDAPS, an encrypted connection is immediately established over port 636.
- insecure.
When using an encrypted connection, it is impossible to specify an IP address as a URL.
- startTLS.
- If TLS encryption is enabled, the Secret field becomes required and you must specify a secret of the 'certificate' type in that field. If you previously uploaded a secret, select it from the Secret drop-down list. If necessary, click the button to create a new secret of the 'certificate' type and select the secret from the drop-down list.
- In the Timeout in seconds field, indicate the amount of time to wait for a response from the domain controller server. The default value is 0.
If multiple addresses are indicated in the URL field, KUMA waits for the specified number of seconds for a response from the first server. If no response is received during that time, the application contacts the next server. If none of the indicated servers responds during the specified amount of time, the connection will be terminated with an error.
- In the Custom integration secret drop-down list, select a secret with the 'credentials' type.
If you want to upload a new secret of the 'credentials' type, click the
button on the right of the Custom integration secret drop-down list. This opens the Secret window; in that window, in the Name field, enter the name of the secret that will be displayed in the list after it is saved. In the User field, specify the DistinguishedName in the following format: uid=admin,cn=users,cn=accounts,dc=ipa,dc=test. Enter the Password and click Save.The secret is uploaded and becomes available for selection in the Custom integration secret drop-down list.
- If you want to configure domain authentication for a user with the KUMA general administrator role, use the General administrators group field to specify the DistinguishedName of the FreeIPA group containing the user. Additional roles for the General administrator are automatically activated in KUMA, therefore, you do not need to add them separately.
In the case when multiple groups are specified for a user in the same tenant, the role with the highest-level permissions is used, with additional roles, if additional roles are assigned.
Filter input example:
CN=KUMA team,OU=Groups,OU=Clients,DC=test,DC=domain. - Click the Save button.
A connection with the FreeIPA domain controller is now configured.
You can also check the connection for the previously entered domain controller connection settings.
To check the connection to the domain controller:
- In the application web interface, select Settings → Domain authorization.
- In the Authorization type drop-down list, select FreeIPA.
- Under FreeIPA, select the relevant secret in the User credentials field.
If necessary, you can create a new secret by clicking the
button or change the settings of an existing secret by clicking the button. If integration with FreeIPA is enabled, the secret selection is always reset when the page is loaded. - Click Test.
After clicking the Test button, the system tests the connection with the domain and returns a notification with the test results. The system does not check if the users can log in or if the user group is configured correctly.
For domain authentication, add the groups for the KUMA user roles.
You can specify the groups only for the roles that require the configuration of domain authentication. You can leave the rest of the fields empty.
To add groups of user roles:
- In the application web interface, select Settings → Domain authorization.
- Under Administration groups, click Add role groups.
- In the Tenant drop-down list, select the tenant of the users for whom you want to configure domain authentication. The Shared tenant is displayed in the drop-down list, but you cannot assign a role to it because the only role in the Shared tenant is the Access to shared resources additional role, and additional roles do not participate in domain authentication.
- In the Selected roles drop-down list, specify the roles for the user. You can select multiple roles. The following values are available:
- Tenant administrator
- Tier 2 analyst
- Tier 1 analyst
- Junior analyst
After you select the roles, a group filter field is displayed for each role. In the fields for each role, specify the DistinguishedName of the domain group. The users of this domain group must have the capability to perform authentication with their domain accounts. Group input example:
CN=KUMA team,OU=Groups,OU=Clients,DC=test,DC=domain.You can define a separate set of role filters for each tenant.
If no filter is specified for a role, this means that conditions for creating an account through domain authentication are not specified for that role. Authentication with that role is impossible.
After the first authentication under a domain account, domain user cards are created for users in the Settings → Users section. For a domain user, the ability to change the main role (General administrator, Tenant administrator, Tier 2 analyst, Tier 1 analyst, Junior analyst) is blocked in the user card, while additional roles can be added or removed (Access to CII, Interaction with NCIRCC, Access to shared resources), including management of additional role assignment to tenants. Roles assigned in the Domain authorization section and roles assigned in the user card supplement each other. For the General administrator, additional roles in KUMA are automatically activated, therefore you do not need to add them separately. If the General administrator role was assigned to a domain user, and the General administrator role was subsequently revoked, additional roles must be reassigned in the user card in the Settings → Users section.
You can specify only one domain group for each role. If you want to specify multiple groups, you must repeat steps 2 to 4 for each group while specifying the same tenant.
- If necessary, repeat steps 2–4 for each tenant for which you want to configure domain authentication with the following roles: Junior analyst, Tier 1 analyst, Tier 2 analyst, or Tenant administrator.
- Click the Save button.
The groups of user roles will be added. The defined settings will be applied the next time the user logs in to the KUMA web interface.
After the first authentication of the user, information about this user is displayed under Settings → Users. The Login and Password fields received from the domain cannot be edited. The user role will also be unavailable for editing. To edit a role, you will have to change the user role groups. Changes to a role are applied after the next authentication of the user. The user continues working under the current role until the current session expires.
If the user name or email address is changed in the domain account properties, these changes must be manually made in the KUMA account.
Page top
Configuring connection between KUMA and Active Directory
You can connect only to one Active Directory domain. To do so, you must configure a connection to the domain controller.
To configure a connection to an Active Directory domain controller:
- In the application web interface, select Settings → Domain authorization.
- In the Authorization type drop-down list, select AD/ADFS.
- In the Active Directory group of settings, in the Base DN field, enter the DistinguishedName of the root record to search for access groups in the Active Directory catalog service.
- In the URL field, indicate the address of the domain controller in the format
<hostname or IP address of server>:<port>.In case of server availability issues, you can specify multiple servers with domain controllers by separating them with commas. All of the specified servers must reside in the same domain.
- If you want to use TLS encryption for the connection with the domain controller, select one of the following options from the TLS mode drop-down list:
- startTLS.
When the startTLS method is used, first it establishes an unencrypted connection over port 389, then it sends an encryption request. If the STARTTLS command ends with an error, the connection is terminated.
Make sure that port 389 is open. Otherwise, a connection with the domain controller will be impossible.
- LDAPS.
When using LDAPS, an encrypted connection is immediately established over port 636.
- insecure.
When using an encrypted connection, it is impossible to specify an IP address as a URL.
- startTLS.
- If you enabled TLS encryption at the previous step, add a TLS certificate:
- If you previously uploaded a certificate, select it from the Secret drop-down list.
If no certificate was previously added, the drop-down list shows No data.
- If you want to upload a new certificate, click the button on the right of the Secret list. In the opened window, in the Name field, enter the name that will be displayed in the list of certificates after the certificate is added. Add the file containing the Active Directory certificate (X.509 certificate public keys in Base64 are supported) by clicking the Upload certificate file button. Click the Save button.
The certificate will be uploaded and displayed in the Secret list.
- If you previously uploaded a certificate, select it from the Secret drop-down list.
- In the Timeout in seconds field, indicate the amount of time to wait for a response from the domain controller server.
If multiple addresses are indicated in the URL field, KUMA waits for the specified number of seconds for a response from the first server. If no response is received during that time, the application contacts the next server. If none of the indicated servers responds during the specified amount of time, the connection will be terminated with an error.
- To configure domain authentication for a user with the KUMA general administrator role, specify the DistinguishedName of the Active Directory group the user belongs to in the General administrators group field. Additional roles for the General administrator are automatically activated in KUMA, therefore you do not need to add them separately.
In the case when multiple groups are specified for a user in the same tenant, the role with the highest-level permissions is used, with additional roles, if additional roles are assigned.
Filter input example:
CN=KUMA team,OU=Groups,OU=Clients,DC=test,DC=domain. - Click the Save button.
A connection with the Active Directory domain controller is now configured.
You can also check the connection for the previously entered domain controller connection settings.
To check the connection to the domain controller:
- In the application web interface, select Settings → Domain authorization.
- In the Authorization type drop-down list, select AD/ADFS.
- Under Test connection, select the relevant secret in the User credentials field.
If necessary, you can create a new secret by clicking the
button or change the settings of an existing secret by clicking the button. The following formats for specifying a user are available in the User field: UserPrincipalName and domain\user.
- Click Test.
After clicking the Test button, the system tests the connection with the domain and returns a notification with the test results. The system does not check if the users can log in or if the user group is configured correctly.
For domain authentication, add the groups for the KUMA user roles.
You can specify the groups only for the roles that require the configuration of domain authentication. You can leave the rest of the fields empty.
To add groups of user roles:
- In the application web interface, select Settings → Domain authorization.
- Under Administration groups, click Add role groups.
- In the Tenant drop-down list, select the tenant of the users for whom you want to configure domain authentication. The Shared tenant is displayed in the drop-down list, but you cannot assign a role to it because the only role in the Shared tenant is the Access to shared resources additional role, and additional roles do not participate in domain authentication.
- In the Selected roles drop-down list, specify the roles for the user. You can select multiple roles. The following values are available:
- Tenant administrator
- Tier 2 analyst
- Tier 1 analyst
- Junior analyst
After you select the roles, a group filter field is displayed for each role. In the fields for each role, specify the DistinguishedName of the domain group. The users of this domain group must have the capability to perform authentication with their domain accounts. Group input example:
CN=KUMA team,OU=Groups,OU=Clients,DC=test,DC=domain.You can define a separate set of role filters for each tenant.
If no filter is specified for a role, this means that conditions for creating an account through domain authentication are not specified for that role. Authentication with that role is impossible.
After the first authentication under a domain account, domain user cards are created for users in the Settings → Users section. For a domain user, the ability to change the main role (General administrator, Tenant administrator, Tier 2 analyst, Tier 1 analyst, Junior analyst) is blocked in the user card, while additional roles can be added or removed (Access to CII, Interaction with NCIRCC, Access to shared resources), including management of additional role assignment to tenants. Roles assigned in the Domain authorization section and roles assigned in the user card supplement each other. For the General administrator, additional roles in KUMA are automatically activated, therefore you do not need to add them separately. If the General administrator role was assigned to a domain user, and the General administrator role was subsequently revoked, additional roles must be reassigned in the user card in the Settings → Users section.
You can specify only one domain group for each role. If you want to specify multiple groups, you must repeat steps 2 to 4 for each group while specifying the same tenant.
- If necessary, repeat steps 2–4 for each tenant for which you want to configure domain authentication with the following roles: Junior analyst, Tier 1 analyst, Tier 2 analyst, or Tenant administrator.
- Click the Save button.
The groups of user roles will be added. The defined settings will be applied the next time the user logs in to the KUMA web interface.
After the first authentication of the user, information about this user is displayed under Settings → Users. The Login and Password fields received from the domain cannot be edited. The user role will also be unavailable for editing. To edit a role, you will have to change the user role groups. Changes to a role are applied after the next authentication of the user. The user continues working under the current role until the current session expires.
If the user name or email address is changed in the domain account properties, these changes must be manually made in the KUMA account.
Page top
Configuring connection between KUMA and Active Directory Federation Services
To configure domain authentication in KUMA and ensure that users can log in to KUMA using their accounts without specifying a user name and password, first create a connection group and configure the rules in ADFS or make sure that the necessary connection groups and rules already exist.
After configuration, the Sign in via ADFS button appears on the KUMA login page.
The Sign in via ADFS button is hidden on the KUMA login page in the following conditions:
- The FreeIPA option is selected in the Authorization type drop-down list.
- The AD/ADFS option is selected in the Authorization type drop-down list and the settings for ADFS are not specified or the Disabled check box is selected for ADFS settings.
You can connect only to one ADFS domain. To do so, you must configure a connection to the domain controller.
To configure a connection to an ADFS domain controller:
- In the application web interface, select Settings → Domain authorization.
- In the Authorization type drop-down list, select AD/ADFS.
- Under Active Directory Federation Services, in the Client ID field, enter the KUMA ID from the Client ID field in the ADFS.
- In the Relying party identifier field, enter the KUMA ID from the Relying party identifiers field in the ADFS.
- Enter the Connect Metadata URI from the Connect Metadata URI field. This parameter consists of the host where the ADFS resides (https://adfs.example.com), and the endpoint setting (/adfs/.well-known/openid-configuration).
For example, https://adfs.example.com/adfs/.well-known/openid-configuration).
- Enter the ADFS redirect URL from the Redirect URL field in the ADFS. The value of the Redirect URL field in the ADFS is defined when the Application group is configured. In the ADFS, you must indicate the KUMA FQDN and the </sso-callback> substring. In KUMA, the URL must be indicated without the substring, for example: https://kuma-example:7220/
- If you want to configure domain authentication for a user with the KUMA general administrator role, use the General administrators group field to specify the DistinguishedName of the Active Directory Federation Services group containing the user. Additional roles for the General administrator are automatically activated in KUMA, therefore, you do not need to add them separately.
In the case when multiple groups are specified for a user in the same tenant, the role with the highest-level rights is used, with additional rights, if additional roles are assigned.
Filter input example:
CN=KUMA team,OU=Groups,OU=Clients,DC=test,DC=domain. - Click the Save button.
A connection with the Active Directory Federation Services domain controller is now configured.
If, when trying to log in to KUMA via ADFS, the user gets an Access denied pop-up message, click the Reset certificate button. A new certificate will be generated automatically.
For domain authentication, add the groups for the KUMA user roles.
You can specify the groups only for the roles that require the configuration of domain authentication. You can leave the rest of the fields empty.
To add groups of user roles:
- In the application web interface, select Settings → Domain authorization.
- Under Administration groups, click Add role groups.
- In the Tenant drop-down list, select the tenant of the users for whom you want to configure domain authentication. The Shared tenant is displayed in the drop-down list, but you cannot assign a role to it because the only role in the Shared tenant is the Access to shared resources additional role, and additional roles do not participate in domain authentication.
- In the Selected roles drop-down list, specify the roles for the user. You can select multiple roles. The following values are available:
- Tenant administrator
- Tier 2 analyst
- Tier 1 analyst
- Junior analyst
After you select the roles, a group filter field is displayed for each role. In the fields for each role, specify the DistinguishedName of the domain group. The users of this domain group must have the capability to perform authentication with their domain accounts. Group input example:
CN=KUMA team,OU=Groups,OU=Clients,DC=test,DC=domain.You can define a separate set of role filters for each tenant.
If no filter is specified for a role, this means that conditions for creating an account through domain authentication are not specified for that role. Authentication with that role is impossible.
After the first authentication under a domain account, domain user cards are created for users in the Settings → Users section. For a domain user, the ability to change the main role (General administrator, Tenant administrator, Tier 2 analyst, Tier 1 analyst, Junior analyst) is blocked in the user card, while additional roles can be added or removed (Access to CII, Interaction with NCIRCC, Access to shared resources), including management of additional role assignment to tenants. Roles assigned in the Domain authorization section and roles assigned in the user card supplement each other. For the General administrator, additional roles in KUMA are automatically activated, therefore you do not need to add them separately. If the General administrator role was assigned to a domain user, and the General administrator role was subsequently revoked, additional roles must be reassigned in the user card in the Settings → Users section.
You can specify only one domain group for each role. If you want to specify multiple groups, you must repeat steps 2 to 4 for each group while specifying the same tenant.
- If necessary, repeat steps 2–4 for each tenant for which you want to configure domain authentication with the following roles: Junior analyst, Tier 1 analyst, Tier 2 analyst, or Tenant administrator.
- Click the Save button.
The groups of user roles will be added. The defined settings will be applied the next time the user logs in to the KUMA web interface.
After the first authentication of the user, information about this user is displayed under Settings → Users. The Login and Password fields received from the domain cannot be edited. The user role will also be unavailable for editing. To edit a role, you will have to change the user role groups. Changes to a role are applied after the next authentication of the user. The user continues working under the current role until the current session expires.
If the user name or email address is changed in the domain account properties, these changes must be manually made in the KUMA account.
Page top
Configuring connection in Active Directory Federation Services
This section provides instructions on how to create a new connection group and configure rules for the created connection group in Active Directory Federation Services (ADFS).
The ADFS role must already be configured on the server.
Creating a new connection group
- In Server Manager, in the Tools menu, select ADFS Management.
In ADFS, select the Application groups section and in the Actions section click Add Application Group.
- In the Add Application Group Wizard window that opens, in the Welcome section Name field, specify the name of the new connection group. Example: new-application-group.
In the Template field, in the Client-Server applications group, select Native application accessing a web API.
Click Next to proceed to the next step of creating and configuring a connection group.
- In the Native application section that opens, the Name and
Client Identifier
fields are filled in automatically.Specify the value of the Client Identifier field in KUMA, when configuring domain authentication.
In the
Redirect URI field, enter the URI for redirection from ADFS with the /sso-callback substring, and click Add. Example: https://adfs.example.com:7220/sso-callbackClick Next to proceed to the next configuration step.
- In the Configure Web API section that opens, in the Identifiers field, add the trusted party ID and click Add. It can be any arbitrary value. Example: test-demo
Specify the value of the Identifier field in KUMA, in the Relying party identifiers field, when configuring domain authentication.
Click Next to proceed to the next configuration step.
- In the Apply Access Control Policy section that opens, select the Permit everyone policy value.
Click Next to proceed to the next configuration step.
- In the Configure Application Permissions section that opens, the Client application field is filled in automatically.
In the Permitted scopes field, select the check box for the allatclaims and openid options.
Click Next to proceed to the next configuration step.
- In the Summary section that opens, check the settings.
If the settings are correct and you are ready to add a group, click Next.
A new group is added. You can proceed to configure the rules for the created group.
Adding rules for a connection group
- In Server Manager, in the Tools menu, select ADFS Management.
In ADFS, select the Application groups section and select the required connection group from the list. Example: new-application-group.
- In the Application groups window, in the Actions section, click Properties.
In the new-application-group Properties window that opens, in the Applications section, double-click new-application-group - Web API.
In the new-application-group - Web API Properties window that opens, open the
Issuance Transform Rules
tab and click Add rule.In the Add Transform Claim Rule Wizard window that opens, in the Choose Rule Type section, select Send LDAP Attributes as Claims from the drop-down list.
Click Next to proceed to the next configuration step.
- In the Configure Claim Rule section, specify the rule name in the Claim rule name field. Example: rule-name-01.
In the Attribute store drop-down list, select Active directory.
In the Mapping of LDAP attributes to outgoing claim types field, map the following fields:
LDAP Attribute
Outgoing Claim Type
User-Principal-NameUserPrincipalNameDisplay-NamedisplayNameE-Mail-AddressesMailIs-Member-Of-DLMemberOfClick Finish to complete the configuration.
- Go to the new-application-group - Web API Properties window, open the
Issuance Transform Rules
tab and click Add rule. In the Add Transform Claim Rule Wizard window that opens, in the Choose Rule Type section, select Send claims using a custom rule from the drop-down list.Click Finish to continue the configuration.
- In the Configure Claim Rule section, specify the rule name in the Claims rule name field. Example: rule-name-02.
In the Custom rule field, specify the following settings:
c:[Type == "http://schemas.microsoft.com/ws/2008/06/identity/claims/windowsaccountname", Issuer == "AD AUTHORITY"]=> issue(store = "Active Directory", types = ("ObjectGUID"), query = ";ObjectGUID;{0}", param = c.Value);Click Finish to complete the configuration.
- The system proceeds to the new-application-group - Web API Properties window and the Issuance Transform Rules tab.
To apply the rules, on the Issuance Transform Rules tab that opens, click Apply or OK.
The configuration of groups and rules in ADFS is completed. You can proceed to configure domain authentication in KUMA.
Page top
Troubleshooting the Access denied error
When you try to log in to KUMA using ADFS, the Access denied or Insufficient rights pop-up message may appear. The KUMA Core log shows the Data source certificate has been changed error.
This error indicates that the ADFS certificate has been changed. To fix the error and resume domain authentication, in domain controller connection settings, click the Reset certificate button. A new certificate will be generated automatically.
Page top
NCIRCC integration
In the KUMA web interface, you can create a connection to the National Computer Incident Response & Coordination Center Incidents (hereinafter referred to as "NCIRCC"). This will let you export incidents registered by KUMA to NCIRCC. Integration is configured under Settings → NCIRCC in the KUMA web interface. All fields that you fill out in the settings section are automatically sent to the NCIRCC data submission form.
Data in KUMA and NCIRCC is synchronized every 5-10 minutes.
To create a connection to NCIRCC:
- In the KUMA web interface, open Settings → NCIRCC.
- In the URL field, enter the URL for accessing NCIRCC.
- Under Token, create or select an existing secret with the API token that was issued to your organization for a connection to NCIRCC:
- If you already have a secret, you can select it from the drop-down list.
- If you want to create a new secret:
- Click the plus () icon and specify the following settings:
- Name (required)—unique name of the resource you are creating. The name must contain 1 to 128 Unicode characters.
- Token (required)—token that was issued to your organization for a connection to NCIRCC.
- Description—service description: up to 256 Unicode characters.
- Click Save.
The secret containing the token for connecting to NCIRCC will be created. It is saved under Resources → Secrets and is owned by the main tenant.
- Click the plus (
You can change the selected secret by clicking the pencil (
) icon. - In the Company scope drop-down list, select the required value.
- In the Company name field, specify the name of the company for which you are configuring the integration.
- In the Location drop-down list, specify the location of your company.
- In the Root CA section of settings, create or select an existing secret:
- If you already have a secret, you can select it from the drop-down list.
- If you want to create a new secret:
- Click the plus () icon and specify the following settings:
- Name (required)—unique name of the resource you are creating. The name must contain 1 to 128 Unicode characters.
- Type (required)—the type of secret.
- Certificate file—click Upload certificate file and select the certificate of the intermediate certification authority that is downloaded and installed on the KUMA Core server.
Download and install the certificate of the intermediate certification authority.
- Description—service description: up to 256 Unicode characters.
- Click Save.
The secret with the certificate of the intermediate certification authority is created. It is saved under Resources → Secrets and is owned by the main tenant.
- Click the plus (
You can change the selected secret by clicking the pencil (
) icon. - If necessary, under Proxy, create or select an existing proxy server that must be used when connecting to NCIRCC.
- Click Save.
KUMA is now integrated with NCIRCC. Now you can export incidents to it. You can click the Test connection button to make sure that a connection with NCIRCC is established.
You can use the Disabled check box to enable or disable integration.
Possible errors
If the https://lk.cert.gov.ru/api/v2/incidents? x509: certificate signed by unknown authority error is returned when you configure integration with NCIRCC, download and install the certificate of the intermediate certification authority on the KUMA Core server.
Integration with the Security Orchestration Automation and Response Platform (SOAR)
Security Orchestration, Automation and Response Platform (hereinafter referred to as SOAR) is a software platform used for automation of monitoring, processing, and responding to information security incidents. It aggregates cyberthreat data from various sources into a single database for further analysis and investigation to facilitate incident response capabilities.
SOAR can be integrated with KUMA. After configuring integration, you can perform the following tasks in SOAR:
- Request information about alerts from KUMA. In SOAR, incidents are created based on received data.
- Send requests to KUMA to close alerts.
Integration is implemented by using the KUMA REST API. On the Security Vision IRP side, integration is carried out by using the preconfigured Kaspersky KUMA connector. Contact your SOAR vendor to learn more about the methods and conditions for obtaining a Kaspersky KUMA connector.
Managing SOAR incidents
SOAR incidents generated from KUMA alert data can be viewed in SOAR under Incidents → Incidents (2 lines) → All incidents (2 lines). Events related to KUMA alerts are logged in each SOAR incident. Imported events can be viewed on the Response tab.
KUMA alert imported into SOAR as an incident
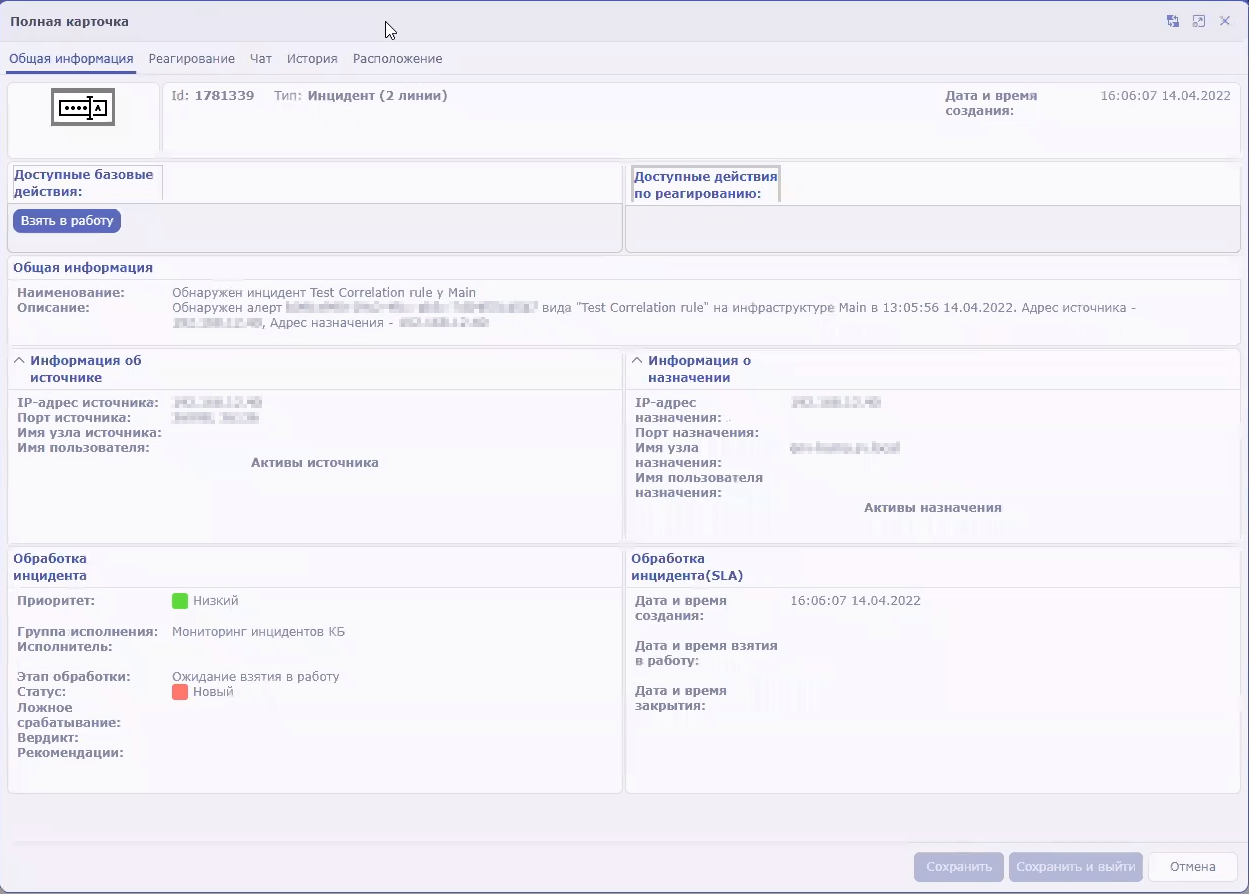
Security Vision IRP incident that was created based on KUMA alert
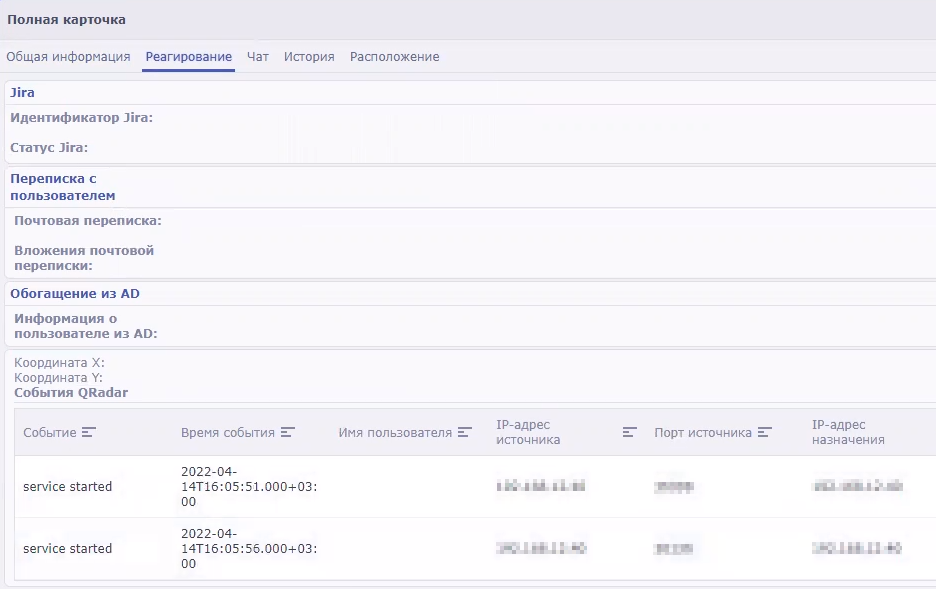
Events from KUMA alert that were imported to Security Vision IRP
Configuring integration in KUMA
To configure KUMA integration with SOAR, you must configure authorization of API requests in KUMA. To do so, you need to create a token for the KUMA user on whose behalf the API requests will be processed on KUMA side.
A token can be generated in your account profile. Users with the General Administrator role can generate tokens in the accounts of other users. You can always generate a new token.
To generate a token in your account profile:
- In the KUMA web interface, click the user account name in the lower-left corner of the window and click the Profile button in the opened menu.
The User window with your user account parameters opens.
- Click the Generate token button.
- Copy the generated token displayed in the opened window. You will need it to configure SOAR.
When the window is closed, the token is no longer displayed. If you did not copy the token before closing the window, you will have to generate a new token.
The generated token must be specified in the SOAR connector settings.
Configuring integration in SOAR
Configuration of integration in SOAR consists of importing and configuring a connector. If necessary, you can also change other SOAR settings related to KUMA data processing, such as the data processing schedule and worker.
For more detailed information about configuring SOAR, please refer to the product documentation.
Importing and configuring a connector
Adding a connector to SOAR
Integration of SOAR and KUMA is performed using the Kaspersky KUMA connector. Contact your SOAR vendor to learn more about the methods and conditions for obtaining a Kaspersky KUMA connector.
To import the Kaspersky KUMA connector to SOAR:
- In SOAR, open the Settings → Connectors → Connectors section.
A list of connectors added to SOAR is displayed.
- At the top of the screen, click the import button and select the ZIP archive containing the Kaspersky KUMA connector.
The connector is imported into SOAR and is ready to be configured.
Configuring a connector for a connection to KUMA
To use a connector, you need to configure its connection to KUMA.
To configure a connection to KUMA in SOAR using the Kaspersky KUMA connector:
- In SOAR, open the Settings → Connectors → Connectors section.
A list of connectors added to your SOAR is displayed.
- Select the Kaspersky KUMA connector.
The general settings of the connector will be displayed.
- Under Connector settings, click the Edit button.
The connector configuration will be displayed.
- In the URL field, specify the address and port of KUMA. For example,
kuma.example.com:7223. - In the Token field, specify KUMA user API token.
The connection to KUMA is configured in the SOAR connector.
Security Vision IRP connector settings
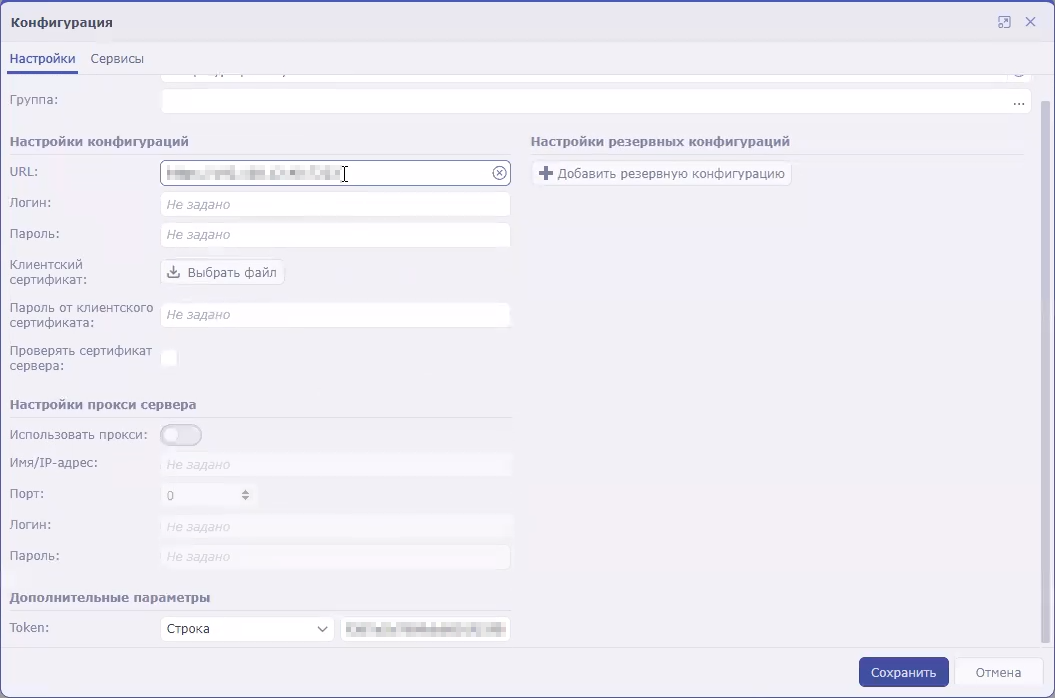
Configuring commands for interaction with KUMA in the SOAR connector
You can use SOAR to receive information about KUMA alerts (referred to as incidents in SOAR terminology) and send requests to close these alerts. To perform these actions, you need to configure the appropriate commands in the SOAR connector.
The instructions below describe how to add commands to receive and close alerts. However, if you need to implement more complex logic of interaction between SOAR and KUMA, you can similarly create your own commands containing other API requests.
To configure a command to receive alert information from KUMA:
- In SOAR, open the Settings → Connectors → Connectors section.
A list of connectors added to SOAR is displayed.
- Select the Kaspersky KUMA connector.
The general settings of the connector will be displayed.
- Click the +Command button.
The command creation window opens.
- Specify the command settings for receiving alerts:
- In the Name field, enter the command name:
Receive incidents. - In the Request type drop-down list, select GET.
- In the Called method field, enter the API request to search for alerts:
api/v1/alerts/?withEvents&status=new - Under Request headers, in the Name field, indicate
authorization. In the Value field, indicate Bearer <token>. - In the Content type drop-down list, select application/json.
- In the Name field, enter the command name:
- Save the command and close the window.
The connector command is configured. When this command is executed, the SOAR connector queries KUMA for information about all alerts with the New status and all events related to those alerts. The received data is sent to the SOAR processor, which uses it to create SOAR incidents. If new data appears in an alert that has been already imported into SOAR, incident information is updated in SOAR.
To configure a command to close KUMA alerts:
- In SOAR, open the Settings → Connectors → Connectors section.
A list of connectors added to SOAR is displayed.
- Select the Kaspersky KUMA connector.
The general settings of the connector will be displayed.
- Click the +Command button.
The command creation window will be displayed.
- Specify the command settings for receiving alerts:
- In the Name field, enter the command name:
Close incident. - In the Request type drop-down list, select POST.
- In the Called method field, enter API request to close an alert:
api/v1/alerts/close - In the Request field, enter the contents of the sent API request:
{"id":"<Alert ID>","reason":"responded"}You can create multiple commands for different reasons to close alerts, such as responded, incorrect data, and incorrect correlation rule.
- Under Request headers, in the Name field, indicate
authorization. In the Value field, indicate Bearer <token>. - In the Content type drop-down list, select application/json.
- In the Name field, enter the command name:
- Save the command and close the window.
The connector command is configured. When this command is executed, the incident is closed in SOAR and the corresponding alert is closed in KUMA.
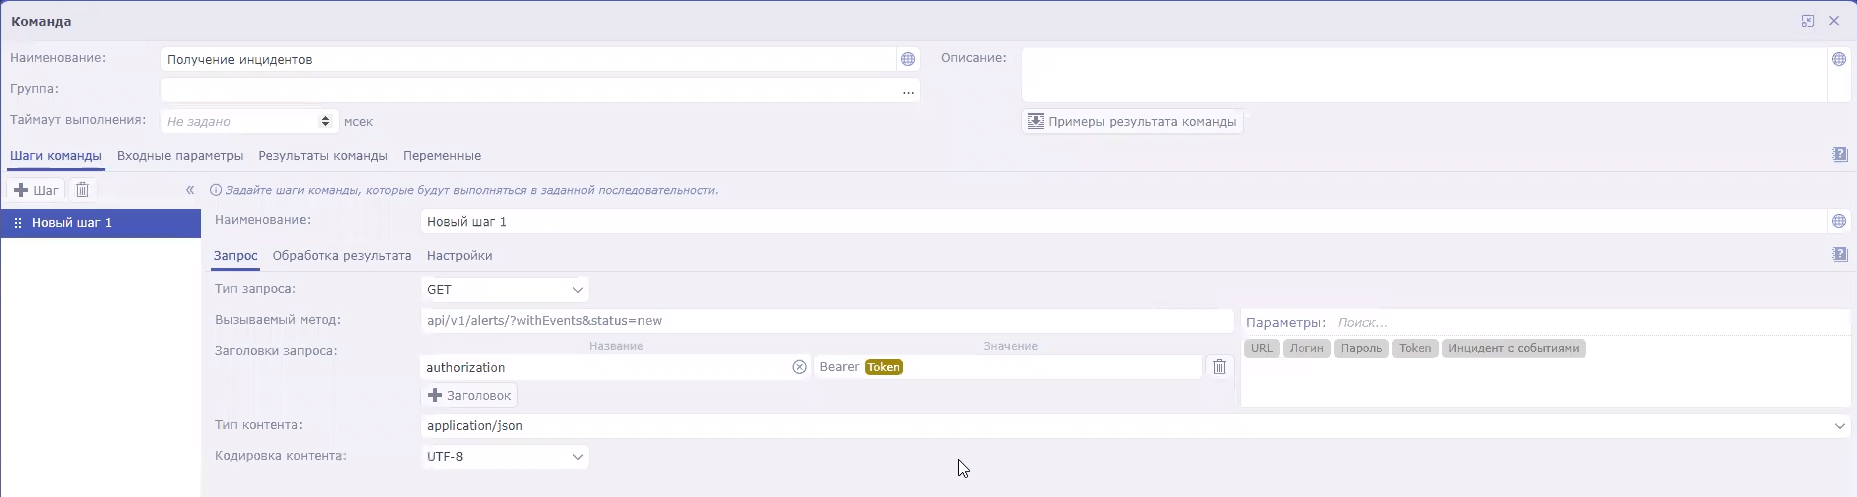
After the SOAR connector is configured, KUMA alerts are sent to the platform as SOAR incidents. Then you need to configure incident handling in SOAR based on the security policies of your organization.
Page top
Configuring the handler, schedule, and worker process
SOAR handler
The SOAR handler receives information about KUMA alerts from the SOAR connector and uses the information to create SOAR incidents. A predefined KUMA (Incidents) handler is used for processing data. The settings of the KUMA (Incidents) handler are available in SOAR under Settings → Event processing → Event handlers:
- You can view the rules for processing KUMA alerts in the handler settings on the Normalization tab.
- You can view the actions available when creating new objects in the handler settings on the Actions tab for creating objects of the Incident (2 lines) type.
Handler run schedule
The connector and handler are started according to a predefined KUMA schedule. This schedule can be configured in SOAR under Settings → Event processing → Schedule:
- Under Connector settings, you can configure the settings for starting the connector.
- Under Handler settings, you can configure the settings for starting the handler.
SOAR workflow
The life cycle of SOAR incidents created based on KUMA alerts follows the preconfigured Incident processing (2 lines) worker. The worker can be configured in SOAR under Settings → Workers → Worker templates: select the Incident processing (2 lines) worker and click the transaction or state that you need to change.
Page top
Integration with KICS/KATA
Kaspersky Industrial CyberSecurity for Networks (hereinafter referred to as "KICS/KATA") is an application designed to protect the industrial enterprise infrastructure from information security threats, and to ensure uninterrupted operation. The application analyzes industrial network traffic to identify deviations in the values of process parameters, detect signs of network attacks, and monitor the operation and current state of network devices.
KICS/KATA version 4.0 or later can be integrated with KUMA. After configuring integration, you can perform the following tasks in KUMA:
- Import asset information from KICS/KATA to KUMA.
Import of asset information from KATA version 7.1 is available only in KUMA version 4.0 and later.
- Send asset status change commands from KUMA to KICS/KATA.
Unlike KUMA, KICS/KATA refers to assets as devices.
The integration of KICS/KATA and KUMA must be configured in both applications:
- In KICS for Networks, you need to create a KUMA connector and save the communication data package of this connector.
- In KUMA, the communication data package of the connector is used to create a connection to KICS/KATA.
The integration described in this section applies to importing asset information. KICS/KATA can also be configured to send events to KUMA. To do so, you need to create a SIEM/Syslog connector in KICS/KATA and configure a collector on the KUMA side.
Configuring integration in KICS for Networks
The application supports integration with KICS for Networks version 4.0 or later.
It is recommended to configure integration of KICS for Networks and KUMA after ending Process Control rules learning mode. For more details, please refer to the KICS for Networks documentation.
On the KICS for Networks side, integration configuration consists of creating a KUMA-type connector. In KICS for Networks, connectors are specialized application modules that enable KICS for Networks to exchange data with recipient systems, including KUMA. For more details on creating connectors, please refer to the KICS for Networks documentation.
When a connector is added to KICS for Networks, a communication data package is automatically created for this connector. This is an encrypted configuration file for connecting to KICS for Networks that is used when configuring integration on the KUMA side.
Page top
Configuring integration in KUMA
It is recommended to configure integration of KICS for Networks and KUMA after ending Process Control rules learning mode. For more details, please refer to the KICS for Networks documentation.
To configure integration with KICS/KATA in KUMA:
- Open the KUMA web interface and select Settings → Kaspersky Industrial CyberSecurity for Networks.
This opens the KICS/KATA server integration by tenant window.
- Select or create a tenant for which you want to create an integration with KICS for Networks.
This opens the KICS/KATA server integration window.
- Click the Communication data package field and select the communication data package that was created in KICS for Networks.
- In the Communication data package password field, enter the password of the communication data package.
- Select the Enable response check box if you want to change the statuses of KICS for Networks assets by using KUMA response rules.
- Click Save.
Integration with KICS/KATA is configured in KUMA, and the window displays the IP address of the node where the KICS/KATA connector will be running and its ID.
Page top
Enabling and disabling integration with KICS for Networks
To enable or disable KICS for Networks integration for a tenant:
- In the KUMA web interface, open the Settings → KICS/KATA section and select the tenant for which you want to enable or disable KICS for Networks integration.
This opens the KICS/KATA server integration window.
- Select or clear the Disabled check box.
- Click Save.
Changing the data update frequency
KUMA queries KICS for Networks to update its asset information. This occurs:
- Immediately after creating a new integration.
- Immediately after changing the settings of an existing integration.
- According to a regular schedule every several hours. This occurs every 3 hours by default.
- Whenever a user creates a task for updating asset data.
When querying KICS for Networks, a task is created in the Task manager section of the KUMA web interface.
To edit the schedule for importing information about KICS for Networks assets:
- In the KUMA web interface, open the Settings → KICS/KATA section.
- Select the relevant tenant.
This opens the KICS/KATA server integration window.
- In the Data refresh interval field, specify the required frequency in hours. The default value is 3.
The import schedule has been changed.
Special considerations when importing asset information from KICS for Networks
Importing assets
Assets are imported according to the asset import rules. Only assets with the Authorized and Unauthorized statuses are imported.
KICS for Networks assets are identified by a combination of the following parameters:
- IP address of the KICS for Networks instance with which the integration is configured.
- KICS for Networks connector ID is used to configure the integration.
- ID assigned to the asset (or "device") in the KICS for Networks instance.
Importing vulnerability information
When importing assets, KUMA also receives information about active vulnerabilities in KICS for Networks. If a vulnerability has been flagged as Remediated or Negligible in KICS for Networks, the information about this vulnerability is deleted from KUMA during the next import.
Information about asset vulnerabilities is displayed in the localization language of KICS for Networks in the Asset details window under Vulnerabilities.
In KICS for Networks, vulnerabilities are referred to as risks and are divided into several types. All types of risks are imported into KUMA.
Imported data storage period
If information about a previously imported asset is no longer received from KICS for Networks, the asset is deleted after 30 days.
Page top
Changing the status of a KICS for Networks asset
After configuring integration, you can change the statuses of KICS for Networks assets from KUMA. Statuses can be changed either automatically or manually.
Asset statuses can be changed only if you enabled a response in the settings for connecting to KICS for Networks.
Manually changing the status of a KICS for Networks asset
Users with the General administrator, Tenant administrator, and Tier 2 analyst roles can manually change the statuses of assets imported from KICS for Networks in the tenants available to them.
To manually change a KICS for Networks asset status:
- In the Assets section of the KUMA web interface, click the asset that you want to edit.
The Asset details area opens in the right part of the window.
- In the Status in KICS/KATA drop-down list, select the status that you want to assign to the KICS for Networks asset. The Authorized or Unauthorized statuses are available.
The asset status is changed. The new status is displayed in KICS for Networks and in KUMA.
Automatically changing the status of a KICS for Networks asset
Automatic changes to the statuses of KICS for Networks assets are implemented using response rules. The rules must be added to the correlator, which will determine the conditions for triggering these rules.
Page top
Integration with NeuroDAT SIEM IM
NeuroDAT SIEM IM is an information security monitoring system.
You can configure the export of KUMA events to NeuroDAT SIEM IM. Based on incoming events and correlation rules, NeuroDAT SIEM IM automatically generates information security incidents.
To configure integration with NeuroDAT SIEM IM:
- Connect to the NeuroDAT SIEM IM server over SSH using an account with administrative privileges.
- Create a backup copy of the /opt/apache-tomcat-<server version>/conf/neurodat/soz_settings.properties configuration file.
- In the /opt/apache-tomcat-<server version>/conf/neurodat/soz_settings.properties configuration file, edit the following settings as follows:
kuma.on=trueThis setting is an attribute of NeuroDAT SIEM IM interaction with KUMA.
job_kuma=com.cbi.soz.server.utils.scheduler.KumaIncidentsJobjobDelay_kuma=5000jobPeriod_kuma=60000
- Save changes of the configuration file.
- Run the following command to restart the tomcat service:
sudo systemctl restart tomcat - Obtain a token for the user in KUMA. To do so:
- Open the KUMA web interface, click the name of your user account in the bottom-left corner of the window and click the Profile button in the opened menu.
This opens the User window with your user account settings.
- Click the Generate token button.
The New token window opens.
- If necessary, set the token expiration date:
- Select the No expiration date check box.
- In the Expiration date field, use the calendar to specify the date and time when the created token will expire.
- Click the Generate token button.
The Token field with an automatically generated token is displayed in the user details area. Copy it.
When the window is closed, the token is no longer displayed. If you did not copy the token before closing the window, you will have to generate a new token.
- Click Save.
- Open the KUMA web interface, click the name of your user account in the bottom-left corner of the window and click the Profile button in the opened menu.
- Log in to NeuroDAT SIEM IM using the 'admin' account or another account that has the Administrator role for the organization you are configuring or the Administrator role for all organizations.
- In the Administration → Organization structure menu item, select or create an organization that you want to receive incidents from KUMA.
- On the organization form, do the following:
- Select the Configure integration with KUMA check box.
- In the KUMA IP address and port field, specify the KUMA API address, for example,
https://192.168.58.27:7223/api/v1/. - In the KUMA API key field, specify the user token obtained at step 6.
- Save the organization information.
Integration with KUMA is configured.
NeuroDAT SIEM IM tests access to KUMA and, if successful, displays a message about being ready to receive data from KUMA.
Page top
Kaspersky Automated Security Awareness Platform
Kaspersky Automated Security Awareness Platform (hereinafter also referred to as "ASAP") is an online learning platform that allows users to learn the rules of information security and threats related to it in their daily work, as well as to practice using real examples.
ASAP can be integrated with KUMA. After configuring integration, you can perform the following tasks in KUMA:
- Change user learning groups.
- View information about the courses taken by the users and the certificates they received.
Integration between ASAP and KUMA includes configuring API connection to ASAP. The process takes place in both solutions:
- In ASAP, create an authorization token and obtain an address for API requests.
- In KUMA, specify the address for API requests in ASAP, add an authorization token for API requests, and specify the email address of the ASAP administrator to receive notifications.
Creating a token in ASAP and getting a link for API requests
In order to be authorized, the API requests from KUMA to ASAP must be signed by a token created in ASAP. Only the company administrators can create tokens.
Creating a token
To create a token:
- Sign in to the ASAP web interface.
- In the Control panel section, click Import and synchronization, and then open the Open API tab.
- Click the New token button and select the API methods used for integration in the window that opens:
- GET /openapi/v1/groups
- POST /openapi/v1/report
- PATCH /openapi/v1/user/:userid
- Click the Generate token button.
- Copy the token and save it in any convenient way. This token is required to configure integration in KUMA.
The token is not stored in the ASAP system in the open form. After you close the Get token window, the token is unavailable for viewing. If you close the window without copying the token, you will need to click the New token button again for the system to generate a new token.
The issued token is valid for 12 months. After this period, the token is revoked. The issued token is also revoked if it is not used for 6 months.
Getting a link for API requests
To get the link used in ASAP for API requests:
- Sign in to the ASAP web interface.
- In the Control panel section, click Import and synchronization, and then open the Open API tab.
- A link for accessing ASAP using the Open API is located at the bottom part of the window. Copy the link and save it in any convenient way. This link is required to configure integration in KUMA.
Configuring integration in KUMA
To configure KUMA integration with ASAP:
- Open the KUMA web interface and select Settings → Kaspersky Automated Security Awareness Platform.
The Kaspersky Automated Security Awareness Platform window opens.
- In the Secret field click the plus () icon to create a secret of the token by entering the token received from ASAP:
- In the Name field, enter the name of the secret. Must contain 1 to 128 Unicode characters.
- In the Token field, enter the authorization token for API requests to ASAP.
- If necessary, add the secret description in the Description field.
- Click Save.
- In the ASAP Open API URL field, specify the address used by ASAP for API requests.
- In the ASAP administrator email field, specify the email address of the ASAP administrator who receives notifications when users are added to the learning groups using KUMA.
- If necessary, in the Proxy drop-down list select the proxy server resource to be used to connect to ASAP.
- To disable or enable integration with ASAP, select or clear the Disabled check box.
- Click Save.
Integration with ASAP is configured in KUMA. When viewing information about alerts and incidents, you can select associated users to view which learning courses they have taken and to change their learning group.
Page top
Viewing information about the users from ASAP and changing learning groups
After configuring the integration between ASAP and KUMA, the following information from ASAP becomes available in alerts and incidents when you view data about associated users:
- The learning group to which the user belongs.
- The trainings passed by the user.
- The planned trainings and the current progress.
- The received certificates.
To view data about the user from ASAP:
- In the KUMA web interface, in the Alerts or Incidents section, select the required alert or incident.
- In the Related users section, click the desired account.
The Account details window opens on the right side of the screen.
- Select the ASAP courses details tab.
The window displays information about the user from ASAP.
You can change the learning group of a user in ASAP.
To change a user learning group in ASAP:
- In the KUMA web interface, in the Alerts or Incidents section, select the required alert or incident.
- In the Related users section, click the desired account.
The Account details window opens on the right side of the screen.
- In the Assign ASAP group drop-down list, select the ASAP learning group you want to assign the user to.
- Click Apply.
The user is moved to the selected ASAP group, the ASAP company administrator is notified of the change in the learning group, and the study plan is recalculated for the selected learning group.
For details on learning groups and how to get started, refer to the ASAP documentation.
Page top
Sending notifications to Telegram
This integration is an example and may require additional configuration depending on the versions used and the specifics of the infrastructure.
Compatibility is confirmed only for KUMA 2.0 and later.
The terms and conditions of premium technical support do not apply to this integration; support requests are processed without a guaranteed response time.
You can configure sending notifications to Telegram when KUMA correlation rules are triggered. This can reduce the response time to threats and, if necessary, make more persons informed.
Configure Telegram notifications involves the following steps:
- Creating and configuring a Telegram bot
A special bot sends notifications about triggered correlation rules. It can send notifications to a private or group Telegram chat.
- Creating a script for sending notifications
You must create a script and save it on the server where the correlator is installed.
- Configuring notifications in KUMA
Configure a KUMA response rule that starts a script to send notifications and add this rule to the correlator.
Creating and configuring a Telegram bot
To create and configure a Telegram bot:
- In the Telegram application, find the BotFather bot and open a chat with it.
- In the chat, click Start.
- Create a new bot using the following command:
/newbot - Enter the name of the bot.
- Enter the login name of the bot.
The bot is created. You receive a link to the chat that looks like t.me/<bot login> and a token for contacting the bot.
- If you want to use the bot in a group chat, and not in private messages, edit privacy settings:
- In the BotFather chat, enter the command:
/mybots - Select the relevant bot from the list.
- Click Bot Settings → Group Privacy and select Turn off.
The bot can now send messages to group chats.
- In the BotFather chat, enter the command:
- To open a chat with the bot you created, use the t.me/<botlogin> link that you obtained at step 5, and click Start.
- If you want the bot to send private messages to the user:
- In the chat with the bot, send any message.
- Follow the https://t.me/getmyid_bot link and click Start.
- The response contains the
Current chat ID. You need this value to configure the sending of messages.
- If you want the bot to send messages to the group chat:
- Add https://t.me/getmyid_bot to the group chat for receiving notifications from KUMA.
The bot sends a message to the group chat, the message contains the
Current chat IDvalue. You need this value to configure the sending of messages. - Remove the bot from the group.
- Add https://t.me/getmyid_bot to the group chat for receiving notifications from KUMA.
- Send a test message through the bot. To do so, paste the following link into the address bar of your browser:
https://api.telegram.org/bot<token>/sendMessage?chat_id=<chat_id>&text=testwhere
<token>is the value obtained at step 5, and<chat_id>is the value obtained at step 8 or 9.
As a result, a test message should appear in the personal or group chat, and the JSON in the browser response should be free of errors.
Page top
Creating a script for sending notifications
To create a script:
- In the console of the server on which the correlator is installed, create a script file and add the following lines to it:
#!/bin/bash
set -eu
CHAT_ID=
<Current chat ID value obtained at step 8 or 9 of the Telegram bot setup instructions>TG_TOKEN=
<token value obtained at step 5 of the Telegram bot setup instructions>RULE=$1
TEXT="<b>$RULE</b> rule triggered"
curl --data-urlencode "chat_id=$CHAT_ID" --data-urlencode "text=$TEXT" --data-urlencode "parse_mode=HTML" https://api.telegram.org/bot$TG_TOKEN/sendMessage
If the correlator server does not have internet access, you can use a proxy server:
#!/bin/bash
set -eu
CHAT_ID=
<Current chat ID value obtained at step 8 or 9 of the Telegram bot setup instructions>TG_TOKEN=
<token value obtained at step 5 of the Telegram bot setup instructions>RULE=$1
TEXT="<b>$RULE</b> rule triggered."
PROXY=<
address and port of the proxy server>curl --proxy $PROXY --data-urlencode "chat_id=$CHAT_ID" --data-urlencode "text=$TEXT" --data-urlencode "parse_mode=HTML" https://api.telegram.org/bot$TG_TOKEN/sendMessage
- Save the script to the correlator directory at /opt/kaspersky/kuma/correlator/<
ID of the correlator that must respond to events>/scripts/.For information about obtaining the correlator ID, see the Getting service identifier section.
- Make the 'kuma' user the owner of the file and grant execution rights:
chown kuma:kuma /opt/kaspersky/kuma/correlator/<ID of the correlator that must respond>/scripts/<script name>.shchmod +x /opt/kaspersky/kuma/correlator/<ID of the correlator that must respond>/scripts/<script name>.sh
Configuring sending notifications in KUMA
To configure the sending of KUMA notifications to Telegram:
- Create a response rule:
- In the KUMA web interface, select the Resources → Response rules section and click Add response rule.
- This opens the Create response rule window; in that window, in the Name field, enter the name of the rule.
- In the Tenant drop-down list, select the tenant that owns the resource.
- In the Type drop-down list, select Run script.
- In the Script name field, enter the name of the script.
- In the Script arguments field, enter
{{.Name}}.This passes the name of the correlation event as the argument of the script.
- Click Save.
- Add the response rule to the correlator:
- In the Resources → Correlators section, select the correlator in whose folder you placed the created script for sending notifications.
- In the steps tree, select Response rules.
- Click Add.
- In the Response rule drop-down list, select the rule added at step 1 of these instructions.
- In the steps tree, select Setup validation.
- Click the Save and restart services button.
- Click the Save button.
Sending notifications about triggered KUMA rules to Telegram is configured.
UserGate integration
This integration is an example and may require additional configuration depending on the versions used and the specifics of the infrastructure.
Compatibility is confirmed only for KUMA 2.0 or later and UserGate 6.0 or later.
The terms and conditions of premium technical support do not apply to this integration; support requests are processed without a guaranteed response time.
UserGate is a network infrastructure security solution that protects personal information from the risks of external intrusions, unauthorized access, viruses, and malware.
Integration with UserGate allows automatically blocking threats by IP address, URL, or domain name whenever KUMA response rules are triggered.
Configuring the integration involves the following steps:
- Configuring integration in UserGate
- Preparing a script for the response rule
- Configuring the KUMA response rule
Configuring integration in UserGate
To configure integration in UserGate:
- Connect to the UserGate web interface under an administrator account.
- Go to UserGate → Administrators → Administrator profiles, and click Add.
- In the Profile settings window, specify the profile name, for example,
API. - On the API Permissions tab, add read and write permissions for the following objects:
- content
- core
- firewall
- nlists
- Click Save.
- In the UserGate → Administrators section, click Add → Add local administrator.
- In the Administrator properties window, specify the login and password of the administrator.
In the Administrator profile field, select the profile created at step 3.
- Click Save.
- In the address bar of your browser, after the address and port of UserGate, add
?features=zone-xml-rpcand press ENTER. - Go to the Network → Zones section and for the zone of the interface that you want to use for API interaction, go to the Access Control tab and select the check box next to the XML-RPC for management service.
If necessary, you can add the IP address of the KUMA correlator whose correlation rules must trigger blocking in UserGate, to the list of allowed addresses.
- Click Save.
Preparing a script for integration with UserGate
To prepare a script for use:
- Copy the ID of the correlator whose correlation rules you want to trigger blocking of URL, IP address, or domain name in UserGate:
- In the KUMA web interface, go to the Resources → Active services.
- Select the check box next to the correlator whose ID you want to obtain, and click Copy ID.
The correlator ID is copied to the clipboard.
- Download the script:
- Open the script file and in the Enter UserGate Parameters section, in the login and password parameters, specify the credentials of the UserGate administrator account that was created at step 7 of configuring the integration in UserGate.
- Place the downloaded script on the KUMA correlator server at the following path: /opt/kaspersky/kuma/correlator/<
correlator ID from step 1>/scripts/. - Connect to the correlator server via SSH and go to the path from step 4:
cd /opt/kaspersky/kuma/correlator/<correlator ID from step 1>/scripts/ - Run the following command:
chmod +x ug.py && chown kuma:kuma ug.py
The script is ready to use.
Page top
Configuring a response rule for integration with UserGate
To configure a response rule:
- Create a response rule:
- In the KUMA web interface, select the Resources → Response rules section and click Add response rule.
- This opens the Create response rule window; in that window, in the Name field, enter the name of the rule.
- In the Tenant drop-down list, select the tenant that owns the resource.
- In the Type drop-down list, select Run script.
- In the Script name field, enter the name of the script.
ug.py. - In the Script arguments field, specify:
- one of the operations depending on the type of the object being blocked:
blockurlto block access by URLblockipto block access by IP addressblockdomainto block access by domain name
-i {{<KUMA field from which the value of the blocked object must be taken, depending on the operation>}}Example:
blockurl -i {{.RequetstUrl}}
- one of the operations depending on the type of the object being blocked:
- In the Conditions section, add conditions corresponding to correlation rules that require blocking in UserGate when triggered.
- Click Save.
- Add the response rule to the correlator:
- In the Resources → Correlators section, select the correlator that must respond and in whose directory you placed the script.
- In the steps tree, select Response rules.
- Click Add.
- In the Response rule drop-down list, select the rule added at step 1 of these instructions.
- In the steps tree, select Setup validation.
- Click Save and reload services.
- Click the Save button.
The response rule is linked to the correlator and ready to use.
Page top
Integration with Kaspersky Web Traffic Security
This integration is an example and may require additional configuration depending on the versions used and the specifics of the infrastructure.
Compatibility is confirmed only for KUMA 2.0 or later and Kaspersky Web Traffic Security 6.0 or later.
The terms and conditions of premium technical support do not apply to this integration; support requests are processed without a guaranteed response time.
You can configure integration with the Kaspersky Web Traffic Security web traffic analysis and filtering system (hereinafter also referred to as "KWTS").
Configuring the integration involves creating KUMA response rules that allow running KWTS tasks. Tasks must be created in advance in the KWTS web interface.
Configuring the integration involves the following steps:
- Configuring integration in KWTS
- Preparing a script for the response rule
- Configuring the KUMA response rule
Configuring integration in KWTS
To prepare the integration in KWTS:
- Connect to the KWTS web interface under an administrator account and create a role with permissions to view and create/edit a rule.
For more details on creating a role, see the Kaspersky Web Traffic Security Help.
- Assign the created role to a user with NTML authentication.
You can use a local administrator account instead.
- In the Rules section, go to the Access tab and click Add rule.
- In the Action drop-down list, select Block.
- In the Traffic filtering drop-down list, select the URL value, and in the field on the right, enter a nonexistent or known malicious address.
- In the Name field, enter the name of the rule.
- Enable the rule using the Status toggle switch.
- Click Add.
- In the KWTS web interface, open the rule you just created.
- Make a note of the ID value that is displayed at the end of the page address in the browser address bar.
You must use this value when configuring the response rule in KUMA.
The integration is prepared on the KWTS side.
Page top
Preparing a script for integration with KWTS
To prepare a script for use:
- Copy the ID of the correlator whose correlation rules you want to trigger blocking of URL, IP address, or domain name in KWTS:
- In the KUMA web interface, go to the Resources → Active services.
- Select the check box next to the correlator whose ID you want to obtain, and click Copy ID.
The correlator ID is copied to the clipboard.
- To get the script and the library, please contact Technical Support.
- Place the script provided by Technical Support on the KUMA correlator server at the following path: /opt/kaspersky/kuma/correlator/<
correlator ID from step 1>/scripts/. - Connect to the correlator server via SSH and go to the path from step 3:
cd /opt/kaspersky/kuma/correlator/<correlator ID from step 1>/scripts/ - Run the following command:
chmod +x kwts.py kwtsWebApiV6.py && chown kuma:kuma kwts.py kwtsWebApiV6.py
The script is ready to use.
Page top
Configuring a response rule for integration with KWTS
To configure a response rule:
- Create a response rule:
- In the KUMA web interface, select the Resources → Response rules section and click Add response rule.
- This opens the Create response rule window; in that window, in the Name field, enter the name of the rule.
- In the Tenant drop-down list, select the tenant that owns the resource.
- In the Type drop-down list, select Run script.
- In the Script name field, enter the name of the script, kwts.py.
- In the Script arguments field, specify:
--host— address of the KWTS server.--username— name of the user account created in KWTS or local administrator.--password— KWTS user account password.--rule_id— ID of the rule created in KWTS.- Specify one of the options depending on the type of the object being blocked:
--url— specify the field of the KUMA event from which you want to obtain the URL, for example,{{.RequestUrl}}.--ip— specify the field of the KUMA event from which you want to obtain the IP address, for example,{{.DestinationAddress}}.--domain— specify the field of the KUMA event from which you want to obtain the domain name, for example,{{.DestinationHostName}}.
--ntlm— specify this option if the KWTS user was created with NTLM authentication.Example:
--host <address> --username <user> --password <pass> --rule_id <id> --url {{.RequestUrl}}
- In the Conditions section, add conditions corresponding to correlation rules that require blocking in KWTS when triggered.
- Click Save.
- Add the response rule to the correlator:
- In the Resources → Correlators section, select the correlator that must respond and in whose directory you placed the script.
- In the steps tree, select Response rules.
- Click Add.
- In the Response rule drop-down list, select the rule added at step 1 of these instructions.
- In the steps tree, select Setup validation.
- Click Save and reload services.
- Click the Save button.
The response rule is linked to the correlator and ready to use.
Page top
Integration with Kaspersky Secure Mail Gateway
This integration is an example and may require additional configuration depending on the versions used and the specifics of the infrastructure.
Compatibility is confirmed only for KUMA 2.0 or later and Kaspersky Secure Mail Gateway 2.0 or later.
The terms and conditions of premium technical support do not apply to this integration; support requests are processed without a guaranteed response time.
You can configure integration with the Kaspersky Secure Mail Gateway mail traffic analysis and filtering system (hereinafter also referred to as "KSMG").
Configuring the integration involves creating KUMA response rules that allow running KSMG tasks. Tasks must be created in advance in the KSMG web interface.
Configuring the integration involves the following steps:
- Configuring integration in KSMG
- Preparing a script for the response rule
- Configuring the KUMA response rule
Configuring integration in KSMG
To prepare the integration in KSMG:
- Connect to the KSMG web interface under an administrator account and create a role with permissions to view and create/edit a rule.
For more details on creating a role, see the Kaspersky Secure Mail Gateway Help.
- Assign the created role to a user with NTML authentication.
You can use the 'Administrator' local administrator account.
- In the Rules section, click Create.
- In the left pane, select the General section.
- Enable the rule using the Status toggle switch.
- In the Rule name field, enter the name of the new rule.
- Under Mode, select one of the message processing options that meets the criteria of this rule.
- Under Sender on the Email addresses tab, enter a nonexistent or known malicious sender address.
- Under Recipient on the Email addresses tab, specify the relevant recipients or the "*" character to select all recipients.
- Click the Save button.
- In the KSMG web interface, open the rule you just created.
- Make a note of the ID value that is displayed at the end of the page address in the browser address bar.
You must use this value when configuring the response rule in KUMA.
The integration is prepared on the KSMG side.
Page top
Preparing a script for integration with KSMG
To prepare a script for use:
- Copy the ID of the correlator whose correlation rules must trigger the blocking of the IP address or email address of the message sender in KSMG:
- In the KUMA web interface, go to the Resources → Active services.
- Select the check box next to the correlator whose ID you want to obtain, and click Copy ID.
The correlator ID is copied to the clipboard.
- To get the script and the library, please contact Technical Support.
- Place the script provided by Technical Support on the KUMA correlator server at the following path: /opt/kaspersky/kuma/correlator/<
correlator ID from step 1>/scripts/. - Connect to the correlator server via SSH and go to the path from step 3:
cd /opt/kaspersky/kuma/correlator/<correlator ID from step 1>/scripts/ - Run the following command:
chmod +x ksmg.py ksmgWebApiV2.py && chown kuma:kuma ksmg.py ksmgWebApiV2.py
The script is ready to use.
Page top
Configuring a response rule for integration with KSMG
To configure a response rule:
- Create a response rule:
- In the KUMA web interface, select the Resources → Response rules section and click Add response rule.
- This opens the Create response rule window; in that window, in the Name field, enter the name of the rule.
- In the Tenant drop-down list, select the tenant that owns the resource.
- In the Type drop-down list, select Run script.
- In the Script name field, enter the name of the script, ksmg.py.
- In the Script arguments field, specify:
--host— address of the KSMG server.--username— name of the user account created in KSMG.You can specify the Administrator account.
--password— KSMG user account password.--rule_id— ID of the rule created in KSMG.- Specify one of the options depending on the type of the object being blocked:
--email— specify the field of the KUMA event from which you want to obtain the URL, for example,{{.SourceUserName}}.--ip— specify the field of the KUMA event from which you want to obtain the IP address, for example,{{.SourceAddress}}.
--ntlm— specify this option if the KSMG user was created with NTLM authentication.Example:
--host <address> --username <user> --password <pass> --ntlm --rule_id <id> --email {{.SourceUserName}}
- In the Conditions section, add conditions corresponding to the correlation rules that when triggered require blocking the IP address or email address of the message sender in KSMG.
- Click Save.
- Add the response rule to the correlator:
- In the Resources → Correlators section, select the correlator that must respond and in whose directory you placed the script.
- In the steps tree, select Response rules.
- Click Add.
- In the Response rule drop-down list, select the rule added at step 1 of these instructions.
- In the steps tree, select Setup validation.
- Click Save and reload services.
- Click the Save button.
The response rule is linked to the correlator and ready to use.
Page top
Importing asset information from RedCheck
This integration is an example and may require additional configuration depending on the versions used and the specifics of the infrastructure.
Compatibility is confirmed only for KUMA 2.0 or later and RedCheck 2.6.8 or later.
The terms and conditions of premium technical support do not apply to this integration; support requests are processed without a guaranteed response time.
RedCheck is a system for monitoring and managing the information security of an organization.
You can import asset information from RedCheck network device scan reports into KUMA.
Import is available from simple "Vulnerabilities" and "Inventory" reports in CSV format, grouped by hosts.
Imported assets are displayed in the KUMA web interface in the Assets section. If necessary, you can edit the settings of assets.
Data is imported through the API using the redcheck-tool.py utility. The utility requires Python 3.6 or later and the following libraries:
- csv
- re
- json
- requests
- argparse
- sys
To import asset information from a RedCheck report:
- Generate a network asset scan report in RedCheck in CSV format and copy the report file to the server where the script is located.
For more details about scan tasks and output file formats, refer to the RedCheck documentation.
- Create a file with the token for accessing the KUMA REST API.
The account for which the token is created must satisfy the following requirements:
- Tenant administrator or Tier 2 analyst role.
- Access to the tenant into which the assets will be imported.
- Rights to use API requests: GET /assets, GET /tenants, POST/assets/import.
- Download the script:
- Copy the redcheck-tool.py tool to the server hosting the KUMA Core and make the tool's file executable:
chmod +x <path to the redcheck-tool.py file> - Run the redcheck-tool.py utility:
python3 redcheck-tool.py --kuma-rest <address and port of the KUMA REST API server> --token <API token> --tenant <name of the tenant in which the assets must be placed> --vuln-report <full path to the "Vulnerabilities" report file> --inventory-report <full path to the "Inventory" report file>Example:
python3 --kuma-rest example.kuma.com:7223 --token 949fc03d97bad5d04b6e231c68be54fb --tenant Main --vuln-report /home/user/vuln.csv --inventory-report /home/user/inventory.csvYou can use additional flags and commands for import operations. For example, the
-vcommand displays an extended report on the received assets. A detailed description of the available flags and commands is provided in the "Flags and commands of redcheck-tool.py" table. You can also use the--helpcommand to view information on the available flags and commands.
The asset information is imported from the RedCheck report to KUMA. The console displays information on the number of new and updated assets.
Example:
|
Example of extended import information:
|
The tool works as follows when importing assets:
- KUMA overwrites the data of assets imported through the API, and deletes information about their resolved vulnerabilities.
- KUMA skips assets with invalid data.
Flags and commands of redcheck-tool.py
Flags and commands
Mandatory
Description
--kuma-rest <address and port of the KUMA server>Yes
Port 7223 is used for API requests by default. You can change the port if necessary.
--token <token>Yes
The value of the option must contain only the token.
The Tenant administrator or Tier 2 analyst role must be assigned to the user account for which the API token is being generated.
--tenant <tenant name>Yes
Name of the KUMA tenant in which the assets from the RedCheck report will be imported.
--vuln-report <full path to the "Vulnerabilities" report>Yes
"Vulnerabilities" report file in CSV format.
--inventory-report <full path to the "Inventory" report file>No
"Inventory" report file in CSV format.
-vNo
Display extended information about the import of assets.
Possible errors
Error message
Description
Tenant %w not found
The tenant name was not found.
Tenant search error: Unexpected status Code: %d
An unexpected HTTP response code was received while searching for the tenant.
Asset search error: Unexpected status Code: %d
An unexpected HTTP response code was received while searching for an asset.
[%w import][error] Host: %w Skipped asset with FQDNlocalhost or IP 127.0.0.1
When importing inventory/vulnerabilities information, host with fqdn=localhost or ip=127.0.0.1 was skipped.
Configuring receipt of Sendmail events
You can configure the receipt of Sendmail mail agent events in the KUMA SIEM system.
Configuring event receiving consists of the following steps:
- Configuring Sendmail logging.
- Configuring the event source server.
- Creating a KUMA collector.
To receive Sendmail events, use the following values in the Collector Installation Wizard:
- At the Event parsing step, select the [OOTB] Sendmail syslog normalizer.
- At the Transport step, select the tcp or udp connector type.
- Installing KUMA collector.
- Verifying receipt of Sendmail events in the KUMA collector
You can verify that the Sendmail event source server is correctly configured in the Searching for related events section of the KUMA web interface.
Configuring Sendmail logging
By default, events of the Sendmail system are logged to syslog.
To make sure that logging is configured correctly:
- Connect via SSH to the server on which the Sendmail system is installed.
- Run the following command:
cat /etc/rsyslog.d/50-default.confThe command should return the following string:
mail.* -/var/log/mail.log
If logging is configured correctly, you can proceed to configuring the export of Sendmail events.
Page top
Configuring export of Sendmail events
Events are sent from the Sendmail mail agent server to the KUMA collector using the rsyslog service.
To configure transmission of Sendmail events to the collector:
- Connect to the server where Sendmail is installed using an account with administrative privileges.
- In the /etc/rsyslog.d/ directory, create the Sendmail-to-siem.conf file and add the following line to it:
If $programname contains 'sendmail' then @<<IP address of the collector>:<port of the collector>>Example:
If $programname contains 'sendmail' then @192.168.1.5:1514If you want to send events via TCP, the contents of the file must be as follows:
If $programname contains 'sendmail' then @@<<IP address of the collector>:<port of the collector>> - Create a backup copy of the /etc/rsyslog.conf file.
- Add the following lines to the /etc/rsyslog.conf configuration file:
$IncludeConfig /etc/Sendmail-to-siem.conf$RepeatedMsgReduction off - Save your changes.
- Restart the rsyslog service by executing the following command:
sudo systemctl restart rsyslog.service
Logging in to the program web interface
To log in to the application web interface:
- Enter the following address in your browser:
https://<IP address or FQDN of KUMA Core server>:7220The web interface authorization page will open and prompt you to enter your login and password.
- Enter the login of your account in the Login field.
- Enter the password for the specified account in the Password field.
- Click the Login button.
The main window of the application web interface opens.
In multitenancy mode, a user who is logging in to the application web interface for the first time will find the data only for those tenants that were selected for the user when their user account was created.
To log out of the application web interface,
open the KUMA web interface, click your user account name in the bottom-left corner of the window, and click the Logout button in the opened menu.
Page top
Service monitoring
You can use the following functionality to monitor the status of all services except cold storage and agent:
- Viewing Victoria Metrics alerts
Users with the General administrator role can configure thresholds for KUMA services, and if a specified threshold is exceeded, the following changes take place:
- KUMA logs an audit event: VictoriaMetrics alert registered for service.
- KUMA sends a notification email message to the General administrator.
- Services are displayed in the Active services section with a yellow status. If you hover over the status icon, the error message will be displayed.
- View VictoriaMetrics metrics if the user has a role with metrics access rights.
The following examples show how to monitor service status.
- If the collector service has a yellow status in the Active services section and you see the Enrichment errors increasing message, you can:
- Go to Metrics → <service type> → <service name> → Enrichment → Errors section of KUMA for the service with the yellow status, find out which enrichment is causing errors, and view the chart to find out when the problem started and how it evolved.
- The likely cause of the enrichment errors may be DNS server unavailability or CyberTrace enrichment errors, therefore you can check your DNS or CyberTrace connection settings.
- If the collector service has a yellow status in the Active services section and you see the Output Event Loss increasing message, you can:
- Go to the Metrics → <service type> → <service name> → IO → Output Event Loss section of KUMA for the service with the yellow status and view the chart to find out when the problem started and how it evolved.
- The likely cause of the enrichment errors may be a buffer overflow or unavailability of destination, therefore you can check the availability and the connection of the destination or find out why the buffer capacity is exceeded.
Configuring service monitoring
To configure the services:
- In the KUMA web console, go to the Settings → Service monitoring section.
- Specify the values of monitoring parameters for the services.
Service monitoring does not apply to cold storage.
If you specify an invalid value that does not fit the range or format, the value is reset to the previously configured value.
- Click Save.
After saving the parameters, KUMA registers an audit event: Monitoring thresholds changed for the service.
KUMA monitors the status of services in accordance with the specified parameters.
In the Active services section, you can filter services by statuses or enter a word from the error text, for example, "QPS" or "buffer", in the search field and press ENTER. This results in a list of services with errors. Special characters ", },{, are not allowed in the search string and will produce irrelevant results.
Disabling service monitoring
To disable service monitoring:
- In the KUMA web console, go to the Settings → Service monitoring section.
- If you want to disable service monitoring only for collectors, in the Service monitoring. Thresholds setting window, under Collectors, select the Disable connector errors check box.
This disables only the analysis of the Connector errors metric for collectors.
- If you want to disable monitoring for all services, in the Service monitoring. Thresholds setting window, select the Disable check box.
KUMA service monitoring is disabled, and services do not get the yellow status.
Viewing KUMA metrics
To monitor the performance of its components, the event stream, and the correlation context, KUMA collects and stores a large number of parameters. The VictoriaMetrics time series database is used to collect, store and analyze the parameters. The collected metrics are visualized using Grafana. Dashboards that visualize key performance parameters of various KUMA components can be found in the KUMA → Metrics section.
The KUMA Core service configures VictoriaMetrics and Grafana automatically, no user action is required.
The collected metrics are visualized using the Grafana solution. The RPM package of the 'kuma-core' service generates the Grafana configuration and creates a separate dashboard for visualizing the metrics of each service. Graphs in the Metrics section appear with a delay of approximately 1.5 minutes.
For full information about the metrics, you can refer to the Metrics section of the KUMA web interface. Selecting this section opens the Grafana portal that is deployed as part of Core installation and is updated automatically. If the Metrics section shows "core:<port number>", this means that KUMA is deployed in a high availability configuration and the metrics were received from the host on which the KUMA Core was installed. In other configurations, the name of the host from which KUMA receives metrics is displayed.
Collector metrics
Metric name |
Description |
|---|---|
IO—metrics related to the service input and output. |
|
Processing EPS |
The number of events processed per second. |
Output EPS |
The number of events per second sent to the destination. |
Output Latency |
The time in milliseconds that passed while sending an event packet and receiving a response from the destination. The median value is displayed. |
Output Errors |
The number of errors occurring per second while event packets were sent to the destination. Network errors and errors writing to the disk buffer of the destination are displayed separately. |
Output Event Loss |
The number of events lost per second. Events can be lost due to network errors or errors writing the disk buffer of the destination. Events are also lost if the destination responds with an error code, for example, in case of an invalid request. |
Output Disk Buffer SIze |
The size of the disk buffer of the collector associated with the destination, in bytes. If a zero value is displayed, no event packets have been placed in the collector's disk buffer and the service is operating correctly. |
Write Network BPS |
The number of bytes received into the network per second. |
Connector errors |
The number of errors in the connector logs. |
Normalization—metrics related to the normalizers. |
|
Raw & Normalized event size |
The size of the raw event and size of the normalized event. The median value is displayed. |
Errors |
The number of normalization errors per second. |
Filtration—metrics related to filters. |
|
EPS |
The number of events per second matching the filter conditions and sent for processing. The collector only processes events that match the filtering criteria if the user has added the filter to the configuration of the collector service. |
Aggregation—metrics related to the aggregation rules. |
|
EPS |
The number of events received and generated by the aggregation rule per second. This metric helps determine the effectiveness of aggregation rules. |
Buckets |
The number of buckets in the aggregation rule. |
Enrichment—metrics related to enrichment rules. |
|
Cache RPS |
The number of requests per second to the local cache. |
Source RPS |
The number of requests per second to an enrichment source, such as a dictionary. |
Source Latency |
Time in milliseconds passed while sending a request to the enrichment source and receiving a response from it. The median value is displayed. |
Queue |
The size of the enrichment request queue. This metric helps to find bottleneck enrichment rules. |
Errors |
The number of errors per second while sending requests to the enrichment source. |
Correlator metrics
Metric name |
Description |
|---|---|
IO—metrics related to the service input and output. |
|
Processing EPS |
The number of events processed per second. |
Output EPS |
The number of events per second sent to the destination. |
Output Latency |
The time in milliseconds that passed while sending an event packet and receiving a response from the destination. The median value is displayed. |
Output Errors |
The number of errors occurring per second while event packets were sent to the destination. Network errors and errors writing to the disk buffer of the destination are displayed separately. |
Output Event Loss |
The number of events lost per second. Events can be lost due to network errors or errors writing the disk buffer of the destination. Events are also lost if the destination responds with an error code, for example, in case of an invalid request. |
Output Disk Buffer SIze |
The size of the disk buffer of the collector associated with the destination, in bytes. If a zero value is displayed, no event packets have been placed in the collector's disk buffer and the service is operating correctly. |
Correlation—metrics related to correlation rules. |
|
EPS |
The number of correlation events per second generated by the correlation rule. |
Buckets |
The number of buckers in a correlation rule of the standard type. |
Rate Limiter Hits |
The number of times the correlation rule exceeded the rate limit per second. |
Active Lists OPS |
The number of operations requests per second sent to the active list, and the operations themselves. |
Active Lists Records |
The number of records in the active list. |
Active Lists On-Disk Size |
The size of the active list on the disk, in bytes. |
Enrichment—metrics related to enrichment rules. |
|
Cache RPS |
The number of requests per second to the local cache. |
Source RPS |
The number of requests per second to an enrichment source, such as a dictionary. |
Source Latency |
Time in milliseconds passed while sending a request to the enrichment source and receiving a response from it. The median value is displayed. |
Queue |
The size of the enrichment request queue. This metric helps to find bottleneck enrichment rules. |
Errors |
The number of errors per second while sending requests to the enrichment source. |
Response—metrics associated with response rules. |
|
RPS |
The number of times a response rule was activated per second. |
Storage metrics
Metric name |
Description |
|---|---|
Storage / IO — metrics related to the status of ClickHouse cluster nodes. |
|
Output EPS |
Number of events per second that were inserted into the ClickHouse node or into the disk buffer of the node. |
Output Latency |
Latency of inserting a batch either into the ClickHouse node or into the disk buffer of the node. |
Output Errors |
Number of errors per second when inserting a batch into the ClickHouse node or into the disk buffer of the node. |
Output Disk Buffer SIze |
Size of the disk buffer of the ClickHouse node. |
Output Event Loss |
Number of events that were permanently lost on each ClickHouse node. |
Batch size |
The size of the batch of events to be inserted into the ClickHouse node. |
Insert interval 5min Q1 |
Duration of the first quartile of the event insertion interval for the last 5 minutes. |
ClickHouse / General—metrics related to the general settings of the ClickHouse cluster. |
|
Active Queries |
The number of active queries sent to the ClickHouse cluster. This metric is displayed for each ClickHouse instance. |
QPS |
The number of queries per second sent to the ClickHouse cluster. |
Failed QPS |
The number of failed queries per second sent to the ClickHouse cluster. |
Allocated memory |
The amount of RAM, in gigabytes, allocated to the ClickHouse process. |
ClickHouse / Insert—metrics related to inserting events into a ClickHouse instance. |
|
Insert EPS |
The number of events per second inserted into the ClickHouse instance. |
Insert QPS |
The number of ClickHouse instance insert queries per second sent to the ClickHouse cluster. If the Insert QPS metric demonstrates a growing queue of queries and the metric is greater than 1, we recommend also looking at the Batch size metric value to adjust the storage buffering settings in the settings of the storage service configuration. Example: The Insert QPS metric is greater than 1 and equals 8. The Batch size metric is 1.2 GB (in bytes). In this case, you can find the buffer size by multiplying Insert QPS by Batch size: 8 * 1.2 = 9.6 GB. Round the resulting value of 9.6 and specify it in bytes (for example, 10000000000 bytes) as the Buffer size setting on the Advanced settings tab of the storage service configuration. Also specify a Buffer flush interval of 2 seconds. |
Failed Insert QPS |
The number of failed ClickHouse instance insert queries per second sent to the ClickHouse cluster. |
Delayed Insert QPS |
The number of delayed ClickHouse instance insert queries per second sent to the ClickHouse cluster. Queries were delayed by the ClickHouse node due to exceeding the soft limit on active merges. |
Rejected Insert QPS |
The number of rejected ClickHouse instance insert queries per second sent to the ClickHouse cluster. Queries were rejected by the ClickHouse node due to exceeding the hard limit on active merges. |
Active Merges |
The number of active merges. |
Distribution Queue |
The number of temporary files with events that could not be inserted into the ClickHouse instance because it was unavailable. These events cannot be found using search. |
ClickHouse / Select—metrics related to event selections in the ClickHouse instance. |
|
Select QPS |
The number of ClickHouse instance event select queries per second sent to the ClickHouse cluster. |
Failed Select QPS |
The number of failed ClickHouse instance event select queries per second sent to the ClickHouse cluster. |
ClickHouse / Replication—metrics related to replicas of ClickHouse nodes. |
|
Active Zookeeper Connections |
The number of active connections to the Zookeeper cluster nodes. In normal operation, this number should be equal to the number of nodes in the Zookeeper cluster. |
Read-only Replicas |
The number of read-only replicas of ClickHouse nodes. In normal operation, no such replicas of ClickHouse nodes must exist. |
Active Replication Fetches |
The number of active processes of downloading data from the ClickHouse node during data replication. |
Active Replication Sends |
The number of active processes of sending data to the ClickHouse node during data replication. |
Active Replication Consistency Checks |
The number of active data consistency checks on replicas of ClickHouse nodes during data replication. |
ClickHouse / Networking—metrics related to the network of the ClickHouse cluster. |
|
Active HTTP Connections |
The number of active connections to the HTTP server of the ClickHouse cluster. |
Active TCP Connections |
The number of active connections to the TCP server of the ClickHouse cluster. |
Active Interserver Connections |
The number of active service connections between ClickHouse nodes. |
KUMA Core metrics
Metric name |
Description |
|---|---|
Raft—metrics related to reading and updating the state of the KUMA Core. |
|
Lookup RPS |
Number of lookup procedure requests per second sent to the KUMA Core, and the procedures themselves. |
Lookup Latency |
Time in milliseconds spent running the lookup procedures, and the procedures themselves. The time is displayed for the 99th percentile of lookup procedures. One percent of lookup procedures may take longer to run. |
Propose RPS |
Number of Raft (SQLite) propose procedure requests per second sent to the KUMA, and the procedures themselves. |
Propose Latency |
Time in milliseconds spent running the Raft (SQLite) propose procedures, and the procedures themselves. The time is displayed for the 99th percentile of propose procedures. One percent of propose procedures may take longer to run. |
Data mining—metrics related to data collection and analysis |
|
Executing Rules |
Number of running schedulers for executing data collection and analysis requests. |
Queued Rules |
Number of schedulers for executing queued data collection and analysis requests. |
Execution Errors |
Number of errors that occurred when running the data collection and analysis scheduler. |
Execution Latency |
How long takes a scheduler to execute requests. |
Tasks—metrics related to monitoring the running of tasks on the KUMA Core |
|
Active tasks |
Number of tasks run per unit time. |
Task Execution latency |
Duration of running tasks in seconds. |
Errors |
Number of errors when running tasks. |
API—metrics related to API requests. |
|
RPS |
Number of API requests made to the KUMA Core per second. |
Latency |
Time in milliseconds spent processing a single API request to the KUMA Core. The median value is displayed. |
Errors |
Number of errors per second while sending API requests to the KUMA Core. |
Notification Feed—metrics related to user activity. |
|
Subscriptions |
Number of clients connected to the KUMA Core via SSE to receive server messages in real time. This number is normally equal to the number of clients that are using the KUMA web interface. |
Errors |
The number of errors per second while sending notifications to users. |
Schedulers—metrics related to KUMA Core tasks. |
|
Active |
The number of repeating active system tasks. The tasks created by the user are ignored. |
Latency |
The time in milliseconds spent running the task. The median value is displayed. |
Errors |
The number of errors that occurred per second while performing tasks. |
Alerts Queue |
Number of alerts in the queue for insertion into the database. |
KUMA agent metrics
Metric name |
Description |
|---|---|
IO—metrics related to the service input and output. |
|
Processing EPS |
The number of events processed per second. |
Output EPS |
The number of events per second sent to the destination. |
Output Latency |
The time in milliseconds that passed while sending an event packet and receiving a response from the destination. The median value is displayed. |
Output Errors |
The number of errors occurring per second while event packets were sent to the destination. Network errors and errors writing to the disk buffer of the destination are displayed separately. |
Output Event Loss |
The number of events lost per second. Events can be lost due to network errors or errors writing the disk buffer of the destination. Events are also lost if the destination responds with an error code, for example, in case of an invalid request. |
Output Disk Buffer SIze |
The size of the disk buffer of the collector associated with the destination, in bytes. If a zero value is displayed, no event packets have been placed in the collector's disk buffer and the service is operating correctly. |
Write Network BPS |
The number of bytes received into the network per second. |
Event routers metrics
Metric name |
Description |
|---|---|
IO—metrics related to the service input and output. |
|
Processing EPS |
The number of events processed per second. |
Output EPS |
The number of events per second sent to the destination. |
Output Latency |
The time in milliseconds that passed while sending an event packet and receiving a response from the destination. The median value is displayed. |
Output Errors |
The number of errors occurring per second while event packets were sent to the destination. Network errors and errors writing to the disk buffer of the destination are displayed separately. |
Output Event Loss |
The number of events lost per second. Events can be lost due to network errors or errors writing the disk buffer of the destination. Events are also lost if the destination responds with an error code, for example, in case of an invalid request. |
Output Disk Buffer SIze |
The size of the disk buffer of the collector associated with the destination, in bytes. If a zero value is displayed, no event packets have been placed in the collector's disk buffer and the service is operating correctly. |
Write Network BPS |
The number of bytes received into the network per second. |
Connector Errors |
The number of errors in the connector log. |
General metrics common for all services
Metric name |
Description |
|---|---|
Process—General process metrics. |
|
Memory |
RAM usage (RSS) in megabytes. |
DISK BPS |
The number of bytes read from or written to the disk per second. |
Network BPS |
The number of bytes received/transmitted over the network per second. |
Network Packet Loss |
The number of network packets lost per second. |
GC Latency |
The time, in milliseconds, spent executing a GO garbage collection cycle The median value is displayed. |
Goroutines |
The number of active goroutines. This number is different from the operating system's thread count. |
OS—metrics related to the operating system. |
|
Load |
Average load. |
CPU |
CPU load as a percentage. |
Memory |
RAM usage (RSS) as a percentage. |
Disk |
Disk space usage as a percentage. |
Metrics storage period
KUMA operation data is saved for 3 months by default. This storage period can be changed.
To change the storage period for KUMA metrics:
- Log in to the OS of the server where the KUMA Core is installed.
- In the file /etc/systemd/system/multi-user.target.wants/kuma-victoria-metrics.service, in the ExecStart parameter, edit the
--retentionPeriod=<metrics storage period, in months>flag by inserting the necessary period. For example,--retentionPeriod=4means that the metrics will be stored for 4 months. - Restart KUMA by running the following commands in sequence:
systemctl daemon-reloadsystemctl restart kuma-victoria-metrics
The storage period for metrics has been changed.
Page top
KUMA metric alert triggering conditions
If the value of a KUMA metric for a service exceeds the threshold of the corresponding parameter configured in the Service monitoring section of KUMA, VictoriaMetrics sends an alert, and an error message is displayed in the status of that service.
Alerts are received from VictoriaMetrics at the following intervals:
- VictoriaMetrics collects information from KUMA services every 15 seconds.
- VictoriaMetrics updates alerts for KUMA services every minute.
- The KUMA Core service collects information from VictoriaMetrics every 15 seconds.
Thus, the total delay before a service status is updated is less than 2–3 minutes.
If you disabled the receipt of alerts from VictoriaMetrics, some KUMA services may still be displayed with a yellow status. This can happen in the following cases:
- For a storage service:
- If an alert was received in response to an API request in the /status parameter from ClickHouse
- If cold storage of the Storage service is not being monitored
- For a collector service: If an alert was received in response to an API request in the /status parameter.
- For a correlator service: If a response rule exists that requires the Advanced Responses module, but this module is not covered by the current license, or the license that covers this module has expired.
The table below provides information on which error messages may appear in the service status when an alert is received from VictoriaMetrics, and which metrics and parameters they are based on and in what way. For details on KUMA metrics that can trigger VictoriaMetrics alerts, see Viewing KUMA metrics.
For example, if the Active services table for a service displays a yellow status and the High distribution queue error message (the "Error message" column in the table below), you can view the information in the Enrichment widget, the Distribution Queue metric (the "KUMA metrics" column in the table below).
Description of error messages for KUMA services
Error message |
Configurable alert parameters |
KUMA metric |
Description |
|---|---|---|---|
|
QPS interval/window, minutes QPS Threshold |
Clickhouse / General → Failed QPS |
An error message is displayed if the Failed QPS metric exceeds the specified QPS Threshold value for the duration specified by the QPS interval/window, minutes parameter. For example, if 25 out of 100 requests from VictoriaMetrics to the service were unsuccessful, and the QPS Threshold is 0.2, the alert is calculated as follows: (25 / 100) * 100 > 0.2 * 100 25% > 20% Because the percentage of unsuccessful requests is greater than the specified threshold, an error message is displayed for the service. |
|
Failed insert QPS calculation interval/window, minutes Insert QPS threshold |
Clickhouse / Insert → Failed Insert QPS |
An error message is displayed if the Failed Insert QPS metric exceeds the specified QPS Insert Threshold value for the duration specified by the Failed Insert QPS calculation interval/window, minutes parameter. For example, if 25 out of 100 requests from VictoriaMetrics to the service were unsuccessful, and the QPS Insert Threshold is 0.2, the alert is calculated as follows: (25 / 100) * 100 > 0.2 * 100 25% > 20% Because the percentage of unsuccessful requests is greater than the specified threshold, an error message is displayed for the service. |
|
Distribution queue threshold Distribution queue calculation interval/window, minutes |
Clickhouse / Insert → Distribution Queue |
An error message is displayed if the Distribution Queue metric exceeds the specified Distribution queue threshold value for the duration specified by the Distribution queue calculation interval/window, minutes parameter. |
|
Free space on disk threshold |
OS → Disk |
An error message is displayed if the amount of free disk space (as a percentage) indicated by the Disk metric value is less than the value specified in the Free disk space threshold parameter. For example, an error message is displayed if the partition on which KUMA is installed takes up all the disk space. |
|
Free space on partition threshold |
OS → Disk |
An error message is displayed if the amount of free space (as a percentage) on the disk partition that KUMA is using is less than the value specified in the Free space on partition threshold parameter. For example, an error message is displayed in the following cases:
|
|
Output Event Loss |
IO → Output Event Loss |
An error message is displayed if the Output Event Loss metric has been increasing for one minute. You can enable or disable the display of this error message using the Output Event Loss parameter. |
|
Disk buffer increase interval/window, minutes |
IO → Output Disk Buffer SIze |
An error message is displayed if the Output Disk Buffer Size metric monotonically increases for 10 minutes with the sampling interval specified by the Disk buffer increase interval/window, minutes parameter. For example, if the Disk buffer increase interval/window, minutes is set to 2 minutes, an error message is displayed if the disk buffer size has monotonically increased for 10 minutes with a sampling interval of 2 minutes (see the figure below).
|
|
Growing enrichment queue interval/window, minutes |
Enrichment → Queue |
An error message is displayed if the Queue metric monotonically increases for 10 minutes with the sampling interval specified by the Growing enrichment queue interval/window, minutes parameter. For example, if the value of the Growing enrichment queue interval/window, minutes is 3, an error message is displayed if the enrichment queue has monotonically increased every 10 minutes with a sampling interval of 3 minutes. In the case shown in the figure below, the error message is not displayed because at the ninth minute the value of the metric decreased instead of increasing monotonically.
|
|
Enrichment errors |
Enrichment → Errors |
An error message is displayed if the Errors metric has been increasing for one minute. You can enable or disable the display of this error message using the Enrichment errors parameter. |
|
Disable connector errors |
IO → Connector Errors |
An error message is displayed if the Connector Errors metric has been increasing between consecutive polls of the metric by VictoriaMetrics for one minute. You can enable or disable the display of this error message using the Disable connector errors parameter. |
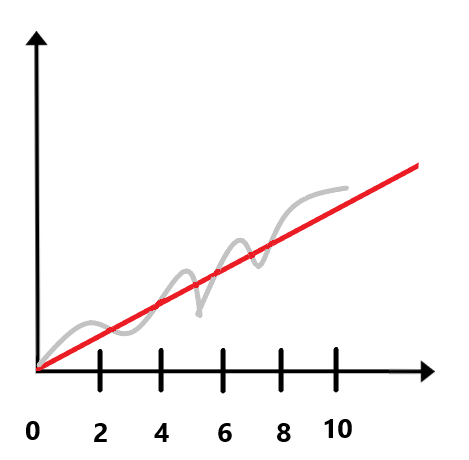
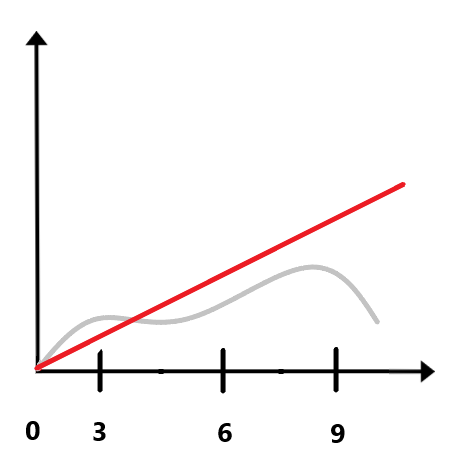
Managing KUMA tasks
When working in the application web interface, you can use tasks to perform various operations. For example, you can import assets or export KUMA event information to a TSV file.
Viewing the tasks table
The tasks table contains a list of created tasks and is located in the Task manager section of the application web interface window.
You can view the tasks that were created by you (current user). A user with the General Administrator role can view the tasks of all users.
By default, the Display only my own filter is applied in the Task manager section. To see tasks, clear the check box from the Display only my own filter.
The tasks table contains the following information:
- State—the state of the task. One of the following statuses can be assigned to a task:
- Green dot blinking—the task is active.
- Completed—the task is complete.
- Cancel—the task was canceled by the user.
- Error—the task was not completed because of an error. The error message is displayed if you hover the mouse over the exclamation mark icon.
- Task—the task type. The application provides the following types of tasks:
- Events export—export KUMA events.
- Threat Lookup—request data from the Kaspersky Threat Intelligence Portal.
- Retroscan—task for replaying events.
- KSC assets import—imports asset data from Kaspersky Security Center servers.
- Accounts import—imports user data from Active Directory.
- KICS/KATA assets import—imports asset data from KICS/KATA.
- Repository update—updates the KUMA repository to receive the resource packages from the source specified in settings.
- Created by—the user who created the task. If the task was created automatically, the column will show Scheduled task.
- Created—task creation time.
- Updated—time when the task was last updated.
- Tenant—the name of the tenant in which the task was started.
The task date format depends on the localization language selected in the application settings. Possible date format options:
- English localization: YYYY-MM-DD.
- Russian localization: DD.MM.YYYY.
Configuring the display of the tasks table
You can customize the display of columns and the order in which they appear in the tasks table.
To customize the display and order of columns in the tasks table:
- In the KUMA web interface, select the Task manager section.
The tasks table is displayed.
- In the table heading, click the gear () button.
- In the opened window, do the following:
- If you want to enable display of a column in the table, select the check box next to the name of the parameter that you want to display in the table.
- If you do not want the parameter to be displayed in the table, clear the check box.
At least one check box must be selected.
- If you want to reset the settings, click the Default link.
- If you want to change the order in which the columns are displayed in the table, move the mouse cursor over the name of the column, hold down the left mouse button and drag the column to the necessary position.
The display of columns in the tasks table will be configured.
Page top
Viewing task run results
To view the results of a task:
- In the KUMA web interface, select the Task manager section.
The tasks table is displayed.
- Click the link containing the task type in the Task column.
A list of the operations available for this task type will be displayed.
- Select Show results.
The task results window opens.
In this section, the Display only my own filter is applied by default in the Created by column of the task table. To view all tasks, disable this filter.
Page top
Restarting a task
To restart a task:
- In the KUMA web interface, select the Task manager section.
The tasks table is displayed.
- Click the link containing the task type in the Task column.
A list of the operations available for this task type will be displayed.
- Select Restart.
The task will be restarted.
Page top
Connecting to an SMTP server
KUMA can be configured to send email notifications using an SMTP server. Users will receive notifications if the Receive email notifications check box is selected in their profile settings.
Only one SMTP server can be added to process KUMA notifications. An SMTP server connection is managed in the KUMA web interface under Settings → Common → SMTP server settings.
To configure SMTP server connection:
- Open the KUMA web interface and select Settings → Common.
- Under SMTP server settings, change the relevant settings:
- Disabled—select this check box if you want to disable connection to the SMTP server.
- Host (required)—SMTP host in one of the following formats: hostname, IPv4, IPv6.
- Port (required)—SMTP port. The value must be an integer from 1 to 65,535.
- From (required)—email address of the message sender. For example,
kuma@company.com. - Alias for KUMA Core server—name of the KUMA Core server that is used in your network. Must be different from the FQDN.
- If necessary, use the Secret drop-down list to select a secret of the credentials type that contains the account credentials for connecting to the SMTP server.
- Select the necessary frequency of notifications in the Monitoring notifications interval drop-down list.
Notifications from the source about a monitoring policy triggering are repeated after the selected period until the status of the source becomes green again.
If you select Notify once, the notification about the monitoring policy triggering is sent only once during the whole time when the source has the red status. However, a notification about the monitoring policy triggering is sent every time the source status changes from red to green.
- Turn on the Disable monitoring notifications toggle button if you do not want to receive notifications about the state of event sources. The toggle switch is turned off by default.
- Click Save.
The SMTP server connection is now configured, and users can receive email messages from KUMA.
Page top
Working with Kaspersky Security Center tasks
You can connect Kaspersky Security Center assets to KUMA and download database and application module updates to these assets, or run an anti-virus scan on them by using Kaspersky Security Center tasks. Tasks are started in the KUMA web interface.
To run Kaspersky Security Center tasks on assets connected to KUMA, it is recommended to use the following script:
- Creating a user account in the Kaspersky Security Center Administration Console
The credentials of this account are used when creating a secret to establish a connection with Kaspersky Security Center, and can be used to create a task.
For more details about creating a user account and assigning permissions to a user, please refer to the Kaspersky Security Center Help Guide.
- Creating KUMA tasks in Kaspersky Security Center
- Configuring KUMA integration with Kaspersky Security Center
- Importing asset information from Kaspersky Security Center into KUMA
- Assigning a category to the imported assets
After import, the assets are automatically placed in the Uncategorized devices group. You can assign one of the existing categories to the imported assets, or create a category and assign it to the assets.
- Running tasks on assets
You can manually start tasks in the asset information or configure tasks to start automatically.
Creating KUMA tasks in Kaspersky Security Center
You can run the anti-virus database and application module update task, and the virus scan task on Kaspersky Security Center assets connected to KUMA. The assets must have Kaspersky Endpoint Security for Windows or Linux installed. The tasks are created in Kaspersky Security Center Web Console.
For more details about creating the Update and Virus scan tasks on the assets with Kaspersky Endpoint Security for Windows, refer to the Kaspersky Endpoint Security for Windows Help Guide.
For more details about creating the Update and Virus scan tasks on the assets with Kaspersky Endpoint Security for Linux, refer to the Kaspersky Endpoint Security for Linux Help Guide.
Task names must begin with "kuma" (not case-sensitive and without quotations). For example, KUMA antivirus check. Otherwise, the task is not displayed in the list of available tasks in the KUMA web interface.
Starting Kaspersky Security Center tasks manually
You can manually run the anti-virus database, application module update task, and the anti-virus scan task on Kaspersky Security Center assets connected to KUMA. The assets must have Kaspersky Endpoint Security for Windows or Linux installed.
First, you need to configure the integration of Kaspersky Security Center with KUMA and create tasks in Kaspersky Security Center.
To manually start a Kaspersky Security Center task:
- In the Assets section of the KUMA web interface, select the asset that was imported from Kaspersky Security Center.
The Asset details window opens.
- Click the KSC response button.
This button is displayed if the connection to the Kaspersky Security Center that owns the selected asset is enabled.
- In the opened Select task window, select the check boxes next to the tasks that you want to start, and click the Start button.
Kaspersky Security Center starts the selected tasks.
Some types of tasks are available only for certain assets.
You can obtain vulnerability and software information only for assets running a Windows operating system.
Page top
Starting Kaspersky Security Center tasks automatically
You can configure the automatic start of the anti-virus database and application module update task and the virus scan task for Kaspersky Security Center assets connected to KUMA. The assets must have Kaspersky Endpoint Security for Windows or Linux installed.
First, you need to configure the integration of Kaspersky Security Center with KUMA and create tasks in Kaspersky Security Center.
Configuring automatic start of Kaspersky Security Center tasks includes the following steps:
Step 1. Adding a correlation rule
To add a correlation rule:
- In the KUMA web interface, select the Resources section.
- Select Correlation rules and click the Add correlation rule button.
- On the General tab, specify the following settings:
- In the Name field, define the rule name.
- In the Tenant drop-down list, select the tenant that owns the resource.
- In the Type drop-down list, select simple.
- In the Propagated fields field, add the following fields: DestinationAssetID.
- If required, define the values for the following fields:
- In the Rate limit field, define the maximum number of times per second that the rule will be triggered.
- In the Severity field, define the severity of alerts and correlation events that will be created as a result of the rule being triggered.
- In the Description field, provide any additional information.
- On the Selectors → Settings tab:
- In the Filter drop-down list, select Create new.
- In the Conditions field, click the Add group button.
- In the operator field for the group you added, select AND.
- Add a condition for filtering by the DeviceProduct field value:
- In the Conditions field, click the Add condition button.
- In the condition field, select If.
- In the Left operand field, select event field.
- In the 'Event field' field, select DeviceProduct.
- In the Operator field, select =.
- In the Right operand field, select constant.
- In the value field, enter KSC.
- Add a condition for filtering by the Name field value:
- In the Conditions field, click the Add condition button.
- In the condition field, select If.
- In the Left operand field, select event field.
- In the event field, select Name.
- In the Operator field, select =.
- In the Right operand field, select constant.
- In the value field, enter the name of the event. When this event is detected, the task is started automatically.
For example, if you want the Virus scan task to start when Kaspersky Security Center registers the Malicious object detected event, specify this name in the Value field.
You can view the event name in the Name field of the event details.
- On the Actions tab, specify the following settings:
- In the Actions section, open the On every event drop-down list.
- Select the Output check box.
You do not need to fill in other fields.
- Click the Save button.
The correlation rule will be created.
Step 2. Creating a correlator
You need to launch the Correlator Installation Wizard. At step 3 of the Wizard, you are required to select the correlation rule that you added by following this guide.
The DeviceHostName field must display the domain name (FQDN) of the asset. If it is not displayed, create a DNS record for this asset and create a DNS enrichment rule at Step 4 of the Wizard.
Step 3. Adding a filter
To add a filter:
- In the KUMA web interface, select the Resources section.
- Select Filters and click the Add filter button.
- In the Name field, specify the filter name.
- In the Tenant drop-down list, select the tenant that owns the resource.
- In the Conditions field, click the Add group button.
- In the operator field for the group you added, select AND.
- Add a condition for filtering by the DeviceProduct field value:
- In the Conditions field, click the Add condition button.
- In the condition field, select If.
- In the Left operand field, select event field.
- In the 'Event field' field, select Type.
- In the Operator field, select =.
- In the Right operand field, select constant.
- In the Value field, enter 3.
- Add a condition for filtering by the Name field value:
- In the Conditions field, click the Add condition button.
- In the condition field, select If.
- In the Left operand field, select event field.
- In the event field, select Name.
- In the Operator field, select =.
- In the Right operand field, select constant.
- In the Value field, enter the name of the correlation rule created at Step 1.
Step 4. Adding a response rule
To add a response rule:
- In the KUMA web interface, select the Resources section.
- Select Response rules and click the Add response rule button.
- In the Name field, define the rule name.
- In the Tenant drop-down list, select the tenant that owns the resource.
- In the Type drop-down list, select Response via KSC.
- In the Kaspersky Security Center task drop-down list, select the Kaspersky Security Center task you want to start.
- In the Event field drop-down list, select the DestinationAssetID.
- In the Workers field, specify the number of processes that the service can run simultaneously.
By default, the number of work processes is the same as the number of virtual processors on the server where the correlator service is installed.
- In the Description field, you can add up to 4,000 Unicode characters.
- In the Filter drop-down list, select the filter added at Step 3 of this instruction.
To send requests to Kaspersky Security Center, you must ensure that Kaspersky Security Center is available over the UDP protocol.
If a response rule is owned by the Shared tenant, the displayed Kaspersky Security Center tasks that are available for selection are from the Kaspersky Security Center server that the main tenant is connected to.
If a response rule has a selected task that is absent from the Kaspersky Security Center server that the tenant is connected to, the task is not performed for assets of this tenant. This situation could arise when two tenants are using a common correlator, for example.
Step 5. Adding a response rule to the correlator
To add a response rule to the correlator:
- In the KUMA web interface, select the Resources section.
- Select Correlators.
- In the list of correlators, select the correlator added at Step 2 of this instruction.
- In the steps tree, select Response rules.
- Click Add.
- In the Response rule drop-down list, select the rule added at step 4 of these instructions.
- In the steps tree, select Setup validation.
- Click the Save and restart services button.
- Click the Save button.
The response rule will be added to the correlator.
The automatic start will be configured for the anti-virus database and application module update task and the virus scan task on Kaspersky Security Center assets connected to KUMA. The tasks are started when a threat is detected on the assets and KUMA receives the corresponding events.
Page top
Checking the status of Kaspersky Security Center tasks
In the KUMA web interface, you can check whether a Kaspersky Security Center task was started or whether a search for events owned by the collector listening for Kaspersky Security Center events was completed.
To check the status of Kaspersky Security Center tasks:
- In KUMA, select Resources → Active services.
- Select the collector that is configured to receive events from the Kaspersky Security Center server and click the Go to Events button.
A new browser tab will open in the Events section of KUMA. The table displays events from the Kaspersky Security Center server. The status of the tasks can be seen in the Name column.
Kaspersky Security Center event fields:
- Name—status or type of the task.
- Message—message about the task or event.
- FlexString<number>Label—name of the attribute received from Kaspersky Security Center. For example,
FlexString1Label=TaskName. - FlexString<number>—value of the FlexString<number>Label attribute. For example,
FlexString1=Download updates. - DeviceCustomNumber<number>Label—name of the attribute related to the task state. For example,
DeviceCustomNumber1Label=TaskOldState. - DeviceCustomNumber<number>—value related to the task state. For example,
DeviceCustomNumber1=1means the task is executing. - DeviceCustomString<number>Label—name of the attribute related to the detected vulnerability: for example, a virus name, affected application.
- DeviceCustomString<number>—value related to the detected vulnerability. For example, the attribute-value pairs
DeviceCustomString1Label=VirusNameandDeviceCustomString1=EICAR-Test-Filemean that the EICAR test virus was detected.
KUMA notifications
Standard notifications
KUMA can be configured to send email notifications using an SMTP server. To do so, configure a connection to an SMTP server and select the Receive email notifications check box. Only a user with the General administrator role can receive email notifications.
If the Receive email notifications check box is selected for a user with the General administrator role, after enabling the setting, an email notification is sent to the user every 6 hours in accordance with the following rule:
- If at least one server has a non-empty Warning field at the time scheduled for sending the message, the message is sent.
- One message is sent for all services with the yellow status. If no services have the yellow status, no message is sent.
The 6-hour interval is respected unless the KUMA Core is restarted. After each restart of the Core, the 6-hour interval is reset.
KUMA automatically notifies users about the following events:
- A report was created (the users listed in the report template receive a notification).
- An alert was created (all users receive a notification).
- An alert was assigned to a user (the user to whom the alert was assigned receives a notification).
- A task was performed (the users who created the task receive a notification).
- New resource packages are available. They can be obtained by updating the KUMA repository (the users whose email address is specified in the task settings are notified).
- The daily average EPS has exceeded the limit set by the license.
- The hourly average EPS has exceeded the limit set by the SMB license.
Custom notifications
Instead of the standard KUMA notifications about the alert generation, you can send notifications based on custom templates. To configure custom notifications instead of standard notifications, take the following steps:
- Create an email template.
- Create a notification rule that specifies the correlation rules and email addresses.
When an alert is created based on the selected correlation rules, notifications created based on custom email templates will be sent to the specified email addresses. Standard KUMA notifications about the same event will not be sent to the specified addresses.
Page top
KUMA logs
KUMA provides the following types of logs:
- Installer logs
- Component logs
You can also generate a report with diagnostic information about your device using the collect.sh utility. For detailed information on using the utility, please refer to the Knowledge Base.
Installer logs
KUMA automatically creates files containing logs of installation, reconfiguration, or removal.
The logs are stored in the ./log/ subdirectory in the installer directory. The name of the log file reflects the date and time when the corresponding script was started.
Names are generated in the following formats:
- Installation log: install-YYYYMMDD-HHMMSS.log. For example: install-20231031-102409.log
- Removal logs: uninstall-YYYYMMDD-HHMMSS.log. For example: uninstall-20231031-134011.log
- Reconfiguration logs: expand-YYYYMMDD-HHMMSS.log. For example: expand-20231031-105805.log
KUMA creates a new log file each time the installation, reconfiguration, or removal script is started. Log rotation or automatic deletion is not performed.
The log incorporates the lines of the inventory file used when the corresponding command was invoked, and the ansible log. For each task, the following information is listed in this order: task start time (Tuesday, October 31, 2023 10:29:14 +0300), run time of the previous task (0:00:02.611), and the total time passed since the installation, reconfiguration, or removal was initiated (0:04:56.906).
Example:
TASK [Add columns to the replicated table] ***************************************
Tuesday, October 31, 2023 10:29:14 +0300 (0:00:02.611) 0:04:56.906 *******
Component logs
By default, only errors are logged for all KUMA components. To receive detailed data in logs, configure Debug mode in the component settings.
The Core logs are stored in the /opt/kaspersky/kuma/core/00000000-0000-0000-0000-000000000000/log/core directory and are archived when they reach the size of 5 GB or the age of 7 days, whichever occurs first. These conditions are checked once daily. Archives are kept in the log folder for 7 days, after 7 days the archive is deleted. A maximum of four archived logs are stored on the server at the same time. Whenever a new log archive is created, if the total number of archives becomes greater than four, the oldest log archive is deleted. If the logs fill up quickly, you must have enough disk space to create a copy of the log file and archive it as part of log rotation.
The component logs are appended until the file reaches 5 GB. When the log reaches 5 GB, it is archived and new events are written to a new log. Archives are kept in the log folder for 7 days, after 7 days the archive is deleted. A maximum of four archived logs are stored on the server at the same time. Whenever a new log archive is created, if the total number of archives becomes greater than four, the oldest log archive is deleted.
Debug mode is available for the following components:
Core |
To enable it: in the KUMA web interface, select Settings → General → Core settings → Debug. Storage location: /opt/kaspersky/kuma/core/00000000-0000-0000-0000-000000000000/log/core You can download the Core logs from the KUMA web interface, in the Resources → Active services section by selecting the Core service and clicking Log. If KUMA is installed in a high availability configuration, refer to the Viewing Core logs in Kubernetes section below. |
Services:
|
To enable it, use the Debug toggle switch in the settings of the service. Storage location: the service installation directory. For example, /opt/kaspersky/kuma/<service name>/<service ID>/log/<service name>. You can download the service logs from the KUMA web interface, in the Resources → Active services section by selecting the desired service and clicking Log. Logs residing on Linux machines can be viewed by running the journalctl and tail command. For example:
|
Resources:
|
To enable it, use the Debug toggle switch in the settings of the service to which the resource is linked. The logs are stored on the machine hosting the installed service that uses the relevant resource. Detailed data for resources can be viewed in the log of the service linked to a resource. |
Viewing Core logs in Kubernetes
When Core log files reach 100 MB, they are archived and a new log is written. No more than five files are stored at a time. If there are more than five files when a new log appears, the oldest file is deleted.
On worker nodes, you can view the logs of containers and pods residing on these nodes in the file system of the node.
For example:
/var/log/pods/kuma_core-deployment-<UID>/core/*.log
/var/log/pods/kuma_core-deployment-<UID>/mongodb/*.log
To view the logs of all containers in the Core pod:
k0s kubectl logs -l app=core --all-containers -n kuma
To view the log of a specific container:
k0s kubectl logs -l app = core -c <container_name> -n kuma
To enable real-time log viewing, add the -f switch:
k0s kubectl logs -f -l app=core --all-containers -n kuma
To view the logs of the previous pod that was overwritten by a new one (for example, when recovering from a critical error or after redeployment), add the --previous switch:
k0s kubectl logs -l app=core -c core -n kuma --previous
To access the logs from other hosts that are not included in the cluster, you need the k0s-kubeconfig.yml file containing the access credentials created during KUMA installation, and the locally installed kubectl cluster management utility.
The cluster controller or traffic balancer specified in the server parameter of the k0s-kubeconfig.yml file must be accessible over the network.
The file path must be exported to a variable: export KUBECONFIG=/<file path>/k0s-kubeconfig.yml
You can use kubeclt to view the logs. For example:
kubectl logs -l app=core -c mongodb -n kuma
Working with geographic data
A list of mappings of IP addresses or ranges of IP addresses to geographic data can be uploaded to KUMA for use in event enrichment.
Geodata format
Geodata can be uploaded to KUMA as a CSV file in UTF-8 encoding. A comma is used as the delimiter. The first line of the file contains the field headers: Network,Country,Region,City,Latitude,Longitude.
CSV file description
Field header name in CSV |
Field description |
Example |
|
IP address in one of the following formats:
Mixing of IPv4 and IPv6 addresses is allowed. Required field. |
|
|
Country designation used by your organization. For example, this could be its name or code. Required field. |
|
|
Regional designation used by your organization. For example, this could be its name or code. |
|
|
City designation used by your organization. For example, this could be its name or code. |
|
|
Latitude of the described location in decimal format. This field can be empty, in which case the value 0 will be used when importing data into KUMA. |
|
|
Longitude of the described location in decimal format. This field can be empty, in which case the value 0 will be used when importing data into KUMA. |
|
Converting geographic data from MaxMind to IP2Location
KUMA can use geodata from MaxMind, IP2Location, or others in a format compatible with these. Before using archives with CSV geodata files, you must convert these to the format that KUMA supports. The names of CSV files being converted inside archives must match the following templates:
- (GeoIP2|GeoLite2|RU-GeoIP)-(City|Country)-Blocks-IPv(4|6).csv
- (GeoIP2|GeoLite2|RU-GeoIP)-(City|Country)-Locations-%s.csv
Conversion can be done using the script below. Make sure that the CSV files with geodata do not contain duplicate records. For example, if a file has few columns, different records may contain data from the same network with the same geodata. Such files cannot be converted. To successfully perform the conversion, make sure that there are no duplicate rows and that every row has at least one unique field.
Python 2.7 or later is required to run the script.
Script start command:
python converter.py --type <type of geographic data being processed: "maxmind" or "ip2location"> --out <directory where a CSV file containing geographic data in KUMA format will be placed> --input <path to the ZIP archive containing geographic data from MaxMind or IP2location>
When the script is run with the --help flag, help is displayed for the available script parameters: python converter.py --help
Command for converting a file containing a Russian database of IP address ranges from a MaxMind ZIP archive:
python converter.py --type maxmind --lang ru --input MaxMind.zip --out geoip_maxmind_ru.csv
If the --lang parameter is not specified, the script receives information from the GeoLite2-City-Locations-en.csv file from the ZIP archive by default.
Absence of the --lang parameter for MaxMind is equivalent to the following command:
python converter.py --type maxmind --input MaxMind.zip --out geoip_maxmind.csv
Command for converting a file from an IP2Location ZIP archive:
python converter.py --type ip2location --input IP2LOCATION-LITE-DB11.CSV.ZIP --out geoip_ip2location.csv
Command for converting a file from several IP2Location ZIP archives:
python converter.py --type ip2location --input IP2LOCATION-LITE-DB11.CSV.ZIP IP2LOCATION-LITE-DB11.IPV6.CSV.ZIP --out geoip_ip2location_ipv4_ipv6.csv
The --lang parameter is not used for IP2Location.
Required sets of fields
The MaxMind source files GeoLite2-City-Blocks-IPv4.csv and GeoLite2-City-Blocks-IPv6.csv must contain the following set of fields:
network,geoname_id,registered_country_geoname_id,represented_country_geoname_id,
is_anonymous_proxy,is_satellite_provider,postal_code,latitude,longitude,accuracy_radius
Example set of source data:
network,geoname_id,registered_country_geoname_id,represented_country_geoname_id,is_anonymous_proxy,is_satellite_provider,postal_code,latitude,longitude,accuracy_radius
1.0.0.0/24,2077456,2077456,,0,0,,-33.4940,143.2104,1000
1.0.1.0/24,1814991,1814991,,0,0,,34.7732,113.7220,1000
The remaining CSV files with the locale code must contain the following set of fields:
geoname_id,locale_code,continent_code,continent_name,country_iso_code,country_name,
subdivision_1_iso_code,subdivision_1_name,subdivision_2_iso_code,subdivision_2_name,
city_name,metro_code,time_zone,is_in_european_union
Example set of source data:
geoname_id,locale_code,continent_code,continent_name,country_iso_code,country_name,subdivision_1_iso_code,subdivision_1_name,subdivision_2_iso_code,subdivision_2_name,city_name,metro_code,time_zone,is_in_european_union
1392,de,AS,Asien,IR,Iran,02,Mazandaran,,,,,Asia/Tehran,0
7240,de,AS,Asien,IR,Iran,28,Nord-Chorasan,,,,,Asia/Tehran,0
The source IP2Location files must contain data on the network ranges, Country, Region, City, Latitude, and Longitude
Example set of source data:
"0","16777215","-","-","-","-","0.000000","0.000000","-","-"
"16777216","16777471","US","United States of America","California","Los Angeles","34.052230","-118.243680","90001","-07:00"
"16777472","16778239","CN","China","Fujian","Fuzhou","26.061390","119.306110","350004","+08:00"
If the source files contain a different set of fields than the one indicated in this section, or if some fields are missing, the missing fields in the target CSV file will be empty after conversion.
Page top
Importing and exporting geographic data
If necessary, you can manually import and export geographic data into KUMA. Geographic data is imported and exported in a CSV file. If the geographic data import is successful, the previously added data is overwritten and an audit event is generated in KUMA.
To import geographic data into KUMA:
- Prepare a CSV file containing geographic data.
Geographic data received from MaxMind and IP2Location must be converted to a format supported by KUMA.
- In the KUMA web interface, open the Settings → General section.
- Under Geographic data, click the Import from file button and select a CSV file containing geographic data.
Wait for the geographic data import to finish. The data import is interrupted if the page is refreshed.
The geographic data is uploaded to KUMA.
To export geographic data from KUMA:
- In the KUMA web interface, open Settings → Other.
- Under Geographic data, click the Export button.
Geographic data will be downloaded as a CSV file named geoip.csv (in UTF-8 encoding) based on the settings of your browser.
The data is exported in the same format as it was uploaded, with the exception of IP address ranges. If a range of addresses was indicated in the format 1.0.0.0/24 in a file imported into KUMA, the range will be displayed in the format 1.0.0.0-1.0.0.255 in the exported file.
Default mapping of geographic data
If you select the SourceAddress, DestinationAddress and DeviceAddress event fields as the IP address source when configuring a geographic data enrichment rule, the Apply default mapping button becomes available. You can use this button to add preconfigured mapping pairs of geographic data attributes and event fields as described below.
Default mappings for the SourceAddress event field
Geodata attribute |
Event field |
Country |
|
Region |
|
City |
|
Latitude |
|
Longitude |
|
Default mappings for the DestinationAddress event field
Geodata attribute |
Event field |
Country |
|
Region |
|
City |
|
Latitude |
|
Longitude |
|
Default mappings for the DeviceAddress event field
Geodata attribute |
Event field |
Country |
|
Region |
|
City |
|
Latitude |
|
Longitude |
|
KUMA resources
Resources are KUMA components that contain parameters for implementing various functions: for example, establishing a connection with a given web address or converting data according to certain rules. Like parts of an erector set, these components are assembled into resource sets for services that are then used as the basis for creating KUMA services.
Resources are contained in the Resources section, Resources block of KUMA web interface. The following resource types are available:
- Correlation rules—resources of this type contain rules for identifying event patterns that indicate threats. If the conditions specified in these resources are met, a correlation event is generated.
- Normalizers—resources of this type contain rules for converting incoming events into the format used by KUMA. After processing in the normalizer, the raw event becomes normalized and can be processed by other KUMA resources and services.
- Connectors—resources of this type contain settings for establishing network connections.
- Aggregation rules—resources of this type contain rules for combining several basic events of the same type into one aggregation event.
- Enrichment rules—resources of this type contain rules for supplementing events with information from third-party sources.
- Destinations—resources of this type contain settings for forwarding events to a destination for further processing or storage.
- Filters—resources of this type contain criteria for selecting individual events from the event stream to be sent to processing.
- Response rules—resources of this type are used in correlators to, for example, execute scripts or launch Kaspersky Security Center tasks when certain conditions are met.
- Data collection and analysis rules—resources of this type contain rules that allow scheduling SQL queries with aggregation functions to the storage. Data received from SQL queries is then used for correlation.
- Notification templates—resources of this type are used when sending notifications about new alerts.
- Active lists—resources of this type are used by correlators for dynamic data processing when analyzing events according to correlation rules.
- Dictionaries—resources of this type are used to store keys and their values, which may be required by other KUMA resources and services.
- Proxies—resources of this type contain settings for using proxy servers.
- Secrets—resources of this type are used to securely store confidential information (such as credentials) that KUMA needs to interact with external services.
When you click on a resource type, a window opens displaying a table with the available resources of this type. The table contains the following columns:
You can configure the set of columns for the table and their order, as well as configure the display of information in some columns:
- You can show or hide columns in the menu that you can open by clicking the gear () icon in the toolbar in the upper part of the table.
- You can reorder the columns by dragging column headings to the left or right.
- You can configure the display of information in a column by clicking the down arrow (
 ) icon in the heading of the column.
- Name—the name of the resource. Can be used to search for resources and sort them.
- Updated—the date and time of the last update of a resource. Can be used to sort resources.
- Created by—the name of the user who created a resource.
- Description—the description of a resource.
- Type—the type of the resource. Displayed for all types of resources, except Aggregation rules, Enrichment rules, Data collection and analysis rules, Filters, Active lists, Proxies.
- Resource path—address in the resource tree. Displayed in the tree of folders, starting from the tenant in which the resource was created.
- Tags—tags assigned to the resource. A resource can have more than one tag.
Tags are part of the resource and are imported with the resource.
- Package name—the name of the package in which the resource was imported from the repository.
- Correlator—the list of correlators to which the correlation rule is linked. Displayed only for resources of the Correlation rule type.
- MITRE techniques—the MITRE matrix techniques that this correlation rule covers. Displayed only for resources of the Correlation rule type. When you hover over a value, the name of the rule is displayed.
The maximum table size is not limited. If you want to select all resources, scroll to the end of the table and select the Select all check box, which selects all available resources in the table.
The table of resources in the lower part displays the number of resources from tenants that are available to you in the table:
- Total is the total amount or the amount with the filter or search applied.
- Selected is the number of selected resources.
When filters are applied, the resource selection and the Selected value are reset. If the amount of resources changes due to the actions (for example, deletion) undertake by another user, the displayed number of resources changes after you refresh the page, perform an action with the resource, or apply a filter.
Resources can be organized into folders. The folder structure is displayed in the left part of the window: root folders correspond to tenants and contain a list of all resources of the tenant. All other folders nested within the root folder display the resources of an individual folder. When a folder is selected, the resources it contains are displayed as a table in the right pane of the window.
Resources can be created, edited, copied, moved from one folder to another, and deleted. Resources can also be exported and imported.
KUMA comes with a set of predefined resources, which can be identified by the "[OOTB]<resource_name>" name. OOTB resources are protected from editing.
If you want to adapt a predefined OOTB resource to your organization's infrastructure:
- In the Resources-<resource type> section, select the OOTB resource that you want to edit.
- In the upper part of the KUMA web interface, click Duplicate, then click Save.
- A new resource named "[OOTB]<resource_name> - copy" is displayed in the web interface.
- Edit the copy of the predefined resource as necessary and save your changes.
The adapted resource is available for use.
Operations with resources
To manage KUMA resources, you can create, move, copy, edit, delete, import, and export them. These operations are available for all resources, regardless of the resource type.
The table of resources in the lower part displays the number of resources from tenants that are available to you in the table:
- Total is the total amount or the amount with the filter or search applied.
- Selected is the number of selected resources.
When filters are applied, the resource selection and the Selected value are reset. If the amount of resources changes due to the actions (for example, deletion) undertake by another user, the displayed number of resources changes after you refresh the page, perform an action with the resource, or apply a filter.
KUMA resources reside in folders. You can add, rename, move, or delete resource folders.
Creating, renaming, moving, and deleting resource folders
Resources can be organized into folders. The folder structure is displayed in the left part of the window: root folders correspond to tenants and contain a list of all resources of the tenant. All other folders nested within the root folder display the resources of an individual folder. When a folder is selected, the resources it contains are displayed as a table in the right pane of the window.
You can create, rename, move and delete folders.
To create a folder:
- Select the folder in the tree where the new folder is required.
- Click the Add folder button.
The folder will be created.
To rename a folder:
- Locate required folder in the folder structure.
- Hover over the name of the folder.
The
icon will appear near the name of the folder. - Open the drop-down list and select Rename.
The folder name will become active for editing.
- Enter the new folder name and press ENTER.
The folder name cannot be empty.
The folder will be renamed.
To move a folder,
Drag and drop the folder to a required place in folder structure by clicking its name.
Folders cannot be dragged from one tenant to another.
To delete a folder:
- Select the relevant folder in the folder structure.
- Right-click to bring up the context menu and select Delete.
The conformation window appears.
- Click OK.
The folder will be deleted.
The application does not delete folders that contain files or subfolders.
Page top
Creating, duplicating, moving, editing, and deleting resources
You can create, move, copy, edit, and delete resources.
To create the resource:
- In the Resources → <resource type> section, select or create a folder where you want to add the new resource.
Root folders correspond to tenants. For a resource to be available to a specific tenant, it must be created in the folder of that tenant.
- Click the Add <resource type> button.
The window for configuring the selected resource type opens. The available configuration parameters depend on the resource type.
- Enter a unique resource name in the Name field.
- Specify the required parameters (marked with a red asterisk).
- If necessary, specify the optional parameters (not required).
- Click Save.
The resource will be created and available for use in services and other resources.
To move the resource to a new folder:
- In the Resources → <resource type> section, find the required resource in the folder structure.
- Select the check box near the resource you want to move. You can select multiple resources.
The
icon appears near the selected resources. The number of selected resources is displayed in the lower part of the table. - Use the icon to drag and drop resources to the required folder.
The resources will be moved to the new folders.
You can only move resources to folders of the tenant in which the resources were created. Resources cannot be moved to another tenant's folders.
To copy the resource:
- In the Resources → <resource type> section, find the required resource in the folder structure.
- Select the check box next to the resource that you want to copy and click Duplicate.
The number of selected resources is displayed in the lower part of the table.
A window opens with the settings of the resource that you have selected for copying. The available configuration parameters depend on the resource type.
The
<selected resource name> - copyvalue is displayed in the Name field. - Make the necessary changes to the parameters.
- Enter a unique name in the Name field.
- Click Save.
The copy of the resource will be created.
To edit the resource:
- In the Resources → <resource type> section, find the required resource in the folder structure.
- Select the resource.
A window with the settings of the selected resource opens. The available configuration parameters depend on the resource type.
- Make the necessary changes to the parameters.
- Do one of the following:
- Click Save to save your changes.
- Click Save with a comment, and in the displayed window, add a comment that describes your changes. The changes are saved and the comment is added to the created version of the resource.
The resource is updated and a new version is created for it. If this resource is used in a service, restart the service to apply the new version of the resource.
If the current resource is not editable (for example, you cannot edit a correlation rule), you can go to the card of another resource by clicking the View button. This button becomes available in batch resources when you click another resource linked to your current resource.
If, when saving changes to a resource, it turns out that the current version of the resource has been modified by another user, you are prompted to select one of the following actions:
- Save your changes as a new version of the resource on top of the changes made by the other user.
- Save your changes as a new resource.
In this case, a duplicate of the original resource is created with the changed settings. The
- copystring is added to the name of the new resource, and the name and version of the resource that was duplicated is specified in the version comments of the new resource. - Discard your changes.
Discarded changes cannot be restored.
To delete the resource:
- In the Resources → <resource type> section, find the required resource in the folder structure.
- Select the check box next to the resource that you want to delete and click Delete.
The number of selected resources is displayed in the lower part of the table. A confirmation window opens.
- Click OK.
The resource and all its saved versions are deleted.
Page top
Bulk deletion of resources
In the KUMA web interface, you can select multiple resources and delete them.
You must have the right to delete resources.
To delete resources:
- In the Resources → <resource type> section, find the required resource in the folder structure.
- Select the check boxes next to the resources that you want to delete.
In the lower part of the table, the total number of resources and the number of resources selected will be displayed.
- Click Delete.
This opens a window that tells you whether it is safe to delete resources, depending on whether the resources selected for deletion are linked to other resources.
For all resources that cannot be deleted, the application displays a table of links in a modal window.
- Click Delete.
Only resources without links are deleted.
Deleting folders with resources
You can select the delete operation for any folder at any level, except the tenant.
To delete a folder with resources:
- In the Resources section, select a folder.
- Click the
 button and select the Delete option.
This opens a window prompting you to confirm deletion. The window displays a field in which you can enter the generated value. Also, if dependent resources exist in the folder, a list of dependencies is displayed.
- Enter the generated value.
- Confirm the deletion.
You can delete a folder if:
- The folder does not contain any subfolders or resources.
- The folder does not contain any subfolders, but does contain unlinked resources.
- None of the resources in the folder are dependencies of anything (services, resources, integrations).
Link correlators to a correlation rule
The Link correlators option is available for the created correlation rules.
To link correlators:
- In the KUMA web interface → Resources → Correlation rules section, select the created correlation rule and go to the Correlators tab.
- This opens the Correlators window; in that window, select one or more correlators by selecting the check box next to them.
- Click OK.
Correlators are linked to a correlation rule.
The rule is added to the end of the execution queue in each selected correlator. If you want to move the rule up in the execution queue, go to Resources → Correlators → <selected correlator> → Edit correlator → Correlation, select the check box next to the relevant rule and use the Move up or Move down buttons to reorder the rules as necessary.
Page top
Updating resources
Kaspersky regularly releases packages with resources that can be imported from the repository. You can specify an email address in the settings of the Repository update task. After the first execution of the task, KUMA starts sending notifications about the packages available for update to the specified address. You can update the repository, analyze the contents of each update, and decide if to import and deploy the new resources in the operating infrastructure. KUMA supports updates from Kaspersky servers and from custom sources, including offline update using the update mirror mechanism. If you have other Kaspersky products in the infrastructure, you can connect KUMA to existing update mirrors. The update subsystem expands KUMA capabilities to respond to the changes in the threat landscape and the infrastructure. The capability to use it without direct internet access ensures the privacy of the data processed by the system.
To update resources, perform the following steps:
- Update the repository to deliver the resource packages to the repository. The repository update is available in two modes:
- Automatic update
- Manual update
- Import the resource packages from the updated repository into the tenant.
For the service to start using the resources, make sure that the updated resources are mapped after performing the import. If necessary, link the resources to collectors, correlators, or agents, and update the settings.
To enable automatic update:
- In the Settings → Repository update section, configure the Data refresh interval in hours. The default value is 24 hours.
- Specify the Update source. The following options are available:
- .
You can view the list of update servers in the Knowledge Base.
- Custom source:
- The URL to the shared folder on the HTTP server.
- The full path to the local folder on the host where the KUMA Core is installed.
If a local folder is used, the kuma system user must have read access to this folder and its contents.
- .
- If necessary, in the Proxy server list, select an existing proxy server to be used when running the Repository update task.
You can also create a new proxy server by clicking the plus (
) icon. - Specify the Emails for notification by clicking the Add button. The notifications that new packages or new versions of the packages imported into the tenant are available in the repository are sent to the specified email addresses.
If you specify the email address of a KUMA user, the Receive email notifications check box must be selected in the user profile. For emails that do not belong to any KUMA user, the messages are received without additional settings. The settings for connecting to the SMTP server must be specified in all cases.
- Click Save. The update task starts shortly. Then the task restarts according to the schedule.
To manually start the repository update:
- To disable automatic updates, in the Settings → Repository update section, select the Disable automatic update check box. This check box is cleared by default. You can also start a manual repository update without disabling automatic update. Starting an update manually does not affect the automatic update schedule.
- Specify the Update source. The following options are available:
- Kaspersky update servers.
- Custom source:
- The URL to the shared folder on the HTTP server.
- The full path to the local folder on the host where the KUMA Core is installed.
If a local folder is used, the kuma user must have access to this folder and its contents.
- If necessary, in the Proxy server list, select an existing proxy server to be used when running the Repository update task.
You can also create a new proxy server by clicking the plus (
) icon. - Specify the Emails for notification by clicking the Add button. The notifications that new packages or new versions of the packages imported into the tenant are available in the repository are sent to the specified email addresses.
If you specify the email address of a KUMA user, the Receive email notifications check box must be selected in the user profile. For emails that do not belong to any KUMA user, the messages are received without additional settings. The settings for connecting to the SMTP server must be specified in all cases.
- Click Run update. Thus, you simultaneously save the settings and manually start the Repository update task.
Configuring a custom source using Kaspersky Update Utility
You can update resources without internet access by using a custom update source via the Kaspersky Update Utility.
Configuration consists of the following steps:
- Configuring a custom source using Kaspersky Update Utility:
- Installing and configuring Kaspersky Update Utility on one of the computers in the corporate LAN.
- Configuring copying of updates to a shared folder in Kaspersky Update Utility settings.
- Configuring update of the KUMA repository from a custom source.
Configuring a custom source using Kaspersky Update Utility:
You can download the Kaspersky Update Utility distribution kit from the Kaspersky Technical Support website.
- In Kaspersky Update Utility, enable the download of updates for KUMA 3.4:
- Select Application list, then click the Select button. This opens a window; in that window, in the Perimeter control section, select the check box next to KUMA 3.4 to enable updates.
- If you work with Kaspersky Update Utility using the command line, add the following line to the [ComponentSettings] section of the updater.ini configuration file or specify the
truevalue for an existing line:KasperskyUnifiedMonitoringAndAnalysisPlatform_3_4=true
- In the Downloads section, specify the update source. By default, Kaspersky update servers are used as the update source.
- In the Downloads section, in the Update folders group of settings, specify the shared folder for Kaspersky Update Utility to download updates to. The following options are available:
- Specify the local folder on the host where Kaspersky Update Utility is installed. Deploy the HTTP server for distributing updates and publish the local folder on it. In KUMA, in the Settings → Repository update → Custom source section, specify the URL of the local folder published on the HTTP server.
- Specify the local folder on the host where Kaspersky Update Utility is installed. Make this local folder available over the network. Mount the network-accessible local folder on the host where KUMA is installed. In KUMA, in the Settings → Repository update → Custom source section, specify the full path to the local folder.
For detailed information about working with Kaspersky Update Utility, refer to the Kaspersky Knowledge Base.
Page top
Exporting resources
If shared resources are hidden for a user, the user cannot export shared resources or resources that use shared resources.
To export resources:
- In the Resources section, click Export resources.
The Export resources window opens with the tree of all available resources.
- In the Password field enter the password that must be used to protect exported data.
- In the Tenant drop-down list, select the tenant whose resources you want to export.
- Check boxes near the resources you want to export.
If selected resources are linked to other resources, linked resources will be exported, too. The number of selected resources is displayed in the lower part of the table.
- Click the Export button.
Current versions of resources in a password-protected file are saved on your computer in accordance with your browser settings. Previous versions of the resources are saved in the file. The Secret resources are exported blank.
To export a previous version of a resource:
- In the KUMA web interface, in the Resources section, select the type of resources that you need.
This opens a window opens with a table of available resources of this type.
If you want to view all resources, in the Resources section, go to the List tab.
- Select the check box for the resource whose change history you want to view, and click the Show version history button in the upper part of the table.
This opens the window with the version history of the resource.
- Click the row of the version that you want to export and click the Export button in the lower part of the displayed window.
You can only export a previous version of a resource. The Export button is not displayed when the current version of the resource is selected.
The resource version is saved in a JSON file on your computer in accordance with your browser settings.
Page top
Importing resources
In KUMA 3.4, we recommended using resources from the "[OOTB] KUMA 3.4 resources" package and resources published in the repository after the release of this package.
To import resources:
- In the Resources section, click Import resources.
The Resource import window opens.
- In the Tenant drop-down list, select the tenant to assign the imported resources to.
- In the Import source drop-down list, select one of the following options:
- File
If you select this option, enter the password and click the Import button.
- Repository
If you select this option, a list of packages available for import is displayed. We recommend you to ensure that the repository update date is relatively recent and configure automatic updates if necessary.
You can select one or more packages to import and click the Import button. The dependent resources of the Shared tenant are imported into the Shared tenant, the rest of the resources are imported into the selected tenant. You do not need special rights for the Shared tenant; you must only have the right to import in the selected tenant.
Imported resources marked as This resource is a part of the package. You can delete it, but it is impossible to edit. can only be deleted. To rename, edit or move an imported resource, make a copy of the resource using the Duplicate button and perform the desired actions with the copy of the resource. When importing future versions of the package, the duplicate is not updated because it is a separate object.
You can edit Imported resources in the
Integrationfolder. Such resources are marked as This resource is a part of the package. To a package resource in theIntegrationfolder, you can add a dictionary of theTable type; adding other resources is not allowed. When importing subsequent versions of the package, the edited resource will not be replaced with the corresponding resource from the package, which allows you to keep the changes you made.
- File
- Resolve the conflicts between the resources imported from the file and the existing resources if they occur. Read more about resource conflicts below.
- If the name, type, and guid of an imported resource fully match the name, type, and guid of an existing resource, the Conflicts window opens with the table displaying the type and the name of the conflicting resources. Resolve displayed conflicts:
- To replace the existing resource with a new one, click Replace.
To replace all conflicting resources, click Replace all.
- To leave the existing resource, click Skip.
For dependent resources, that is, resources that are associated with other resources, the Skip option is not available; you can only Replace dependent resources.
To keep all existing resources, click Skip all.
- To replace the existing resource with a new one, click Replace.
- Click the Resolve button.
The resources are imported to KUMA. The Secret resources are imported blank.
- If the name, type, and guid of an imported resource fully match the name, type, and guid of an existing resource, the Conflicts window opens with the table displaying the type and the name of the conflicting resources. Resolve displayed conflicts:
Importing resources that use the extended event schema
If you import a normalizer that uses one or more fields of the extended event schema, KUMA automatically creates an extended schema field that is used in the normalizer.
If you import other types of resources that use fields of the extended event schema in their logic, the resources are imported successfully. To make sure the imported resources work as intended, you need to create the corresponding extended schema fields in the Settings → Extended extended event schema fields section or import a normalizer that uses the required fields.
If a normalizer that uses an extended event schema field is imported into KUMA and the same field already exists in KUMA, the previously created field is used.
If a normalizer is imported into KUMA that uses an extended event schema field that does not meet the KUMA requirements, the import is completed, but the extended event schema field is created with the Disabled status and you cannot use this field in other normalizers and resources. An extended event schema field runs afoul of requirements if, for example, its name contains special characters or spaces. If you want to use such a field that does not meet the requirements, you need to fix its problems (for example, by renaming it) and then enable the field.
About conflict resolving
When resources are imported into KUMA from a file, they are compared with existing resources; the following parameters are compared:
- Name and kind. If an imported resource's name and kind parameters match those of the existing one, the imported resource's name is automatically changed.
- ID. If identifiers of two resources match, a conflict appears that must be resolved by the user. This could happen when you import resources to the same KUMA server from which they were exported.
When resolving a conflict you can choose either to replace existing resource with the imported one or to keep exiting resource, skipping the imported one.
In this case, if a conflict occurs, the imported resource is added as a new version of the existing resource. A resources imported comment is added to this version.
Some resources are linked: for example, in some types of connectors, the connector secret must be specified. The secrets are also imported if they are linked to a connector. Such linked resources are exported and imported together.
Special considerations of import:
- Resources are imported to the selected tenant.
- If a linked resource was in the Shared tenant, it ends up in the Shared tenant when imported.
- In the Conflicts window, the Parent column always displays the top-most parent resource among those that were selected during import.
- If a conflict occurs during import and you choose to replace existing resource with a new one, it would mean that all the other resources linked to the one being replaced are automatically replaced with the imported resources.
Known errors:
- The linked resource ends up in the tenant specified during the import, and not in the Shared tenant, as indicated in the Conflicts window, under the following conditions:
- The linked resource is initially in the Shared tenant.
- In the Conflicts window, you select Skip for all parent objects of the linked resource from the Shared tenant.
- You leave the linked resource from the Shared tenant for replacement.
- After importing, the categories do not have a tenant specified in the filter under the following conditions:
- The filter contains linked asset categories from different tenants.
- Asset category names are the same.
- You are importing this filter with linked asset categories to a new server.
- In Tenant 1, the name of the asset category is duplicated under the following conditions:
- in Tenant 1, you have a filter with linked asset categories from Tenant 1 and the Shared tenant.
- The names of the linked asset categories are the same.
- You are importing such a filter from Tenant 1 to the Shared tenant.
- You cannot import conflicting resources into the same tenant.
The Import conflicting resources in the same tenant is not allowed error means that the imported package contains conflicting resources from different tenants and cannot be imported into the Shared tenant.
Solution: Select a tenant other than Shared to import the package. In this case, during the import, resources originally located in the Shared tenant are imported into the Shared tenant, and resources from the other tenant are imported into the tenant selected during import.
- Only the general administrator can import categories into the Shared tenant.
The Only general admin is allowed to import categories into shared tenant error means that the imported package contains resources with linked shared asset categories. The categories or resources with linked shared asset categories are displayed in the KUMA Core log. Path to the Core log:
/opt/kaspersky/kuma/core/log/core
Solution. Choose one of the following options:
- Do not import resources to which shared categories are linked: clear the check boxes next to the relevant resources.
- Perform the import under a General administrator account.
- Only the general administrator can import resources into the Shared tenant.
The Only general admin is allowed to import resources into shared tenant error means that the imported package contains resources with linked shared resources. The resources with linked shared resources are displayed in the KUMA Core log. Path to the Core log:
/opt/kaspersky/kuma/core/log/core
Solution. Choose one of the following options:
- Do not import resources that have linked resources from the Shared tenant, and the shared resources themselves: clear the check boxes next to the relevant resources.
- Perform the import under a General administrator account.
Resource search
You can search resources by name or tags. You can also use full-text search to search for resources by all of their fields. For resources of the Correlation rules type, you can use full-text search to search for correlators in which the rules are used. Searching by filter finds all resources that use the filter.
The search is carried out only on the latest version of the resources.
To find resources:
- In the KUMA web interface, in the Resources section, select the type of resources that you need.
This opens a window opens with a table of available resources of this type.
If you want to view all resources, in the Resources section, go to the List tab.
- If necessary, to toggle the search mode, click the table
 icon in the upper part of the resource table.
You can search by name, tags, or full-text search in all fields of resources. By default, search by name, tags, and correlators is enabled (only for correlation rules).
You can tell which search mode is currently enabled by the default text that is displayed in the search field.
- In the Search field, start typing the search text.
The search is initiated as you type characters in the field and is case-insensitive. The table displays only those resources that satisfy the search conditions, and the number of such resources is displayed in the lower part of the table.
For full-text search, the results are sorted in the descending order of the number of words from the search string found in the fields of a resource. KUMA searches the JSON of a resource; if another resource is specified in it, it searches the specified resource too. If the resource refers to other resources, KUMA also traverses these resources and searches in their content.
- If you want to reset the search result, clear the Search field or click the
 icon.
icon.
Tag management
To help manage resources, the KUMA web interface lets you add tags to resources. You can use tags to search for a component, as well as manage tags, link or unlink tags.
You cannot add tags to resources that are created from the interface of other resources. Tags can be added only from the resource's own card. You also cannot add tags to a resource that is not editable.
Tag management
The list of tags is displayed in the Settings → Tags section and is displayed as a table with the following columns: Name, Tenant, Used in resources.
In the Tags table, you can:
- Sort tags by Name, Used in resources fields.
- Filter by values of the Tenant field.
- Find a tag by the Name field.
- Go to the list of resources that have the selected tag.
Adding a tag
To add a tag:
- Go to the Resources section and select a resource.
- In the panel above the table, click Add.
- In the Tags field of the selected resource, add a new tag, or select a tag from the list.
- Click Create.
The new tag is added.
You can also add tags from existing ones.
When adding a tag, keep in mind the following special considerations:
- You can add multiple tags.
- A tag can contain characters of various alphabets (for example, Cyrillic, Latin, or Greek characters), numerals, underscores, and spaces.
- A tag may not contain any special characters other than the underscore and the space.
- You can enter the tag in uppercase or lowercase, but after saving, the tag is always displayed in lowercase.
- The tag inherits the tenant of the resource in which it is used.
- A tag is part of a resource and exists as long as the resource exists in which the tag was created or is used.
- Tags are unique within a tenant.
- Tags are imported or exported together with the resource as part of the resource.
Searching by tags
In the Resources section, you can search for resources:
- By tags
- By resource name
The search is performed across all resource types and services.
The search results display a list of resources and services.
To find resources by tags:
- Go to the Resources section and select a resource.
- In the table of the resource, select the Tags column.
- In the Search field that is displayed, enter or select a tag name.
Searching by tag in the resource itself and in the list of resources returns full as well as partial matches of the entered text with the name of the tag.
Displays a list of resources if the specified tag is used in those resources.
In the list of resources, you can:
- Sort the list by name and type of resource or service.
- Filter resources or services by resource or service type, or by tag.
- Link or unlink tags.
Displaying tags while adding dependent resources
While adding a dependent resource, the tags of this resource are displayed in a drop-down list under Filter settings.
Resource tags that to not fit a single line are hidden. A special indicator lets you see that hidden tags exist.
The drop-down list can be filtered by resource name and by resource tags.
Linking and unlinking tags
To link tags to a resource or unlink tags from a resource:
- Go to the Resources section.
- Select the List tab.
- In the Name column, select the check boxes next to the relevant resources.
- In the panel above the list, select the Tags tab.
- Click Link or Unlink, select the tags that you need or create a new tag.
The selected tags are linked to or unlinked from the resources.
You can also link or unlink tags in the card of the resource.
Page top
Resource usage tracing
For stable operation of KUMA, it is important to understand how some resources affect the performance of other resources, what connections exist between resources and other KUMA objects. You can visualize these interdependencies on an interactive graph in the KUMA web interface.
Displaying the links of a resource on a graph
To display the relations of the selected resource:
- In the KUMA web console, in the Resources section, select a resource type.
A list of resources of the selected type is displayed.
- Select the resource that you need.
The Show dependencies button in the panel above the list of resources becomes active. On a narrow display, the button may be hidden under the
icon. - Click the Show dependencies button.
This opens the a window with the dependency graph of the selected resource. If you do not have rights to view the resource, it is marked in the graph with the
 (inaccessible resource) icon. If necessary, you can close the graph window to go back to the list of resources.
Resource dependency graph
The graph displays all relations that are formed based on the universal unique identifier (UUID) of resources used in the configuration of the resource selected for display, as well as relations of resources that have the UUID of the selected resource in their configuration. Downward links, that is, resources referenced (used) by the selected resource, are displayed down to the last level, while for upward links, that is, resources that reference the selected resource, only one level is displayed.
On the graph, you can view the dependencies of the following resources:
 Correlation rules
 Aggregation rules
 Enrichment rules
 Response rules
 Data mining rules
 Normalizers
 Connectors
 Destinations
 Filters
 Notification templates
 Active lists
 Dictionaries
 Proxy servers
 Secrets
 Context tables
 Collectors
Note that if a collector was initially selected for displaying links, "upward" links are not displayed.
 Correlators
 Storages
 Agents (autoagents)
Note that if an agent is selected for displaying links, the collector is displayed with the linked relation type only if the collector is running as a service and in the collector is correctly (fqdn+port) specified as the destination of the agent.
 Event routers
Note that if an event router was initially selected for displaying links, "upward" links are not displayed.
 Integrations
The name of the integration corresponds to the name of the tab in the Integrations section.
 Resource group
The number before the parentheses indicates the number of resources from the group displayed in the graph; the number in parentheses indicates the total number of resources in the group.
- Inaccessible resource (if you do not have the rights to view it).
Clicking a resource node lets you view the following information about the resource:
- Name
Contains a link to the resource; clicking the link opens the resource in a separate tab; this does not close the graph window.
- Type
- Path
Resource path without a link.
- Tags
- Tenant
- Package name
You can open the context menu of the resource and perform the following actions:
- Show relations of resource
The dependencies of the selected resource are displayed.
- Hide resource on graph
The selected resource is hidden. Resources at the lower level that the selected resource references are marked with "*" as having hidden links. Resources that refer to a hidden resource are marked with the
 icon as having hidden links. In this case, the graph becomes broken.
 - Hide "downward" relations of resource on graph
The selected resource remains. Only those lower-level resources that do not have any links remaining on the first higher level on the graph are hidden. Resources referenced by resources of the first (hidden) level are marked with "*" as having hidden links.
- Hide all resources of this type on graph
All resources of the selected type are hidden. This operation is applied to each resource of the selected type.
- Update resource relations
You can update the resource state if the resource was edited by another user while you were managing the graph. Only changes of visible links are displayed.
- Group
If there is no group node on the screen: the group node appears on the screen, resources of the same type as the selected resource and resources that refer to the same resource are hidden. The edges are redrawn from the group. The Group button is available only when more than 10 links to resource of the same type exist.
If there is a group node on the screen: the resource is hidden and added to the group, the edges are redrawn from the group.
Several types of relations are displayed on the graph:
- Solid line without a caption.
Represents a direct link by UUID, including the use of secrets and proxies in integrations.

- Line captioned <function_name>.
Represents using an active list in a correlation rule.
- Dotted line captioned linked.
Represents a link by URL, for example, of a destination with a collector, or of a destination with a storage.

Resources created inline are shown on the graph as a dotted line with the linked type.
We do not recommend building large dependency graphs. We recommend limiting the number of nodes to 100 nodes.
When you open the graph, the resource selected for display is highlighted with a blinking circle for some time to set it apart graphically from other resources and draw attention to it.
You can look at the map of the graph to get an idea of where you are on the graph. You can use the selector and move it to display the necessary part of the graph.
By clicking the Arrange button, you can improve the display of resources on the graph.
If you select Show links, the focus on the graph does not change, and the resources are displayed so that you do not have to return to where you started.
When you select a group node in the graph, a sidebar is displayed, in which you can hide or show the resources that are part of the group. To do so, select the check box next to the relevant resource and click the Show on graph or Hide on graph button.
The graph retains its state if you displayed something on the graph, then switched to editing a resource, and then reopened the graph tab.
The previously displayed resources on the graph remain in their places when new resources are added to the graph.
When you close the graph, all changes are discarded.
After the resource links are drawn on the graph, you can search for a node:
- By name
- By tag
- By path
- By package
Nodes, including groups that match the selection criterion, are highlighted with a yellow circle.
You can filter the graph by resource type:
- Hide or show resources of a certain type.
- Hide resources of multiple types. Display all types of resources.
With the filter window closed, you can tell the selected filters by the indicator, a red dot in the toolbar.
Your actions when managing the graph (the last 50 actions) are saved in memory; you can undo changes by pressing Ctrl/Command+Z.
You can save the displayed graph can be saved to an SVG file. The visible part of the graph is saved in the file.
Page top
Resource versioning
KUMA stores the change history of resources in the form of versions. A resource version is created automatically when you create a new resource or save changes made to the settings of an existing resource.
The change history is not available for the Dictionaries resource. To save the history of dictionaries, you can export data.
Resource versions are retained for the duration specified in the Settings section. When the age of a resource version reaches the specified value, the version is automatically deleted.
You can view the change history of KUMA resources, compare versions, and restore a previous version of a resource, for example, if it fails and you need to recover it.
To view the change history of a resource:
- In the KUMA web interface, in the Resources section, select the type of resources that you need.
This opens a window opens with a table of available resources of this type.
If you want to view all resources, in the Resources section, go to the List tab.
- Select the check box for the resource whose change history you want to view, and click the Show version history button in the upper part of the table.
This opens a window with a table of saved versions of the selected resource. New resources have only one version, the current version.
For each version, the table displays the following information:
- Version is the serial number of the resource version. When you save changes to the resource and create a new version, the serial number is increased by 1.
The version with the highest number and the most recent publication date reflects the current state of the resource. Version 1 reflects the state of the resource at the moment when it was created.
- Published is the date and time when the resource version was created.
- Author is the login of the user that saved the changes to the resource.
If the changes were made by the system or by the migration script, the displayed value is system.
- Comment is a text comment added by the author when saving changes, or a system comment describing the changes made.
- Retention period is the number of days and the date after which the resource version will be deleted.
If necessary, you can configure the retention period for resource versions.
- Actions is the button that restores the resource version.
You can sort the table of resource versions by the Version, Published, and Author columns by clicking the heading and selecting Ascending or Descending. You can also display only changes made by a specific author or authors in the table by clicking the heading of the Author column and selecting the authors as needed.
If you want to view the status of a resource in a specific version, click that version in the table. This opens a window with the resource of the selected version, in which you can:
- View the settings specified in that version of the resource.
- Restore this version of the resource by clicking the Restore button.
- Export this version of the resource to a JSON file by clicking the Export button.
Comparing resource versions
You can compare any two versions of a resource, for example, if you need to track changes.
To compare versions of a resource:
- In the KUMA web interface, in the Resources section, select the type of resources that you need.
This opens a window opens with a table of available resources of this type.
If you want to view all resources, in the Resources section, go to the List tab.
- Select the check box next to a resource and click the Show version history button in the upper part of the table.
This opens the window with the version history of the resource.
- Select the check boxes next to the two versions of the resource that you want to compare and click the Compare button in the upper part of the table.
This opens the resource version comparison window. Resource fields are displayed as a list or in JSON format. Differences between the two versions are highlighted. You can select other versions to compare using the drop-down lists above the resource fields.
Page top
Restoring a resource version
You can restore a previous version of a resource, for example, if you need to recover the resource in case of mistakes made when making changes.
Versions of automatically generated agents cannot be restored separately because they are created when the parent collector is modified. If you want to restore a version of an automatically generated agent, you need to restore the corresponding version of the parent collector.
To restore a previous version of a resource:
- In the KUMA web interface, in the Resources section, select the type of resources that you need.
This opens a window opens with a table of available resources of this type.
If you want to view all resources, in the Resources section, go to the List tab.
- Select the check box next to a resource and click the Show version history button in the upper part of the table.
This opens the window with the version history of the resource.
- In the row of the relevant version, in the Action column, click the Restore button.
You can also restore a version by clicking the row of this version and clicking the Restore button in the lower part of the window.
You can restore only previous versions of a resource; for the current version, the Restore button is not available.
If the structure of the resource has changed after a KUMA update, restoring its saved versions may not be possible.
- Confirm the action and, if necessary, add a comment. If you do not add a comment, the Restored from v.<number of the restored version> comment is automatically added to the version.
The resource version is restored as a new version and become the current version.
If the resource for which you restored the version is added to the active service, this also changes the state of the service. You must restart the service to apply the resource change.
Page top
Configuring the retention period for resource versions
You can change the retention period of resource versions in the KUMA web interface in the Settings → Common section by changing the Resource history retention period, days setting.
The default setting is 30 days. If you want to keep all versions of resources without time limits, specify 0 (store indefinitely).
Only a user with the General administrator role can view and manage the retention period of resource versions.
The retention period of resource versions is checked daily, and versions of resources that have been stored in KUMA for longer than the specified period are automatically deleted. In the task manager, the Clear resource change history task is created to check the storage duration of resource versions and delete old versions. This task also runs after a restart of the Core component.
You can check the time remaining until a resource version is deleted in the table of versions, in the Retention period column.
Page top
Destinations
Destinations define network settings for sending normalized events. Collectors and correlators use destinations to describe where to send processed events. Typically, correlators and storages act as destinations.
You can specify destination point settings on the Basic settings and Advanced settings tabs. The available settings depend on the selected type of destination.
Destinations can have the following types:
- internal for receiving data from KUMA services using the 'internal' protocol.
- nats-jetstream for communication through NATS.
- tcp for communications over TCP.
- http for communication over HTTP.
- diode for transmitting events using a data diode.
- kafka for kafka communications.
- file for writing to a file.
- storage for sending data to storage.
- correlator for sending data to a correlator.
- eventRouter for sending events to an event router.
Destination, internal type
Destinations of the internal type are used for receiving data from KUMA services using the 'internal' protocol. You can transfer the following data using the internal protocol:
- Internal data, such as event routes.
- File attributes. If while creating the collector at the Transport step of the Installation Wizard, you specified a connector of the file, 1c-xml, or 1c-log type, at the Event parsing step, in the Mapping table, you can pass the name of the file being processed by the collector or the path to the file in the KUMA event field. To do this, in the Source column, specify one of the following values:
$kuma_fileSourceNameto pass the name of the file being processed by the collector in the KUMA event field.$kuma_fileSourcePathto pass the path to the file being processed by the collector in the KUMA event field.
When you use a file, 1c-xml, or 1c-log connector, the new variables in the normalizer will only work with destinations of the internal type.
- Events to the event router. The event router can only receive events over the 'internal' protocol, therefore you can only use internal destinations when sending events to the event router.
Settings for a destination of the internal type are described in the following tables.
Basic settings tab
Setting |
Description |
|---|---|
Name |
Unique name of the resource. The maximum length of the name is 128 Unicode characters. Required setting. |
Tenant |
The name of the tenant that owns the resource. Required setting. |
State |
This toggle switch enables sending events to the destination. This toggle switch is turned on by default.
|
Type |
Destination type: internal. Required setting. |
URL |
URL that you want to connect to. The following URL formats are supported:
You can add multiple URLs or remove an URL. KUMA does not allow saving a resource or service if the URL field contains a tab or space character. To add an URL, click the + Add button. To remove an URL, click the delete Required setting. |
Tags |
Tags for resource search. Optional setting. |
Description |
Description of the resource. The maximum length of the description is 4000 Unicode characters. |
Advanced settings tab
Setting |
Description |
|---|---|
Buffer size |
Buffer size in bytes for accumulating events in the RAM of the server before sending them for further processing or storage. The value must be a positive integer. Default buffer size: 1,048,576 bytes (1 MB). Maximum buffer size: 67,108,864 bytes (64 MB). |
Buffer flush interval |
Interval (in seconds) for sending events to the destination. The default value is 1 second. |
Disk buffer size limit |
Size of the disk buffer in bytes. The default value is 10 GB. |
Handlers |
Number of handlers that the service can run simultaneously to process response rules in parallel. To determine the number of handlers, you can use the following formula: (<number of CPUs> / 2) + 2. The value must be a positive integer up to 999. |
Output format |
Format in which events are sent to the destination:
|
Proxy server |
The proxy server for the destination. You can select an existing proxy server or create a new proxy server. To create a new proxy server, select Create new. If you want to edit the settings of an existing proxy server, click the pencil |
URL selection policy |
Method of determining URLs to which events must be sent first if you added multiple URLs in the URL field on the Basic settings:
|
Health check timeout |
Interval, in seconds, for checking the health of the destination. |
Disk buffer disabled |
This toggle switch that enables the disk buffer. This toggle switch is turned on by default. The disk buffer is used if the collector cannot send normalized events to the destination. You can specify the size of the disk buffer in the Disk buffer size limit field. If the disk buffer runs out of free space, new normalized events will overwrite old normalized events, starting with the oldest. |
Timeout |
The time, in seconds, for which the destination waits for a response from another service or component. |
Debug |
The switch enables resource logging. The toggle switch is turned off by default. |
Filter |
Filter for determining which events must be processed by the resource. You can select an existing filter or create a new filter. To create a new filter, select Create new. If you want to edit the settings of an existing filter, click the pencil To create a filter:
|
Destination, type nats-jetstream
Destinations of the nats-jetstream type are used for communication through NATS. Settings for a destination of the nats-jetstream type are described in the following tables.
Basic settings tab
Setting |
Description |
|---|---|
Name |
Unique name of the resource. The maximum length of the name is 128 Unicode characters. Required setting. |
Tenant |
The name of the tenant that owns the resource. Required setting. |
State |
This toggle switch enables sending events to the destination. This toggle switch is turned on by default.
|
Type |
Destination type: nats-jetstream. Required setting. |
URL |
URL that you want to connect to. The following URL formats are supported:
You can add multiple URLs or remove an URL. KUMA does not allow saving a resource or service if the URL field contains a tab or space character. To add an URL, click the + Add button. To remove an URL, click the delete Required setting. |
Subject |
The topic of NATS messages. Characters are entered in Unicode encoding. Required setting. |
Authorization |
Type of authorization when connecting to the URL specified in the URL field:
|
Tags |
Tags for resource search. Optional setting. |
Description |
Description of the resource. The maximum length of the description is 4000 Unicode characters. |
Advanced settings tab
Setting |
Description |
|---|---|
Buffer size |
Buffer size in bytes for accumulating events in the RAM of the server before sending them for further processing or storage. The value must be a positive integer. Default buffer size: 1,048,576 bytes (1 MB). Maximum buffer size: 67,108,864 bytes (64 MB). |
Buffer flush interval |
Interval (in seconds) for sending events to the destination. The default value is 1 second. |
Disk buffer size limit |
Size of the disk buffer in bytes. The default value is 10 GB. |
Handlers |
Number of handlers that the service can run simultaneously to process response rules in parallel. To determine the number of handlers, you can use the following formula: (<number of CPUs> / 2) + 2. The value must be a positive integer up to 999. |
Output format |
Format in which events are sent to the destination:
|
TLS mode |
TLS encryption mode. When using TLS encryption, you cannot specify an IP address in the URL field on the Basic settings. Available values:
|
Compression |
Drop-down list for configuring Snappy compression:
|
Delimiter |
The character that marks the boundary between events:
If you do not select a value in this drop-down list, \n is selected by default. |
Disk buffer disabled |
This toggle switch that enables the disk buffer. This toggle switch is turned on by default. The disk buffer is used if the collector cannot send normalized events to the destination. You can specify the size of the disk buffer in the Disk buffer size limit field. If the disk buffer runs out of free space, new normalized events will overwrite old normalized events, starting with the oldest. |
Timeout |
The time, in seconds, for which the destination waits for a response from another service or component. |
Debug |
The switch enables resource logging. The toggle switch is turned off by default. |
Filter |
Filter for determining which events must be processed by the resource. You can select an existing filter or create a new filter. To create a new filter, select Create new. If you want to edit the settings of an existing filter, click the pencil To create a filter:
|
Destination, tcp type
Destinations of the tcp type are used for TCP communications. Settings for a destination of the tcp type are described in the following tables.
Basic settings tab
Setting |
Description |
|---|---|
Name |
Unique name of the resource. The maximum length of the name is 128 Unicode characters. Required setting. |
Tenant |
The name of the tenant that owns the resource. Required setting. |
State |
This toggle switch enables sending events to the destination. This toggle switch is turned on by default.
|
Type |
Destination type: tcp. Required setting. |
URL |
URL that you want to connect to. The following URL formats are supported:
You can add multiple URLs or remove an URL. KUMA does not allow saving a resource or service if the URL field contains a tab or space character. To add an URL, click the + Add button. To remove an URL, click the delete Required setting. |
Tags |
Tags for resource search. Optional setting. |
Description |
Description of the resource. The maximum length of the description is 4000 Unicode characters. |
Advanced settings tab
Setting |
Description |
|---|---|
Buffer size |
Buffer size in bytes for accumulating events in the RAM of the server before sending them for further processing or storage. The value must be a positive integer. Default buffer size: 1,048,576 bytes (1 MB). Maximum buffer size: 67,108,864 bytes (64 MB). |
Buffer flush interval |
Interval (in seconds) for sending events to the destination. The default value is 1 second. |
Disk buffer size limit |
Size of the disk buffer in bytes. The default value is 10 GB. |
Handlers |
Number of handlers that the service can run simultaneously to process response rules in parallel. To determine the number of handlers, you can use the following formula: (<number of CPUs> / 2) + 2. The value must be a positive integer up to 999. |
Output format |
Format in which events are sent to the destination:
|
TLS mode |
TLS encryption mode. When using TLS encryption, you cannot specify an IP address in the URL field on the Basic settings. Available values:
|
Compression |
Drop-down list for configuring Snappy compression:
|
URL selection policy |
Method of determining URLs to which events must be sent first if you added multiple URLs in the URL field on the Basic settings:
|
Delimiter |
The character that marks the boundary between events:
If you do not select a value in this drop-down list, \n is selected by default. |
Disk buffer disabled |
This toggle switch that enables the disk buffer. This toggle switch is turned on by default. The disk buffer is used if the collector cannot send normalized events to the destination. You can specify the size of the disk buffer in the Disk buffer size limit field. If the disk buffer runs out of free space, new normalized events will overwrite old normalized events, starting with the oldest. |
Timeout |
The time, in seconds, for which the destination waits for a response from another service or component. |
Debug |
The switch enables resource logging. The toggle switch is turned off by default. |
Filter |
Filter for determining which events must be processed by the resource. You can select an existing filter or create a new filter. To create a new filter, select Create new. If you want to edit the settings of an existing filter, click the pencil To create a filter:
|
Destination, http type
Destinations of the http type are used for HTTP communications. Settings for a destination of the http type are described in the following tables.
Basic settings tab
Setting |
Description |
|---|---|
Name |
Unique name of the resource. The maximum length of the name is 128 Unicode characters. Required setting. |
Tenant |
The name of the tenant that owns the resource. Required setting. |
State |
This toggle switch enables sending events to the destination. This toggle switch is turned on by default.
|
Type |
Destination type: http. Required setting. |
URL |
URL that you want to connect to. The following URL formats are supported:
You can add multiple URLs or remove an URL. KUMA does not allow saving a resource or service if the URL field contains a tab or space character. To add an URL, click the + Add button. To remove an URL, click the delete Required setting. |
Authorization |
Type of authorization when connecting to the URL specified in the URL field:
|
Tags |
Tags for resource search. Optional setting. |
Description |
Description of the resource. The maximum length of the description is 4000 Unicode characters. |
Advanced settings tab
Setting |
Description |
|---|---|
Buffer size |
Buffer size in bytes for accumulating events in the RAM of the server before sending them for further processing or storage. The value must be a positive integer. Default buffer size: 1,048,576 bytes (1 MB). Maximum buffer size: 67,108,864 bytes (64 MB). |
Buffer flush interval |
Interval (in seconds) for sending events to the destination. The default value is 1 second. |
Disk buffer size limit |
Size of the disk buffer in bytes. The default value is 10 GB. |
Handlers |
Number of handlers that the service can run simultaneously to process response rules in parallel. To determine the number of handlers, you can use the following formula: (<number of CPUs> / 2) + 2. The value must be a positive integer up to 999. |
Output format |
Format in which events are sent to the destination:
|
TLS mode |
TLS encryption mode. When using TLS encryption, you cannot specify an IP address in the URL field on the Basic settings. Available values:
|
Proxy server |
The proxy server for the destination. You can select an existing proxy server or create a new proxy server. To create a new proxy server, select Create new. If you want to edit the settings of an existing proxy server, click the pencil |
Compression |
Drop-down list for configuring Snappy compression:
|
URL selection policy |
Method of determining URLs to which events must be sent first if you added multiple URLs in the URL field on the Basic settings:
|
Delimiter |
The character that marks the boundary between events:
If you do not select a value in this drop-down list, \n is selected by default. |
Path |
The path that must be added in the request to the URL specified in the URL field on the Basic settings tab. For example, if you specify |
Health check path |
The URL for sending requests to obtain health information about the system that the destination resource is connecting to. |
Health check |
This toggle switch enables the health check. This toggle switch is turned off by default. |
Disk buffer disabled |
This toggle switch that enables the disk buffer. This toggle switch is turned on by default. The disk buffer is used if the collector cannot send normalized events to the destination. You can specify the size of the disk buffer in the Disk buffer size limit field. If the disk buffer runs out of free space, new normalized events will overwrite old normalized events, starting with the oldest. |
Timeout |
The time, in seconds, for which the destination waits for a response from another service or component. |
Debug |
The switch enables resource logging. The toggle switch is turned off by default. |
Filter |
Filter for determining which events must be processed by the resource. You can select an existing filter or create a new filter. To create a new filter, select Create new. If you want to edit the settings of an existing filter, click the pencil To create a filter:
|
Destination, diode type
Destinations of the diode type are used to transmit events using a data diode. Settings for a destination of the diode type are described in the following tables.
Basic settings tab
Setting |
Description |
|---|---|
Name |
Unique name of the resource. The maximum length of the name is 128 Unicode characters. Required setting. |
Tenant |
The name of the tenant that owns the resource. Required setting. |
State |
This toggle switch enables sending events to the destination. This toggle switch is turned on by default.
|
Type |
Destination type: diode. Required setting. |
Data diode source directory |
Path to the directory from which the data diode moves events. The maximum length of the path is 255 Unicode characters. Limitations when using prefixes in paths on Windows servers Limitations when using prefixes in paths on Linux servers The paths specified in the Data diode source directory and Temporary directory fields may not be the same. |
Temporary directory |
Path to the directory in which events are prepared for transmission to the data diode. The maximum length of the path is 255 Unicode characters. Events are stored in a file when a timeout or a buffer overflow occurs. The default timeout is 10 seconds. The prepared file with events is moved to the directory specified in the Data diode source directory field. The checksum (SHA-256) of the file contents is used as the name of the file with events. The paths specified in the Data diode source directory and Temporary directory fields may not be the same. |
Tags |
Tags for resource search. Optional setting. |
Description |
Description of the resource. The maximum length of the description is 4000 Unicode characters. |
Advanced settings tab
Setting |
Description |
|---|---|
Buffer size |
Buffer size in bytes for accumulating events in the RAM of the server before sending them for further processing or storage. The value must be a positive integer. Default buffer size: 1,048,576 bytes (1 MB). Maximum buffer size: 67,108,864 bytes (64 MB). |
Buffer flush interval |
Interval (in seconds) for sending events to the destination. The default value is 1 second. |
Handlers |
Number of handlers that the service can run simultaneously to process response rules in parallel. To determine the number of handlers, you can use the following formula: (<number of CPUs> / 2) + 2. The value must be a positive integer up to 999. |
Compression |
Drop-down list for configuring Snappy compression:
|
Delimiter |
The character that marks the boundary between events:
If you do not select a value in this drop-down list, \n is selected by default. |
Debug |
The switch enables resource logging. The toggle switch is turned off by default. |
Filter |
Filter for determining which events must be processed by the resource. You can select an existing filter or create a new filter. To create a new filter, select Create new. If you want to edit the settings of an existing filter, click the pencil To create a filter:
|
Destination, kafka type
Destinations of the kafka type are used for communication using kafka. Settings for a destination of the kafka type are described in the following tables.
Basic settings tab
Setting |
Description |
|---|---|
Name |
Unique name of the resource. The maximum length of the name is 128 Unicode characters. Required setting. |
Tenant |
The name of the tenant that owns the resource. Required setting. |
State |
This toggle switch enables sending events to the destination. This toggle switch is turned on by default.
|
Type |
Destination type: kafka. Required setting. |
URL |
URL that you want to connect to. The following URL formats are supported:
You can add multiple URLs or remove an URL. KUMA does not allow saving a resource or service if the URL field contains a tab or space character. To add an URL, click the + Add button. To remove an URL, click the delete Required setting. |
Topic |
Subject of Kafka messages. The maximum length of the subject is 255 characters. You can use the following characters: a–z, A–Z, 0–9, ".", "_", "-". Required setting. |
Authorization |
Type of authorization when connecting to the URL specified in the URL field:
|
Tags |
Tags for resource search. Optional setting. |
Description |
Description of the resource. The maximum length of the description is 4000 Unicode characters. |
Advanced settings tab
Setting |
Description |
|---|---|
Buffer size |
Buffer size in bytes for accumulating events in the RAM of the server before sending them for further processing or storage. The value must be a positive integer. Default buffer size: 1,048,576 bytes (1 MB). Maximum buffer size: 67,108,864 bytes (64 MB). |
Buffer flush interval |
Interval (in seconds) for sending events to the destination. The default value is 1 second. |
Disk buffer size limit |
Size of the disk buffer in bytes. The default value is 10 GB. |
Handlers |
Number of handlers that the service can run simultaneously to process response rules in parallel. To determine the number of handlers, you can use the following formula: (<number of CPUs> / 2) + 2. The value must be a positive integer up to 999. |
Output format |
Format in which events are sent to the destination:
|
TLS mode |
TLS encryption mode. When using TLS encryption, you cannot specify an IP address in the URL field on the Basic settings. Available values:
|
Delimiter |
The character that marks the boundary between events:
If you do not select a value in this drop-down list, \n is selected by default. |
Disk buffer disabled |
This toggle switch that enables the disk buffer. This toggle switch is turned on by default. The disk buffer is used if the collector cannot send normalized events to the destination. You can specify the size of the disk buffer in the Disk buffer size limit field. If the disk buffer runs out of free space, new normalized events will overwrite old normalized events, starting with the oldest. |
Timeout |
The time, in seconds, for which the destination waits for a response from another service or component. |
Debug |
The switch enables resource logging. The toggle switch is turned off by default. |
Filter |
Filter for determining which events must be processed by the resource. You can select an existing filter or create a new filter. To create a new filter, select Create new. If you want to edit the settings of an existing filter, click the pencil To create a filter:
|
Destination, file type
Destinations of the file type destinations are used for writing to a file. Settings for a destination of the file type are described in the following tables.
When deleting a destination of the file type that is being used in a service, you must restart the service.
Basic settings tab
Setting |
Description |
|---|---|
Name |
Unique name of the resource. The maximum length of the name is 128 Unicode characters. Required setting. |
Tenant |
The name of the tenant that owns the resource. Required setting. |
State |
This toggle switch enables sending events to the destination. This toggle switch is turned on by default.
|
Type |
Destination type: file. Required setting. |
URL |
Path to the file to which the events must be written. Limitations when using prefixes in file paths Required setting. |
Tags |
Tags for resource search. Optional setting. |
Description |
Description of the resource. The maximum length of the description is 4000 Unicode characters. |
Advanced settings tab
Setting |
Description |
|---|---|
Buffer size |
Buffer size in bytes for accumulating events in the RAM of the server before sending them for further processing or storage. The value must be a positive integer. Default buffer size: 1,048,576 bytes (1 MB). Maximum buffer size: 67,108,864 bytes (64 MB). |
Buffer flush interval |
Interval (in seconds) for sending events to the destination. The default value is 1 second. |
Disk buffer size limit |
Size of the disk buffer in bytes. The default value is 10 GB. |
Handlers |
Number of handlers that the service can run simultaneously to process response rules in parallel. To determine the number of handlers, you can use the following formula: (<number of CPUs> / 2) + 2. The value must be a positive integer up to 999. |
Output format |
Format in which events are sent to the destination:
|
Delimiter |
The character that marks the boundary between events:
If you do not select a value in this drop-down list, \n is selected by default. |
Disk buffer disabled |
This toggle switch that enables the disk buffer. This toggle switch is turned on by default. The disk buffer is used if the collector cannot send normalized events to the destination. You can specify the size of the disk buffer in the Disk buffer size limit field. If the disk buffer runs out of free space, new normalized events will overwrite old normalized events, starting with the oldest. |
Debug |
The switch enables resource logging. The toggle switch is turned off by default. |
Filter |
Filter for determining which events must be processed by the resource. You can select an existing filter or create a new filter. To create a new filter, select Create new. If you want to edit the settings of an existing filter, click the pencil To create a filter:
|
Destination, storage type
Destinations of the storage type are used to transfer data to storage. Settings for a destination of the storage type are described in the following tables.
Basic settings tab
Setting |
Description |
|---|---|
Name |
Unique name of the resource. The maximum length of the name is 128 Unicode characters. Required setting. |
Tenant |
The name of the tenant that owns the resource. Required setting. |
State |
This toggle switch enables sending events to the destination. This toggle switch is turned on by default.
|
Type |
Destination type: storage. Required setting. |
URL |
URL that you want to connect to. The following URL formats are supported:
You can add multiple URLs or remove an URL. KUMA does not allow saving a resource or service if the URL field contains a tab or space character. To add an URL, click the + Add button. To remove an URL, click the delete Required setting. |
Tags |
Tags for resource search. Optional setting. |
Description |
Description of the resource. The maximum length of the description is 4000 Unicode characters. |
Advanced settings tab
Setting |
Description |
|---|---|
Buffer size |
Buffer size in bytes for accumulating events in the RAM of the server before sending them for further processing or storage. The value must be a positive integer. Default buffer size: 1,048,576 bytes (1 MB). Maximum buffer size: 67,108,864 bytes (64 MB). |
Buffer flush interval |
Interval (in seconds) for sending events to the destination. The default value is 1 second. |
Disk buffer size limit |
Size of the disk buffer in bytes. The default value is 10 GB. |
Handlers |
Number of handlers that the service can run simultaneously to process response rules in parallel. To determine the number of handlers, you can use the following formula: (<number of CPUs> / 2) + 2. The value must be a positive integer up to 999. |
Proxy server |
The proxy server for the destination. You can select an existing proxy server or create a new proxy server. To create a new proxy server, select Create new. If you want to edit the settings of an existing proxy server, click the pencil |
URL selection policy |
Method of determining URLs to which events must be sent first if you added multiple URLs in the URL field on the Basic settings:
|
Health check timeout |
Interval, in seconds, for checking the health of the destination. |
Disk buffer disabled |
This toggle switch that enables the disk buffer. This toggle switch is turned on by default. The disk buffer is used if the collector cannot send normalized events to the destination. You can specify the size of the disk buffer in the Disk buffer size limit field. If the disk buffer runs out of free space, new normalized events will overwrite old normalized events, starting with the oldest. |
Timeout |
The time, in seconds, for which the destination waits for a response from another service or component. |
Debug |
The switch enables resource logging. The toggle switch is turned off by default. |
Filter |
Filter for determining which events must be processed by the resource. You can select an existing filter or create a new filter. To create a new filter, select Create new. If you want to edit the settings of an existing filter, click the pencil To create a filter:
|
Destination, correlator type
Destinations of the correlator type are used to transfer data to a correlator. Settings for a destination of the correlator type are described in the following tables.
Basic settings tab
Setting |
Description |
|---|---|
Name |
Unique name of the resource. The maximum length of the name is 128 Unicode characters. Required setting. |
Tenant |
The name of the tenant that owns the resource. Required setting. |
State |
This toggle switch enables sending events to the destination. This toggle switch is turned on by default.
|
Type |
Destination type: correlator. Required setting. |
URL |
URL that you want to connect to. The following URL formats are supported:
You can add multiple URLs or remove an URL. KUMA does not allow saving a resource or service if the URL field contains a tab or space character. To add an URL, click the + Add button. To remove an URL, click the delete Required setting. |
Tags |
Tags for resource search. Optional setting. |
Description |
Description of the resource. The maximum length of the description is 4000 Unicode characters. |
Advanced settings tab
Setting |
Description |
|---|---|
Buffer size |
Buffer size in bytes for accumulating events in the RAM of the server before sending them for further processing or storage. The value must be a positive integer. Default buffer size: 1,048,576 bytes (1 MB). Maximum buffer size: 67,108,864 bytes (64 MB). |
Buffer flush interval |
Interval (in seconds) for sending events to the destination. The default value is 1 second. |
Disk buffer size limit |
Size of the disk buffer in bytes. The default value is 10 GB. |
Handlers |
Number of handlers that the service can run simultaneously to process response rules in parallel. To determine the number of handlers, you can use the following formula: (<number of CPUs> / 2) + 2. The value must be a positive integer up to 999. |
Proxy server |
The proxy server for the destination. You can select an existing proxy server or create a new proxy server. To create a new proxy server, select Create new. If you want to edit the settings of an existing proxy server, click the pencil |
URL selection policy |
Method of determining URLs to which events must be sent first if you added multiple URLs in the URL field on the Basic settings:
|
Health check timeout |
Interval, in seconds, for checking the health of the destination. |
Disk buffer disabled |
This toggle switch that enables the disk buffer. This toggle switch is turned on by default. The disk buffer is used if the collector cannot send normalized events to the destination. You can specify the size of the disk buffer in the Disk buffer size limit field. If the disk buffer runs out of free space, new normalized events will overwrite old normalized events, starting with the oldest. |
Timeout |
The time, in seconds, for which the destination waits for a response from another service or component. |
Debug |
The switch enables resource logging. The toggle switch is turned off by default. |
Filter |
Filter for determining which events must be processed by the resource. You can select an existing filter or create a new filter. To create a new filter, select Create new. If you want to edit the settings of an existing filter, click the pencil To create a filter:
|
Destination, eventRouter type
Destinations of the eventRouter type are used for sending events to the event router. Settings for a destination of the eventRouter type are described in the following tables.
Basic settings tab
Setting |
Description |
|---|---|
Name |
Unique name of the resource. The maximum length of the name is 128 Unicode characters. Required setting. |
Tenant |
The name of the tenant that owns the resource. Required setting. |
State |
This toggle switch enables sending events to the destination. This toggle switch is turned on by default.
|
Type |
Destination type: eventRouter. Required setting. |
URL |
URL that you want to connect to. The following URL formats are supported:
You can add multiple URLs or remove an URL. KUMA does not allow saving a resource or service if the URL field contains a tab or space character. To add an URL, click the + Add button. To remove an URL, click the delete Required setting. |
Tags |
Tags for resource search. Optional setting. |
Description |
Description of the resource. The maximum length of the description is 4000 Unicode characters. |
Advanced settings tab
Setting |
Description |
|---|---|
Buffer size |
Buffer size in bytes for accumulating events in the RAM of the server before sending them for further processing or storage. The value must be a positive integer. Default buffer size: 1,048,576 bytes (1 MB). Maximum buffer size: 67,108,864 bytes (64 MB). |
Buffer flush interval |
Interval (in seconds) for sending events to the destination. The default value is 1 second. |
Disk buffer size limit |
Size of the disk buffer in bytes. The default value is 10 GB. |
Handlers |
Number of handlers that the service can run simultaneously to process response rules in parallel. To determine the number of handlers, you can use the following formula: (<number of CPUs> / 2) + 2. The value must be a positive integer up to 999. |
Output format |
Format in which events are sent to the destination:
|
Proxy server |
The proxy server for the destination. You can select an existing proxy server or create a new proxy server. To create a new proxy server, select Create new. If you want to edit the settings of an existing proxy server, click the pencil |
URL selection policy |
Method of determining URLs to which events must be sent first if you added multiple URLs in the URL field on the Basic settings:
|
Health check timeout |
Interval, in seconds, for checking the health of the destination. |
Disk buffer disabled |
This toggle switch that enables the disk buffer. This toggle switch is turned on by default. The disk buffer is used if the collector cannot send normalized events to the destination. You can specify the size of the disk buffer in the Disk buffer size limit field. If the disk buffer runs out of free space, new normalized events will overwrite old normalized events, starting with the oldest. |
Timeout |
The time, in seconds, for which the destination waits for a response from another service or component. |
Debug |
The switch enables resource logging. The toggle switch is turned off by default. |
Filter |
Filter for determining which events must be processed by the resource. You can select an existing filter or create a new filter. To create a new filter, select Create new. If you want to edit the settings of an existing filter, click the pencil To create a filter:
|
Predefined destinations
Destinations listed in the table below are included in the KUMA distribution kit.
Predefined destinations
Destination name |
Description |
[OOTB] Correlator |
Sends events to a correlator. |
[OOTB] Storage |
Sends events to storage. |
Normalizers
Normalizers are used for converting raw events that come from various sources in different formats to the KUMA event data model. Normalized events become available for processing by other KUMA resources and services.
A normalizer consists of the main event parsing rule and optional additional event parsing rules. By creating a main parsing rule and a set of additional parsing rules, you can implement complex event processing logic. Data is passed along the tree of parsing rules depending on the conditions specified in the
Extra normalization conditions setting. The sequence in which parsing rules are created is significant: the event is processed sequentially and the processing sequence is indicated by arrows.
The following event normalization options are now available:
- 1 collector — 1 normalizer
We recommend using this method if you have many events of the same type or many IP addresses from which events of the same type may originate. You can configure one collector with only one normalizer, which is optimal in terms of performance.
- 1 collector — multiple normalizers linked to IP
This method is available for collectors with a connector of UDP, TCP, or HTTP type. If a UDP, TCP, or HTTP connector is specified in the collector at the 'Transport' step, then at the 'Event parsing' step, you can specify multiple IP addresses on the 'Parsing settings' tab and choose the normalizer that you want to use for events coming from the specified addresses. The following types of normalizers are available: json, cef, regexp, syslog, csv, kv, xml. For normalizers of the Syslog and regexp types, you can specify extra normalization conditions depending on the value of the DeviceProcessName field.
A normalizer is created in several steps:
- Preparing to create a normalizer
A normalizer can be created in the KUMA web interface:
- In the Resources → Normalizers section.
- When creating a collector, at the Event parsing step.
Then parsing rules must be created in the normalizer.
- Creating the main parsing rule for an event
The main parsing rule is created using the Add event parsing button. This opens the Event parsing window, where you can specify the settings of the main parsing rule:
- Specify event parsing settings.
- Specify event enrichment settings.
The main parsing rule for an event is displayed in the normalizer as a dark circle. You can view or modify the settings of the main parsing rule by clicking this circle. When you hover the mouse over the circle, a plus sign is displayed. Click it to add the parsing rules.
The name of the main parsing rule is used in KUMA as the normalizer name.
- Creating additional event parsing rules
Clicking the plus icon that is displayed when you hover the mouse over the circle or the block corresponding to the normalizer opens the Additional event parsing window where you can specify the settings of the additional parsing rule:
- Specify the conditions for sending data to the new normalizer.
- Specify event parsing settings.
- Specify event enrichment settings.
The additional event parsing rule is displayed in the normalizer as a dark block. The block displays the triggering conditions for the additional parsing rule, the name of the additional parsing rule, and the event field. When this event field is available, the data is passed to the normalizer. Click the block of the additional parsing rule to view or modify its settings.
If you hover the mouse over the additional normalizer, a plus button appears. You can use this button to create a new additional event parsing rule. To delete a normalizer, use the button with the trash icon.
- Completing the creation of the normalizer
To finish the creation of the normalizer, click Save.
In the upper right corner, in the search field, you can search for additional parsing rules by name.
For normalizer resources, you can enable the display of control characters in all input fields except the Description field.
If, when changing the settings of a collector resource set, you change or delete conversions in a normalizer connected to it, the edits will not be saved, and the normalizer itself may be corrupted. If you need to modify conversions in a normalizer that is already part of a service, the changes must be made directly to the normalizer under Resources → Normalizers in the web interface.
Event parsing settings
You can configure the rules for converting incoming events to the KUMA format when creating event parsing rules in the normalizer settings window, on the Normalization scheme tab. Available event parsing settings are listed in the table below.
When normalizing events, you can use extended event schema fields in addition to standard KUMA event schema fields.
Available event parsing settings
Setting |
Description |
|---|---|
Name |
Name of the parsing rule. Maximum length of the name: 128 Unicode characters. The name of the main parsing rule is used as the name of the normalizer. Required setting. |
Tenant |
The name of the tenant that owns the resource. This setting is not available for extra parsing rules. |
Parsing method |
The type of incoming events. Depending on the selected parsing method, you can use the predefined event field matching rules or define your own rules. When you select some parsing methods, additional settings may become available they you must specify. Available parsing methods:
Required setting. |
Keep raw event |
Keeping raw events in the newly created normalized event. Available values:
Required setting. This setting is not available for extra parsing rules. |
Keep extra fields |
Keep fields and values for which no mapping rules are configured. This data is saved as an array in the Filtering based on data from the Extra event field By default, no extra fields are saved. Required setting. |
Description |
Description of the resource. Maximum length of the description: 4000 Unicode characters. This setting is not available for extra parsing rules. |
Event examples |
Example of data that you want to process. This setting is not available for the following parsing methods: netflow5, netflow9, sflow5, ipfix, and sql. If the event was parsed successfully, and the type of the data obtained from the raw event matches the type of the KUMA field, the Event examples field is filled with data obtained from the raw event. For example, the |
Mapping |
Settings for configuring the mapping of source event fields to fields of the event in the KUMA format:
You can add new table rows or delete table rows. To add a new table row, click Add row. To delete a single row in the table, click If you have loaded data into the Event examples field, the table will have an Examples column containing examples of values carried over from the raw event field to the KUMA event field. If the size of the KUMA event field is less than the length of the value placed in it, the value is truncated to the size of the event field. |
Extended event schema
You can use the extended event schema fields in normalizers for normalizing events and in other KUMA resources, for example, as widget fields or to filter and search for events. You can view the list of all extended event schema fields that exist in KUMA in the Settings → Extended event schema fields section. The list of extended event schema fields is the same for all tenants.
Only users with the General administrator, Tenant administrator, Tier 2 analyst, Tier 1 analyst, Junior analyst, Read shared resources, and Manage shared resources roles can view the table of extended event schema fields.
The Extended event schema fields table contains the following information:
- Type—Data type of the extended event schema field.
- Field name—Name of the extended event schema field, without a type.
You can click the name to edit the settings of the extended event schema field.
- Status—Whether the extended event schema field can be used in resources.
You can Enable or Disable the toggle switch to allow or forbid using this extended event schema field in new resources. However, a disabled field is still used in resource configurations that are already operational, until you manually remove the field from the configuration; the field also remains available in the list of table columns in the Events section for managing old events.
Only a user with the General administrator role can disable an extended event schema field.
- Update date—Date and time of the last modification of the extended event schema field.
- Created by—Name of the user that created the extended event schema field.
- Dependencies—Number of KUMA resources, dashboard layouts, reports, presets, and field sets for searching event sources that use the extended event schema field.
You can click the number to open a pane with a table of all resources and other KUMA entities that are using this field. For each dependency, the table displays the name, tenant (only for resources), and type. Dependencies in the table are sorted by name. Clicking the name of a dependency takes you to its page (except for dashboard layouts, presets, and saved user queries).
You can view the dependencies of an extended event schema field only for resources and entities to whose tenants you have access. If you do not have access to the tenant, its resources are not displayed in the table, but still count towards the number of dependencies.
- Description—Text description of the field.
By default, the table of extended event schema fields is sorted by update date in descending order. If necessary, you can sort the table by clicking a column heading and selecting Ascending or Descending; you can also use context search by field name.
By default, the following service extended event schema fields are automatically added to KUMA 3.4 and later:
KL_EventRoute, typeSfor storing information about the route of the event.You can use this field in normalizers, as a key or value in active lists, in enrichment rules, as a query field in data collection and analysis rules, in correlation rules. You cannot use this field to detect event sources.
- The following fields are added to a correlation event:
KL_CorrelationRulePriority, typeNKL_SourceAssetDisplayName, typeSKL_DestinationAssetDisplayName, typeSKL_DeviceAssetDisplayName, typeSKL_SourceAccountDisplayName, typeSKL_DestinationAccountDisplayName, typeS
You cannot use this service fields to search for events.
You cannot edit, delete, export, or disable service fields. All extended event schema fields with the KL_ prefix are service fields and can be managed only from Kaspersky servers. We do not recommend using the KL_ prefix when adding new extended event schema fields.
Adding extended event schema fields
Users with the General administrator, Tenant administrator, Tier 2 analyst, Tier 1 analyst, Junior analyst, Manage shared resources roles can add new extended event schema fields.
To add an extended event schema field:
- In the KUMA web console, in the Settings → Extended event schema fields section, click the Add button in the upper part of the table.
This opens the Create extended schema pane.
- Enable or disable the Status toggle switch to enable or disable this extended event schema field for resources.
The toggle switch is turned on by default. A disabled field remains available in the list of table columns in the Events section for managing old events.
- In the Type field, select the data type of the extended event schema field.
- In the Name field, specify the name of the extended event schema field.
Consider the following when naming extended event schema fields:
- The name must be unique within the KUMA instance.
- Names are case-sensitive. For example,
Field_nameandfield_nameare different names. - You can use Latin, Cyrillic characters and numerals. Spaces or " ~ ` @ # $ % ^ & * ( ) + - [ ] { } | \ | / . " < > ; ! , : ? = characters are not allowed.
- If you want to use the extended event schema fields to search for event sources, you can only use Latin characters and numerals.
- The maximum length is 128 characters.
- If necessary, in the Description field, enter a description for the extended event schema field.
We recommend describing the purpose of the extended event schema field. Only Unicode characters are allowed in the description. The maximum length is 256 characters.
- Click the Save button.
A new extended event schema field is added and displayed at the top of the table. An audit event is generated for the creation of the extended event schema field. If you have enabled the field, you can use it in normalizers and when configuring resources.
Page top
Editing extended event schema fields
Users with the General administrator, Tenant administrator, Tier 2 analyst, Tier 1 analyst, Junior analyst, Manage shared resources roles can edit existing extended event schema fields.
To edit an extended event schema field:
- In the KUMA web console, in the Settings → Extended event schema fields section, click the name of the field that you want to edit.
This opens the Edit extended schema pane. This pane displays the settings of the selected field, as well as the Dependencies table with a list of resources, dashboard layouts, reports, presets, and sets of fields for finding event sources that use this field. Only resources to whose tenants you have access are displayed. If the field is used by resources to whose tenant you do not have access, such resources are not displayed in the table. Resources in the table are sorted by name.
Clicking the name of a resource or entity takes you to its page (except for dashboard resources, presets, and saved user queries).
- Make the changes you need in the available settings.
You can edit the Type and Field name settings only if the extended event schema field does not have dependencies. You can edit the Status and Description settings for any extended event scheme field. However, a field with the Disabled status is still used in resource configurations that are already operational, until you manually remove the field from the configuration; the field also remains available in the list of table columns in the Events section for managing old events.
Disabling an extended event schema field using the Status field requires the General administrator role.
- Click the Save button.
The extended event schema field is updated. An audit event is generated about the modification of the field.
Page top
Importing and exporting extended event schema fields
You can add multiple new extended event schema fields at once by importing them from a JSON file. You can also export all extended event schema fields with information about them to a file, for example, to propagate the list of fields to other KUMA instances to maintain resources.
Users with the General administrator, Tenant administrator, Tier 2 analyst, Tier 1 analyst, Junior analyst, and Manage shared resources roles can import an export extended event schema fields. Users with the Read shared resources role can only export extended event schema fields.
To import extended event schema fields into KUMA from a file:
- In the KUMA web console, in the Settings → Extended event schema fields section, click the Import button.
- This opens a window; in that window, select a JSON file with a list of extended event schema field objects.
Example JSON file:
[{"kind": "SA","name": "<fieldName1>","description": "<description1>","disabled": false},{"kind": "N","name": "<fieldName2>","description": "<description2>","disabled": false},....{"kind": "FA","name": "<fieldNameX>","description": "<descriptionX>","disabled": false}]When importing fields from a file, their names are checked for possible conflicts with fields of the same type. If a field with the same name and type already exists in KUMA, such fields are not imported from the file.
Extended event schema fields are imported from the file to KUMA. An audit event about the import of fields is generated, and a separate audit event is generated for each added field.
To export extended event schema fields to a file:
- In the KUMA web console, go to the Settings → Extended event schema fields section.
- If you want to export specific extended event schema fields:
- Select the check boxes in the first column of the table for the required fields.
You cannot select service fields.
- Click the Export selected button in the upper part of the table.
- Select the check boxes in the first column of the table for the required fields.
- If you want to export all extended event schema fields, click the Export all button in the upper part of the table.
A JSON file with a list of extended event schema field objects and information about them is downloaded.
Page top
Deleting extended event schema fields
Only a user with the General administrator role can delete extended event schema fields.
You can delete only those extended event schema fields that are not service fields, that have the Disabled status, and that are not used in KUMA resources and other entities (do not have dependencies). We recommend deleting extended event schema fields after enough time has passed to make sure that all events in which the field was used have been deleted from KUMA. When you delete a field, it is no longer displayed in event tips.
To delete extended event schema fields:
- In the KUMA web console, go to the Settings → Extended event schema fields section.
- Select the check boxes in the first column of the table next to one or more fields that you want to delete.
To select all fields, you can select the check box in the heading of the first column.
- Click the Delete button in the upper part of the table.
The Delete button is active only if all selected fields are disabled and have no dependencies. If at least one field is enabled or has a dependency, the button is inactive.
If you want to delete a field that is used in at least one KUMA resource (has a dependency), but you do not have access to its tenant, the Delete button is active when this field is selected, but an error is displayed when you try to delete it.
The selected fields are deleted. An audit event is generated about the deletion of the fields.
Page top
Using extended event schema fields in normalizers
When using extended event schema fields, the general limit for the maximum size of an event that can be processed by the collector is the same, 4 MB. Information about the types of extended event schema fields is shown in the table below (step 6 of the instructions).
Using many unique fields of the extended event schema can reduce the performance of the system, increase the amount of disk space required for storing events, and make the information difficult to understand.
We recommend consciously choosing a minimal set of additional fields of the extended event schema that you want to use in normalizers and correlation.
To use the fields of the extended event schema:
- Open an existing normalizer or create a new normalizer.
- Specify the basic settings of the normalizer.
- Click Add row.
- For the Source setting, enter the name of the source field in the raw event.
- For the KUMA field setting, start typing the name of the extended event schema field and select the field from the drop-down list.
The extended event schema fields in the drop-down list have names in the
<type>.<field name>format. - Click the Save button to save the event normalizer.
The normalizer is saved with the selected extended event schema field.
If the data in the fields of the raw event does not match the type of the KUMA field, the value is not saved during the normalization of events if type conversion cannot be performed. For example, the string test cannot be written to the DeviceCustomNumber1 KUMA field of the Number type.
If you want to minimize the load on the storage server when searching events, preparing reports, and performing other operations on events in storage, use KUMA event schema fields as your first preference, extended event schema fields as your second preference, and the Extra fields as your last resort.
Enrichment in the normalizer
When creating event parsing rules in the normalizer settings window, on the Enrichment tab, you can configure the rules for adding extra data to the fields of the normalized event using enrichment rules. Enrichment rules are stored in the settings of the normalizer where they were created.
You can create enrichment rules by clicking the Add enrichment button. To delete an enrichment rule, click next to it. Extended event schema fields can be used for event enrichment. Available enrichment rule settings are listed in the table below.
Available enrichment rule settings
Setting |
Description |
||||||||||||||
|---|---|---|---|---|---|---|---|---|---|---|---|---|---|---|---|
Source kind |
Enrichment type. Depending on the selected enrichment type, advanced settings that will also need to be completed will be displayed. Available types of enrichment:
Required setting. |
||||||||||||||
Target field |
The KUMA event field that you want to populate with the data. Required setting. This setting is not available for the enrichment source of the Table type. |
Conditions for forwarding data to an extra normalizer
When creating additional event parsing rules, you can specify the conditions. When these conditions are met, the events are sent to the created parsing rule for processing. Conditions can be specified in the Additional event parsing window, on the Extra normalization conditions tab. This tab is not available for the basic parsing rules.
Available settings:
- Use raw event — If you want to send a raw event for extra normalization, select Yes in the Keep raw event drop-down list. The default value is No. We recommend passing a raw event to normalizers of json and xml types. If you want to send a raw event for extra normalization to the second, third, etc nesting levels, at each nesting level, select Yes in the Keep raw event drop-down list.
- Field to pass into normalizer—indicates the event field if you want only events with fields configured in normalizer settings to be sent for additional parsing.
If this field is blank, the full event is sent to the extra normalizer for processing.
- Set of filters—used to define complex conditions that must be met by the events received by the normalizer.
You can use the Add condition button to add a string containing fields for identifying the condition (see below).
You can use the Add group button to add a group of filters. Group operators can be switched between AND, OR, and NOT. You can add other condition groups and individual conditions to filter groups.
You can swap conditions and condition groups by dragging them by the
icon; you can also delete them using the icon.
Filter condition settings:
- Left operand and Right operand—used to specify the values to be processed by the operator.
In the left operand, you must specify the source field of events coming into the normalizer. For example, if the eventType - DeviceEventClass mapping is configured in the Basic event parsing window, then in the Additional event parsing window on the Extra normalization conditions tab, you must specify eventType in the left operand field of the filter. Data is processed only as text strings.
- Operators:
- = – full match of the left and right operands.
- startsWith – the left operand starts with the characters specified in the right operand.
- endsWith – the left operand ends with the characters specified in the right operand.
- match – the left operand matches the regular expression (RE2) specified in the right operand.
- in – the left operand matches one of the values specified in the right operand.
The incoming data can be converted by clicking the button. The Conversion window opens, where you can use the Add conversion button to create the rules for converting the source data before any actions are performed on them. In the Conversion window, you can swap the added rules by dragging them by the icon; you can also delete them using the icon.
Supported event sources
KUMA supports the normalization of events coming from systems listed in the table below. Normalizers for these systems are included in the distribution kit.
Supported event sources
System name |
Normalizer name |
Type |
Normalizer description |
|---|---|---|---|
1C EventJournal |
[OOTB] 1C EventJournal Normalizer |
xml |
Designed for processing the event log of the 1C system. The event source is the 1C log. |
1C TechJournal |
[OOTB] 1C TechJournal Normalizer |
regexp |
Designed for processing the technology event log. The event source is the 1C technology log. |
Absolute Data and Device Security (DDS) |
[OOTB] Syslog-CEF |
Syslog |
Designed for processing events in the CEF format. |
AhnLab Malware Defense System (MDS) |
[OOTB] Syslog-CEF |
Syslog |
Designed for processing events in the CEF format. |
AhnLab UTM |
[OOTB] Ahnlab UTM |
regexp |
Designed for processing events from the Ahnlab system. The event sources are system logs, operation logs, connections, the IPS module. |
AhnLabs MDS |
[OOTB] Syslog-CEF |
Syslog |
Designed for processing events in the CEF format. |
Alcatel AOS-W |
[OOTB] Alcatel AOS-W syslog |
regexp |
Designed for processing some of the events received from Alcatel AOS-W 6.4 via Syslog. |
Alcatel Network Switch |
[OOTB] Alcatel Network Switch syslog |
Syslog |
Designed for processing certain types of events received from Alcatel network switches via Syslog. |
Apache Cassandra |
[OOTB] Apache Cassandra file |
regexp |
Designed for processing events from the logs of the Apache Cassandra database version 4.0. |
Aruba ClearPass |
[OOTB] Syslog-CEF |
Syslog |
Designed for processing events in the CEF format. |
Atlassian Confluence |
[OOTB] Atlassian Jira Conflunce file |
regexp |
Designed for processing events of Atlassian Jira, Atlassian Confluence systems (Jira 9.12, Confluence 8.5) stored in files. |
Atlassian Jira |
[OOTB] Atlassian Jira Conflunce file |
regexp |
Designed for processing events of Atlassian Jira, Atlassian Confluence systems (Jira 9.12, Confluence 8.5) stored in files. |
Avanpost FAM |
[OOTB] Avanpost FAM syslog |
regexp |
Designed for processing events of the Avanpost Federated Access Manager (FAM) 1.9 received via Syslog. |
Avanpost IDM |
[OOTB] Avanpost IDM syslog |
regexp |
Designed for processing events of the Avanpost IDM system received via Syslog. |
Avanpost PKI |
[OOTB] Avanpost PKI syslog CEF |
Syslog |
Designed for processing events received from Avanpost PKI 6.0 in CEF format via Syslog. |
Avaya Aura Communication Manager |
[OOTB] Avaya Aura Communication Manager syslog |
regexp |
Designed for processing some of the events received from Avaya Aura Communication Manager 7.1 via Syslog. |
Avigilon Access Control Manager (ACM) |
[OOTB] Syslog-CEF |
Syslog |
Designed for processing events in the CEF format. |
Ayehu eyeShare |
[OOTB] Syslog-CEF |
Syslog |
Designed for processing events in the CEF format. |
Arbor Pravail |
[OOTB] Arbor Pravail syslog |
Syslog |
Designed for processing events of the Arbor Pravail system received via Syslog. |
Aruba Aruba AOS-S |
[OOTB] Aruba Aruba AOS-S syslog |
regexp |
Designed for processing certain types of events received from Aruba network devices with Aruba AOS-S 16.10 firmware via Syslog. The normalizer supports the following types of events: accounting events, ACL events, ARP protect events, authentication events, console events, loop protect events. |
Barracuda Cloud Email Security Gateway |
[OOTB] Barracuda Cloud Email Security Gateway syslog |
regexp |
Designed for processing events from Barracuda Cloud Email Security Gateway via Syslog. |
Barracuda Networks NG Firewall |
[OOTB] Syslog-CEF |
Syslog |
Designed for processing events in the CEF format. |
Barracuda Web Security Gateway |
[OOTB] Barracuda Web Security Gateway syslog |
Syslog |
Designed for processing some of the events received from Barracuda Web Security Gateway 15.0 via Syslog. |
BeyondTrust Privilege Management Console |
[OOTB] Syslog-CEF |
Syslog |
Designed for processing events in the CEF format. |
BeyondTrust’s BeyondInsight |
[OOTB] Syslog-CEF |
Syslog |
Designed for processing events in the CEF format. |
Bifit Mitigator |
[OOTB] Bifit Mitigator Syslog |
Syslog |
Designed for processing events from the DDOS Mitigator protection system received via Syslog. |
Bloombase StoreSafe |
[OOTB] Syslog-CEF |
Syslog |
Designed for processing events in the CEF format. |
BMC CorreLog |
[OOTB] Syslog-CEF |
Syslog |
Designed for processing events in the CEF format. |
Bricata ProAccel |
[OOTB] Syslog-CEF |
Syslog |
Designed for processing events in the CEF format. |
Brinqa Risk Analytics |
[OOTB] Syslog-CEF |
Syslog |
Designed for processing events in the CEF format. |
Broadcom Symantec Advanced Threat Protection (ATP) |
[OOTB] Syslog-CEF |
Syslog |
Designed for processing events in the CEF format. |
Broadcom Symantec Endpoint Protection |
[OOTB] Broadcom Symantec Endpoint Protection |
regexp |
Designed for processing events from the Symantec Endpoint Protection system. |
Broadcom Symantec Endpoint Protection Mobile |
[OOTB] Syslog-CEF |
Syslog |
Designed for processing events in the CEF format. |
Broadcom Symantec Threat Hunting Center |
[OOTB] Syslog-CEF |
Syslog |
Designed for processing events in the CEF format. |
Brocade Fabric OS |
[OOTB] Brocade Fabric OS syslog |
Syslog |
Designed for processing events of Brocade Fabric 9.1 received via syslog. |
Canonical LXD |
[OOTB] Canonical LXD syslog |
Syslog |
Designed for processing events received via Syslog from the Canonical LXD system version 5.18. |
Checkpoint |
[OOTB] Checkpoint syslog |
Syslog |
[OOTB] Checkpoint syslog is a normalizer designed for processing events received from the Checkpoint R81 firewall via the Syslog protocol. |
Cisco Access Control Server (ACS) |
[OOTB] Cisco ACS syslog |
regexp |
Designed for processing events of the Cisco Access Control Server (ACS) system received via Syslog. |
Cisco ASA |
[OOTB] Cisco ASA and IOS syslog |
Syslog |
Designed for certain events of Cisco ASA and Cisco IOS devices received via Syslog. |
Cisco Email Security Appliance (WSA) |
[OOTB] Cisco WSA AccessFile |
regexp |
Designed for processing the event log of the Cisco Email Security Appliance (WSA) proxy server, the access.log file. |
Cisco ESA syslog |
[OOTB] Cisco ESA syslog |
Syslog |
Designed for processing certain types of events received from Alcatel network switches via Syslog. |
Cisco Firepower Threat Defense |
[OOTB] Cisco ASA and IOS syslog |
Syslog |
Designed for processing events for network devices: Cisco ASA, Cisco IOS, Cisco Firepower Threat Defense (version 7.2) received via Syslog. |
Cisco Identity Services Engine (ISE) |
[OOTB] Cisco ISE syslog |
regexp |
Designed for processing events of the Cisco Identity Services Engine (ISE) system received via Syslog. |
Cisco IOS |
[OOTB] Cisco ASA and IOS syslog |
Syslog |
Designed for certain events of Cisco ASA and Cisco IOS devices received via Syslog. |
Cisco Netflow v5 |
[OOTB] NetFlow v5 |
netflow5 |
Designed for processing events from Cisco Netflow version 5. |
Cisco NetFlow v9 |
[OOTB] NetFlow v9 |
netflow9 |
Designed for processing events from Cisco Netflow version 9. |
Cisco Prime |
[OOTB] Cisco Prime syslog |
Syslog |
Designed for processing events of the Cisco Prime system version 3.10 received via Syslog. |
Cisco Secure Email Gateway (SEG) |
[OOTB] Syslog-CEF |
Syslog |
Designed for processing events in the CEF format. |
Cisco Secure Firewall Management Center |
[OOTB] Syslog-CEF |
Syslog |
Designed for processing events in the CEF format. |
Cisco WLC |
[OOTB] Cisco WLC syslog
|
regexp
|
Normalizer for some types of events received from Cisco WLC network devices (2500 Series Wireless Controllers, 5500 Series Wireless Controllers, 8500 Series Wireless Controllers, Flex 7500 Series Wireless Controllers) via Syslog. |
Cisco WSA |
[OOTB] Cisco WSA file, [OOTB] Cisco WSA syslog |
regexp |
[OOTB] Cisco WSA file is a normalizer designed for processing the event log of the Cisco WSA proxy server (versions 14.2, 15.0). The normalizer supports processing events generated using the following template: %t %e %a %w/%h %s %2r %A %H/%d %c %D %Xr %?BLOCK_SUSPECT_USER_AGENT,MONITOR_SUSPECT_USER_AGENT?%<User-Agent:%!%-%. %) %q %k %u %m [OOTB] Cisco WSA syslog is a normalizer designed for processing events received from the Cisco WSA system (version 15.0) via Syslog. |
Citrix NetScaler |
[OOTB] Citrix NetScaler syslog |
regexp |
Designed for processing events received from the Citrix NetScaler 13.7 load balancer, Citrix ADC NS13.0. |
Claroty Continuous Threat Detection |
[OOTB] Syslog-CEF |
Syslog |
Designed for processing events in the CEF format. |
CloudPassage Halo |
[OOTB] Syslog-CEF |
Syslog |
Designed for processing events in the CEF format. |
Codemaster Mirada |
[OOTB] Codemaster Mirada syslog |
Syslog |
Designed for processing events of the Codemaster Mirada system received via Syslog. |
CollabNet Subversion Edge |
[OOTB] CollabNet Subversion Edge syslog |
Syslog |
Designed for processing events received from the Subversion Edge (version 6.0.2) system via Syslog. |
CommuniGate Pro |
[OOTB] CommuniGate Pro |
regexp |
Designed to process events of the CommuniGate Pro 6.1 system sent by the KUMA agent via TCP. |
Corvil Network Analytics |
[OOTB] Syslog-CEF |
Syslog |
Designed for processing events in the CEF format. |
Cribl Stream |
[OOTB] Syslog-CEF |
Syslog |
Designed for processing events in the CEF format. |
CrowdStrike Falcon Host |
[OOTB] Syslog-CEF |
Syslog |
Designed for processing events in the CEF format. |
CyberArk Privileged Threat Analytics (PTA) |
[OOTB] Syslog-CEF |
Syslog |
Designed for processing events in the CEF format. |
CyberPeak Spektr |
[OOTB] CyberPeak Spektr syslog |
Syslog |
Designed for processing events of the CyberPeak Spektr system version 3 received via Syslog. |
Cyberprotect Cyber Backup |
[OOTB] Cyberprotect Cyber Backup SQL [OOTB] Cyberprotect Cyber Backup syslog |
sql, regexp |
[OOTB] Cyberprotect Cyber Backup SQL is a normalizer designed to process events received by the connector from the database of the Cyber Backup system (version 16.5). [OOTB] Cyberprotect Cyber Backup syslog is a normalizer designed to process events received from the Cyber Backup system (version 17.2) via Syslog in CEF format. This package is available for KUMA version 3.2 or later. |
Deep Instinct |
[OOTB] Syslog-CEF |
Syslog |
Designed for processing events in the CEF format. |
Delinea Secret Server |
[OOTB] Syslog-CEF |
Syslog |
Designed for processing events in the CEF format. |
Dell Network Switch |
[OOTB] Dell Network Switch syslog |
regexp |
Designed for processing certain types of events received from Dell network switches via Syslog. |
Digital Guardian Endpoint Threat Detection |
[OOTB] Syslog-CEF |
Syslog |
Designed for processing events in the CEF format. |
BIND DNS server |
[OOTB] BIND Syslog [OOTB] BIND file |
Syslog regexp |
[OOTB] BIND Syslog is designed for processing events of the BIND DNS server received via Syslog. [OOTB] BIND file is designed for processing event logs of the BIND DNS server. |
Docsvision |
[OOTB] Docsvision syslog |
Syslog |
Designed for processing audit events received from the Docsvision system via Syslog. |
Dovecot |
[OOTB] Dovecot Syslog |
Syslog |
Designed for processing events of the Dovecot mail server received via Syslog. The event source is POP3/IMAP logs. |
Dragos Platform |
[OOTB] Syslog-CEF |
Syslog |
Designed for processing events in the CEF format. |
Dr.Web Enterprise Security Suite |
[OOTB] Syslog-CEF |
Syslog |
Designed for processing Dr.Web Enterprise Security Suite 13.0.1 events in the CEF format. |
EclecticIQ Intelligence Center |
[OOTB] Syslog-CEF |
Syslog |
Designed for processing events in the CEF format. |
Edge Technologies AppBoard and enPortal |
[OOTB] Syslog-CEF |
Syslog |
Designed for processing events in the CEF format. |
Eltex ESR |
[OOTB] Eltex ESR syslog |
Syslog |
Designed to process part of the events received from Eltex ESR network devices via Syslog. |
Eltex MES |
[OOTB] Eltex MES syslog |
regexp |
Designed for processing events received from Eltex MES network devices via Syslog (supported device models: MES14xx, MES24xx, MES3708P). |
Eset Protect |
[OOTB] ESET Protect syslog CEF |
Syslog |
Designed for processing events received in the CEF format received from the ESET Protect system (version 11.0) via Syslog. This package is available for KUMA version 3.2 or later. |
Extreme Networks Summit Wireless Controller
|
[OOTB] Extreme Networks Summit Wireless Controller
|
regexp
|
Normalizer for certain audit events of the Extreme Networks Summit Wireless Controller (model: WM3700, firmware version: 5.5.5.0-018R). |
Factor-TS Dionis NX |
[OOTB] Factor-TS Dionis NX syslog |
regexp |
Designed for processing some audit events received from the Dionis-NX system (version 2.0.3) via Syslog. |
F5 Advanced Web Application Firewall |
[OOTB] F5 Advanced Web Application Firewall syslog |
regexp |
Designed for processing audit events received from the F5 Advanced Web Application Firewall system via Syslog. |
F5 BigIP Advanced Firewall Manager (AFM) |
[OOTB] Syslog-CEF |
Syslog |
Designed for processing events in the CEF format. |
FFRI FFR yarai |
[OOTB] Syslog-CEF |
Syslog |
Designed for processing events in the CEF format. |
FireEye CM Series |
[OOTB] Syslog-CEF |
Syslog |
Designed for processing events in the CEF format. |
FireEye Malware Protection System |
[OOTB] Syslog-CEF |
Syslog |
Designed for processing events in the CEF format. |
Forcepoint NGFW |
[OOTB] Syslog-CEF |
Syslog |
Designed for processing events in the CEF format. |
Forcepoint SMC |
[OOTB] Syslog-CEF |
Syslog |
Designed for processing events in the CEF format. |
Fortinet FortiAnalyzer |
[OOTB] Syslog-CEF |
Syslog |
Designed for processing events received from Fortinet FortiAnalyzer 7.0, 7.2 via Syslog in CEF format. |
Fortinet FortiGate |
[OOTB] Syslog-CEF |
regexp |
Designed for processing events received from Fortinet FortiGate 7.0, 7.2 via Syslog in CEF format. |
Fortinet FortiGate |
[OOTB] FortiGate syslog KV |
Syslog |
Designed for processing events from FortiGate firewalls (version 7.0) via Syslog. The event source is FortiGate logs in key-value format. |
Fortinet Fortimail |
[OOTB] Fortimail |
regexp |
Designed for processing events of the FortiMail email protection system. The event source is Fortimail mail system logs. |
Fortinet FortiSOAR |
[OOTB] Syslog-CEF |
Syslog |
Designed for processing events in the CEF format. |
FreeBSD |
[OOTB] FreeBSD file |
regexp |
Designed for processing events of the FreeBSD operating system (version 13.1-RELEASE) stored in a file. The normalizer can process files produced by the praudit utility. Example: praudit -xl /var/audit/AUDITFILE >> file_name.log |
FreeIPA |
[OOTB] FreeIPA |
json |
Designed for processing events from the FreeIPA system. The event source is Free IPA directory service logs. |
FreeRADIUS |
[OOTB] FreeRADIUS syslog |
Syslog |
Designed for processing events of the FreeRADIUS system received via Syslog. The normalizer supports events from FreeRADIUS version 3.0. |
GajShield Firewall |
[OOTB] GajShield Firewall syslog |
regexp |
Designed for processing part of the events received from the GajShield Firewall version GAJ_OS_Bulwark_Firmware_v4.35 via Syslog. |
Garda Monitor |
[OOTB] Garda Monitor syslog |
Syslog |
Designed for processing events of the Garda Monitor system version 3.4 received via Syslog. |
Gardatech Garda DB |
[OOTB] Gardatech GardaDB syslog |
Syslog |
Designed for processing events of the Gardatech Perimeter system version 5.3, 5.4 received via Syslog. |
Gardatech Perimeter |
[OOTB] Gardatech Perimeter syslog |
Syslog |
Designed for processing events of the Gardatech Perimeter system version 5.3 received via Syslog. |
Gigamon GigaVUE |
[OOTB] Syslog-CEF |
Syslog |
Designed for processing events in the CEF format. |
HAProxy |
[OOTB] HAProxy syslog |
Syslog |
Designed for processing logs of the HAProxy system. The normalizer supports events of the HTTP log, TCP log, Error log type from HAProxy version 2.8. |
HashiCorp Vault |
[OOTB] HashiCorp Vault json |
json |
Designed for processing events received from the HashiCorp Vault system version 1.16 in JSON format. The normalizer package is available in KUMA 3.0 and later. |
Huawei Eudemon |
[OOTB] Huawei Eudemon |
regexp |
Designed for processing events from Huawei Eudemon firewalls. The event source is logs of Huawei Eudemon firewalls. |
Huawei iManager 2000 |
[OOTB] Huawei iManager 2000 file
|
regexp
|
This normalizer supports processing some of the events of the Huawei iManager 2000 system, which are stored in the \client\logs\rpc, \client\logs\deploy\ossDeployment files.
|
Huawei USG |
[OOTB] Huawei USG Basic |
Syslog |
Designed for processing events received from Huawei USG security gateways via Syslog. |
Huawei VRP |
[OOTB] Huawei VRP syslog |
regexp |
Designed for processing some types of Huawei VRP system events received via Syslog. The normalizer makes a partial selection of event data. The normalizer is available in KUMA 3.0 and later. |
IBM InfoSphere Guardium |
[OOTB] Syslog-CEF |
Syslog |
Designed for processing events in the CEF format. |
Ideco UTM |
[OOTB] Ideco UTM Syslog |
Syslog |
Designed for processing events received from Ideco UTM via Syslog. The normalizer supports events of Ideco UTM 14.7, 14.10, 17.5. |
Illumio Policy Compute Engine (PCE) |
[OOTB] Syslog-CEF |
Syslog |
Designed for processing events in the CEF format. |
Imperva Incapsula |
[OOTB] Syslog-CEF |
Syslog |
Designed for processing events in the CEF format. |
Imperva SecureSphere |
[OOTB] Syslog-CEF |
Syslog |
Designed for processing events in the CEF format. |
Indeed Access Manager |
[OOTB] Indeed Access Manager syslog |
Syslog |
Designed for processing events received from the Indeed Access Manager system via Syslog. |
Indeed PAM |
[OOTB] Indeed PAM syslog |
Syslog |
Designed for processing events of Indeed PAM (Privileged Access Manager) version 2.6. |
Indeed SSO |
[OOTB] Indeed SSO xml |
xml |
Designed for processing events of the Indeed SSO (Single Sign-On) system. The normalizer supports KUMA 2.1.3 and later. |
InfoWatch Person Monitor |
[OOTB] InfoWatch Person Monitor SQL |
sql |
Designed for processing system audit events from the MS SQL database of InfoWatch Person Monitor 10.2. |
InfoWatch Traffic Monitor |
[OOTB] InfoWatch Traffic Monitor SQL |
sql |
Designed for processing events received by the connector from the database of the InfoWatch Traffic Monitor system. |
Intralinks VIA |
[OOTB] Syslog-CEF |
Syslog |
Designed for processing events in the CEF format. |
IPFIX |
[OOTB] IPFIX |
ipfix |
Designed for processing events in the IP Flow Information Export (IPFIX) format. |
Juniper JUNOS |
[OOTB] Juniper-JUNOS |
regexp |
Normalizer for Juniper-JUNOS (version 24.2) events received via Syslog. |
Kaspersky Anti Targeted Attack (KATA) |
[OOTB] KATA |
cef |
Designed for processing alerts or events from the Kaspersky Anti Targeted Attack activity log. |
Kaspersky CyberTrace |
[OOTB] CyberTrace |
regexp |
Designed for processing Kaspersky CyberTrace events. |
Kaspersky DFI |
[OOTB] Kaspersky DFI json |
json |
Designed for processing audit events of the Kaspersky DFI system in JSON format. The normalizer supports the processing of events generated by the "dfi" KUMA connector. Available in the resource set for KUMA 4.0. |
Kaspersky Endpoint Detection and Response (KEDR) |
[OOTB] KEDR telemetry |
json |
Designed for processing Kaspersky EDR telemetry tagged by KATA. The event source is kafka, EnrichedEventTopic. |
Kaspersky Endpoint Security for Linux |
[OOTB] KESL syslog cef |
Syslog |
Designed for processing events from Kaspersky Endpoint Security for Linux (KESL) 12.2 in CEF format via Syslog. |
KICS/KATA |
[OOTB] KICS4Net v2.x |
cef |
Designed for processing KICS/KATA version 2.x events. |
KICS/KATA |
[OOTB] KICS4Net v3.x |
Syslog |
Designed for processing KICS/KATA version 3.x events. |
KICS/KATA 4.2 |
[OOTB] Kaspersky Industrial CyberSecurity for Networks 4.2 syslog |
Syslog |
Designed for processing events received from the KICS/KATA 4.2 system via Syslog. |
KISG |
[OOTB] Kaspersky KISG syslog |
Syslog |
Designed for processing events received from Kaspersky IoT Secure Gateway (KISG) 3.0 via Syslog. |
Kaspersky NDR |
[OOTB] Kaspersky NDR syslog |
Syslog |
This normalizer is designed for processing events received from the Kaspersky NDR 7.0 system via Syslog. This package is available for KUMA version 3.2 or later. |
Kaspersky Security Center |
[OOTB] KSC |
cef |
Designed for processing Kaspersky Security Center events received in CEF format. |
Kaspersky Security Center |
[OOTB] KSC from SQL |
sql |
Designed for processing events received by the connector from the database of the Kaspersky Security Center system. |
Kaspersky Security for Linux Mail Server (KLMS) |
[OOTB] KLMS Syslog CEF |
Syslog |
Designed for processing events from Kaspersky Security for Linux Mail Server in CEF format via Syslog. |
Kaspersky Security for MS Exchange SQL |
[OOTB] Kaspersky Security for MS Exchange SQL |
sql |
Normalizer for Kaspersky Security for Exchange (KSE) 9.0 events stored in the database. |
Kaspersky Secure Mail Gateway (KSMG) |
[OOTB] KSMG syslog CEF [OOTB] KSMG 2.1+ syslog CEF |
Syslog |
[OOTB] KSMG syslog CEF is a normalizer for processing KSMG 2.0 events received in CEF format via Syslog. [OOTB] KSMG 2.1+ syslog CEF is a normalizer for processing KSMG 2.1.1 events received in CEF format via Syslog. |
Kaspersky Web Traffic Security (KWTS) |
[OOTB] KWTS Syslog CEF |
Syslog |
Designed for processing events received from Kaspersky Web Traffic Security in CEF format via Syslog. |
Kaspersky Web Traffic Security (KWTS) |
[OOTB] KWTS (KV) |
Syslog |
Designed for processing events in Kaspersky Web Traffic Security for Key-Value format. |
Kemptechnologies LoadMaster |
[OOTB] Syslog-CEF |
Syslog |
Designed for processing events in the CEF format. |
Kerio Control |
[OOTB] Kerio Control |
Syslog |
Designed for processing events of Kerio Control firewalls. |
KUMA |
[OOTB] KUMA forwarding |
json |
Designed for processing events forwarded from KUMA. |
LastLine Enterprise |
[OOTB] LastLine Enterprise syslog cef |
Syslog |
Designed for processing events received from LastLine Enterprise 7.3, 8.1, 9.1 via Syslog in CEF format. |
Libvirt |
[OOTB] Libvirt syslog |
Syslog |
Designed for processing events of Libvirt version 8.0.0 received via Syslog. |
Lieberman Software ERPM |
[OOTB] Syslog-CEF |
Syslog |
Designed for processing events in the CEF format. |
Linux |
[OOTB] Linux audit and iptables Syslog v1 |
Syslog |
Designed for processing events of the Linux operating system. This normalizer does not support processing events in the ENRICHED format. |
Linux auditd |
[OOTB] Linux auditd syslog for KUMA 3.2 |
Syslog |
Designed for processing audit events (auditd package) of the Linux operating system received via Syslog. The normalizer supports events that have been processed by a KUMA collector version 3.2 or later. |
Linux auditd |
[OOTB] Linux auditd file for KUMA 3.2 |
regexp |
Designed for processing audit events (auditd package) of the Linux operating system saved to a file. The normalizer supports events that have been processed by a KUMA collector version 3.2 or later. |
MariaDB |
[OOTB] MariaDB Audit Plugin Syslog |
Syslog |
Designed for processing events coming from the MariaDB audit plugin over Syslog. |
McAfee Endpoint DLP |
[OOTB] McAfee Endpoint DLP syslog |
Syslog |
Designed for processing events received from McAfee Endpoint DLP Windows 11.10.200 via Syslog. This package is available for KUMA version 3.2 or later. |
Microsoft Active Directory Federation Service (AD FS) |
[OOTB] Microsoft Products for KUMA 3 |
xml |
Designed for processing Microsoft AD FS events. The [OOTB] Microsoft Products for KUMA 3 normalizer supports this event source in KUMA 3.0.1 and later versions. |
Microsoft Active Directory Domain Service (AD DS) |
[OOTB] Microsoft Products for KUMA 3 |
xml |
Designed for processing Microsoft AD DS events. The [OOTB] Microsoft Products for KUMA 3 normalizer supports this event source in KUMA 3.0.1 and later versions. |
Microsoft Defender |
[OOTB] Microsoft Products, [OOTB] Microsoft Products for KUMA 3, [OOTB] Microsoft Products via KES WIN |
xml |
Designed for processing Microsoft Defender events. |
Microsoft DHCP |
[OOTB] MS DHCP file |
regexp |
Designed for processing Microsoft DHCP server events. The event source is Windows DHCP server logs. |
Microsoft DNS |
[OOTB] DNS Windows [OOTB] Microsoft DNS ETW logs json |
regexp |
The [OOTB] Windows DNS normalizer is designed to process Microsoft DNS server events. The event source is Windows DNS server logs. The normalizer does not support processing debug log events with the Details option enabled. The [OOTB] Microsoft DNS ETW logs json normalizer is designed to process some Microsoft DNS Server audit events supplied by the ETW provider. This package is available for KUMA version 3.2 or later. |
Microsoft Exchange |
[OOTB] Exchange CSV |
csv |
Designed for processing the event log of the Microsoft Exchange system. The event source is Exchange server MTA logs. |
Microsoft Hyper-V |
[OOTB] Microsoft Products, [OOTB] Microsoft Products for KUMA 3, [OOTB] Microsoft Products via KES WIN |
xml |
Designed for processing Microsoft Windows events. The event source is Microsoft Hyper-V logs: Microsoft-Windows-Hyper-V-VMMS-Admin, Microsoft-Windows-Hyper-V-Compute-Operational, Microsoft-Windows-Hyper-V-Hypervisor-Operational, Microsoft-Windows-Hyper-V-StorageVSP-Admin, Microsoft-Windows-Hyper-V-Hypervisor-Admin, Microsoft-Windows-Hyper-V-VMMS-Operational, Microsoft-Windows-Hyper-V-Compute-Admin. |
Microsoft IIS |
[OOTB] IIS Log File Format |
regexp |
The normalizer processes events in the format described at https://learn.microsoft.com/en-us/windows/win32/http/iis-logging. The event source is Microsoft IIS logs. |
Microsoft Network Policy Server (NPS) |
[OOTB] Microsoft Products, [OOTB] Microsoft Products for KUMA 3, [OOTB] Microsoft Products via KES WIN |
xml |
The normalizer is designed for processing events of the Microsoft Windows operating system. The event source is Network Policy Server events. |
Microsoft Office 365 |
[OOTB] Microsoft Office 365 json |
json |
Normalizer for processing some types of Microsoft Office 365 audit events. This normalizer supports processing some types of audit events received from Microsoft Teams, Azure Active Directory, SharePoint systems. This package is available for KUMA version 3.4 or later. |
Microsoft SCCM |
[OOTB] Microsoft SCCM file |
regexp |
Designed for processing events of the Microsoft SCCM system version 2309. The normalizer supports processing of some of the events stored in the AdminService.log file. |
Microsoft SharePoint Server |
[OOTB] Microsoft SharePoint Server diagnostic log file |
regexp |
The normalizer supports processing part of Microsoft SharePoint Server 2016 events stored in diagnostic logs. |
Microsoft Sysmon |
[OOTB] Microsoft Products, [OOTB] Microsoft Products for KUMA 3, [OOTB] Microsoft Products via KES WIN |
xml |
This normalizer is designed for processing Microsoft Sysmon module events. |
Microsoft Windows 7, 8.1, 10, 11 |
[OOTB] Microsoft Products, [OOTB] Microsoft Products for KUMA 3, [OOTB] Microsoft Products via KES WIN |
xml |
Designed for processing part of events from the Security, System, Application logs of the Microsoft Windows operating system. The "[OOTB] Microsoft Products via KES WIN" normalizer supports a limited number of audit event types sent to KUMA by Kaspersky Endpoint Security 12.6 for Windows via Syslog. |
Microsoft → Windows → DNS-Server → Audit |
[OOTB] Microsoft Products for KUMA 3 |
xml |
Designed for processing Microsoft → Windows → DNS-Server → Audit log events in XML format. |
Microsoft → Windows → PowerShell |
[OOTB] Microsoft Products, [OOTB] Microsoft Products for KUMA 3, [OOTB] Microsoft Products via KES WIN |
xml |
Designed for processing Microsoft Windows PowerShell log events. |
Microsoft → Windows → PowerShell-Operational |
[OOTB] Microsoft Products for KUMA 3, [OOTB] Microsoft Products via KES WIN |
xml |
Designed for processing Microsoft Windows PowerShell-Operational log events. The "[OOTB] Microsoft Products via KES WIN" normalizer supports a limited number of audit event types sent to KUMA by Kaspersky Endpoint Security 12.6 for Windows via Syslog. |
Microsoft SQL Server |
[Deprecated][OOTB] Microsoft SQL Server xml |
xml |
Designed for processing events of MS SQL Server versions 2008, 2012, 2014, 2016. The normalizer supports KUMA 2.1.3 and later. |
Microsoft SQL Server, Microsoft SQL Server Express |
[OOTB] Microsoft Products for KUMA 3 |
xml |
Designed to process events of MS SQL Server 2008 or newer. |
Microsoft Windows Remote Desktop Services |
[OOTB] Microsoft Products, [OOTB] Microsoft Products for KUMA 3, [OOTB] Microsoft Products via KES WIN |
xml |
Designed for processing Microsoft Windows events. Event source → Applications and Services Logs → Microsoft → Windows → TerminalServices-LocalSessionManager → Operational log The "[OOTB] Microsoft Products via KES WIN" normalizer supports a limited number of audit event types sent to KUMA by Kaspersky Endpoint Security 12.6 for Windows via Syslog. |
Microsoft Windows Service Control Manager |
[OOTB] Microsoft Products for KUMA 3 [OOTB] Microsoft Products via KES WIN |
xml |
This normalizer is designed for processing events from the Service Control Manager logs (System log) of the Microsoft Windows operating system. |
Microsoft Windows Server 2008 R2, 2012 R2, 2016, 2019, 2022 |
[OOTB] Microsoft Products, [OOTB] Microsoft Products for KUMA 3, [OOTB] Microsoft Products via KES WIN |
xml |
Designed for processing part of events from the Security, System logs of the Microsoft Windows Server operating system. The "[OOTB] Microsoft Products via KES WIN" normalizer supports a limited number of audit event types sent to KUMA by Kaspersky Endpoint Security 12.6 for Windows via Syslog. |
Microsoft Windows XP/2003 |
[OOTB] SNMP. Windows {XP/2003} |
json |
Designed for processing events received from workstations and servers running Microsoft Windows XP, Microsoft Windows 2003 operating systems using the SNMP protocol. |
Microsoft WSUS |
[OOTB] Microsoft WSUS file |
regexp |
Designed for processing events of the Gardatech Perimeter system version 5.3, 5.4 received via Syslog. |
MikroTik |
[OOTB] MikroTik syslog |
regexp |
Designed for events received from MikroTik devices via Syslog. |
Minerva Labs Minerva EDR |
[OOTB] Minerva EDR |
regexp |
Designed for processing events from the Minerva EDR system. |
MongoDB |
[OOTB] MongoDb syslog |
Syslog |
Designed for processing some events received from the MongoDB 7.0 database via Syslog. |
Multifactor Radius Server for Windows |
[OOTB] Multifactor Radius Server for Windows syslog |
Syslog |
Designed for processing events received from the Multifactor Radius Server 1.0.2 for Microsoft Windows via Syslog. |
MySQL 5.7 |
[OOTB] MariaDB Audit Plugin Syslog |
Syslog |
Designed for processing events coming from the MariaDB audit plugin over Syslog. |
NetApp ONTAP (AFF, FAM) |
[OOTB] NetApp syslog, [OOTB] NetApp file |
regexp |
[OOTB] NetApp syslog is a normalizer designed for processing events of the NetApp system (ONTAP 9.12 version) received via Syslog. [OOTB] NetApp file is a normalizer designed for processing events of the NetApp system (ONTAP 9.12 version) stored in a file. |
NetApp SnapCenter |
[OOTB] NetApp SnapCenter file |
regexp |
Designed to process part of the events of the NetApp SnapCenter system (SnapCenter Server 5.0). The normalizer supports processing some of the events from the C:\Program Files\NetApp\SnapCenter WebApp\App_Data\log\napManagerWeb.*.log file. Types of supported events in xml format from the SnapManagerWeb.*.log file: SmDiscoverPluginRequest, SmDiscoverPluginResponse, SmGetDomainsResponse, SmGetHostPluginStatusRequest, SmGetHostPluginStatusResponse, SmGetHostRequest, SmGetHostResponse, SmRequest. The normalizer supports processing some of the events from the C:\Program Files\NetApp\SnapCenter WebApp\App_Data\log\audit.log file. |
NetIQ Identity Manager |
[OOTB] Syslog-CEF |
Syslog |
Designed for processing events in the CEF format. |
NetScout Systems nGenius Performance Manager |
[OOTB] Syslog-CEF |
Syslog |
Designed for processing events in the CEF format. |
Netskope Cloud Access Security Broker |
[OOTB] Syslog-CEF |
Syslog |
Designed for processing events in the CEF format. |
Netwrix Auditor |
[OOTB] Syslog-CEF |
Syslog |
Designed for processing events in the CEF format. |
Netwrix Endpoint Protector |
[OOTB] Netwrix Endpoint Protector syslog |
regexp |
Designed for processing events received from the Netwrix Endpoint Protector 5.9 system via Syslog. This package is available for KUMA version 3.2 or later. |
Nextcloud |
[OOTB] Nextcloud syslog |
Syslog |
Designed for events of Nextcloud version 26.0.4 received via Syslog. The normalizer does not save information from the Trace field. |
Nexthink Engine |
[OOTB] Syslog-CEF |
Syslog |
Designed for processing events in the CEF format. |
Nginx |
[OOTB] Nginx regexp |
regexp |
Designed for processing the event log of the Nginx web server in the Combined format. The normalizer supports the processing of events received via Syslog and stored in a file. This package is available for KUMA version 3.2 or later. |
NIKSUN NetDetector |
[OOTB] Syslog-CEF |
Syslog |
Designed for processing events in the CEF format. |
One Identity Privileged Session Management |
[OOTB] Syslog-CEF |
Syslog |
Designed for processing events in the CEF format. |
OpenLDAP |
[OOTB] OpenLDAP |
regexp |
Designed for line-by-line processing of some events of the OpenLDAP 2.5 system in an auditlog.ldif file. |
Open VPN |
[OOTB] OpenVPN file |
regexp |
Designed for processing the event log of the OpenVPN system. |
Oracle |
[OOTB] Oracle Audit Trail |
sql |
Designed for processing database audit events received by the connector directly from an Oracle database. |
OrionSoft Termit |
[OOTB] OrionSoft Termit syslog |
Syslog |
Designed for processing events received from the OrionSoft Termit 2.2 system via Syslog. |
Orion soft zVirt |
[OOTB] Orion Soft zVirt syslog |
regexp |
Designed for processing events of the Orion soft zVirt 3.1 virtualization system. |
PagerDuty |
[OOTB] Syslog-CEF |
Syslog |
Designed for processing events in the CEF format. |
Palo Alto Cortex Data Lake |
[OOTB] Syslog-CEF |
Syslog |
Designed for processing events in the CEF format. |
Palo Alto Networks NGFW |
[OOTB] PA-NGFW (Syslog-CSV) |
Syslog |
Designed for processing events from Palo Alto Networks firewalls received via Syslog in CSV format. |
Palo Alto Networks PANOS |
[OOTB] Syslog-CEF |
Syslog |
Designed for processing events in the CEF format. |
Parsec ParsecNet |
[OOTB] Parsec ParsecNet |
sql |
Designed for processing events received by the connector from the database of the Parsec ParsecNet 3 system. |
Passwork |
[OOTB] Passwork syslog |
Syslog |
Designed for processing events received from the Passwork version 050219 system via Syslog. |
Penta Security WAPPLES |
[OOTB] Syslog-CEF |
Syslog |
Designed for processing events in the CEF format. |
Positive Technologies ISIM |
[OOTB] PTsecurity ISIM |
regexp |
Designed for processing events from the PT Industrial Security Incident Manager system. |
Positive Technologies Network Attack Discovery (NAD) |
[OOTB] PT NAD json |
json |
Designed for processing events coming from PT NAD in json format. This normalizer supports events from PT NAD version 11.1, 11.0. |
Positive Technologies Sandbox |
[OOTB] PTsecurity Sandbox |
regexp |
Designed for processing events of the PT Sandbox system. |
Positive Technologies Web Application Firewall |
[OOTB] PTsecurity WAF |
Syslog |
Designed for processing events from the PTsecurity (Web Application Firewall) system. |
Postfix |
[OOTB] Postfix syslog |
regexp |
The [OOTB] Postfix package contains a resource set for processing Postfix 3.6 events. It supports processing Syslog events received over TCP. The package is available for KUMA 3.0 and newer versions. |
PostgreSQL pgAudit |
[OOTB] PostgreSQL pgAudit Syslog |
Syslog |
Designed for processing events of the pgAudit audit plug-n for PostgreSQL database received via Syslog. |
PowerDNS |
[OOTB] PowerDNS syslog |
Syslog |
Designed for processing events of PowerDNS Authoritative Server 4.5 received via Syslog. |
Proftpd |
[OOTB] Proftpd syslog |
regexp |
Designed for processing events received from Proftpd 1.3.8c via Syslog. |
Proofpoint Insider Threat Management |
[OOTB] Syslog-CEF |
Syslog |
Designed for processing events in the CEF format. |
Proxmox |
[OOTB] Proxmox file |
regexp |
Designed for processing events of the Proxmox system version 7.2-3 stored in a file. The normalizer supports processing of events in access and pveam logs. |
PT NAD |
[OOTB] PT NAD json |
json |
Designed for processing events coming from PT NAD in json format. This normalizer supports events from PT NAD version 11.1, 11.0. |
QEMU - hypervisor logs |
[OOTB] QEMU - Hypervisor file |
regexp |
Designed for processing events of the QEMU hypervisor stored in a file. QEMU 6.2.0 and Libvirt 8.0.0 are supported. |
QEMU - virtual machine logs |
[OOTB] QEMU - Virtual Machine file |
regexp |
Designed for processing events from logs of virtual machines of the QEMU hypervisor version 6.2.0, stored in a file. |
Radware DefensePro AntiDDoS |
[OOTB] Radware DefensePro AntiDDoS |
Syslog |
Designed for processing events from the DDOS Mitigator protection system received via Syslog. |
Reak Soft Blitz Identity Provider |
[OOTB] Reak Soft Blitz Identity Provider file |
regexp |
Designed for processing events of the Reak Soft Blitz Identity Provider system version 5.16, stored in a file. |
RedCheck Desktop |
[OOTB] RedCheck Desktop file |
regexp |
Designed for processing logs of the RedCheck Desktop 2.6 system stored in a file. |
RedCheck WEB |
[OOTB] RedCheck WEB file |
regexp |
Designed for processing logs of the RedCheck Web 2.6 system stored in files. |
RED SOFT RED ADM |
[OOTB] RED SOFT RED ADM syslog |
regexp |
Designed for processing events received from the RED ADM system (RED ADM: Industrial edition 1.1) via Syslog. The normalizer supports processing:
|
ReversingLabs N1000 Appliance |
[OOTB] Syslog-CEF |
Syslog |
Designed for processing events in the CEF format. |
Rubicon Communications pfSense |
[OOTB] pfSense Syslog |
Syslog |
Designed for processing events from the pfSense firewall received via Syslog. |
Rubicon Communications pfSense |
[OOTB] pfSense w/o hostname |
Syslog |
Designed for processing events from the pfSense firewall. The Syslog header of these events does not contain a hostname. |
SailPoint IdentityIQ |
[OOTB] Syslog-CEF |
Syslog |
Designed for processing events in the CEF format. |
SecurityCode Continent 3.9 |
[OOTB] SecurityCode Continent 3.9 json |
json |
Normalizer for SecurityCode Continent 3.9.2 events received from the kuma-kont utility in json format. This package is available for KUMA version 3.4 or later. |
SecurityCode Continent 4 |
[OOTB] SecurityCode Continent 4 syslog |
regexp |
Designed for processing events of the SecurityCode Continent system version 4 received via Syslog. |
Sendmail |
[OOTB] Sendmail syslog |
Syslog |
Designed for processing events of Sendmail version 8.15.2 received via Syslog. |
SentinelOne |
[OOTB] Syslog-CEF |
Syslog |
Designed for processing events in the CEF format. |
Skype for Business |
[OOTB] Microsoft Products for KUMA 3 |
xml |
Designed for processing some of the events from the log of the Skype for Business system, the Lync Server log. |
Snort |
[OOTB] Snort 3 json file |
json |
Designed for processing events of Snort version 3 in JSON format. |
Sophos Central |
[OOTB] Sophos Central syslog |
Syslog |
Designed for processing some events received from Sophos Central 1.2 via Syslog in CEF format from the Sophos-Central-SIEM-Integration script. |
Sonicwall TZ |
[OOTB] Sonicwall TZ Firewall |
Syslog |
Designed for processing events received via Syslog from the SonicWall TZ firewall. |
Solar webProxy |
[OOTB] Solar WebProxy syslog |
regexp |
Designed for processing events received from Solar webProxy 4.2 in siem-log format via Syslog. |
SolarWinds DameWare MRC |
[OOTB] SolarWinds DameWare MRC xml |
xml
|
This normalizer supports processing some of the DameWare Mini Remote Control (MRC) 7.5 events stored in the Application log of Windows. The normalizer processes events generated by the dwmrcs provider. |
SolarWinds SFTP & SCP Server file |
[OOTB] SolarWinds SFTP & SCP Server file |
regexp |
Designed for processing the SolarWinds SFTP & SCP Server 2.2 event log stored in the SftpServer.log file. This package is available for KUMA version 3.2 or later. |
Sophos Firewall |
[OOTB] Sophos Firewall syslog |
regexp |
Designed for processing events received from Sophos Firewall 20 via Syslog. |
Sophos XG |
[OOTB] Sophos XG |
regexp |
Designed for processing events from the Sophos XG firewall. |
Squid |
[OOTB] Squid access Syslog |
Syslog |
Designed for processing events of the Squid proxy server received via the Syslog protocol. |
Squid |
[OOTB] Squid access.log file |
regexp |
Designed for processing Squid log events from the Squid proxy server. The event source is access.log logs |
Staffcop Enterprise |
[OOTB] Staffcop Enterprise syslog CEF |
regexp |
Designed for processing events received from Staffcop Enterprise 5.4, 5.5 in CEF format via Syslog. |
S-Terra VPN Gate |
[OOTB] S-Terra |
Syslog |
Designed for processing events from S-Terra VPN Gate devices. |
Suricata |
[OOTB] Suricata json file |
json |
This package contains a normalizer for Suricata 7.0.1 events stored in a JSON file. The normalizer supports processing the following event types: flow, anomaly, alert, dns, http, ssl, tls, ftp, ftp_data, ftp, smb, rdp, pgsql, modbus, quic, dhcp, bittorrent_dht, rfb. |
ThreatConnect Threat Intelligence Platform |
[OOTB] Syslog-CEF |
Syslog |
Designed for processing events in the CEF format. |
ThreatQuotient |
[OOTB] Syslog-CEF |
Syslog |
Designed for processing events in the CEF format. |
Tionix Cloud Platform |
[OOTB] Tionix Cloud Platform syslog |
Syslog |
Designed for processing events of the Tionix Cloud Platform system version 2.9 received via Syslog. The normalizer makes a partial selection of event data. The normalizer is available in KUMA 3.0 and later. |
Tionix VDI |
[OOTB] Tionix VDI file |
regexp |
This normalizer supports processing some of the Tionix VDI system (version 2.8) events stored in the tionix_lntmov.log file. |
TrapX DeceptionGrid |
[OOTB] Syslog-CEF |
Syslog |
Designed for processing events in the CEF format. |
Trend Micro Control Manager |
[OOTB] Syslog-CEF |
Syslog |
Designed for processing events in the CEF format. |
Trend Micro Deep Security |
[OOTB] Syslog-CEF |
Syslog |
Designed for processing events in the CEF format. |
Trend Micro NGFW |
[OOTB] Syslog-CEF |
Syslog |
Designed for processing events in the CEF format. |
Trustwave Application Security DbProtect |
[OOTB] Syslog-CEF |
Syslog |
Designed for processing events in the CEF format. |
Unbound |
[OOTB] Unbound Syslog |
Syslog |
Designed for processing events from the Unbound DNS server received via Syslog. |
UserGate |
[OOTB] Syslog-CEF |
Syslog |
Designed for processing events in the CEF format received from the UserGate system via Syslog. |
Varonis DatAdvantage |
[OOTB] Syslog-CEF |
Syslog |
Designed for processing events in the CEF format. |
Veriato 360 |
[OOTB] Syslog-CEF |
Syslog |
Designed for processing events in the CEF format. |
ViPNet TIAS |
[OOTB] Vipnet TIAS syslog |
Syslog |
Designed for processing events of ViPNet TIAS 3.8 received via Syslog. |
VK WorkSpace Mail |
[OOTB] VK WorkSpace Mail syslog |
Syslog |
Normalizer for processing events received from the VK WorkSpace Mail 1.23 system via Syslog in key-value format. |
VMware ESXi |
[OOTB] VMware ESXi syslog |
regexp |
Designed for processing VMware ESXi events (support for a limited number of events from ESXi versions 5.5, 6.0, 6.5, 7.0) received via Syslog. |
VMWare Horizon |
[OOTB] VMware Horizon - Syslog |
Syslog |
Designed for processing events received from the VMware Horizon 2106 system via Syslog. |
VMwareCarbon Black EDR |
[OOTB] Syslog-CEF |
Syslog |
Designed for processing events in the CEF format. |
Vmware Vcenter |
[OOTB] VMware Vcenter API |
xml |
Designed for processing VMware Vcenter 7 events received via API. |
Vormetric Data Security Manager |
[OOTB] Syslog-CEF |
Syslog |
Designed for processing events in the CEF format. |
Votiro Disarmer for Windows |
[OOTB] Syslog-CEF |
Syslog |
Designed for processing events in the CEF format. |
Vsftpd |
[OOTB] Vsftpd syslog |
regexp |
Designed for processing events received from Vsftpd 3.0.5 via Syslog. |
Wallix AdminBastion |
[OOTB] Wallix AdminBastion syslog |
regexp |
Designed for processing events received from the Wallix AdminBastion system via Syslog. |
WatchGuard - Firebox |
[OOTB] WatchGuard Firebox |
Syslog |
Designed for processing WatchGuard Firebox events received via Syslog. |
Webroot BrightCloud |
[OOTB] Syslog-CEF |
Syslog |
Designed for processing events in the CEF format. |
Windchill FRACAS |
[OOTB] PTC Winchill Fracas |
regexp |
Designed for processing events of the Windchill FRACAS failure registration system. |
Yandex Browser corporate |
[OOTB] Yandex Browser |
json |
Designed for processing events received from the corporate version of Yandex Browser 23, 24.4, 25.2. |
Yandex Cloud |
[OOTB] Yandex Cloud |
regexp |
Designed for processing part of Yandex Cloud audit events. The normalizer supports processing audit log events of the configuration level: IAM (Yandex Identity and Access Management), Compute (Yandex Compute Cloud), Network (Yandex Virtual Private Cloud), Storage (Yandex Object Storage), Resourcemanager (Yandex Resource Manager). |
Zabbix |
[OOTB] Zabbix SQL |
sql |
Designed for processing events of Zabbix 6.4. |
Zecurion DLP |
[OOTB] Zecurion DLP syslog |
regexp |
Designed for processing events of the Zecurion DLP system version 12.0 received via Syslog. |
ZEEK IDS |
[OOTB] ZEEK IDS json file |
json |
Designed for processing logs of the ZEEK IDS system in JSON format. The normalizer supports events from ZEEK IDS version 1.8. |
Zettaset BDEncrypt |
[OOTB] Syslog-CEF |
Syslog |
Designed for processing events in the CEF format. |
Zscaler Nanolog Streaming Service (NSS) |
[OOTB] Syslog-CEF |
Syslog |
Designed for processing events in the CEF format. |
IT-Bastion – SKDPU |
[OOTB] Syslog-CEF |
Syslog |
Designed for processing events in the CEF format received from the IT-Bastion SKDPU system via Syslog. |
A-Real Internet Control Server (ICS) |
[OOTB] A-real IKS syslog |
regexp |
Designed for processing events of the A-Real Internet Control Server (ICS) system received via Syslog. The normalizer supports events from A-Real ICS version 7.0 and later. |
Apache web server |
[OOTB] Apache HTTP Server file |
regexp |
Designed for processing Apache HTTP Server 2.4 events stored in a file. The normalizer supports processing of events from the Application log in the Common or Combined Log formats, as well as the Error log. Expected format of the Error log events:
|
Apache web server |
[OOTB] Apache HTTP Server syslog |
Syslog |
Designed for processing events of the Apache HTTP Server received via Syslog. The normalizer supports processing of Apache HTTP Server 2.4 events from the Access log in the Common or Combined Log format, as well as the Error log. Expected format of the Error log events:
|
Lighttpd web server |
[OOTB] Lighttpd syslog |
Syslog |
Designed for processing Access events of the Lighttpd system received via Syslog. The normalizer supports processing of Lighttpd version 1.4 events. Expected format of Access log events:
|
IVK Kolchuga-K |
[OOTB] Kolchuga-K Syslog |
Syslog |
Designed for processing events from the IVK Kolchuga-K system, version LKNV.466217.002, via Syslog. |
infotecs ViPNet IDS |
[OOTB] Syslog-CEF |
Syslog |
Designed for processing events in the CEF format received from the infotecs ViPNet IDS system via Syslog. |
infotecs ViPNet Coordinator |
[OOTB] VipNet Coordinator Syslog |
Syslog |
Designed for processing events from the ViPNet Coordinator system received via Syslog. |
Kod Bezopasnosti — Continent |
[OOTB][regexp] Continent IPS/IDS & TLS |
regexp |
Designed for processing events of Continent IPS/IDS device log. |
Kod Bezopasnosti — Continent |
[OOTB] Continent SQL |
sql |
Designed for getting events of the Continent system from the database. |
Kod Bezopasnosti SecretNet 7 |
[OOTB] SecretNet SQL |
sql |
Designed for processing events received by the connector from the database of the SecretNet system. |
Confident – Dallas Lock Unified Control Center |
[OOTB] Confident Dallas Lock syslog CEF |
regexp |
Designed for processing events received from Dallas Lock Unified Control Center 4.0 in CEF format. |
CryptoPro NGate |
[OOTB] Ngate Syslog |
Syslog |
Designed for processing events received from the CryptoPro NGate system via Syslog. |
H3C (Huawei-3Com) routers
|
[OOTB] H3C Routers syslog
|
regexp
|
Normalizer for some types of events received from H3C (Huawei-3Com) SR6600 network devices (Comware 7 firmware) via Syslog. The normalizer supports the "standard" event format (RFC 3164-compliant format). |
NT Monitoring and Analytics |
[OOTB] Syslog-CEF |
Syslog |
Designed for processing events in the CEF format received from the NT Monitoring and Analytics system via Syslog. |
BlueCoat proxy server |
[OOTB] BlueCoat Proxy v0.2 |
regexp |
Designed to process BlueCoat proxy server events. The event source is the BlueCoat proxy server event log. |
SKDPU NT Access Gateway |
[OOTB] Bastion SKDPU-GW syslog |
Syslog |
Normalizer for processing events of the SKDPU NT Access gateway 7.0 system received via Syslog. |
Solar Dozor |
[OOTB] Solar Dozor Syslog |
Syslog |
Designed for processing events received from the Solar Dozor system version 7.9 via Syslog. The normalizer supports custom format events and does not support CEF format events. |
- |
[OOTB] Syslog header |
Syslog |
Designed for processing events received via Syslog. The normalizer parses the header of the Syslog event, the message field of the event is not parsed. If necessary, you can parse the message field using other normalizers. |
Aggregation rules
Aggregation rules let you combine repetitive events of the same type and replace them with one common event. Aggregation rules support fields of the standard KUMA event schema as well as fields of the extended event schema. In this way, you can reduce the number of similar events sent to the storage and/or the correlator, reduce the workload on services, conserve data storage space and licensing quota (EPS). An aggregation event is created when a time or number of events threshold is reached, whichever occurs first.
For aggregation rules, you can configure a filter and apply it only to events that match the specified conditions.
You can configure aggregation rules under Resources → Aggregation rules, and then select the created aggregation rule from the drop-down list in the collector settings. You can also configure aggregation rules directly in collector settings. Available aggregation rule settings are listed in the table below.
Available aggregation rule settings
Setting |
Description |
||
|---|---|---|---|
Name |
Unique name of the resource. Maximum length of the name: 128 Unicode characters. Required setting. |
||
Tenant |
The name of the tenant that owns the resource. Required setting. |
||
Threshold |
Threshold on the number of events. After accumulating the specified number of events with identical fields, the collector creates an aggregation event and begins accumulating events for the next aggregated event. The default value is |
||
Triggered rule lifetime |
Threshold on time in seconds. When the specified time expires, the accumulation of base events stops, the collector creates an aggregated event and starts obtaining events for the next aggregated event. The default value is Required setting. |
||
Description |
Description of the resource. Maximum length of the description: 4000 Unicode characters. |
||
Identical fields |
Fields of normalized events whose values must match. For example, for network events, Required setting. |
||
Unique fields |
Normalized event fields whose values must be unique for those events to be considered in an aggregated event. If the value of a field specified under Unique Fields is duplicated in multiple events, only one of such events is included in the aggregated event, and the duplicates are ignored. If you specify more than one field under Unique Fields, the combinations of values of all of these fields must be unique. Unique fields are not saved in the aggregated event. |
||
Sum fields |
Fields whose values are summed up during aggregation and written to the same-name fields of the aggregated event. The following special considerations are relevant to field behavior:
|
||
Filter |
Conditions for determining which events must be processed by the resource. In the drop-down list, you can select an existing filter Create new to create a new filter. In aggregation rules, do not use filters with the TI operand or the TIDetect, inActiveDirectoryGroup, or hasVulnerability operators. The Creating a filter in resources To create a filter:
|
||
The KUMA distribution kit includes aggregation rules listed in the table below.
Predefined aggregation rules
Aggregation rule name |
Description |
[OOTB] Netflow 9 |
The rule is triggered after 100 events or 10 seconds. Events are aggregated by the following fields:
The |
Enrichment rules
Event enrichment involves adding information to events that can be used to identify and investigate an incident.
Enrichment rules let you add supplementary information to event fields by transforming data that is already present in the fields, or by querying data from external systems. For example, suppose that a user name is recorded in the event. You can use an enrichment rule to add information about the department, position, and manager of this user to the event fields.
Enrichment rules can be used in the following KUMA services and features:
- Collector. In the collector, you can create an enrichment rule, and it becomes a resource that you can reuse in other services. You can also link an enrichment rule created as a standalone resource.
- Correlator. In the correlator, you can create an enrichment rule, and it becomes a resource that you can reuse in other services. You can also link an enrichment rule created as a standalone resource.
- Normalizer. In the normalizer, you can only create an enrichment rule linked to that normalizer. Such a rule will not be available as a standalone resource for reuse in other services.
Available enrichment rule settings are listed in the table below.
Basic settings tab
Setting |
Description |
||||||||
|---|---|---|---|---|---|---|---|---|---|
Name |
Required setting. Unique name of the resource. Must contain 1 to 128 Unicode characters. |
||||||||
Tenant |
Required setting. The name of the tenant that owns the resource. |
||||||||
Source kind |
Required setting. Drop-down list for selecting the type of incoming events. Depending on the selected type, the following additional settings will be displayed:
|
||||||||
Debug |
You can use this toggle switch to enable the logging of service operations. Logging is disabled by default. |
||||||||
Description |
Resource description: up to 4,000 Unicode characters. |
||||||||
Filter |
Group of settings in which you can specify the conditions for identifying events that must be processed by this resource. You can select an existing filter from the drop-down list or create a new filter. Creating a filter in resources To create a filter:
|
Predefined enrichment rules
The KUMA distribution kit includes enrichment rules listed in the table below.
Predefined enrichment rules
Enrichment rule name |
Description |
[OOTB] KATA alert |
Used to enrich events received from KATA in the form of a hyperlink to an alert. The hyperlink is put in the DeviceExternalId field. |
Data collection and analysis rules
Data mining rules are used for detecting incidents by analyzing events saved in the KUMA database.
In contrast to streaming correlation and retrospective scanning, data mining rules involve the preprocessing of data using SQL queries (including additional calculations, grouping and aggregation using SQL) and running regularly on a schedule. With correctly configured data mining rules, the SIEM can help you detect advanced threats.
To manage the section, you need one of the following roles: General administrator, Tenant administrator, Tier 1 analyst, Tier 2 analyst.
When creating or editing data collection and analysis rules, you need to specify the settings listed in the table below.
Settings of data collection and analysis rules
Setting |
Description |
Name |
Required setting. Unique name of the resource. Must contain 1 to 128 Unicode characters. |
Tenant |
Required setting. The name of the tenant that owns the resource. If you have access to only one tenant, this field is filled in automatically. If you have access to multiple tenants, the name of the first tenant from your list of available tenants is inserted. You can select any tenant from this list. |
Sql |
Required setting. The SQL query must contain an aggregation function with a LIMIT and/or a data grouping with a LIMIT. You must use a LIMIT value between 1 and 10,000. Examples of SQL queries
You can also use SQL function sets: |
Query interval |
Required setting. The interval for executing the SQL query. You can specify the interval in minutes, hours, and days. The minimum interval is 1 minute. The default timeout of the SQL query is equal to the interval that you specify in this field. If the execution of the SQL query takes longer than the timeout, an error occurs. In this case, we recommend increasing the interval. For example, if the interval is 1 minute, and the query takes 80 seconds to execute, we recommend setting the interval to at least 90 seconds. |
Tags |
Optional setting. Tags for resource search. |
Depth |
Optional setting. Expression for the lower bound of the interval for searching events in the database. To select a value from the list or to specify the depth as a relative interval, place the cursor in the field. For example, if you want to find all events from one hour ago to now, set the relative interval of |
Description |
Optional setting. Description of data collection and analysis rules. |
Mapping |
Settings of the mapping the fields of an SQL query result to KUMA events: Source field is the field from the SQL query result that you want to convert into a KUMA event. Event field is the KUMA event field. You can select one of the values in the list by placing the mouse cursor in this field. Label is a unique custom label for event fields that begin with DeviceCustom*. You can add new table rows or delete table rows. To add a new table row, click Add mapping. To delete a row, select the check box next to the row and click the If you do not want to fill in the fields manually, you can click the Add mapping from SQL button. The field mapping table is populated with the values of the SQL query fields, including aliases (if any). For example, if the value of an SQL query field is Clicking the Add mapping from SQL button again does not refresh the table, and fields from the SQL query are added to it again. |
You can create a data collection and analysis rule in one of the following ways:
- In the Resources → Resources and services → Data collection and analysis rules section.
- In the Events section.
To create a data collection and analysis rule in the Events section:
- Create or generate an SQL query and click the
 button.
A new browser tab for creating a data collection and analysis rule is opened in the browser with pre-filled SQL query and Depth fields. The field mapping table is also be populated automatically if you did not use an asterisk (*) in the SQL query.
- Fill in the required fields.
If necessary, you can change the value in the Query interval field.
- Save the settings.
The data collection and analysis rule is saved and is available in the Resources and services → Data collection and analysis rules section. For a data collection and analysis rule to run, you must create a scheduler for it.
Page top
Configuring the scheduler for a data collection and analysis rule
For a data collection and analysis rule to run, you must create a scheduler for it.
The scheduler makes SQL queries to specified storage partitions with the interval and search depth configured in the rule, and then converts the SQL query results into base events, which it then sends to the correlator.
SQL query results converted to base events are not stored in the storage.
For the scheduler to work correctly, you must configure the link between the data collection and analysis rule, the storage, and the correlators in the Resources → Data collection and analysis section.
To manage this section, you need one of the following roles: General administrator, Tenant administrator, Tier 2 analyst, Access to shared resources, Manage shared resources.
The schedulers are arranged in the table by the date of their last launch. You can sort the data in columns in ascending or descending order by clicking the down arrow (![]() ) icon in the column heading.
) icon in the column heading.
Available columns of the table of schedulers:
- Rule name is the name of the data collection and analysis rule for which you created the scheduler.
- Tenant name is the name of the tenant to which the data collection and analysis rule belongs.
- Status is the status of the scheduler. The following values are possible:
- Enabled means the scheduler is running, and the data collection and analysis rule will be started in accordance with the specified schedule.
- Disabled means the scheduler is not running.
This is the default status of a newly created scheduler. For the scheduler to run, it must be Enabled.
- The scheduler finished at is the last time the scheduler's data collection and analysis rule was started.
- Rule run status is the status with which the scheduler has finished. The following values are possible:
- Ok means the scheduler finished without errors, the rule was started.
- Unknown means the scheduler was Enabled and its status is currently unknown. The Unknown status is displayed if you have linked storages and correlators on the corresponding tabs and Enabled the scheduler, but have not yet started it.
- Stopped means the scheduler is stopped, the rule is not running.
- Error means the scheduler has finished, and the rule was completed with an error.
- Last error lists errors (if any) that occurred during the execution of the data collection and analysis rule.
Failure to send events to the configured correlator does not constitute an error.
You can use the toolbar in the upper part of the table to perform actions on schedulers.
To edit the scheduler, click the corresponding line in the table.
Available scheduler settings for data collection and analysis rules are described below.
General tab
On this tab you can:
- Enable or disable the scheduler using a toggle switch.
If the toggle switch is enabled, the data collection and analysis rule runs in accordance with the schedule configured in its settings.
- Edit the following settings of the data collection and analysis rule:
- Name
- Query interval
- Depth
- Sql
- Description
- Mapping
The Linked storages tab
On this tab you need to specify the storage to which the scheduler will send SQL queries.
To specify a storage:
- Click the Link button in the toolbar.
- This opens a window; in that window, specify the name of the storage to which you want to add the link, as well as the name of the section of the selected storage.
You can select only one storage, but multiple sections of that storage.
- Click Add.
The link is created and displayed in the table on the Linked storages tab.
If necessary, you can remove the links by selecting the check boxes in the relevant rows of the table and clicking the Unlink selected button.
The Linked correlators tab
On this tab, you must add correlators for handling base events.
To add a correlator:
- Click the Link button in the toolbar.
- This opens a window; in that window, hover over the Correlator field.
- In the displayed list of correlators, select check boxes next to the correlators you want to add.
- Click Add.
The correlators are added and displayed in the table on the Linked correlators tab.
If necessary, you can remove the correlators by selecting the check boxes in the relevant rows of the table and clicking the Unlink selected button.
You can also view the result of the scheduler in the Core log; to do so, you must first configure the Debug mode in Core settings. To download the log, select the Resources → Active services in KUMA, then select the Core service and click the Log button.
Log records with scheduler results have the datamining scheduler prefix.
Correlation rules
Correlation rules are used to recognize specific sequences of processed events and to take certain actions after recognition, such as creating correlation events/alerts or interacting with an active list.
Correlation rules can be used in the following KUMA services and features:
The available correlation rule settings depend on the selected type. Types of correlation rules:
- standard—used to find correlations between several events. Resources of this kind can create correlation events.
This rule kind is used to determine complex correlation patterns. For simpler patterns you should use other correlation rule kinds that require less resources to operate.
- simple—used to create correlation events if a certain event is found.
- operational—used for operations with Active lists and context tables. This rule kind cannot create correlation events.
For these resources, you can enable the display of control characters in all input fields except the Description field.
If a correlation rule is used in the correlator and an alert was created based on it, any change to the correlation rule will not result in a change to the existing alert even if the correlator service is restarted. For example, if the name of a correlation rule is changed, the name of the alert will remain the same. If you close the existing alert, a new alert will be created and it will take into account the changes made to the correlation rule.
Correlation rules of the 'standard' type
Correlation rules of the standard type are used for identifying complex patterns in processed events.
The search for patterns is conducted by using buckets
In comparison with the data model of the normalized event, some fields of the correlation event formed by the standard correlation rule may be different (see the table below).
Name of the correlation event field |
Description |
StartTime |
The earliest base event creation date and time (timestamp) among all base events from which the correlation event was generated. |
EndTime |
The later of the following dates and times:
|
To add fields from base events to the correlation event, specify these fields in the Identical fields and Unique fields parameters (see the table below).
Settings for a correlation rule of the standard type are described in the following tables.
General tab
This tab lets you specify the general settings of the correlation rule.
Setting |
Description |
|---|---|
Name |
Unique name of the resource. The maximum length of the name is 128 Unicode characters. Required setting. |
Tenant |
The name of the tenant that owns the resource. Required setting. |
Type |
Correlation rule type: standard. Required setting. |
Tags |
Tags for resource search. Optional setting. |
Identical fields |
Event fields that must be grouped in a Bucket. The hash of the values of the selected event fields is used as the Bucket key. If one of the selectors specified on the Selectors tab is triggered, the selected event fields are copied to the correlation event. If different selectors of the correlation rule use event fields that have different meanings in the events, do not specify such event fields in the Identical fields drop-down list. You can specify local variables. To refer to a local variable, its name must be preceded with the Required setting. |
Window, sec |
Bucket lifetime in seconds. The time starts counting when the bucket is created, when the bucket receives the first event. When the bucket lifetime expires, the trigger specified on the Actions → On timeout tab is triggered, and the container is deleted. Triggers specified on the Actions → On every threshold and On subsequent thresholds tabs can trigger more than once during the lifetime of the bucket. Required setting. |
Unique fields |
Unique event fields to be sent to the bucket. If you specify unique event fields, only these event fields will be sent to the container. The hash of values of the selected fields is used as the Bucket key. You can specify local variables. To refer to a local variable, its name must be preceded with the |
Rate limit |
Maximum number of times a correlation rule can be triggered per second. The default value is If correlation rules employing complex logic for pattern detection are not triggered, this may be due to the way rule triggers are counted in KUMA. In this case, we recommend increasing the Rate limit, for example, to |
Base events keep policy |
This drop-down list lets you select base events that you want to put in the correlation event:
|
Severity |
Base coefficient used to determine the importance of a correlation rule:
|
Order by |
Event field to be used by selectors of the correlation rule to track the evolution of the situation. This can be useful, for example, if you want to configure a correlation rule to be triggered when several types of events occur in a sequence. |
Description |
Description of the resource. The maximum length of the description is 4000 Unicode characters. |
MITRE techniques |
Downloaded MITRE ATT&CK techniques for analyzing the security coverage status using the MITRE ATT&CK matrix. |
Use unique field mapping |
This toggle switch allows you to save the values of unique fields to an array and pass it to a correlation event field. If the toggle switch is enabled, in the lower part of the General tab, an additional Unique field mapping group of settings is displayed, in which you can configure the mapping of the source original unique fields to correlation event fields. When processing an event using a correlation rule, field mapping takes place first, and then operations from the Actions tab are applied to the correlation event resulting from the initial mapping. The toggle switch is turned off by default. Optional setting. |
Unique field mapping group of settings
If you need to pass values of fields listed under Unique fields to the correlation event, here you can configure the mapping of unique fields to correlation event fields. This group of settings is displayed on the General tab if the Use unique field mapping toggle switch is enabled. Values of unique fields are an array, therefore the field in the correlation event must have the appropriate type: SA, NA, FA.
You can add a mapping by clicking the Add button and selecting a field from the drop-down list in the Raw event field column. You can select fields specified in the Unique fields parameter. In the drop-down list in the Target event field column, select the correlation event field to which you want to write the array of values of the source field. You can select fields whose type matches the type of the array (SA, NA, or FA, depending on the type of the source field).
You can delete one or more mappings by selecting the check boxes next to the relevant mappings and clicking Delete.
Selectors tab
This tab is used to define the conditions that the processed events must fulfill to trigger the correlation rule. To add a selector, click the + Add selector button. You can add multiple selectors, reorder selectors, or remove selectors. To reorder selectors, use the reorder icons. To remove a selector, click the delete icon next to it.
Each selector has a Settings tab and a Local variables tab.
The settings available on the Settings tab are described in the table below.
Setting |
Description |
|---|---|
Name |
Unique name of the resource. The maximum length of the name is 128 Unicode characters. Required setting. |
Selector threshold (event count) |
The number of events that must be received for the selector to trigger. The default value is Required setting. |
Recovery |
This toggle switch lets the correlation rule not trigger when the selector receives the number of events specified in the Selector threshold (event count) field. This toggle switch is turned off by default. |
Filter |
The filter that defines criteria for identifying events that trigger the selector when received. You can select an existing filter or create a new filter. To create a new filter, select Create new. If you want to edit the settings of an existing filter, click the pencil To create a filter:
Filtering based on data from the Extra event field The order of conditions specified in the selector filter of the correlation rule is significant and affects system performance. We recommend putting the most unique condition in the first place in the selector filter. Consider two examples of selector filters that select successful authentication events in Microsoft Windows. Selector filter 1: Condition 1: Condition 2: Selector filter 2: Condition 1: Condition 2: The order of conditions specified in selector filter 2 is preferable because it places less load on the system. |
On the Local variables tab, you can add variables that will be valid inside the correlation rule. To add a variable, click the + Add button, then specify the variable and its value. You can add multiple variables or delete variables. To delete a variable, select the check box next to it and click the Delete button.
In the selector of the correlation rule, you can use regular expressions conforming to the RE2 standard. Using regular expressions in correlation rules is computationally intensive compared to other operations. When designing correlation rules, we recommend limiting the use of regular expressions to the necessary minimum and using other available operations.
To use a regular expression, you must use the match operator. The regular expression must be placed in a constant. The use of capture groups in regular expressions is optional. For the correlation rule to trigger, the field text matched against the regexp must exactly match the regular expression.
For a primer on the syntax and examples of correlation rules that use regular expressions in their selectors, refer to the following rules that are provided with KUMA:
- R105_04_Suspicious PowerShell commands. Suspected obfuscation.
- R333_Suspicious creation of files in the autorun folder.
Actions tab
You can use this tab to configure the triggers of the correlation rule. You can configure triggers on the following tabs:
- On first threshold triggers when the Bucket registers the first triggering of the selector during the lifetime of the Bucket.
- On subsequent thresholds triggers when the Bucket registers the second and all subsequent triggering of the selector during the lifetime of the Bucket.
- On every threshold triggers every time the Bucket registers the triggering of the selector.
- On timeout triggers when the lifetime of the Bucket ends, and is used together with a selector that has the Recovery check box selected in its settings. Thus, this trigger activates if the situation detected by the correlation rule is not resolved within the specified lifetime.
Available trigger settings are listed in the table below.
Setting |
Description |
||||||||||||||
|---|---|---|---|---|---|---|---|---|---|---|---|---|---|---|---|
Output |
This check box enables the sending of correlation events for post-processing, that is, for external enrichment outside the correlation rule, for response, and to destinations. By default, this check box is cleared. |
||||||||||||||
Loop to correlator |
This check box enables the processing of the created correlation event by the rule chain of the current correlator. This makes hierarchical correlation possible. By default, this check box is cleared. If the Output and Loop to correlator check boxes are selected, the correlation rule is sent to post-processing first, and then to the selectors of the current correlation rule. |
||||||||||||||
No alert |
The check box disables the creation of alerts when the correlation rule is triggered. By default, this check box is cleared. If you do not want to create an alert when a correlation rule is triggered, but you still want to send a correlation event to the storage, select the Output and No alert check boxes. If you select only the No alert check box, a correlation event is not saved in the storage. |
||||||||||||||
Enrichment |
Enrichment rules for modifying the values of correlation event fields. Enrichment rules are stored in the correlation rule where they were created. To create an enrichment rule, click the + Add enrichment button. Available enrichment rule settings:
You can create multiple enrichment rules, reorder enrichment rules, or delete enrichment rules. To reorder enrichment rules, use the reorder |
||||||||||||||
Categorization |
Categorization rules for assets involved in the event. Using categorization rules, you can link and unlink only reactive categories to and from assets. To create an enrichment rule, click the + Add categorization button. Available categorization rule settings:
You can create multiple categorization rules, reorder categorization rules, or delete categorization rules. To reorder categorization rules, use the reorder |
||||||||||||||
Active lists update |
Operations with active lists. To create an operation with an active list, click the + Add active list action button. Available parameters of an active list operation:
You can create multiple operations with active lists, reorder operations with active lists, or delete operations with active lists. To reorder operations with active lists, use the reorder |
||||||||||||||
Updating context tables |
Operations with context tables. To create an operation with a context table, click the + Add context table action button. Available parameters of a context table operation:
You can create multiple operations with context tables, reorder operations with context tables, or delete operations with context tables. To reorder operations with context tables, use the reorder |
Correlators tab
This tab is displayed only when you edit the settings of the created correlation rule; on this tab, you can link correlators to the correlation rule.
To add correlators, click the + Add button, specify one or more correlators in the displayed window, and click OK. The correlation rule is linked to the specified correlators and added to the end of the execution queue in the correlator settings. If you want to change the position of a correlation rule in the execution queue, go to the Resources → Correlator section, click the correlator, and in the displayed window, go to the Correlation section, select the check box next to the correlation rule, and change the position of the correlation rule by clicking the Move up and Move down buttons.
You can add multiple correlators or delete correlators. To delete a correlator, select the check box next to it and click Delete.
Page top
Correlation rules of the 'simple' type
Correlation rules of the simple type are used to define simple sequences of events. Settings for a correlation rule of the simple type are described in the following tables.
In comparison with the data model of the normalized event, some fields of the correlation event formed by the simple correlation rule may be different (see the table below).
Name of the correlation event field |
Description |
StartTime |
Creation date and time (timestamp) of the base event from which the correlation event was generated. |
EndTime |
Creation date and time (timestamp) of the base event from which the correlation event was generated. |
General tab
This tab lets you specify the general settings of the correlation rule.
Setting |
Description |
|---|---|
Name |
Unique name of the resource. The maximum length of the name is 128 Unicode characters. Required setting. |
Tenant |
The name of the tenant that owns the resource. Required setting. |
Type |
Correlation rule type: simple. Required setting. |
Tags |
Tags for resource search. Optional setting. |
Propagated fields |
Event fields by which events are selected. If a selector specified on the Selectors tab is triggered, the selected event fields are copied to the correlation event. |
Rate limit |
Maximum number of times a correlation rule can be triggered per second. The default value is If correlation rules employing complex logic for pattern detection are not triggered, this may be due to the way rule triggers are counted in KUMA. In this case, we recommend increasing the Rate limit , for example, to |
Severity |
Base coefficient used to determine the importance of a correlation rule:
|
Description |
Description of the resource. The maximum length of the description is 4000 Unicode characters. |
MITRE techniques |
Downloaded MITRE ATT&CK techniques for analyzing the security coverage status using the MITRE ATT&CK matrix. |
Selectors tab
This tab is used to define the conditions that the processed events must fulfill to trigger the correlation rule. A selector has a Settings tab and a Local variables tab.
The settings available on the Settings tab are described in the table below.
Setting |
Description |
|---|---|
Filter |
The filter that defines criteria for identifying events that trigger the selector when received. You can select an existing filter or create a new filter. To create a new filter, select Create new. If you want to edit the settings of an existing filter, click the pencil To create a filter:
Filtering based on data from the Extra event field The order of conditions specified in the selector filter of the correlation rule is significant and affects system performance. We recommend putting the most unique condition in the first place in the selector filter. Consider two examples of selector filters that select successful authentication events in Microsoft Windows. Selector filter 1: Condition 1: Condition 2: Selector filter 2: Condition 1: Condition 2: The order of conditions specified in selector filter 2 is preferable because it places less load on the system. |
On the Local variables tab, you can add variables that will be valid inside the correlation rule. To add a variable, click the + Add button, then specify the variable and its value. You can add multiple variables or delete variables. To delete a variable, select the check box next to it and click the Delete button.
Actions tab
You can use this tab to configure the trigger of the correlation rule. A correlation rule of the simple type can have only one trigger, which is activated each time the bucket registers the selector triggering. Available trigger settings are listed in the table below.
Setting |
Description |
||||||||||||||
|---|---|---|---|---|---|---|---|---|---|---|---|---|---|---|---|
Output |
This check box enables the sending of correlation events for post-processing, that is, for external enrichment outside the correlation rule, for response, and to destinations. By default, this check box is cleared. |
||||||||||||||
Loop to correlator |
This check box enables the processing of the created correlation event by the rule chain of the current correlator. This makes hierarchical correlation possible. By default, this check box is cleared. If the Output and Loop to correlator check boxes are selected, the correlation rule is sent to post-processing first, and then to the selectors of the current correlation rule. |
||||||||||||||
No alert |
The check box disables the creation of alerts when the correlation rule is triggered. By default, this check box is cleared. If you do not want to create an alert when a correlation rule is triggered, but you still want to send a correlation event to the storage, select the Output and No alert check boxes. If you select only the No alert check box, a correlation event is not saved in the storage. |
||||||||||||||
Enrichment |
Enrichment rules for modifying the values of correlation event fields. Enrichment rules are stored in the correlation rule where they were created. To create an enrichment rule, click the + Add enrichment button. Available enrichment rule settings:
You can create multiple enrichment rules, reorder enrichment rules, or delete enrichment rules. To reorder enrichment rules, use the reorder |
||||||||||||||
Categorization |
Categorization rules for assets involved in the event. Using categorization rules, you can link and unlink only reactive categories to and from assets. To create an enrichment rule, click the + Add categorization button. Available categorization rule settings:
You can create multiple categorization rules, reorder categorization rules, or delete categorization rules. To reorder categorization rules, use the reorder |
||||||||||||||
Active lists update |
Operations with active lists. To create an operation with an active list, click the + Add active list action button. Available parameters of an active list operation:
You can create multiple operations with active lists, reorder operations with active lists, or delete operations with active lists. To reorder operations with active lists, use the reorder |
||||||||||||||
Updating context tables |
Operations with context tables. To create an operation with a context table, click the + Add context table action button. Available parameters of a context table operation:
You can create multiple operations with context tables, reorder operations with context tables, or delete operations with context tables. To reorder operations with context tables, use the reorder |
Correlators tab
This tab is displayed only when you edit the settings of the created correlation rule; on this tab, you can link correlators to the correlation rule.
To add correlators, click the + Add button, specify one or more correlators in the displayed window, and click OK. The correlation rule is linked to the specified correlators and added to the end of the execution queue in the correlator settings. If you want to change the position of a correlation rule in the execution queue, go to the Resources → Correlator section, click the correlator, and in the displayed window, go to the Correlation section, select the check box next to the correlation rule, and change the position of the correlation rule by clicking the Move up and Move down buttons.
You can add multiple correlators or delete correlators. To delete a correlator, select the check box next to it and click Delete.
Page top
Correlation rules of the 'operational' type
Correlation rules of the operational type are used for working with active lists. Settings for a correlation rule of the operational type are described in the following tables.
General tab
This tab lets you specify the general settings of the correlation rule.
Setting |
Description |
|---|---|
Name |
Unique name of the resource. The maximum length of the name is 128 Unicode characters. Required setting. |
Tenant |
The name of the tenant that owns the resource. Required setting. |
Type |
Correlation rule type: operational. Required setting. |
Tags |
Tags for resource search. Optional setting. |
Rate limit |
Maximum number of times a correlation rule can be triggered per second. The default value is If correlation rules employing complex logic for pattern detection are not triggered, this may be due to the way rule triggers are counted in KUMA. In this case, we recommend increasing the Rate limit , for example, to |
Description |
Description of the resource. The maximum length of the description is 4000 Unicode characters. |
MITRE techniques |
Downloaded MITRE ATT&CK techniques for analyzing the security coverage status using the MITRE ATT&CK matrix. |
Selectors tab
This tab is used to define the conditions that the processed events must fulfill to trigger the correlation rule. A selector has a Settings tab and a Local variables tab.
The settings available on the Settings tab are described in the table below.
Setting |
Description |
|---|---|
Filter |
The filter that defines criteria for identifying events that trigger the selector when received. You can select an existing filter or create a new filter. To create a new filter, select Create new. If you want to edit the settings of an existing filter, click the pencil To create a filter:
Filtering based on data from the Extra event field The order of conditions specified in the selector filter of the correlation rule is significant and affects system performance. We recommend putting the most unique condition in the first place in the selector filter. Consider two examples of selector filters that select successful authentication events in Microsoft Windows. Selector filter 1: Condition 1: Condition 2: Selector filter 2: Condition 1: Condition 2: The order of conditions specified in selector filter 2 is preferable because it places less load on the system. |
On the Local variables tab, you can add variables that will be valid inside the correlation rule. To add a variable, click the + Add button, then specify the variable and its value. You can add multiple variables or delete variables. To delete a variable, select the check box next to it and click the Delete button.
Actions tab
You can use this tab to configure the trigger of the correlation rule. A correlation rule of the operational type can have only one trigger, which is activated each time the bucket registers the selector triggering. Available trigger settings are listed in the table below.
Setting |
Description |
|---|---|
Active lists update |
Operations with active lists. To create an operation with an active list, click the + Add active list action button. Available parameters of an active list operation:
You can create multiple operations with active lists, reorder operations with active lists, or delete operations with active lists. To reorder operations with active lists, use the reorder |
Updating context tables |
Operations with context tables. To create an operation with a context table, click the + Add context table action button. Available parameters of a context table operation:
You can create multiple operations with context tables, reorder operations with context tables, or delete operations with context tables. To reorder operations with context tables, use the reorder |
Correlators tab
This tab is displayed only when you edit the settings of the created correlation rule; on this tab, you can link correlators to the correlation rule.
To add correlators, click the + Add button, specify one or more correlators in the displayed window, and click OK. The correlation rule is linked to the specified correlators and added to the end of the execution queue in the correlator settings. If you want to change the position of a correlation rule in the execution queue, go to the Resources → Correlator section, click the correlator, and in the displayed window, go to the Correlation section, select the check box next to the correlation rule, and change the position of the correlation rule by clicking the Move up and Move down buttons.
You can add multiple correlators or delete correlators. To delete a correlator, select the check box next to it and click Delete.
Page top
Variables in correlators
If tracking values in event fields, active lists, or dictionaries is not enough to cover some specific security scenarios, you can use global and local variables. You can use them to take various actions on the values received by the correlators by implementing complex logic for threat detection. Variables can be declared in the correlator (global variables) or in the correlation rule (local variables) by assigning a function to them, then querying them from correlation rules as if they were ordinary event fields and receiving the triggered function result in response.
Usage scope of variables:
- When searching for identical or unique field values in correlation rules.
- In the correlation rule selectors, in the filters of the conditions under which the correlation rule must be triggered.
- When enriching correlation events. Select Event as the source type.
- When populating active lists with values.
Variables can be queried the same way as event fields by preceding their names with the $ character.
You can use extended event schema fields in correlation rules, local variables, and global variables.
Local variables in identical and unique fields
You can use local variables in the Identical fields and Unique fields sections of 'standard' type correlation rules. To use a local variable, its name must be preceded with the "$" character.
For an example of using local variables in the Identical fields and Unique fields sections, refer to the rule provided with KUMA: R403_Access to malicious resources from a host with disabled protection or an out-of-date anti-virus database.
Page top
Local variables in selector
To use a local variable in a selector:
- Add a local variable to the rule.
- In the Correlation rules window, go to the General tab and add the created local variable to the Identical fields section. Prefix the local variable name with a "$" character.
- In Correlation rules window, go to the Selectors tab, select an existing filter or create a new filter and click Add condition.
- Select the event field as the operand.
- Select the local variable as the event field value and prefix the variable name with a "$" character.
- Specify the remaining filter settings.
- Click Save.
For an example of using local variables, refer to the rule provided with KUMA: R403_Access to malicious resources from a host with disabled protection or an out-of-date anti-virus database.
Page top
Local Variables in event enrichment
You can use 'standard' and 'simple' correlation rules to enrich events with local variables.
Enrichment with text and numbers
You can enrich events with text (strings). To do so, you can use functions that modify strings: to_lower, to_upper, str_join, append, prepend, substring, tr, replace, str_join.
You can enrich events with numbers. To do so, you can use the following functions: addition ("+"), subtraction ("-"), multiplication ("*"), division ("/"), round, ceil, floor, abs, pow.
You can also use regular expressions to manage data in local variables.
Using regular expressions in correlation rules is computationally intensive compared to other operations. Therefore, when designing correlation rules, we recommend limiting the use of regular expressions to the necessary minimum and using other available operations.
Timestamp enrichment
You can enrich events with timestamps (date and time). To do so, you can use functions that let you get or modify timestamps: now, extract_from_timestamp, parse_timestamp, format_timestamp, truncate_timestamp, time_diff.
Operations with active lists and tables
You can enrich events with local variables and data from active lists and tables.
To enrich events with data from an active list, use the active_list, active_list_dyn functions.
To enrich events with data from a table, use the table_dict, dict functions.
You can create conditional statements by using the 'conditional' function in local variables. In this way, the variable can return one of the values depending on what data was received for processing.
Enriching events with a local variable
To use a local variable to enrich events:
- Add a local variable to the rule.
- In the Correlation rules window, go to the General tab and add the created local variable to the Identical fields section. Prefix the local variable name with a "$" character.
- In the Correlation rules window, go to the Actions tab, and under Enrichment, in the Source kind drop-down list, select Event.
- From the Target field drop-down list, select the KUMA event field to which you want to pass the value of the local variable.
- From the Source field drop-down list, select a local variable. Prefix the local variable name with a "$" character.
- Specify the remaining rule settings.
- Click Save.
Local variables in active list enrichment
You can use local variables to enrich active lists.
To enrich the active list with a local variable:
- Add a local variable to the rule.
- In the Correlation rules window, go to the General tab and add the created local variable to the Identical fields section. Prefix the local variable name with a "$" character.
- In the Correlation rules window, go to the Actions tab and under Active lists update, add the local variable to the Key fields field. Prefix the local variable name with a "$" character.
- Under Mapping, specify the correspondence between the event fields and the active list fields.
- Click the Save button.
Properties of variables
Local and global variables
The properties of global variables differ from the properties of local variables.
Global variables:
- Global variables are declared at the correlator level and are applied only within the scope of this correlator.
- The global variables of the correlator can be queried from all correlation rules that are specified in it.
- In standard correlation rules, the same global variable can take different values in each selector.
- It is not possible to transfer global variables between different correlators.
Local variables:
- Local variables are declared at the correlation rule level and are applied only within the limits of this rule.
- In standard correlation rules, the scope of a local variable consists of only the selector in which the variable was declared.
- Local variables can be declared in any type of correlation rule.
- Local variables cannot be transferred between rules or selectors.
- A local variable cannot be used as a global variable.
Variables used in various types of correlation rules
- In operational correlation rules, on the Actions tab, you can specify all variables available or declared in this rule.
- In standard correlation rules, on the Actions tab, you can provide only those variables specified in these rules on the General tab, in the Identical fields field.
- In simple correlation rules, on the Actions tab, you can provide only those variables specified in these rules on the General tab, in the Inherited Fields field.
Requirements for variables
When adding a variable function, you must first specify the name of the function, and then list its parameters in parentheses. Basic mathematical operations (addition, subtraction, multiplication, division) are an exception to this requirement. When these operations are used, parentheses are used to designate the severity of the operations.
Requirements for function names:
- Must be unique within the correlator.
- Must contain 1 to 128 Unicode characters.
- Must not begin with the character $.
- Must be written in camelCase or CamelCase.
Special considerations when specifying functions of variables:
- The sequence of parameters is important.
- Parameters are separated by a comma:
,. - String parameters are passed in single quotes:
'. - Event field names and variables are specified without quotation marks.
- When querying a variable as a parameter, add the
$character before its name. - You do not need to add a space between parameters.
- In all functions in which a variable can be used as parameters, nested functions can be created.
Functions of variables
Operations with active lists and dictionaries
active_list and active_list_dyn
These functions allow you to receive information from an active list and dynamically generate a field name for an active list and key.
You must specify the parameters in the following sequence:
- Name of the active list
- Expression that returns the field name of the active list
- One or more expressions whose results are used to generate the key
Usage example
Result
active_list('Test', to_lower('DeviceHostName'), to_lower(DeviceCustomString2), to_lower(DeviceCustomString1))Gets the field value of the active list.
You can use these functions to reference an active list of the Shared tenant from a variable. To do so, add the @Shared suffix after the name of the active list (case sensitive). For example, active_list('exampleActiveList@Shared', 'score', SourceAddress, SourceUserName).
table_dict
Gets information about the value in the specified column of a dictionary of the table type.
You must specify the parameters in the following sequence:
- Dictionary name
- Dictionary column name
- One or more expressions whose results are used to generate the dictionary row key.
Usage example
Result
table_dict('exampleTableDict', 'office', SourceUserName)Gets data from the
exampleTableDictdictionary from the row with theSourceUserNamekey in theofficecolumn.table_dict('exampleTableDict', 'office', SourceAddress, to_lower(SourceUserName))Gets data from the
exampleTableDictdictionary from a composite key string from theSourceAddressfield value and the lowercase value of theSourceUserNamefield from theofficecolumn.
You can use this function to reference a dictionary of the Shared tenant from a variable. To do so, add the @Shared suffix after the name of the active list (case sensitive). For example, table_dict('exampleTableDict@Shared', 'office', SourceUserName).
dict
Gets information about the value in the specified column of a dictionary of the dictionary type.
You must specify the parameters in the following sequence:
- Dictionary name
- One or more expressions whose results are used to generate the dictionary row key.
Usage example
Result
dict('exampleDictionary', SourceAddress)Gets data from
exampleDictionaryfrom the row with theSourceAddresskey.dict('exampleDictionary', SourceAddress, to_lower(SourceUserName))Gets data from the
exampleDictionaryfrom a composite key string from theSourceAddressfield value and the lowercase value of theSourceUserNamefield.
You can use this function to reference a dictionary of the Shared tenant from a variable. To do so, add the @Shared suffix after the name of the active list (case sensitive). For example, dict('exampleDictionary@Shared', SourceAddress).
Operations with context tables
context_table
Returns the value of the specified field in the base type (for example, integer, array of integers).
You must specify the parameters in the following sequence:
- Name of the context table. The name must be specified.
- Expression that returns the field name of context table.
- Expression that returns the name of key field 1 of the context table.
- Expression that returns the value of key field 1 of the context table.
The function must contain at least 4 parameters.
Usage example |
Result |
|
|
len
Returns the length of a string or array.
The function returns the length of the array if the passed array is of one of the following types:
- array of integers
- array of floats
- array of strings
- array of booleans
If an array of a different type is passed, the data of the array is cast to the string type, and the function returns the length of the resulting string.
Usage examples |
|
|
distinct_items
Returns a list of unique elements in an array.
The function returns the list of unique elements of the array if the passed array is of one of the following types:
- array of integers
- array of floats
- array of strings
- array of booleans
If an array of a different type is passed, the data of the array is cast to the string type, and the function returns a string consisting of the unique characters from the original string.
Usage examples |
|
|
sort_items
Returns a sorted list of array elements.
You must specify the parameters in the following sequence:
- Expression that returns the object of the sorting
- Sorting order Possible values:
asc,desc. If the parameter is not specified, the default value isasc.
The function returns the list of sorted elements of the array if the passed array is of one of the following types:
- array of integers
- array of floats
- array of strings
For a boolean array, the function returns the list of array elements in the original order.
If an array of a different type is passed, the data of the array is cast to the string type, and the function returns a string of sorted characters.
Usage examples |
|
|
item
Returns the array element with the specified index or the character of a string with the specified index if an array of integers, floats, strings, or boolean values is passed.
You must specify the parameters in the following sequence:
- Expression that returns the object of the indexing
- Expression that returns the index of the element or character.
The function must contain at least 2 parameters.
The function returns the array element with the specified index or the string character with the specified index if the index falls within the range of the array and the passed array is of one of the following types:
- array of integers
- array of floats
- array of strings
- array of booleans
If an array of a different type is passed and the index falls within the range of the array, the data is cast to the string type, and the function returns the string character with the specified index. If an array of a different type is passed and the index is outside the range of the array, the function returns an empty string.
Usage examples |
|
|
Operations with strings
to_lower
Converts characters in a string to lowercase. Supported for standard fields and extended event schema fields of the string type.
A string can be passed as a string, field name or variable.
Usage examples |
|
|
|
to_upper
Converts characters in a string to uppercase. Supported for standard fields and extended event schema fields of the string type. A string can be passed as a string, field name or variable.
Usage examples |
|
|
|
append
Adds characters to the end of a string. Supported for standard fields and extended event schema fields of the string type.
You must specify the parameters in the following sequence:
- Original string.
- Added string.
Strings can be passed as a string, field name or variable.
Usage examples |
Usage result |
|
The string |
|
The string |
|
A string from |
prepend
Adds characters to the beginning of a string. Supported for standard fields and extended event schema fields of the string type.
You must specify the parameters in the following sequence:
- Original string.
- Added string.
Strings can be passed as a string, field name or variable.
Usage examples |
Usage result |
|
The string |
|
The string |
|
A string from |
substring
Returns a substring from a string. Supported for standard fields and extended event schema fields of the string type.
You must specify the parameters in the following sequence:
- Original string.
- Substring start position (natural number or 0).
- (Optional) substring end position.
Strings can be passed as a string, field name or variable. If the position number is greater than the original data string length, an empty string is returned.
Usage examples |
Usage result |
|
Returns a part of the string from the |
|
Returns a part of the string from the |
|
Returns the entire string from the |
index_of
The index_of function returns the byte offset of a character or substring in a string; the first character in the string has index 0. If the function does not find the substring, the function returns a negative value.
If the string has non-ASCII characters, the returned byte offset will not correspond to the number of characters preceding the substring you are searching for.
The function accepts the following parameters:
- As source data, an event field, another variable, or constant.
- Any expression out of those that are available in local variables.
To use this function, you must specify the parameters in the following order:
- Character or substring whose position you want to find.
- String to be searched.
Usage examples |
Usage result |
|
The function looks for the Result = 4 The function returns the index of the first occurrence of the character in the string. The first character in the string has index 0. |
|
The function looks for the Result = 8 The function returns the index of the first occurrence of the character in the string. The first character in the string has index 0. |
last_index_of
The last_index_of function returns the position of the last occurrence of a character or substring in a string; the first character in the string has index 0. If the function does not find the substring, the function returns -922337203685477580.
The function accepts the following parameters:
- As source data, an event field, another variable, or constant.
- Any expression out of those that are available in local variables.
To use this function, you must specify the parameters in the following order:
- Character or substring whose position you want to find.
- String to be searched.
Usage examples |
Usage result |
|
The function looks for the Result = 15 The function returns the index of the last occurrence of the character in the string. The first character in the string has index 0. |
tr
Deletes the specified characters from the beginning and end of a string. Supported for standard fields and extended event schema fields of the string type.
You must specify the parameters in the following sequence:
- Original string.
- (Optional) string that should be removed from the beginning and end of the original string.
Strings can be passed as a string, field name or variable. If you do not specify a string to be deleted, spaces will be removed from the beginning and end of the original string.
Usage examples |
Usage result |
|
Spaces have been removed from the beginning and end of the string from the |
|
If the |
|
If the |
replace
Replaces all occurrences of character sequence A in a string with character sequence B. Supported for standard fields and extended event schema fields of the string type.
You must specify the parameters in the following sequence:
- Original string.
- Search string: sequence of characters to be replaced.
- Replacement string: sequence of characters to replace the search string.
Strings can be passed as an expression.
Usage examples |
Usage result |
|
Returns a string from the |
|
Returns a string from |
regexp_replace
Replaces a sequence of characters that match a regular expression with a sequence of characters and regular expression capturing groups. Supported for standard fields and extended event schema fields of the string type.
You must specify the parameters in the following sequence:
- Original string.
- Search string: regular expression.
- Replacement string: sequence of characters to replace the search string, and IDs of the regular expression capturing groups. A string can be passed as an expression.
Strings can be passed as a string, field name or variable. Unnamed capturing groups can be used.
In regular expressions used in variable functions, each backslash character must be additionally escaped. For example, ^example\\\\ must be used instead of the regular expression ^example\\.
Usage examples |
Usage result |
|
Returns a string from the |
regexp_capture
Gets the result matching the regular expression condition from the original string. Supported for standard fields and extended event schema fields of the string type.
You must specify the parameters in the following sequence:
- Original string.
- Search string: regular expression.
Strings can be passed as a string, field name or variable. Unnamed capturing groups can be used.
In regular expressions used in variable functions, each backslash character must be additionally escaped. For example, ^example\\\\ must be used instead of the regular expression ^example\\.
Usage examples |
Example values |
Usage result |
|
|
|
template
Returns the string specified in the function, with variables replaced with their values. The template function can be used in one of two ways:
- With a single argument. In this case, you can use the field names to substitute values in the template.
- With multiple arguments. In this case, the zero-based index of the argument is used to substitute values.
Usage examples
template('Message text: {{.Message}}')template('Name in lower case: {{index . 0}}.Name in upper case: {{index . 1}}', to_lower(Name), to_upper(Name))
Operations with timestamps
now function
Gets a timestamp in epoch format. Runs with no arguments.
Usage examples |
|
extract_from_timestamp
Gets atomic time representations (year, month, day, hour, minute, second, day of the week) from fields and variables with time in the epoch format.
The parameters must be specified in the following sequence:
- Event field of the timestamp type, or variable.
- Notation of the atomic time representation. This parameter is case sensitive.
Possible variants of atomic time notation:
- y refers to the year in number format.
- M refers to the month in number notation.
- d refers to the number of the month.
- wd refers to the day of the week: Monday, Tuesday, Wednesday, Thursday, Friday, Saturday, Sunday.
- h refers to the hour in 24-hour format.
- m refers to the minutes.
- s refers to the seconds.
- (optional) Time zone notation. If this parameter is not specified, the time is calculated in UTC format.
Usage examples
extract_from_timestamp(Timestamp, 'wd')extract_from_timestamp(Timestamp, 'h')extract_from_timestamp($otherVariable, 'h')extract_from_timestamp(Timestamp, 'h', 'Europe/Moscow')
parse_timestamp
Converts the time from RFC3339 format (for example, 2022-05-24 00:00:00, 2022-05-24 00:00:00+0300) to epoch format.
Usage examples |
|
|
format_timestamp
Converts the time from epoch format to RFC3339 format.
The parameters must be specified in the following sequence:
- Event field of the timestamp type, or variable.
- Time format notation: RFC3339.
- (optional) Time zone notation. If this parameter is not specified, the time is calculated in UTC format.
Usage examples
format_timestamp(Timestamp, 'RFC3339')format_timestamp($otherVariable, 'RFC3339')format_timestamp(Timestamp, 'RFC3339', 'Europe/Moscow')
truncate_timestamp
Rounds the time in epoch format. After rounding, the time is returned in epoch format. Time is rounded down.
The parameters must be specified in the following sequence:
- Event field of the timestamp type, or variable.
- Rounding parameter:
- 1s rounds to the nearest second.
- 1m rounds to the nearest minute.
- 1h rounds to the nearest hour.
- 24h rounds to the nearest day.
- (optional) Time zone notation. If this parameter is not specified, the time is calculated in UTC format.
Usage examples
Examples of rounded values
Usage result
truncate_timestamp(Timestamp, '1m')1654631774175 (7 June 2022, 19:56:14.175)
1654631760000 (7 June 2022, 19:56:00)
truncate_timestamp($otherVariable, '1h')1654631774175 (7 June 2022, 19:56:14.175)
1654628400000 (7 June 2022, 19:00:00)
truncate_timestamp(Timestamp, '24h', 'Europe/Moscow')1654631774175 (7 June 2022, 19:56:14.175)
1654560000000 (7 June 2022, 0:00:00)
time_diff
Gets the time interval between two timestamps in epoch format.
The parameters must be specified in the following sequence:
- Interval end time. Event field of the timestamp type, or variable.
- Interval start time. Event field of the timestamp type, or variable.
- Time interval notation:
- ms refers to milliseconds.
- s refers to seconds.
- m refers to minutes.
- h refers to hours.
- d refers to days.
Usage examples
time_diff(EndTime, StartTime, 's')time_diff($otherVariable, Timestamp, 'h')time_diff(Timestamp, DeviceReceiptTime, 'd')
Mathematical operations
These are comprised of basic mathematical operations and functions.
Basic mathematical operations
Supported for extended event schema fields of the integer and float types.
Operations:
- Addition
- Subtraction
- Multiplication
- Division
- Modulo division
Parentheses determine the sequence of actions
Available arguments:
- Numeric event fields
- Numeric variables
- Real numbers
When modulo dividing, only natural numbers can be used as arguments.
Usage constraints:
- Division by zero returns zero.
- Mathematical operations on a number and a strings return the number unchanged. For example, 1 + abc returns 1.
- Integers resulting from operations are returned without a dot.
Usage examples
(Type=3; otherVariable=2; Message=text)Usage result
Type + 14
$otherVariable - Type-1
2 * 2.55
2 / 00
Type * Message0
(Type + 2) * 210
Type % $otherVariable1
round
Rounds numbers. Supported for extended event schema fields of the integer and float types.
Available arguments:
- Numeric event fields
- Numeric variables
- Numeric constants
Usage examples
(DeviceCustomFloatingPoint1=7.75; DeviceCustomFloatingPoint2=7.5 otherVariable=7.2)Usage result
round(DeviceCustomFloatingPoint1)8
round(DeviceCustomFloatingPoint2)8
round($otherVariable)7
ceil
Rounds up numbers. Supported for extended event schema fields of the integer and float types.
Available arguments:
- Numeric event fields
- Numeric variables
- Numeric constants
Usage examples
(DeviceCustomFloatingPoint1=7.15; otherVariable=8.2)Usage result
ceil(DeviceCustomFloatingPoint1)8
ceil($otherVariable)9
floor
Rounds down numbers. Supported for extended event schema fields of the integer and float types.
Available arguments:
- Numeric event fields
- Numeric variables
- Numeric constants
Usage examples
(DeviceCustomFloatingPoint1=7.15; otherVariable=8.2)Usage result
floor(DeviceCustomFloatingPoint1)7
floor($otherVariable)8
abs
Gets the modulus of a number. Supported for extended event schema fields of the integer and float types.
Available arguments:
- Numeric event fields
- Numeric variables
- Numeric constants
Usage examples
(DeviceCustomNumber1=-7; otherVariable=-2)Usage result
abs(DeviceCustomFloatingPoint1)7
abs($otherVariable)2
pow
Exponentiates a number. Supported for extended event schema fields of the integer and float types.
The parameters must be specified in the following sequence:
- Base — real numbers.
- Exponent — natural numbers or real numbers.
Available arguments:
- Numeric event fields
- Numeric variables
- Numeric constants
Usage examples
pow(DeviceCustomNumber1, DeviceCustomNumber2)pow($otherVariable, DeviceCustomNumber1)
str_join
Join multiple strings into one using a separator. Supported for extended event schema fields of the integer and float types.
The parameters must be specified in the following sequence:
- Separator. String.
- String 1, string 2, string N. At least 2 expressions.
Usage examples
Usage result
str_join('|', to_lower(Name), to_upper(Name), Name)String.
conditional
Get one value if a condition is met and another value if the condition is not met. Supported for extended event schema fields of the integer and float types.
The parameters must be specified in the following sequence:
- Condition. String. The syntax is similar to the conditions of the Where statement in SQL. You can use the functions of the KUMA variables and references to other variables in a condition.
- The value if the condition is met. Expression.
- The value if the condition is not met. Expression.
Supported operators:
ANDORNOT=!=<<=>>=LIKE(passes a RE2 regular expression, not an SQL expression)ILIKE(passes a RE2 regular expression, not an SQL expression)BETWEENINIS NULL(check for an empty value, such as 0 or an empty string)Usage examples (the value depends on arguments 2 and 3)
conditional('SourceUserName = \\'root\\' AND DestinationUserName = SourceUserName', 'match', 'no match')conditional(`DestinationUserName ILIKE 'svc_.*'`, 'match', 'no match')conditional(`DestinationUserName NOT LIKE 'svc_.*'`, 'match', 'no match')
Operations for extended event schema fields
For extended event schema fields of the string type, the following operations are supported:
lento_lowerto_upperappendprependsubstringtrreplaceregexp_replaceregexp_capture
For extended event schema fields of the integer or float type, the following operations are supported:
- Basic mathematical operations:
roundceilfloorabspowstr_joinconditional
For extended event schema fields of the array of integers, array of floats, and array of strings types, KUMA supports the following functions:
- Get the i-th element of the array. Example:
item(<type>.someStringArray). - Get an array of values. Example:
<type>.someStringArray. Returns["string1", "string2", "string3"]. - Get the count of elements in an array. Example:
len(<type>.someStringArray). Returns["string1", "string2"]. - Gett unique elements from an array. Example:
distinct_items(<type>.someStringArray). - Generate a TSV string of array elements. Example:
to_string(<type>.someStringArray). - Sort the elements of the array. Example:
sort_items(<type>.someStringArray).In the examples, instead of
<type>, you must specify the array type: NA for an array of integers, FA for an array of floats, SA for an array of strings.
For fields of the array of integers and array of floats types, the following functions are supported:
math_minreturns the minimum element of an array. Example:math_min(NA.NumberArray),math_min(FA.FloatArray).math_maxreturns the maximum element of an array Example:math_max(NA.NumberArray),math_max(FA.FloatArray).math_avgreturns the average value of an array. Example:math_avg(NA.NumberArray),math_avg(FA.FloatArray).
Declaring variables
To declare variables, they must be added to a correlator or correlation rule.
To add a global variable to an existing correlator:
- In the KUMA web interface, under Resources → Correlators, select the resource set of the relevant correlator.
The Correlator Installation Wizard opens.
- Select the Global variables step of the Installation Wizard.
- click the Add variable button and specify the following parameters:
- In the Variable window, enter the name of the variable.
- In the Value window, enter the variable function.
When entering functions, you can use autocomplete as a list of hints with possible function names, their brief description and usage examples. You can select a function from the list and insert it together with its list of arguments into the input field.
To display the list of all hints in the field, press Ctrl+Space. Press Enter to select a function from the list. Press Tab to go to the next argument in the list of arguments of the selected function.
Multiple variables can be added. Added variables can be edited or deleted by using the
icon. - Select the Setup validation step of the Installation Wizard and click Save.
A global variable is added to the correlator. It can be queried like an event field by inserting the $ character in front of the variable name. The variable will be used for correlation after restarting the correlator service.
To add a local variable to an existing correlation rule:
- In the KUMA web interface, under Resources → Correlation rules, select the relevant correlation rule.
The correlation rule settings window opens. The parameters of a correlation rule can also be opened from the correlator to which it was added by proceeding to the Correlation step of the Installation Wizard.
- Click the Selectors tab.
- In the selector, open the Local variables tab, click the Add variable button and specify the following parameters:
- In the Variable window, enter the name of the variable.
- In the Value window, enter the variable function.
When entering functions, you can use autocomplete as a list of hints with possible function names, their brief description and usage examples. You can select a function from the list and insert it together with its list of arguments into the input field.
To display the list of all hints in the field, press Ctrl+Space. Press Enter to select a function from the list. Press Tab to go to the next argument in the list of arguments of the selected function.
Multiple variables can be added. Added variables can be edited or deleted by using the
icon.For standard correlation rules, repeat this step for each selector in which you want to declare variables.
- Click Save.
The local variable is added to the correlation rule. It can be queried like an event field by inserting the $ character in front of the variable name. The variable will be used for correlation after restarting the correlator service.
Added variables can be edited or deleted. If the correlation rule queries an undeclared variable (for example, if its name has been changed), an empty string is returned.
If you change the name of a variable, you will need to manually change the name of this variable in all correlation rules where you have used it.
Page top
Adding a temporary exclusion list for a correlation rule
Users that do not have the rights to edit correlation rules in the KUMA web interface, can create a temporary list of exclusions (for example, create exclusions for false positives when managing alerts). A user with the rights to edit correlation rules can then add the exclusions to the rule and remove them from the temporary list.
To add exclusions to a correlation rule when managing alerts:
- Go to the Alerts section and select an alert.
- Click the Find in events button.
Events of the alert are displayed on the events page.
- Open the correlation event.
This opens the event card in which each field has a
 (arrow) button that lets you add an exclusion.
 - Click the button and select Add to exclusions .
A sidebar is displayed, containing the following fields: Correlation rule, Exclusion, Alert, Comment.
- Click the Create button.
The exclusion rule is added.
The exclusion is added to the temporary list. This list is available to anyone with rights to read correlation rules: in the Resources → Correlation rules section, in the rule list tools toolbar, click the List of exclusions button. If you want to view the exclusions of a specific rule, open the card of the rule and select the Exclusions tab.
The exclusion list contains entries with the following parameters:
ExclusionExclusion condition.
Correlation ruleName of the correlation rule.
-
AlertName of the alert from which the exclusion was added.
TenantThe tenant to which the rule and the exclusion apply.
ConditionGenerated automatically based on the selected field of the correlation event.
Сreation dateDate and time when the exclusion was added.
Expires
Date and time when the exclusion will be automatically removed from the list.
CreatedName of the user that added the exclusion.
Comment
After the exclusion is added, by default, the correlation rule takes the exclusion into account for 7 days. In the Options → General section, you can configure the duration of exclusions by editing the corr_rule_exclusion_ttl_hours parameter in the Core properties section. You can configure the lifetime of exclusions in hours and days. The minimum value is 1 hour, the maximum is 365 days. This setting is available only for users with the General administrator role.
For fields from base events to be propagated to correlation events, these fields must be specified in the card of the correlation rule on the General tab, in the Propagated fields field. If the fields of base events are not mapped to the correlation event, these fields cannot be added to exclusions.
To remove exclusions from a correlation rule:
- Go to the Resources → Correlation rules section.
- In the toolbar of the rule list, click List of exclusions button.
This opens the window with the list of exclusions.
- Select the exclusions that you want to delete and click the Delete button.
Exceptions are deleted from the correlation rule.
KUMA generates an audit event whenever an exception is created or deleted. You can view the changes of event settings in the Event details window.
Page top
Predefined correlation rules
The KUMA distribution kit includes correlation rules listed in the table below.
Predefined correlation rules
Correlation rule name |
Description |
[OOTB] KATA alert |
Used for enriching KATA events. |
[OOTB] Successful Bruteforce |
Triggers when a successful authentication attempt is detected after multiple unsuccessful authentication attempts. This rule works based on the events of the sshd daemon. |
[OOTB][AD] Account created and deleted within a short period of time |
Detects instances of creation and subsequent deletion of accounts on Microsoft Windows hosts. |
[OOTB][AD] An account failed to log on from different hosts |
Detects multiple unsuccessful attempts to authenticate on different hosts. |
[OOTB][AD] Membership of sensitive group was modified |
Works based on Microsoft Windows events. |
[OOTB][AD] Multiple accounts failed to log on from the same host |
Triggers after multiple failed authentication attempts are detected on the same host from different accounts. |
[OOTB][AD] Successful authentication with the same account on multiple hosts |
Detects connections to different hosts under the same account. This rule works based on Microsoft Windows events. |
[OOTB][AD] The account added and deleted from the group in a short period of time |
Detects the addition of a user to a group and subsequent removal. This rule works based on Microsoft Windows events. |
[OOTB][Net] Possible port scan |
Detects suspected port scans. This rule works based on Netflow, Ipfix events. |
MITRE ATT&CK techniques and tactics
KUMA can:
- Enrich correlation events with information about MITRE ATT&CK techniques and tactics.
Tactic and Technique fields of the event data model are used for this purpose. When generating a correlation event, these fields can be populated with relevant data for later use. For example, when a new alert is received with MITRE ATT&CK markup, you can open the MITRE ATT&CK website and read about the techniques and tactics to learn when, how, and why attackers might use these techniques, how to detect them, and how to mitigate risks — all of this can help you develop a response plan. You can also build reports and dashboards based on alerts and techniques detected in the infrastructure. If you are using correlation rules from SOC_package and want to customize the enrichment of correlation events with information about MITRE ATT&CK techniques and tactics, add the MITRE enrichment rules from SOC_package to the correlator.
- Assess the coverage of the MITRE ATT&CK matrix by your correlation rules.
In this case, the general correlation rule parameters are used, which allow associating MITRE techniques with each rule. This parameter is used to describe the rule itself and this data is not passed to the correlation rule or alert in any way. Associating techniques and tactics with correlation rules lets you analyze the MITRE ATT&CK matrix coverage, focusing on the most relevant techniques for your specific infrastructure.
If you want to assess the coverage of the MITRE ATT&CK matrix by your correlation rules:
As a result, you can visually assess the coverage of the MITRE ATT&CK matrix.
Page top
Filters
Filters let you select events based on specified conditions. The collector service uses filters to select events that you want to send to KUMA. Events that satisfy the filter conditions are sent to KUMA for further processing.
You can use filters in the following KUMA services and features:
- Collector.
- Correlator.
- Storage.
- Correlation rules.
- Enrichment rules.
- Aggregation rules.
- Destinations.
- Response rules.
- Segmentation rules.
You can use standalone filters or built-in filters that are stored in the service or resource in which they were created. For resources in input fields except the Description field, you can enable the display of control characters. Available filter settings are listed in the table below.
Setting |
Description |
|---|---|
Name |
Unique name of the resource. The maximum length of the name is 128 Unicode characters. Required setting. Inline filters are created in other resources or services and do not have names. |
Tenant |
The name of the tenant that owns the resource. Required setting. |
Tags |
Tags for resource search. Optional setting. |
Description |
Description of the resource. The maximum length of the description is 4000 Unicode characters. |
You can create filter conditions and filter groups, or add existing filters to a filter.
To create filtering criteria, you can use builder mode or source code mode. In builder mode, you can create or edit filter criteria by selecting filter conditions and operators from drop-down lists. In source code mode, you can use text commands to create and edit search queries. The builder mode is used by default.
You can freely switch between modes when creating filtering criteria. To switch to source code mode, select the Code tab. When switching between modes, the created condition filters are preserved. If the filter code is not displayed on the Code tab after linking the created filter to the resource, go to the Builder tab and then go back to the Code tab to display the filter code.
Creating filtering criteria in builder mode
To create filtering criteria in builder mode, you need to select one of the following operators from the drop-down list:
- AND: The filter selects events that match all of the specified conditions.
- OR: The filter selects events that match one of the specified conditions.
- NOT: The filter selects events that match none of the specified conditions.
You can add filtering criteria in one of the following ways:
- To add a condition, click the + Add condition button.
- To add a group of conditions, click the + Add group button. When adding groups of conditions, you can also select the AND, OR, and NOT operators. In turn, you can add conditions and condition groups to a condition group.
You can add multiple filtering criteria, reorder the filtering criteria, or remove filtering criteria. To reorder filtering criteria, use the reorder icons. To remove a filtering criterion, click the delete icon next to it.
Available condition settings are listed in the table below.
Setting |
Description |
|---|---|
<Condition type> |
Condition type. The default is If. You can click the default value and select If not from the displayed drop-down list. Required setting. |
<Left operand> and <Right operand> |
Values to be processed by the operator. The available types of values of the right operand depend on the selected operator. Required settings. |
<Operator> |
Condition operator. When selecting a condition operator in the drop-down list, you can select the do not match case check box if you want the operator to ignore the case of values. This check box is ignored if the inSubnet, inActiveList, inCategory, InActiveDirectoryGroup, hasBit, and inDictionary operators are selected. By default, this check box is cleared. You can change or delete the specified operator. To change the operator, click it and specify a new operator. To delete the operator, click it, then press Backspace. |
The available operand kinds depends on whether the operand is left (L) or right (R).
Available operand kinds for left (L) and right (R) operands
Operator |
Event field type |
Active list type |
Dictionary type |
Context table type |
Table type |
TI type |
Constant type |
List type |
= |
L,R |
L,R |
L,R |
L,R |
L,R |
L,R |
R |
R |
> |
L,R |
L,R |
L,R |
L,R (only when looking up a table value by index) |
L,R |
L |
R |
|
>= |
L,R |
L,R |
L,R |
L,R (only when looking up a table value by index) |
L,R |
L |
R |
|
< |
L,R |
L,R |
L,R |
L,R (only when looking up a table value by index) |
L,R |
L |
R |
|
<= |
L,R |
L,R |
L,R |
L,R (only when looking up a table value by index) |
L,R |
L |
R |
|
inSubnet |
L,R |
L,R |
L,R |
L,R |
L,R |
L,R |
R |
R |
contains |
L,R |
L,R |
L,R |
L,R |
L,R |
L,R |
R |
R |
startsWith |
L,R |
L,R |
L,R |
L,R |
L,R |
L,R |
R |
R |
endsWith |
L,R |
L,R |
L,R |
L,R |
L,R |
L,R |
R |
R |
match |
L |
L |
L |
L |
L |
L |
R |
R |
hasVulnerability |
L |
L |
L |
L |
L |
|
|
|
hasBit |
L |
L |
L |
L |
L |
|
R |
R |
inActiveList |
|
|
|
|
|
|
|
|
inDictionary |
|
|
|
|
|
|
|
|
inCategory |
L |
L |
L |
L |
L |
|
R |
R |
inContextTable |
|
|
|
|
|
|
|
|
inActiveDirectoryGroup |
L |
L |
L |
L |
L |
|
R |
R |
TIDetect |
|
|
|
|
|
|
|
|
You can use hotkeys when managing filters. Hotkeys are described in the table below.
Hotkeys and their functions
Key |
Function |
|---|---|
e |
Invokes a filter by the event field |
d |
Invokes a filter by the dictionary field |
a |
Invokes a filter by the active list field |
c |
Invokes a filter by the context table field |
t |
Invokes a filter by the table field |
f |
Invokes a filter |
t+i |
Invokes a filter using TI |
Ctrl+Enter |
Finish editing a condition |
The usage of extended event schema fields of the String, Number, or Float types is the same as the usage of fields of the KUMA event schema.
When using filters with extended event schema fields of the Array of strings, Array of numbers, and Array of floats types, you can use the following operations:
- The
containsoperation returnsTrueif the specified substring is present in the array, otherwise it returnsFalse. - The
matchoperation matches the string against a regular expression. - The
intersecoperation.
Creating filtering criteria in source code mode
The source code mode allows you to quickly edit conditions, select and copy blocks of code. In the right part of the builder, you can find the navigator, which lets you to navigate the filter code. Line wrapping is performed automatically at AND, OR, NOT logical operators, or at commas that separate the items in the list of values.
Names of resources used in the filter are automatically specified. Fields containing the names of linked resources cannot be edited. The names of shared resource categories are not displayed in the filter if you do not have the "Access to shared resources" role. To view the list of resources for the selected operand inside the expression, press Ctrl+Space. This displays a list of resources.
The filters listed in the table below are included in the KUMA kit.
Predefined filters
Filter name |
Description |
[OOTB][AD] A member was added to a security-enabled global group (4728) |
Selects events of adding a user to an Active Directory security-enabled global group. |
[OOTB][AD] A member was added to a security-enabled universal group (4756) |
Selects events of adding a user to an Active Directory security-enabled universal group. |
[OOTB][AD] A member was removed from a security-enabled global group (4729) |
Selects events of removing a user from an Active Directory security-enabled global group. |
[OOTB][AD] A member was removed from a security-enabled universal group (4757) |
Selects events of removing a user from an Active Directory security-enabled universal group. |
[OOTB][AD] Account Created |
Selects Windows user account creation events. |
[OOTB][AD] Account Deleted |
Selects Windows user account deletion events. |
[OOTB][AD] An account failed to log on (4625) |
Selects Windows logon failure events. |
[OOTB][AD] Successful Kerberos authentication (4624, 4768, 4769, 4770) |
Selects successful Windows logon events and events with IDs 4769, 4770 that are logged on domain controllers. |
[OOTB][AD][Technical] 4768. TGT Requested |
Selects Microsoft Windows events with ID 4768. |
[OOTB][Net] Possible port scan |
Selects events that may indicate a port scan. |
[OOTB][SSH] Accepted Password |
Selects events of successful SSH connections with a password. |
[OOTB][SSH] Failed Password |
Selects attempts to connect over SSH with a password. |
Active lists
The active list is a bucket for data that is used by KUMA correlators for analyzing events according to the correlation rules.
For example, for a list of IP addresses with a bad reputation, you can:
- Create a correlation rule of the operational type and add these IP addresses to the active list.
- Create a correlation rule of the standard type and specify the active list as filtering criteria.
- Create a correlator with this rule.
In this case, KUMA selects all events that contain the IP addresses in the active list and creates a correlation event.
You can fill active lists automatically using correlation rules of the simple type or import a file that contains data for the active list.
You can add, copy, or delete active lists.
Active lists can be used in the following KUMA services and features:
The same active list can be used by different correlators. However, a separate entity of the active list is created for each correlator. Therefore, the contents of the active lists used by different correlators differ even if the active lists have the same names and IDs.
Only data based on correlation rules of the correlator are added to the active list.
You can add, edit, duplicate, delete, and export records in the active correlator sheet.
During the correlation process, when entries are deleted from active lists after their lifetime expires, service events are generated in the correlators. These events only exist in the correlators, and they are not redirected to other destinations. Correlation rules can be configured to track these events so that they can be processed and used to identify threats. Service event fields for deleting an entry from the active list are described below.
Event field |
Value or comment |
|
Event identifier |
|
Time when the expired entry was deleted |
|
|
|
|
|
|
|
Correlator ID |
|
Correlator name |
|
Active list ID |
|
Key of the expired entry |
|
Number of deleted entry updates increased by one |
S.<active list field> |
Dropped-out entry of the active list in the following format: S.<active list field> = <value of active list field> |
Viewing the table of active lists
To view the table of correlator active lists:
- In the KUMA web interface, select the Resources section.
- In the Services section, click the Active services button.
- Select the check box next to the correlator for which you want to view the active list.
- Click the Go to active lists button.
The Correlator active lists table is displayed.
The table contains the following data:
- Name—the name of the correlator list.
- Records—the number of record the active list contains.
- Size on disk—the size of the active list.
- Directory—the path to the active list on the KUMA Core server.
Adding active list
To add active list:
- In the KUMA web interface, select the Resources → Resources configuration → Active lists section.
- Click the Add active list button.
- Do the following:
- In the Name field, enter a name for the active list.
- In the Tenant drop-down list, select the tenant that owns the resource.
- In the TTL field, specify time the record added to the active list is stored in it.
When the specified time expires, the record is deleted. The time is specified in seconds.
The default value is 0. If the value of the field is 0, the record is retained for 36,000 days (roughly 100 years).
- In the Tags field, specify the tags to help find the resource.
- In the Description field, provide any additional information.
You can use up to 4,000 Unicode characters.
This field is optional.
- Click the Save button.
The active list is added.
Page top
Viewing the settings of an active list
To view the settings of an active list:
- In the KUMA web interface, select the Resources section.
- In the Resources section, click the Active lists button.
- In the Name column, select the active list whose settings you want to view.
This opens the active list settings window. It displays the following information:
- ID—identifier selected Active list.
- Name—unique name of the resource.
- Tenant—the name of the tenant that owns the resource.
- TTL—the record added to the active list is stored in it for this time. This value is specified in seconds.
- Description—any additional information about the resource.
Changing the settings of an active list
To change the settings of an active list:
- In the KUMA web interface, select the Resources section.
- In the Resources section, click the Active lists button.
- In the Name column, select the active list whose settings you want to change.
- Specify the values of the following parameters:
- Name—unique name of the resource.
- TTL—the record added to the active list is stored in it for this time. This value is specified in seconds.
If the field is set to 0, the record is stored indefinitely.
- Description—any additional information about the resource.
The ID and Tenant fields are not editable.
Duplicating the settings of an active list
To copy an active list:
- In the KUMA web interface, select the Resources section.
- In the Resources section, click the Active lists button.
- Select the check box next to the active lists you want to copy.
- Click Duplicate.
- Specify the necessary settings.
- Click the Save button.
The active list is copied.
Page top
Deleting an active list
To delete an active list:
- In the KUMA web interface, select the Resources section.
- In the Resources section, click the Active lists button.
- Select the check boxes next to the active lists you want to delete.
To delete all lists, select the check box next to the Name column.
At least one check box must be selected.
- Click the Delete button.
- Click OK.
The active lists are deleted.
Page top
Viewing records in the active list
To view the records in the active list:
- In the KUMA web interface, select the Resources section.
- In the Services section, click the Active services button.
- Select the check box next to the correlator for which you want to view the active list.
- Click the Go to active lists button.
The Correlator active lists table is displayed.
- In the Name column, select the desired active list.
A table of records for the selected list is opened.
The table contains the following data:
- Key – the value of the record key.
- Record repetitions – total number of times the record was mentioned in events and identical records were downloaded when importing active lists to KUMA.
- Expiration date – date and time when the record must be deleted.
If the TTL field had the value of 0 when the active list was created, the records of this active list are retained for 36,000 days (roughly 100 years).
- Created – the time when the active list was created.
- Updated – the time when the active list was last updated.
Searching for records in the active list
To find a record in the active list:
- In the KUMA web interface, select the Resources section.
- In the Services section, click the Active services button.
- Select the check box next to the correlator for which you want to view the active list.
- Click the Go to active lists button.
The Correlator active lists table is displayed.
- In the Name column, select the desired active list.
A window with the records for the selected list is opened.
- In the Search field, enter the record key value or several characters from the key.
The table of records of the active list displays only the records with the key containing the entered characters.
Page top
Adding a record to an active list
To add a record to the active list:
- In the KUMA web interface, select the Resources section.
- In the Services section, click the Active services button.
- Select the check box next to the required correlator.
- Click Go to active lists.
The Correlator active lists table is displayed.
- In the Name column, select the desired active list.
A window with the records for the selected list is opened.
- Click Add.
The Create record window opens.
- Specify the values of the following parameters:
- In the Key field, enter the name of the record.
You can specify several values separated by the "|" character.
The Key field cannot be empty. If the field is not filled in, KUMA returns an error when trying to save the changes.
- In the Value field, specify the values for fields in the Field column.
KUMA takes field names from the correlation rules with which the active list is associated. These names are not editable. You can delete these fields if necessary.
- Click the Add new element button to add more values.
- In the Field column, specify the field name.
The name must meet the following requirements:
- To be unique
- Do not contain tab characters
- Do not contain special characters except for the underscore character
- The maximum number of characters is 128.
The name must not begin with an underscore and contain only numbers.
- In the Value column, specify the value for this field.
It must meet the following requirements:
- Do not contain tab characters
- Do not contain special characters except for the underscore character
- The maximum number of characters is 1024.
This field is optional.
- In the Key field, enter the name of the record.
- Click the Save button.
The record is added. After saving, the records in the active list are sorted in alphabet order.
Page top
Duplicating records in the active list
To duplicate a record in the active list:
- In the KUMA web interface, select the Resources section.
- In the Services section, click the Active services button.
- Select the check box next to the correlator for which you want to view the active list.
- Click Go to active lists.
The Correlator active lists table is displayed.
- In the Name column, select the desired active list.
A window with the records for the selected list is opened.
- Select the check boxes next to the record you want to copy.
- Click Duplicate.
- Specify the necessary settings.
The Key field cannot be empty. If the field is not filled in, KUMA returns an error when trying to save the changes.
Editing the field names in the Field column is not available for the records that have been added to the active list before. You can change the names only for records added at the time of editing. The name must not begin with an underscore and contain only numbers.
- Click the Save button.
The record is copied. After saving, the records in the active list are sorted in alphabet order.
Page top
Changing a record in the active list
To edit a record in the active list:
- In the KUMA web interface, select the Resources section.
- In the Services section, click the Active services button.
- Select the check box next to the correlator for which you want to view the active list.
- Click Go to active lists.
The Correlator active lists table is displayed.
- In the Name column, select the desired active list.
A window with the records for the selected list is opened.
- Click the record name in the Key column.
- Specify the required values.
- Click the Save button.
The record is overwritten. After saving, the records in the active list are sorted in alphabet order.
Restrictions when editing a record:
- The record name is not editable. You can change it by importing the same data with a different name.
- Editing the field names in the Field column is not available for the records that have been added to the active list before. You can change the names only for records added at the time of editing. The name must not begin with an underscore and contain only numbers.
- The values in the Value column must meet the following requirements:
- Do not contain Cyrillic characters
- Do not contain spaces or tabs
- Do not contain special characters except for the underscore character
- The maximum number of characters is 128
Deleting records from the active list
To delete records from the active list:
- In the KUMA web interface, select the Resources section.
- In the Services section, click the Active services button.
- Select the check box next to the correlator for which you want to view the active list.
- Click Go to active lists.
The Correlator active lists table is displayed.
- In the Name column, select the desired active list.
A window with the records for the selected list is opened.
- Select the check boxes next to the records you want to delete.
To delete all records, select the check box next to the Key column.
At least one check box must be selected.
- Click the Delete button.
- Click OK.
The records will be deleted.
Page top
Import data to an active list
To import active list:
- In the KUMA web interface, select the Resources section.
- In the Services section, click the Active services button.
- Select the check box next to the correlator for which you want to view the active list.
- Click Go to active lists.
The Correlator active lists table is displayed.
- Point the mouse over the row with the desired active list.
- Click to the left of the active list name.
- Select Import.
The active list import window opens.
- In the File field select the file you wan to import.
- In the Format drop-down list select the format of the file:
- csv
- tsv
- internal
- Under Key field, enter the name of the column containing the active list record keys.
- Click the Import button.
The data from the file is imported into the active list. The records included in the list before are saved.
Data imported from a file is not checked for invalid characters. If you use this data in widgets, widgets are displayed incorrectly if invalid characters are present in the data.
Page top
Exporting data from the active list
To export active list:
- In the KUMA web interface, select the Resources section.
- In the Services section, click the Active services button.
- Select the check box next to the correlator for which you want to view the active list.
- Click the Go to active lists button.
The Correlator active lists table is displayed.
- Point the mouse over the row with the desired active list.
- Click to the left of the desired active list.
- Click the Export button.
The active list is downloaded in the JSON format using your browsers settings. The name of the downloaded file reflects the name of active list.
Page top
Predefined active lists
The active lists listed in the table below are included in the KUMA distribution kit.
Predefined active lists
Active list name |
Description |
[OOTB][AD] End-users tech support accounts |
This active list is used as a filter for the "[OOTB][AD] Successful authentication with same user account on multiple hosts" correlation rule. Accounts of technical support staff may be added to the active list. Records are not deleted from the active list. |
[OOTB][AD] List of sensitive groups |
This active list is used as a filter for the "[OOTB][AD] Membership of sensitive group was modified" correlation rule. Critical domain groups, whose membership must be monitored, can be added to the active list. Records are not deleted from the active list. |
[OOTB][Linux] CompromisedHosts |
This active list is populated by the [OOTB] Successful Bruteforce by potentially compromised Linux hosts rule. Records are removed from the list 24 hours after they are recorded. |
Proxies
Proxy servers are used to store proxy server configuration settings, for example, in destinations. The http type is supported. Available proxy server settings are listed in the table below.
Available proxy server settings
Setting |
Description |
|---|---|
Name |
Unique name of the proxy server. Maximum length of the name: 128 Unicode characters. Required setting. |
Tenant |
The name of the tenant that owns the resource. Required setting. |
Secret separately |
Viewing information about the connection. If this check box is selected, the following settings are displayed in the window:
This lets you view connection information without having to re-create a large number of connections if the password of the user account that you used for the connections changes. This check box is cleared by default. |
Use URL from the secret |
The secret resource that stores URLs of proxy servers. You can create or edit a secret. To create a secret, click the plus ( |
Do not use for domains |
One or more domains to which direct access is required. |
Description |
Description of the proxy server. Maximum length of the description: 4000 Unicode characters. |
Dictionaries
Description of parameters
Dictionaries are resources storing data that can be used by other KUMA resources and services. Dictionaries can be used in the following KUMA services and features:
Available dictionary settings are listed in the table below.
Available dictionary settings
Setting |
Description |
|---|---|
Name |
Unique name for this resource type. Maximum length of the name: 128 Unicode characters. Required setting. |
Tenant |
The name of the tenant that owns the resource. Required setting. |
Description |
Description of the resource. Maximum length of the description: 4000 Unicode characters. |
Type |
Dictionary type. The selected dictionary type determines the format of the data that the dictionary can contain:
Required setting. |
Values |
Table with dictionary data.
If the dictionary contains more than 5,000 entries, they are not displayed in the KUMA web interface. To view the contents of such dictionaries, the contents must be exported in CSV format. If you edit the CSV file and import it back into KUMA, the dictionary is updated. |
 . To remove a row from the table, hover over the table row until the
  button appears and click the button.
Importing and exporting dictionaries
You can import or export dictionary data in CSV format (in UTF-8 encoding) by using the Import CSV or Export CSV buttons.
The format of the CSV file depends on the dictionary type:
- Dictionary type:
{KEY},{VALUE}\n - Table type:
{Column header 1}, {Column header N}, {Column header N+1}\n{Key1}, {ValueN}, {ValueN+1}\n{Key2}, {ValueN}, {ValueN+1}\nThe keys must be unique for both the CSV file and the dictionary. In tables, the keys are specified in the first column. Keys must contain 1 to 128 Unicode characters.
Values must contain 0 to 256 Unicode characters.
During an import, the contents of the dictionary are overwritten by the imported file. When imported into the dictionary, the resource name is also changed to reflect the name of the imported file.
If the key or value contains comma or quotation mark characters (, and "), they are enclosed in quotation marks (") when exported. Also, quotation mark character (") is shielded with additional quotation mark (").
If incorrect lines are detected in the imported file (for example, invalid separators), these lines will be ignored during import into the dictionary, and the import process will be interrupted during import into the table.
Interacting with dictionaries via API
You can use the REST API to read the contents of Table-type dictionaries. You can also modify them even if these resources are being used by active services. This lets you, for instance, configure enrichment of events with data from dynamically changing tables exported from third-party applications.
Predefined dictionaries
The dictionaries listed in the table below are included in the KUMA distribution kit.
Predefined dictionaries
Dictionary name |
Type |
Description |
[OOTB] Ahnlab. Severity |
dictionary |
Contains a table of correspondence between a priority ID and its name. |
[OOTB] Ahnlab. SeverityOperational |
dictionary |
Contains values of the SeverityOperational parameter and a corresponding description. |
[OOTB] Ahnlab. VendorAction |
dictionary |
Contains a table of correspondence between the ID of the operation being performed and its name. |
[OOTB] Cisco ISE Message Codes |
dictionary |
Contains Cisco ISE event codes and their corresponding names. |
[OOTB] DNS. Opcodes |
dictionary |
Contains a table of correspondence between decimal opcodes of DNS operations and their IANA-registered descriptions. |
[OOTB] IANAProtocolNumbers |
dictionary |
Contains the port numbers of transport protocols (TCP, UDP) and their corresponding service names, registered by IANA. |
[OOTB] Juniper - JUNOS |
dictionary |
Contains JUNOS event IDs and their corresponding descriptions. |
[OOTB] KEDR. AccountType |
dictionary |
Contains the ID of the user account type and its corresponding type name. |
[OOTB] KEDR. FileAttributes |
dictionary |
Contains IDs of file attributes stored by the file system and their corresponding descriptions. |
[OOTB] KEDR. FileOperationType |
dictionary |
Contains IDs of file operations from the KATA API and their corresponding operation names. |
[OOTB] KEDR. FileType |
dictionary |
Contains modified file IDs from the KATA API and their corresponding file type descriptions. |
[OOTB] KEDR. IntegrityLevel |
dictionary |
Contains the SIDs of the Microsoft Windows INTEGRITY LEVEL parameter and their corresponding descriptions. |
[OOTB] KEDR. RegistryOperationType |
dictionary |
Contains IDs of registry operations from the KATA API and their corresponding values. |
[OOTB] Linux. Sycall types |
dictionary |
Contains Linux call IDs and their corresponding names. |
[OOTB] MariaDB Error Codes |
dictionary |
The dictionary contains MariaDB error codes and is used by the [OOTB] MariaDB Audit Plugin syslog normalizer to enrich events. |
[OOTB] Microsoft SQL Server codes |
dictionary |
Contains MS SQL Server error IDs and their corresponding descriptions. |
[OOTB] MS DHCP Event IDs Description |
dictionary |
Contains Microsoft Windows DHCP server event IDs and their corresponding descriptions. |
[OOTB] S-Terra. Dictionary MSG ID to Name |
dictionary |
Contains IDs of S-Terra device events and their corresponding event names. |
[OOTB] S-Terra. MSG_ID to Severity |
dictionary |
Contains IDs of S-Terra device events and their corresponding Severity values. |
[OOTB] Syslog Priority To Facility and Severity |
table |
The table contains the Priority values and the corresponding Facility and Severity field values. |
[OOTB] VipNet Coordinator Syslog Direction |
dictionary |
Contains direction IDs (sequences of special characters) used in ViPNet Coordinator to designate a direction, and their corresponding values. |
[OOTB] Wallix EventClassId - DeviceAction |
dictionary |
Contains Wallix AdminBastion event IDs and their corresponding descriptions. |
[OOTB] Windows.Codes (4738) |
dictionary |
Contains operation codes present in the MS Windows audit event with ID 4738 and their corresponding names. |
[OOTB] Windows.Codes (4719) |
dictionary |
Contains operation codes present in the MS Windows audit event with ID 4719 and their corresponding names. |
[OOTB] Windows.Codes (4663) |
dictionary |
Contains operation codes present in the MS Windows audit event with ID 4663 and their corresponding names. |
[OOTB] Windows.Codes (4662) |
dictionary |
Contains operation codes present in the MS Windows audit event with ID 4662 and their corresponding names. |
[OOTB] Windows. EventIDs and Event Names mapping |
dictionary |
Contains Windows event IDs and their corresponding event names. |
[OOTB] Windows. FailureCodes (4625) |
dictionary |
Contains IDs from the Failure Information\Status and Failure Information\Sub Status fields of Microsoft Windows event 4625 and their corresponding descriptions. |
[OOTB] Windows. ImpersonationLevels (4624) |
dictionary |
Contains IDs from the Impersonation level field of Microsoft Windows event 4624 and their corresponding descriptions. |
[OOTB] Windows. KRB ResultCodes |
dictionary |
Contains Kerberos v5 error codes and their corresponding descriptions. |
[OOTB] Windows. LogonTypes (Windows all events) |
dictionary |
Contains IDs of user logon types and their corresponding names. |
[OOTB] Windows_Terminal Server. EventIDs and Event Names mapping |
dictionary |
Contains Microsoft Terminal Server event IDs and their corresponding names. |
[OOTB] Windows. Validate Cred. Error Codes |
dictionary |
Contains IDs of user logon types and their corresponding names. |
[OOTB] ViPNet Coordinator Syslog Direction |
dictionary |
Contains direction IDs (sequences of special characters) used in ViPNet Coordinator to designate a direction, and their corresponding values. |
[OOTB] Syslog Priority To Facility and Severity |
table |
Contains the Priority values and the corresponding Facility and Severity field values. |
Response rules
Response rules let you initiate automatic running of Kaspersky Security Center tasks, Threat Response actions for Kaspersky Endpoint Detection and Response, KICS/KATA, Active Directory, and running a custom script for specific events.
Automatic execution of Kaspersky Security Center tasks, Kaspersky Endpoint Detection and Response tasks, and KICS/KATA and Active Directory tasks in accordance with response rules is available when integrated with the relevant applications.
You can configure response rules under Resources → Response, and then select the created response rule from the drop-down list in the correlator settings. You can also configure response rules directly in the correlator settings.
Response rules for Kaspersky Security Center
You can configure response rules to automatically start tasks of anti-virus scan and updates on Kaspersky Security Center assets.
When creating and editing response rules for Kaspersky Security Center, you need to define values for the following settings.
Response rule settings
Setting |
Description |
|---|---|
Name |
Required setting. Unique name of the resource. Must contain 1 to 128 Unicode characters. |
Tenant |
Required setting. The name of the tenant that owns the resource. |
Type |
Required setting, available if KUMA is integrated with Kaspersky Security Center. Response rule type, ksctasks. |
Kaspersky Security Center task |
Required setting. Name of the Kaspersky Security Center task to run. Tasks must be created beforehand, and their names must begin with " You can use KUMA to run the following types of Kaspersky Security Center tasks:
|
Event field |
Required setting. Defines the event field of the asset for which the Kaspersky Security Center task should be started. Possible values:
|
Handlers |
The number of handlers that the service can run simultaneously to process response rules in parallel. By default, the number of handlers is the same as the number of virtual processors on the server where the service is installed. |
Description |
Description of the response rule. You can add up to 4,000 Unicode characters. |
Filter |
Used to define the conditions for the events to be processed using the response rule. You can select an existing filter from the drop-down list or create a new filter. Creating a filter in resources To create a filter:
|
To send requests to Kaspersky Security Center, you must ensure that Kaspersky Security Center is available over the UDP protocol.
If a response rule is owned by the Shared tenant, the displayed Kaspersky Security Center tasks that are available for selection are from the Kaspersky Security Center server that the main tenant is connected to.
If a response rule has a selected task that is absent from the Kaspersky Security Center server that the tenant is connected to, the task is not performed for assets of this tenant. This situation could arise when two tenants are using a common correlator, for example.
Page top
Response rules for a custom script
You can create a script containing commands to be executed on the KUMA server when selected events are detected and configure response rules to automatically run this script. In this case, the application will run the script when it receives events that match the response rules.
The script file is stored on the server where the correlator service using the response resource is installed: /opt/kaspersky/kuma/correlator/<Correlator ID>/scripts. The kuma user of this server requires the permissions to run the script.
When creating and editing response rules for a custom script, you need to define values for the following parameters.
Response rule settings
Setting |
Description |
|---|---|
Name |
Required setting. Unique name of the resource. Must contain 1 to 128 Unicode characters. |
Tenant |
Required setting. The name of the tenant that owns the resource. |
Type |
Required setting. Response rule type, script. |
Timeout |
The number of seconds allotted for the script to finish. If this amount of time is exceeded, the script is terminated. |
Script name |
Required setting. Name of the script file. If the response resource is attached to the correlator service but there is no script file in the /opt/kaspersky/kuma/correlator/<Correlator ID>/scripts folder, the correlator will not work. |
Script arguments |
Arguments or event field values that must be passed to the script. If the script includes actions taken on files, you should specify the absolute path to these files. Parameters can be written with quotation marks ("). Event field names are passed in the Example: |
Handlers |
The number of handlers that the service can run simultaneously to process response rules in parallel. By default, the number of handlers is the same as the number of virtual processors on the server where the service is installed. |
Description |
Description of the resource. You can add up to 4,000 Unicode characters. |
Filter |
Used to define the conditions for the events to be processed using the response rule. You can select an existing filter from the drop-down list or create a new filter. Creating a filter in resources To create a filter:
|
Response rules for KICS for Networks
You can configure response rules to automatically trigger response actions on KICS for Networks assets. For example, you can change the asset status in KICS for Networks.
When creating and editing response rules for KICS for Networks, you need to define values for the following settings.
Response rule settings
Setting |
Description |
|---|---|
Name |
Required setting. Unique name of the resource. Must contain 1 to 128 Unicode characters. |
Tenant |
Required setting. The name of the tenant that owns the resource. |
Type |
Required setting. Response rule type, Response via KICS/KATA. |
Event field |
Required setting. Specifies the event field for the asset for which response actions must be performed. Possible values:
|
KICS for Networks task |
Response action to be performed when data is received that matches the filter. The following types of response actions are available:
When a response rule is triggered, KUMA will send KICS for Networks an API request to change the status of the specified device to Authorized or Unauthorized. |
Handlers |
The number of handlers that the service can run simultaneously to process response rules in parallel. By default, the number of handlers is the same as the number of virtual processors on the server where the service is installed. |
Description |
Description of the resource. You can add up to 4,000 Unicode characters. |
Filter |
Used to define the conditions for the events to be processed using the response rule. You can select an existing filter from the drop-down list or create a new filter. Creating a filter in resources To create a filter:
|
Response rules for Kaspersky Endpoint Detection and Response
You can configure response rules to automatically trigger response actions on Kaspersky Endpoint Detection and Response assets. For example, you can configure automatic asset network isolation.
When creating and editing response rules for Kaspersky Endpoint Detection and Response, you need to define values for the following settings.
Response rule settings
Setting |
Description |
|---|---|
Event field |
Required setting. Specifies the event field for the asset for which response actions must be performed. Possible values:
|
Task type |
Response action to be performed when data is received that matches the filter. The following types of response actions are available:
At least one of the above fields must be completed.
All of the listed operations can be performed on assets that have Kaspersky Endpoint Agent for Windows. On assets that have Kaspersky Endpoint Agent for Linux, the application can only be started. At the software level, the capability to create prevention rules and network isolation rules for assets with Kaspersky Endpoint Agent for Linux is unlimited. KUMA and Kaspersky Endpoint Detection and Response do not provide any notifications about unsuccessful application of these rules. |
Handlers |
The number of handlers that the service can run simultaneously to process response rules in parallel. By default, the number of handlers is the same as the number of virtual processors on the server where the service is installed. |
Description |
Description of the response rule. You can add up to 4,000 Unicode characters. |
Filter |
Used to define the conditions for the events to be processed using the response rule. You can select an existing filter from the drop-down list or create a new filter. Creating a filter in resources To create a filter:
|
Active Directory response rules
Active Directory response rules define the actions to be applied to an account if a rule is triggered.
When creating and editing response rules using Active Directory, specify the values for the following settings.
Response rule settings
Setting |
Description |
|---|---|
Name |
Required setting. Unique name of the resource. Must contain 1 to 128 Unicode characters. |
Tenant |
Required setting. The name of the tenant that owns the resource. |
Type |
Required setting. Response rule type, Response via Active Directory. |
Source of the user account ID |
Event field from which the Active Directory account ID value is taken. Possible values:
|
AD command |
Command that is applied to the account when the response rule is triggered. Available values:
If your Active Directory domain allows selecting the User cannot change password check box, resetting the user account password as a response will result in a conflict of requirements for the user account: the user will not be able to authenticate. The domain administrator will need to clear one of the check boxes for the affected user account: User cannot change password or User must change password at next logon.
|
Group DN |
The DistinguishedName of the domain group in fields for each role. The users of this domain group must be able to authenticate with their domain user accounts. Example of entering a group: OU=KUMA users,OU=users,DC=example,DC=domain |
Handlers |
The number of handlers that the service can run simultaneously to process response rules in parallel. By default, the number of handlers is the same as the number of virtual processors on the server where the service is installed. |
Filter |
Used to define the conditions for the events to be processed using the response rule. You can select an existing filter from the drop-down list or create a new filter. Creating a filter in resources To create a filter:
|
Notification templates
Notification templates are used to create email notifications about events of the following types:
- Alert created.
- Report generated.
- Task finished (only one template of this type can exist).
- Sources monitoring alert.
- KASAP group changed.
You can create templates of all types of events for the Shared tenant. For all other tenants, only the following event types are available: Alert created and Sources monitoring alert.
Predefined notification templates.
The notification templates listed in the table below are included in the KUMA distribution kit.
Predefined notification templates.
Template name |
Description |
[OOTB] New alert in KUMA |
Basic notification template. |
Creating a notification template
To create a notification template:
- In the KUMA web interface, open the Resources → Notification templates section.
In the right part of the Resources section, the Notification templates table is displayed.
- Click the Add button and in the displayed window, specify settings as described in the table below.
Notification template settings
Setting
Description
Name
Required setting.
Unique name of the template. Must contain 1 to 128 Unicode characters. The name may not begin or end with a space and may not contain control sequences (line feed, etc).
Tenant
Required setting.
The name of the tenant that owns the resource. You can create templates of all types of events for the Shared tenant. For all other tenants, only the following types are available: Alert created and Sources monitoring alert.
Type
Required setting.
The type of event for which you want to create a notification template. The following types are available:
- Alert created.
- Report generated.
- Task finished.
Only one template of this type can exist. If a template of this type already exists, this type is not available for selection when creating a new template.
- Sources monitoring alert.
- KASAP group changed.
Subject
Required setting.
Subject of the notification email message. Maximum length: 140 Unicode characters.
You can enter the text in English or Russian, depending on the localization selected in the user profile.
For each event type, a standard subject text is available when creating a template. You cannot edit the text in the Subject field or select a standard text until you select the template type in the Type field.
In the subject of the message, you can reference the object fields depending on the selected type of event.
Example (subject in notification template for an event of the Alert created type):
New alert in KUMA: {{.CorrelationRuleName}}.In place of
{{.CorrelationRuleName}}, the subject of the notification message will include the name of the correlation rule contained in theCorrelationRuleNamealert field.Template
Required setting.
Body of the notification email message.
You can enter the text in English or Russian, depending on the localization selected in the user profile.
The syntax of the template lets you dynamically populate the notification with data from the specified fields of the corresponding objects. For a description of the notification template syntax and the list of supported fields, see the Notification template syntax article. For each event type, a standard email message subject text is available when creating a template.
For convenience, you can open the text of the email message in a separate window by clicking the
 icon. This opens the Template window in which you can edit the text of the notification message. Click OK to save the changes and close the window.
Default
Optional setting. Available for the Task finished event type.
If the check box is selected, the created template is applied instead of the system template to all tasks created after saving the template.
Tags
Optional setting.
Tags for the generated notification template.
The list includes all available tags created in the tenant of the resource and in the Shared tenant. You can find a tag in the list by typing its name in the field. If the tag you entered does not exist, you can press Enter or click Add to create it.
Description
Optional setting.
Arbitrary text describing the template. Maximum length: 4000 Unicode characters.
- Click Save.
The notification template is created and displayed in the Notification templates table.
Page top
Editing a notification template
To edit a notification template:
- In the KUMA web interface, open the Resources → Notification templates section.
In the right part of the Resources section, the Notification templates table is displayed.
- Open the relevant template by clicking its row in the table, and in the displayed window, edit the settings listed in the table in the Creating a notification template article.
- Click Save.
The notification template is modified.
Page top
Deleting a notification template
To delete a notification template:
- In the KUMA web interface, open the Resources → Notification templates section.
In the right part of the Resources section, the Notification templates table is displayed.
- Select the check boxes next to the notification templates that you want to delete.
If you want to delete all existing templates, select the check box next to the Name column and select Select all from the drop-down list.
If you want to delete all templates on the page, select the check box next to the Name column and select Select all in page from the drop-down list.
You must select at least one check box.
- Click the Delete button.
A confirmation window opens. If some of the templates being deleted are linked to other resources or services, these are listed in the confirmation window with a note saying that these templates will not be deleted.
- Click the Delete button to confirm deletion.
Templates that can be safely deleted are deleted.
Page top
Notification template syntax
The notification templates use the Go templates syntax. You can use this syntax to dynamically fill notifications with content: load data from the fields of the corresponding objects, insert links, or convert dates to a different format. You can use the template syntax in the subject as well as the body of the message. This article briefly describes the syntax and lists the fields that can be used for certain types of events, and additional functions that can be applied to these fields. You can read more about the syntax in the official Go language documentation.
In the template, you can reference the object fields depending on the selected type of event. The fields of the corresponding objects can contain simple values such as a string or a number:
|
The message will display the alert name, which is the contents of the CorrelationRuleName field of the alert data model.
Some fields may contain data arrays, for example, alert fields with related events, assets, and accounts. Such nested objects can be queried by using the range function, which sequentially queries the fields of the first 50 nested objects. When using the range function to query a field that does not contain a data array, an error is returned. Example:
|
The message will display the values of the DeviceHostName and CreatedAt fields from 50 assets related to the alert:
|
You can use the limit function to limit the number of objects returned by the range function:
|
The message will display the values of the DisplayName and CreatedAt fields from 5 assets related to the alert, with the words "Devices" and "Creation date" marked with the <strong> HTML tag:
|
Nested objects can have their own nested objects. They can be queried by using nested range functions:
|
The message will show ten service IDs (ServiceID field) from the base events related to five correlation events of the alert (50 lines in total). Please note that events are queried through the nested EventWrapper structure, which is located in the Events field in the alert. Events are available in the Event field of this structure, which is reflected in the example above. Therefore, if field A contains nested structure [B] and structure [B] contains field C, which is a string or a number, to query field C, you must specify the path {{ A.C }}.
Some object fields contain nested dictionaries in key-value format (for example, the Extra event field). They can be queried by using the range function with the variables passed to it: range $placeholder1, $placeholder2 := .FieldName. The values of variables can then be called by specifying their names. Example:
|
The message will use an HTML tag<br> to show key-value pairs from the Extra fields of the base events belonging to the correlation events. Data is called from five base events out of each of the three correlation events.
You can use HTML tags in notification templates to create more complex structures. Example table for correlation event fields:
|
Use the link_alert function to insert an HTML alert link into the notification email:
|
A link to the alert window will be displayed in the message.
Templates also support more complex constructs such as local variable declaration, comparison operators, and control structures. Below is an example of how you can extract the data on max asset category from the alert data and place it in the notifications:
|
Object fields supported in templates
The following table lists the fields that can be accessed from templates, depending on the type of event.
Supported object fields
Type |
Available fields |
Alert created
|
All fields of the alert data model are supported, including nested arrays and structs. |
Report generated |
Example of adding links to a report notification template: You can |
Task finished |
|
Sources monitoring alert |
|
KASAP group changed |
|
Functions in notification templates
Functions available in templates are listed in the table below.
Functions in templates
Function |
Description |
|---|---|
|
Takes the time in milliseconds (unix time) as the first parameter; the second parameter can be used to pass the time in RFC standard format. The time zone cannot be changed. Example call: Call result: 18 Nov 2022 13:46 Examples of date formats supported by the function:
|
|
Lets you iterate over arrays or sets of key-value pairs, sequentially referring to the fields of the first 50 items. |
|
This function is called inside the Example call:
|
|
Generates a link to the alert with the URL specified in the SMTP server connection settings as the KUMA Core server alias or with the real URL of the KUMA Core service if no alias is defined. Example call:
|
|
Generates a link to the task in KUMA. Example call:
|
|
Takes the form of a link that can be followed. Example call:
|
Connectors
Connectors are used for establishing connections between KUMA services and for receiving events actively and passively.
You can specify connector settings on the Basic settings and Advanced settings tabs. The available settings depend on the selected type of connector.
Connectors can have the following types:
- internal for receiving data from KUMA services using the 'internal' protocol.
- tcp for passively receiving events over TCP when working with Windows and Linux agents.
- udp for passively receiving events over UDP when working with Windows and Linux agents.
- netflow for passively receiving events in the NetFlow format.
- sflow for passively receiving events in the sFlow format. For sFlow, only structures described in sFlow version 5 are supported.
- nats-jetstream for interacting with a NATS message broker when working with Windows and Linux agents.
- kafka for communicating with the Apache Kafka data bus when working with Windows and Linux agents.
- http for receiving events over HTTP when working with Windows and Linux agents.
- sql for querying databases. KUMA supports multiple types of databases. When creating a connector of the sql type, you must specify general connector settings and individual database connection settings.
- file for getting data from text files when working with Windows and Linux agents. One line of a text file is considered to be one event.
\nis used as the newline character. - 1c-log for getting data from 1C technology logs when working with Linux agents.
\nis used as the newline character. The connector accepts only the first line from a multi-line event record. - 1c-xml for getting data from 1C registration logs when working with Linux agents. When the connector handles multi-line events, it converts them into single-line events.
- diode for unidirectional data transmission in industrial ICS networks using data diodes.
- ftp for getting data over File Transfer Protocol (FTP) when working with Windows and Linux agents.
- nfs for getting data over Network File System (NFS) when working with Windows and Linux agents.
- wmi for getting data using Windows Management Instrumentation when working with Windows agents.
- wec for getting data using Windows Event Forwarding (WEF) and Windows Event Collector (WEC), or local operating system logs of a Windows host when working with Windows agents.
- etw for getting extended logs of DNS servers.
- snmp for getting data over Simple Network Management Protocol (SNMP) when working with Windows and Linux agents. To process events received over SNMP, you must use the json normalizer. Supported SNMP protocol versions:
- snmpV1
- snmpV2
- snmpV3
- snmp-trap for passively receiving events using SNMP traps when working with Windows and Linux agents. The connector receives snmp-trap events and prepares them for normalization by mapping SNMP object IDs to temporary keys. Then the message is passed to the JSON normalizer, where the temporary keys are mapped to the KUMA fields and an event is generated. To process events received over SNMP, you must use the json normalizer. Supported SNMP protocol versions:
- snmpV1
- snmpV2
- kata/edr for getting KEDR data via the API.
- vmware for getting VMware vCenter data via the API.
- elastic for getting Elasticsearch data. Elasticsearch version 7.0.0 is supported.
- office365 for receiving Microsoft 365 (Office 365) data via the API.
Some connector types (such as tcp, sql, wmi, wec, and etw) support TLS encryption. KUMA supports TLS 1.2 and 1.3. When TLS mode is enabled for these connectors, the connection is established according to the following algorithm:
- If KUMA is being used as a client:
- KUMA sends a connection request to the server with a ClientHello message specifying the maximum supported TLS version (1.3), as well as a list of supported ciphersuites.
- The server responds with the preferred TLS version and a ciphersuite.
- Depending on the TLS version in the server response:
- If the server responds to the request with TLS 1.3 or 1.2, KUMA establishes a connection with the server.
- If the server responds to the request with TLS 1.1, KUMA terminates the connection with the server.
- If KUMA is being used as a server:
- The client sends a connection request to KUMA with the maximum supported TLS version, as well as a list of supported ciphersuites.
- Depending on the TLS version in the client request:
- If the ClientHello message of the client request specifies TLS 1.1, KUMA terminates the connection.
- If the client request specifies TLS 1.2 or 1.3, KUMA responds to the request with the preferred TLS version and a ciphersuite.
Viewing connector settings
To view connector settings:
- In the KUMA web interface, select Resources → Connectors.
- In the folder structure, select the folder containing the relevant connector.
- Select the connector whose settings you want to view.
The settings of connectors are displayed on two tabs: Basic settings and Advanced settings. For a detailed description of each connector settings, please refer to the Connector settings section.
Page top
Adding a connector
You can enable the display of non-printing characters for all entry fields except the Description field.
To add a connector:
- In the KUMA web interface, select Resources → Connectors.
- In the folder structure, select the folder in which you want the connector to be located.
Root folders correspond to tenants. To make a connector available to a specific tenant, the resource must be created in the folder of that tenant.
If the required folder is absent from the folder tree, you need to create it.
By default, added connectors are created in the Shared folder.
- Click the Add connector button.
- Define the settings for the selected connector type.
The settings that you must specify for each type of connector are provided in the Connector settings section.
- Click the Save button.
Connector settings
This section describes the settings of all connector types supported by KUMA.
Connector, internal type
Connectors of the internal type are used for receiving data from KUMA services using the 'internal' protocol. For example, you must use such a connector to receive the following data:
- Internal data, such as event routes.
- File attributes. If while creating the collector at the Transport step of the Installation Wizard, you specified a connector of the file, 1c-xml, or 1c-log type, at the Event parsing step, in the Mapping table, you can pass the name of the file being processed by the collector or the path to the file in the KUMA event field. To do this, in the Source column, specify one of the following values:
$kuma_fileSourceNameto pass the name of the file being processed by the collector in the KUMA event field.$kuma_fileSourcePathto pass the path to the file being processed by the collector in the KUMA event field.
When you use a file, 1c-xml, or 1c-log connector, the new variables in the normalizer will only work with destinations of the internal type.
- Events to the event router. The event router can only receive events over the 'internal' protocol, therefore you can only use internal destinations when sending events to the event router.
Settings for a connector of the internal type are described in the following tables.
Basic settings tab
Setting |
Description |
|---|---|
Name |
Unique name of the resource. The maximum length of the name is 128 Unicode characters. Required setting. |
Tenant |
The name of the tenant that owns the resource. Required setting. |
Type |
Connector type: internal. Required setting. |
Tags |
Tags for resource search. Optional setting. |
URL |
The URL and port that the connector is listening on. You can enter a value in one of the following formats:
You can specify IPv6 addresses in the following format: You can add multiple values or delete values. To add a value, click the + Add button. To delete a value, click the delete Required setting. |
Description |
Description of the resource. The maximum length of the description is 4000 Unicode characters. |
Advanced settings tab
Setting |
Description |
|---|---|
Debug |
The switch enables resource logging. The toggle switch is turned off by default. |
Connector, tcp type
Connectors of the tcp type are used for passively receiving events over TCP when working with Windows and Linux agents. Settings for a connector of the tcp type are described in the following tables.
Basic settings tab
Setting |
Description |
|---|---|
Name |
Unique name of the resource. The maximum length of the name is 128 Unicode characters. Required setting. |
Tenant |
The name of the tenant that owns the resource. Required setting. |
Type |
Connector type: tcp. Required setting. |
Tags |
Tags for resource search. Optional setting. |
URL |
URL that you want to connect to. You can enter a URL in one of the following formats:
Required setting. |
Auditd |
This toggle switch enables the auditd mechanism to group auditd event lines received from the connector into an auditd event. If you enable this toggle switch, you cannot select a value in the Delimiter drop-down list because \n is automatically selected for the auditd mechanism. If you enable this toggle switch in the connector settings of the agent, you need to select \n in the Delimiter drop-down list in the connector settings of the collector to which the agent sends events. The maximum size of a grouped auditd event is approximately 4,174,304 characters. KUMA classifies Auditd events in accordance with the algorithm. For example, suppose the following records were received for processing:
The algorithm gives one single-line event of the LOGIN type (because the LOGIN type has code 1006 and it is less than 1300, which is the code of AUDIT_FIRST_EVENT), and one multi-line event with SYSCALL and PROCTITLE. |
Delimiter |
The character that marks the boundary between events:
If you do not select a value in this drop-down list, \n is selected by default. |
Description |
Description of the resource. The maximum length of the description is 4000 Unicode characters. |
Advanced settings tab
Setting |
Description |
|---|---|
Debug |
The switch enables resource logging. The toggle switch is turned off by default. |
Buffer size |
Buffer size in bytes for accumulating events in the RAM of the server before sending them for further processing or storage. The value must be a positive integer. Default buffer size: 1,048,576 bytes (1 MB). Maximum buffer size: 67,108,864 bytes (64 MB). |
Character encoding |
Character encoding. The default is UTF-8. |
Event buffer TTL |
Buffer lifetime for auditd event lines, in milliseconds. Auditd event lines enter the KUMA collector and accumulate in the buffer. This allows multiple auditd event lines to be grouped into a single auditd event. The buffer lifetime countdown begins when the first auditd event line is received or when the previous buffer lifetime expires. Possible values: from 50 to 30,000. The default value is This field is available if you have enabled the Auditd toggle switch on the Basic settings tab. The auditd event lines accumulated in the buffer are kept in the RAM of the server. We recommend caution when increasing the buffer size because memory usage by the KUMA collector may become excessive. You can verify how much server RAM the KUMA collector is using in KUMA metrics. If you want a buffer lifetime to exceed 30,000 milliseconds, we recommend using a different auditd event transport. For example, you can use an agent or pre-accumulate auditd events in a file, and then process this file with the KUMA collector. |
Transport header |
Regular expression for auditd events, which is used to identify auditd event lines. You can use the default value or edit it. The regular expression must contain the You can revert to the default regular expression for auditd events by clicking Reset to default value. |
TLS mode |
TLS encryption mode. When using TLS encryption, you cannot specify an IP address in the URL field on the Basic settings tab. Available values:
|
Compression |
Drop-down list for configuring Snappy compression:
|
Connector, udp type
Connectors of the udp type are used for passively receiving events over UDP when working with Windows and Linux agents. Settings for a connector of the udp type are described in the following tables.
Basic settings tab
Setting |
Description |
|---|---|
Name |
Unique name of the resource. The maximum length of the name is 128 Unicode characters. Required setting. |
Tenant |
The name of the tenant that owns the resource. Required setting. |
Type |
Connector type: udp. Required setting. |
URL |
URL that you want to connect to. You can enter a URL in one of the following formats:
Required setting. |
Auditd |
This toggle switch enables the auditd mechanism to group auditd event lines received from the connector into an auditd event. If you enable this toggle switch, you cannot select a value in the Delimiter drop-down list because \n is automatically selected for the auditd mechanism. If you enable this toggle switch in the connector settings of the agent, you need to select \n in the Delimiter drop-down list in the connector settings of the collector to which the agent sends events. The maximum size of a grouped auditd event is approximately 4,174,304 characters. KUMA classifies Auditd events in accordance with the algorithm. For example, suppose the following records were received for processing:
The algorithm gives one single-line event of the LOGIN type (because the LOGIN type has code 1006 and it is less than 1300, which is the code of AUDIT_FIRST_EVENT), and one multi-line event with SYSCALL and PROCTITLE. |
Delimiter |
The character that marks the boundary between events:
If you do not select a value in this drop-down list, \n is selected by default. |
Description |
Description of the resource. The maximum length of the description is 4000 Unicode characters. |
Advanced settings tab
Setting |
Description |
|---|---|
Debug |
The switch enables resource logging. The toggle switch is turned off by default. |
Buffer size |
Buffer size in bytes for accumulating events in the RAM of the server before sending them for further processing or storage. The value must be a positive integer. Default buffer size: 1,048,576 bytes (1 MB). Maximum buffer size: 67,108,864 bytes (64 MB). |
Number of handlers |
Number of handlers that the service can run simultaneously to process response rules in parallel. To determine the number of handlers, you can use the following formula: (<number of CPUs> / 2) + 2. The value must be a positive integer up to 999. |
Character encoding |
Character encoding. The default is UTF-8. |
Event buffer TTL |
Buffer lifetime for auditd event lines, in milliseconds. Auditd event lines enter the KUMA collector and accumulate in the buffer. This allows multiple auditd event lines to be grouped into a single auditd event. The buffer lifetime countdown begins when the first auditd event line is received or when the previous buffer lifetime expires. Possible values: from 50 to 30,000. The default value is This field is available if you have enabled the Auditd toggle switch on the Basic settings tab. The auditd event lines accumulated in the buffer are kept in the RAM of the server. We recommend caution when increasing the buffer size because memory usage by the KUMA collector may become excessive. You can verify how much server RAM the KUMA collector is using in KUMA metrics. If you want a buffer lifetime to exceed 30,000 milliseconds, we recommend using a different auditd event transport. For example, you can use an agent or pre-accumulate auditd events in a file, and then process this file with the KUMA collector. |
Transport header |
Regular expression for auditd events, which is used to identify auditd event lines. You can use the default value or edit it. The regular expression must contain the You can revert to the default regular expression for auditd events by clicking Reset to default value. |
Compression |
Drop-down list for configuring Snappy compression:
|
Connector, netflow type
Connectors of the netflow type are used for passively receiving events in the NetFlow format. Settings for a connector of the netflow type are described in the following tables.
Basic settings tab
Setting |
Description |
|---|---|
Name |
Unique name of the resource. The maximum length of the name is 128 Unicode characters. Required setting. |
Tenant |
The name of the tenant that owns the resource. Required setting. |
Type |
Connector type: netflow. Required setting. |
Tags |
Tags for resource search. Optional setting. |
URL |
URL that you want to connect to. The following URL formats are supported:
You can add multiple URLs or remove an URL. KUMA does not allow saving a resource or service if the URL field contains a tab or space character. To add an URL, click the + Add button. To remove an URL, click the delete Required setting. |
Description |
Description of the resource. The maximum length of the description is 4000 Unicode characters. |
Advanced settings tab
Setting |
Description |
|---|---|
Debug |
The switch enables resource logging. The toggle switch is turned off by default. |
Buffer size |
Buffer size in bytes for accumulating events in the RAM of the server before sending them for further processing or storage. The value must be a positive integer. Default buffer size: 1,048,576 bytes (1 MB). Maximum buffer size: 67,108,864 bytes (64 MB). |
Number of handlers |
Number of handlers that the service can run simultaneously to process response rules in parallel. To determine the number of handlers, you can use the following formula: (<number of CPUs> / 2) + 2. The value must be a positive integer up to 999. |
Character encoding |
Character encoding. The default is UTF-8. |
Connector, sflow type
Connectors of the sflow type are used for passively receiving events in the sFlow format. For sFlow, only structures described in sFlow version 5 are supported. Settings for a connector of the sflow type are described in the following tables.
Basic settings tab
Setting |
Description |
|---|---|
Name |
Unique name of the resource. The maximum length of the name is 128 Unicode characters. Required setting. |
Tenant |
The name of the tenant that owns the resource. Required setting. |
Type |
Connector type: sflow. Required setting. |
URL |
URL that you want to connect to. You can enter a URL in one of the following formats:
Required setting. |
Description |
Description of the resource. The maximum length of the description is 4000 Unicode characters. |
Advanced settings tab
Setting |
Description |
|---|---|
Debug |
The switch enables resource logging. The toggle switch is turned off by default. |
Buffer size |
Buffer size in bytes for accumulating events in the RAM of the server before sending them for further processing or storage. The value must be a positive integer. Default buffer size: 1,048,576 bytes (1 MB). Maximum buffer size: 67,108,864 bytes (64 MB). |
Number of handlers |
Number of handlers that the service can run simultaneously to process response rules in parallel. To determine the number of handlers, you can use the following formula: (<number of CPUs> / 2) + 2. The value must be a positive integer up to 999. |
Character encoding |
Character encoding. The default is UTF-8. |
Connector, nats-jetstream type
Connectors of the nats-jetstream type are used for interacting with a NATS message broker when working with Windows and Linux agents. Settings for a connector of the nats-jetstream type are described in the following tables.
Basic settings tab
Setting |
Description |
|---|---|
Name |
Unique name of the resource. The maximum length of the name is 128 Unicode characters. Required setting. |
Tenant |
The name of the tenant that owns the resource. Required setting. |
Type |
Connector type: nats-jetstream. Required setting. |
Tags |
Tags for resource search. Optional setting. |
URL |
URL that you want to connect to. The following URL formats are supported:
You can add multiple URLs or remove an URL. KUMA does not allow saving a resource or service if the URL field contains a tab or space character. To add an URL, click the + Add button. To remove an URL, click the delete Required setting. |
Authorization |
Type of authorization when connecting to the URL specified in the URL field:
|
Subject |
The topic of NATS messages. Characters are entered in Unicode encoding. Required setting. |
GroupID. |
The value of the |
Delimiter |
The character that marks the boundary between events:
If you do not select a value in this drop-down list, \n is selected by default. |
Description |
Description of the resource. The maximum length of the description is 4000 Unicode characters. |
Advanced settings tab
Setting |
Description |
|---|---|
Debug |
The switch enables resource logging. The toggle switch is turned off by default. |
Buffer size |
Buffer size in bytes for accumulating events in the RAM of the server before sending them for further processing or storage. The value must be a positive integer. Default buffer size: 1,048,576 bytes (1 MB). Maximum buffer size: 67,108,864 bytes (64 MB). |
Number of handlers |
Number of handlers that the service can run simultaneously to process response rules in parallel. To determine the number of handlers, you can use the following formula: (<number of CPUs> / 2) + 2. The value must be a positive integer up to 999. |
Character encoding |
Character encoding. The default is UTF-8. |
TLS mode |
TLS encryption mode. When using TLS encryption, you cannot specify an IP address in the URL field on the Basic settings. Available values:
|
Compression |
Drop-down list for configuring Snappy compression:
|
Connector, kafka type
Connectors of the kafka type are used for communicating with the Apache Kafka data bus when working with Windows and Linux agents. Settings for a connector of the kafka type are described in the following tables.
Basic settings tab
Setting |
Description |
|---|---|
Name |
Unique name of the resource. The maximum length of the name is 128 Unicode characters. Required setting. |
Tenant |
The name of the tenant that owns the resource. Required setting. |
Type |
Connector type: kafka. Required setting. |
Tags |
Tags for resource search. Optional setting. |
URL |
URL that you want to connect to. The following URL formats are supported:
You can add multiple URLs or remove an URL. KUMA does not allow saving a resource or service if the URL field contains a tab or space character. To add an URL, click the + Add button. To remove an URL, click the delete Required setting. |
Authorization |
Type of authorization when connecting to the URL specified in the URL field:
|
Topic |
Subject of Kafka messages. The maximum length of the subject is 255 characters. Space and tab characters are not allowed. You can use the following characters: a–z, A–Z, 0–9, ".", "_", "-". Required setting. |
GroupID. |
The value of the |
Delimiter |
The character that marks the boundary between events:
If you do not select a value in this drop-down list, \n is selected by default. |
Description |
Description of the resource. The maximum length of the description is 4000 Unicode characters. |
Advanced settings tab
Setting |
Description |
|---|---|
Debug |
The switch enables resource logging. The toggle switch is turned off by default. |
Number of handlers |
Number of handlers that the service can run simultaneously to process response rules in parallel. To determine the number of handlers, you can use the following formula: (<number of CPUs> / 2) + 2. The value must be a positive integer up to 999. |
Character encoding |
Character encoding. The default is UTF-8. |
TLS mode |
TLS encryption mode. When using TLS encryption, you cannot specify an IP address in the URL field on the Basic settings. Available values:
|
Size of message to fetch |
Size of one message in the request, in bytes. The default value of 16 MB is applied if no value is specified or 0 is specified. It cannot exceed 2147483647 bytes. |
Maximum fetch wait time |
Timeout for one message in seconds. The default value of 5 seconds is applied if no value is specified or 0 is specified. Maximum possible value: 2147483647. |
Connection timeout |
Kafka broker connection timeout in seconds. Maximum possible value: 2147483647. The default value is 30 seconds. |
Read timeout |
Read operation timeout in seconds. Maximum possible value: 2147483647. The default value is 30 seconds. |
Write timeout |
Write operation timeout in seconds. Maximum possible value: 2147483647. The default value is 30 seconds. |
Group status update interval |
Group status update interval in seconds Cannot exceed session time. The recommended value is 1/3 of the session time. Maximum possible value: 2147483647. The default value is 30 seconds. |
Session time |
Session time in seconds. Maximum possible value: 2147483647. The default value is 30 seconds. |
Maximum time to process one message |
Maximum time to process one message by a single thread, in milliseconds. Maximum possible value: 2147483647. The default value is 100 milliseconds. |
Enable autocommit |
Enabled by default. |
Autocommit interval |
Autocommit interval in seconds The default value is 1 second. Maximum possible value: 18446744073709551615. Any positive number can be specified. |
PFX secret |
Secret of the pfx type. This field is available if Authorization is set to PFX. You can select an existing secret or create a new secret. To create a new secret, select Create new. Required field. |
Secret |
Secret of the 'credentials' type. This field is available if Authorization is set to Plain. You can select an existing secret or create a new secret. To create a new secret, select Create new. Required field. |
Connector, http type
Connectors of the http type are used for receiving events over HTTP when working with Windows and Linux agents. Settings for a connector of the http type are described in the following tables.
Basic settings tab
Setting |
Description |
|---|---|
Name |
Unique name of the resource. The maximum length of the name is 128 Unicode characters. Required setting. |
Tenant |
The name of the tenant that owns the resource. Required setting. |
Type |
Connector type: http. Required setting. |
Tags |
Tags for resource search. Optional setting. |
URL |
URL that you want to connect to. You can enter a URL in one of the following formats:
Required setting. |
Delimiter |
The character that marks the boundary between events:
If you do not select a value in this drop-down list, \n is selected by default. |
Description |
Description of the resource. The maximum length of the description is 4000 Unicode characters. |
Advanced settings tab
Setting |
Description |
|---|---|
Debug |
The switch enables resource logging. The toggle switch is turned off by default. |
Character encoding |
Character encoding. The default is UTF-8. |
TLS mode |
TLS encryption mode. When using TLS encryption, you cannot specify an IP address in the URL field on the Basic settings tab. Available values:
|
Connector, sql type
Connectors of the sql type are used for querying databases. KUMA supports multiple types of databases. When creating a connector of the sql type, you must specify general connector settings and individual database connection settings. Settings for a connector of the sql type are described in the following tables.
Basic settings tab
Setting |
Description |
|---|---|
Name |
Unique name of the resource. The maximum length of the name is 128 Unicode characters. Required setting. |
Tenant |
The name of the tenant that owns the resource. Required setting. |
Type |
Connector type: sql. Required setting. |
Tags |
Tags for resource search. Optional setting. |
Default query |
SQL query that is executed when connecting to the database. Required setting. |
Reconnect to the database every time a query is sent |
This toggle enables reconnection of the connector to the database every time a query is sent. This toggle switch is turned off by default. |
Poll interval, sec |
Interval for executing SQL queries in seconds. The default value is 10 seconds. |
Connection |
Database connection settings:
You can add multiple connections or delete a connection. To add a connection, click the + Add connection button. To remove a connection, click the delete |
Description |
Description of the resource. The maximum length of the description is 4000 Unicode characters. |
Advanced settings tab
Setting |
Description |
|---|---|
Debug |
The switch enables resource logging. The toggle switch is turned off by default. |
Character encoding |
Character encoding. The default is UTF-8. KUMA converts SQL responses to UTF-8 encoding. You can configure the SQL server to send responses in UTF-8 encoding or change the encoding of incoming messages on the KUMA side. |
Within a single connector, you can create a connection for multiple supported databases. If a collector with a connector of the sql type cannot be started, check if the /opt/kaspersky/kuma/collector/<collector ID>/sql/state-<file ID> state file is empty. If the state file is empty, delete it and restart the collector.
Supported SQL types and their specific usage features
The following SQL types are supported:
- MSSQL.
For example:
sqlserver://{user}:{password}@{server:port}/{instance_name}?database={database}
We recommend using this URL variant.
sqlserver://{user}:{password}@{server}?database={database}
The characters
@p1are used as a placeholder in the SQL query.If you want to connect using domain account credentials, specify the account name in
<domain>%5C<user>format. For example:sqlserver://domain%5Cuser:password@ksc.example.com:1433/SQLEXPRESS?database=KAV. - MySQL/MariaDB
For example:
mysql://{user}:{password}@tcp({server}:{port})/{database}The characters
?are used as placeholders in the SQL query. - PostgreSQL.
For example:
postgres://{user}:{password}@{server}/{database}?sslmode=disableThe characters
$1are used as a placeholder in the SQL query. - CockroachDB
For example:
postgres://{user}:{password}@{server}:{port}/{database}?sslmode=disableThe characters
$1are used as a placeholder in the SQL query. - SQLite3
For example:
sqlite3://file:{file_path}A question mark (
?) is used as a placeholder in the SQL query.When querying SQLite3, if the initial value of the ID is in datetime format, you must add a date conversion with the
sqlite datetimefunction to the SQL query. For example:select * from connections where datetime(login_time) > datetime(?, 'utc') order by login_timeIn this example,
connectionsis the SQLite table, and the value of the variable?is taken from the Identity seed field, and it must be specified in the{<date>}T{<time>}Zformat, for example,2021-01-01T00:10:00Z). - Oracle DB
Example URL of a secret with the 'oracle' driver:
oracle://{user}:{password}@{server}:{port}/{service_name}oracle://{user}:{password}@{server}:{port}/?SID={SID_VALUE}If the query execution time exceeds 30 seconds, the oracle driver aborts the SQL request, and the following error appears in the collector log: user requested cancel of current operation. To increase the execution time of an SQL query, specify the value of the timeout parameter in seconds in the connection string, for example:
oracle://{user}:{password}@{server}:{port}/{service_name}?timeout=300The
:valvariable is used as a placeholder in the SQL query.When querying Oracle DB, if the identity seed is in the datetime format, you must consider the type of the field in the database and, if necessary, add conversions of the time string in the SQL query to make sure the SQL connector works correctly. For example, if the
Connectionstable in the database has alogin_timefield, the following conversions are possible:- If the login_time field has the TIMESTAMP type, then depending on the configuration of the database, the login_time field may contain a value in the
YYYY-MM-DD HH24:MI:SSformat, for example,2021-01-01 00:00:00. In this case, you need to specify2021-01-01T00:00:00Zin the Identity seed field, and in the SQL query, perform the conversion using theto_timestampfunction, for example:select * from connections where login_time > to_timestamp(:val, 'YYYY-MM-DD"T"HH24:MI:SS"Z"') - If the login_time field has the TIMESTAMP WITH TIME ZONE type, then depending on the configuration of the database, the login_time field may contain a value in the
YYYY-MM-DD"T"HH24:MI:SSTZH:TZMformat (for example,2021-01-01T00:00:00+03:00). In this case, you need to specify2021-01-01T00:00:00+03:00in the Identity seed field, and in the SQL query, perform the conversion using theto_timestamp_tzfunction, for example:select * from connections_tz where login_time > to_timestamp_tz(:val, 'YYYY-MM-DD"T"HH24:MI:SSTZH:TZM')For details about the
to_timestampandto_timestamp_tzfunctions, please refer to the official Oracle documentation.
To interact with Oracle DB, you must install the libaio1 Astra Linux package.
- If the login_time field has the TIMESTAMP type, then depending on the configuration of the database, the login_time field may contain a value in the
- Firebird SQL
For example:
firebirdsql://{user}:{password}@{server}:{port}/{database}A question mark (
?) is used as a placeholder in the SQL query.If a problem occurs when connecting Firebird on Windows, use the full path to the database file, for example:
firebirdsql://{user}:{password}@{server}:{port}/C:\Users\user\firebird\db.FDB - ClickHouse
For example:
clickhouse://{user}:{password}@{server}:{port}/{database}A question mark (
?) is used as a placeholder in the SQL query.KUMA supports the following data types:
- Data that can be cast to string (such as strings, numeric values, and BLOBs) is displayed as strings.
- Arrays and maps are displayed in JSON format or using the built-in
go fmt.Sprintf("%v",v)function to display them in the best possible way.
Two methods of connecting to ClickHouse are possible:
- Without credentials, by entering a URL:
clickhouse://host:port/database - With credentials, by entering a URL:
clickhouse://user:password@host:port/database
When using TLS encryption, by default, the connector works only on port 9440. If TLS encryption is not used, by default, the connector works with ClickHouse only on port 9000.
The connector does not work over HTTP.
If TLS encryption mode is configured on the ClickHouse server, and in connector settings, in the TLS mode drop-down list, you have selected Disabled or vice versa, the database connection cannot be established.
The TLS mode is used only if the ClickHouse driver is specified.
If you want to connect to the KUMA ClickHouse, in the SQL connector settings, specify the PublicPKI secret type, which contains the base64-encoded PEM private key and the public key.
In the parameters of the SQL connector for the ClickHouse connection type, you need to select Disabled in the TLS mode drop-down list. This value must not be specified if a certificate is used for authentication. If in the TLS mode drop-down list, you select Custom CA, you need to specify the ID of a secret of the 'certificate' type in the Identity column field. You also need to select one of the following values in the Authorization type drop-down list:
- Disabled. If you select this value, you need to leave the Identity column field blank.
- Plain. Select this value if the Secret separately check box is selected and the ID of a secret of the 'credentials' type is specified in the Identity column field.
- PublicPKI. Select this value if the Secret separately check box is selected and the ID of a secret of the PublicPKI type is specified in the Identity column field.
If the initial value of the ID contains an indication of time (
datetime), in the query, you must use a variable for time conversion (parseDateTimeBestEffort). For example, if the time is specified as2021-01-01 00:10:00, the following query may be used:select connections, username, host, login_time from connections where login_time > parseDateTimeBestEffort(?) order by login_time
A sequential request for database information is supported in SQL queries. For example, if in the Query field, you enter select * from <name of data table> where id > <placeholder>, the value of the Identity seed field is used as the placeholder value the first time you query the table. In addition, the service that utilizes the SQL connector saves the ID of the last read entry, and the ID of this entry will be used as the placeholder value in the next query to the database.
We recommend adding the order by command to the query string, followed by the sorting field. For example, select * from table_name where id > ? order by id.
Connector, file type
Connectors of the file type are used for getting data from text files when working with Windows and Linux agents. One line of a text file is considered to be one event. \n is used as the newline character.
If while creating the collector at the Transport step of the Installation Wizard, you specified a connector of the file type, at the Event parsing in the Mapping table, you can pass the name of the file being processed by the collector or the path to the file in the KUMA event field. To do this, in the Source column, specify one of the following values:
$kuma_fileSourceNameto pass the name of the file being processed by the collector in the KUMA event field.$kuma_fileSourcePathto pass the path to the file being processed by the collector in the KUMA event field.
When you use a file connector, the new variables in the normalizer will only work with destinations of the internal type.
To read Windows files, you need to create a connector of the file type and manually install the agent on Windows. The Windows agent must not read its files in the folder where the agent is installed. The connector will work even with a FAT file system; if the disk is defragmented, the connector re-reads all files from scratch because all inodes of files are reset.
We do not recommend running the agent under an administrator account; read permissions for folders/files must be configured for the user account of the agent. We do not recommend installing the agent on important systems; it is preferable to send the logs and read them on dedicated hosts with the agent.
For each file that the connector of the file type interacts with, a state file (states.ini) is created with the offset, dev, inode, and filename parameters. The state file allows the connector, to resume reading from the position where the connector last stopped instead of starting over when rereading the file. Some special considerations are involved in rereading files:
- If the
inodeparameter in the state file changes, the connector rereads the corresponding file from the beginning. When the file is deleting and recreated, theinodesetting in the associated state file may remain unchanged. In this case, when rereading the file, the connector resumes reading in accordance with theoffsetparameter. - If the file has been truncated or its size has become smaller, the connector start reading from the beginning.
- If the file has been renamed, when rereading the file, the connector resumes reading from the position where the connector last stopped.
- If the directory with the file has been remounted, when rereading the file, the connector resumes reading from the position where the connector last stopped. You can specify the path to the files with which the connector interacts when configuring the connector in the File path field.
Settings for a connector of the file type are described in the following tables.
Basic settings tab
Setting |
Description |
|---|---|
Name |
Unique name of the resource. The maximum length of the name is 128 Unicode characters. Required setting. |
Tenant |
The name of the tenant that owns the resource. Required setting. |
Type |
Connector type: file. Required setting. |
Tags |
Tags for resource search. Optional setting. |
Path to the file. |
The full path to the file that the connector interacts with. For example,
File and folder mask templates Limitations when using prefixes in file paths Limiting the number of files for watching by mask Required setting. |
Update timeout, sec |
The time in seconds for which the file must not be updated for KUMA to apply the action specified in the Timeout action drop-down list to the file. Default value: The entered value must not be less than the value that you entered on the Advanced settings in the Poll interval, sec field. |
Timeout action |
The action that KUMA applies to the file after the time specified in the Update timeout, sec:
|
Auditd |
This toggle switch enables the auditd mechanism to group auditd event lines received from the connector into an auditd event. If you enable this toggle switch, you cannot select a value in the Delimiter drop-down list because \n is automatically selected for the auditd mechanism. If you enable this toggle switch in the connector settings of the agent, you need to select \n in the Delimiter drop-down list in the connector settings of the collector to which the agent sends events. The maximum size of a grouped auditd event is approximately 4,174,304 characters. KUMA classifies Auditd events in accordance with the algorithm. For example, suppose the following records were received for processing:
The algorithm gives one single-line event of the LOGIN type (because the LOGIN type has code 1006 and it is less than 1300, which is the code of AUDIT_FIRST_EVENT), and one multi-line event with SYSCALL and PROCTITLE. |
Description |
Description of the resource. The maximum length of the description is 4000 Unicode characters. |
Advanced settings tab
Setting |
Description |
|---|---|
Debug |
The switch enables resource logging. The toggle switch is turned off by default. |
Buffer size |
Buffer size in bytes for accumulating events in the RAM of the server before sending them for further processing or storage. The value must be a positive integer. Default buffer size: 1,048,576 bytes (1 MB). Maximum buffer size: 67,108,864 bytes (64 MB). |
Number of handlers |
Number of handlers that the service can run simultaneously to process response rules in parallel. To determine the number of handlers, you can use the following formula: (<number of CPUs> / 2) + 2. The value must be a positive integer up to 999. |
File/folder polling mode |
Specifies how the connector rereads files in the directory:
|
Poll interval, ms |
The interval in milliseconds at which the connector rereads files in the directory. Default value: The entered value must not be less than the value that you entered on the Basic settings in the Update timeout, sec field. We recommend entering a value less than the value that you entered in the Event buffer TTL field because this may adversely affect the performance of Auditd. |
Character encoding |
Character encoding. The default is UTF-8. |
Event buffer TTL |
Buffer lifetime for auditd event lines, in milliseconds. Auditd event lines enter the KUMA collector and accumulate in the buffer. This allows multiple auditd event lines to be grouped into a single auditd event. The buffer lifetime countdown begins when the first auditd event line is received or when the previous buffer lifetime expires. Possible values: 700 to 30,000. The default value is This field is available if you have enabled the Auditd toggle switch on the Basic settings tab. The auditd event lines accumulated in the buffer are kept in the RAM of the server. We recommend caution when increasing the buffer size because memory usage by the KUMA collector may become excessive. You can verify how much server RAM the KUMA collector is using in KUMA metrics. If you want a buffer lifetime to exceed 30,000 milliseconds, we recommend using a different auditd event transport. For example, you can use an agent or pre-accumulate auditd events in a file, and then process this file with the KUMA collector. |
Transport header |
Regular expression for auditd events, which is used to identify auditd event lines. You can use the default value or edit it. The regular expression must contain the You can revert to the default regular expression for auditd events by clicking Reset to default value. |
Connector, 1c-log type
Connectors of the 1c-log type are used for getting data from 1C technology logs when working with Linux agents. \n is used as the newline character. The connector accepts only the first line from a multi-line event record.
Settings for a connector of the 1c-log type are described in the following tables.
Basic settings tab
Setting |
Description |
|---|---|
Name |
Unique name of the resource. The maximum length of the name is 128 Unicode characters. Required setting. |
Tenant |
The name of the tenant that owns the resource. Required setting. |
Type |
Connector type: 1c-log. Required setting. |
Tags |
Tags for resource search. Optional setting. |
Directory path |
The full path to the directory with the files that you want to interact with, for example, Limitations when using prefixes in file paths Required setting. |
Description |
Description of the resource. The maximum length of the description is 4000 Unicode characters. |
Advanced settings tab
Setting |
Description |
|---|---|
Debug |
The switch enables resource logging. The toggle switch is turned off by default. |
Buffer size |
Buffer size in bytes for accumulating events in the RAM of the server before sending them for further processing or storage. The value must be a positive integer. Default buffer size: 1,048,576 bytes (1 MB). Maximum buffer size: 67,108,864 bytes (64 MB). |
File/folder polling mode |
Specifies how the connector rereads files in the directory:
|
Poll interval, ms |
The interval in milliseconds at which the connector rereads files in the directory. Default value: |
Character encoding |
Buffer size in bytes for accumulating events in the RAM of the server before sending them for further processing or storage. The value must be a positive integer. Default buffer size: 1,048,576 bytes (1 MB). Maximum buffer size: 67,108,864 bytes (64 MB). |
Connector operation diagram:
- All 1C technology log files are searched. Log file requirements:
- Files with the LOG extension are created in the log directory (
/var/log/1c/logs/by default) within a subdirectory for each process.Example of a supported 1C technology log structure
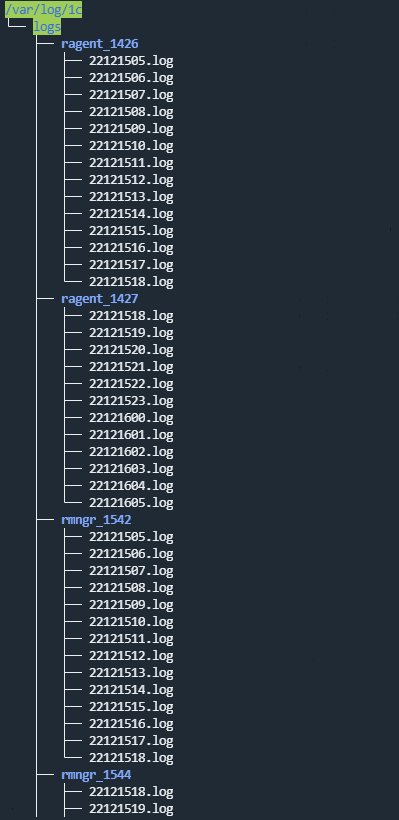
- Events are logged to a file for an hour; after that, the next log file is created.
- The file names have the following format: <YY><MM><DD><HH>.log. For example, 22111418.log is a file created in 2022, in the 11th month, on the 14th at 18:00.
- Each event starts with the event time in the following format: <mm>:<ss>.<microseconds>-<duration in microseconds>.
- Files with the LOG extension are created in the log directory (
- The processed files are discarded. Information about processed files is stored in the file /<collector working directory>/1c_log_connector/state.json.
- Processing of the new events starts, and the event time is converted to the RFC3339 format.
- The next file in the queue is processed.
Connector limitations:
- Installation of a collector with a 1c-log connector is not supported in a Windows operating system. To set up transfer of 1C log files for processing by the KUMA collector:
- On the Windows server, grant read access over the network to the folder with the 1C log files.
- On the Linux server, mount the shared folder with the 1C log files on the Linux server (see the list of supported operating systems).
- On the Linux server, install the collector that you want to process 1C log files from the mounted shared folder.
- Only the first line from a multi-line event record is processed.
- The normalizer processes only the following types of events:
- ADMIN
- ATTN
- CALL
- CLSTR
- CONN
- DBMSSQL
- DBMSSQLCONN
- DBV8DBENG
- EXCP
- EXCPCNTX
- HASP
- LEAKS
- LIC
- MEM
- PROC
- SCALL
- SCOM
- SDBL
- SESN
- SINTEG
- SRVC
- TLOCK
- TTIMEOUT
- VRSREQUEST
- VRSRESPONSE
Connector, 1c-xml type
Connectors of the 1c-xml type are used for getting data from 1C registration logs when working with Linux agents. When the connector handles multi-line events, it converts them into single-line events.
Settings for a connector of the 1c-xml type are described in the following tables.
Basic settings tab
Setting |
Description |
|---|---|
Name |
Unique name of the resource. The maximum length of the name is 128 Unicode characters. Required setting. |
Tenant |
The name of the tenant that owns the resource. Required setting. |
Type |
Connector type: 1c-xml. Required setting. |
Tags |
Tags for resource search. Optional setting. |
Directory path |
The full path to the directory with the files that you want to interact with, for example, Limitations when using prefixes in file paths Required setting. |
Description |
Description of the resource. The maximum length of the description is 4000 Unicode characters. |
Advanced settings tab
Setting |
Description |
|---|---|
Debug |
The switch enables resource logging. The toggle switch is turned off by default. |
Buffer size |
Buffer size in bytes for accumulating events in the RAM of the server before sending them for further processing or storage. The value must be a positive integer. Default buffer size: 1,048,576 bytes (1 MB). Maximum buffer size: 67,108,864 bytes (64 MB). |
File/folder polling mode |
Specifies how the connector rereads files in the directory:
|
Poll interval, ms |
The interval in milliseconds at which the connector rereads files in the directory. Default value: |
Character encoding |
Character encoding. The default is UTF-8. |
Connector operation diagram:
- The files containing 1C logs with the XML extension are searched within the specified directory. Logs are placed in the directory either manually or using an application written in the 1C language, for example, using the
ВыгрузитьЖурналРегистрации()function. The connector only supports logs received this way. For more information on how to obtain 1C logs, see the official 1C documentation. - Files are sorted by the last modification time in ascending order. All the files modified before the last read are discarded.
Information about processed files is stored in the file /<collector working directory>/1c_xml_connector/state.ini and has the following format:
offset=<number>\ndev=<number>\ninode=<number>. - Events are defined in each unread file.
- Events from the file are processed one by one. Multi-line events are converted to single-line events.
Connector limitations:
- Installation of a collector with a 1c-xml connector is not supported in a Windows operating system. To set up transfer of 1C log files for processing by the KUMA collector:
- On the Windows server, grant read access over the network to the folder with the 1C log files.
- On the Linux server, mount the shared folder with the 1C log files on the Linux server (see the list of supported operating systems).
- On the Linux server, install the collector that you want to process 1C log files from the mounted shared folder.
- Files with an incorrect event format are not read. For example, if event tags in the file are in Russian, the collector does not read such events.
Example of a correct XML file with an event.
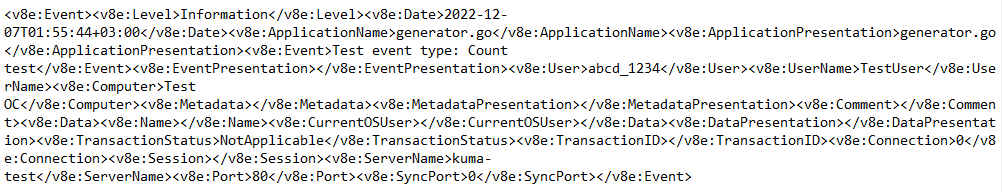
- If a file read by the connector is enriched with the new events and if this file is not the last file read in the directory, all events from the file are processed again.
Connector, diode type
Connectors of the diode type are used for unidirectional data transmission in industrial ICS networks using data diodes. Settings for a connector of the diode type are described in the following tables.
Basic settings tab
Setting |
Description |
|---|---|
Name |
Unique name of the resource. The maximum length of the name is 128 Unicode characters. Required setting. |
Tenant |
The name of the tenant that owns the resource. Required setting. |
Type |
Connector type: diode. Required setting. |
Tags |
Tags for resource search. Optional setting. |
Directory with events from the data diode |
Full path to the directory on the KUMA collector server, into which the data diode moves files with events from the isolated network segment. After the connector has read these files, the files are deleted from the directory. Maximum length of the path: 255 Unicode characters. Limitations when using prefixes in paths Required setting. |
Delimiter |
The character that marks the boundary between events:
If you do not select a value in this drop-down list, \n is selected by default. You must select the same value in the Delimiter drop-down list in the settings of the connector and the destination being used to transmit events from the isolated network segment using a data diode. |
Description |
Description of the resource. The maximum length of the description is 4000 Unicode characters. |
Advanced settings tab
Setting |
Description |
|---|---|
Debug |
The switch enables resource logging. The toggle switch is turned off by default. |
Number of handlers |
Number of handlers that the service can run simultaneously to process response rules in parallel. To determine the number of handlers, you can use the following formula: (<number of CPUs> / 2) + 2. The value must be a positive integer up to 999. |
Poll interval, sec |
Interval at which the files are read from the directory containing events from the data diode. The default value is 2 seconds. |
Character encoding |
Character encoding. The default is UTF-8. |
Compression |
Drop-down list for configuring Snappy compression:
You must select the same value in the Snappy drop-down list in the settings of the connector and the destination being used to transmit events from the isolated network segment using a data diode. |
Connector, ftp type
Connectors of the ftp type are used for getting data over File Transfer Protocol (FTP) when working with Windows and Linux agents. Settings for a connector of the ftp type are described in the following tables.
Basic settings tab
Setting |
Description |
|---|---|
Name |
Unique name of the resource. The maximum length of the name is 128 Unicode characters. Required setting. |
Tenant |
The name of the tenant that owns the resource. Required setting. |
Type |
Connector type: ftp. Required setting. |
Tags |
Tags for resource search. Optional setting. |
URL |
URL of file or file mask that begins with the If the URL does not contain the port number of the FTP server, port Required setting. |
Secret |
|
Description |
Description of the resource. The maximum length of the description is 4000 Unicode characters. |
Advanced settings tab
Setting |
Description |
|---|---|
Debug |
The switch enables resource logging. The toggle switch is turned off by default. |
Character encoding |
Character encoding. The default is UTF-8. |
Connector, nfs type
Connectors of the nfs type are used for getting data over Network File System (NFS) when working with Windows and Linux agents. Settings for a connector of the nfs type are described in the following tables.
Basic settings tab
Setting |
Description |
|---|---|
Name |
Unique name of the resource. The maximum length of the name is 128 Unicode characters. Required setting. |
Tenant |
The name of the tenant that owns the resource. Required setting. |
Type |
Connector type: nfs. Required setting. |
Tags |
Tags for resource search. Optional setting. |
URL |
Path to the remote directory in the Required setting. |
File name mask |
A mask used to filter files containing events. The following wildcards are acceptable " |
Poll interval, sec |
Poll interval in seconds. The time interval after which files are re-read from the remote system. The default value is |
Description |
Description of the resource. The maximum length of the description is 4000 Unicode characters. |
Advanced settings tab
Setting |
Description |
|---|---|
Debug |
The switch enables resource logging. The toggle switch is turned off by default. |
Character encoding |
Character encoding. The default is UTF-8. |
Connector, wmi type
Connectors of the wmi type are used for getting data using Windows Management Instrumentation when working with Windows agents. Settings for a connector of the wmi type are described in the following tables.
Basic settings tab
Setting |
Description |
|---|---|
Name |
Unique name of the resource. The maximum length of the name is 128 Unicode characters. Required setting. |
Tenant |
The name of the tenant that owns the resource. Required setting. |
Type |
Connector type: wmi. Required setting. |
Tags |
Tags for resource search. Optional setting. |
Description |
Description of the resource. The maximum length of the description is 4000 Unicode characters. |
URL |
URL of the collector that you created to receive data using Windows Management Instrumentation, for example, When a collector is created, an agent is automatically created that will get data on the remote device and forward it to the collector service. If you know which server the collector service will be installed on, the URL is known in advance. You can enter the URL of the collector in the URL field after completing the Installation Wizard. To do so, you first need to copy the URL of the collector in the Resources → Active services section. Required setting. |
Default credentials |
No value. You need to specify credentials for connecting to hosts in the Remote hosts table. |
Remote hosts |
Settings of remote Windows devices to connect to.
You can add multiple remote Windows devices or remove a remote Windows device. To add a remote Windows device, click + Add. To remove a remote Windows device, select the check box next to it and click Delete. |
Advanced settings tab
Setting |
Description |
|---|---|
Debug |
The switch enables resource logging. The toggle switch is turned off by default. |
Character encoding |
Character encoding. The default is UTF-8. |
TLS mode |
TLS encryption mode. When using TLS encryption, you cannot specify an IP address in the URL field on the Basic settings. Available values:
|
Compression |
Drop-down list for configuring Snappy compression:
|
If you edit a connector of this type, the TLS mode and Compression settings are visible and available on the connector resource as well as the collector. If you are using a connector of this type on a collector, the values of TLS mode and Compression settings are sent to the destination of automatically created agents.
Receiving events from a remote device
Conditions for receiving events from a remote Windows device hosting a KUMA agent:
- To start the KUMA agent on the remote device, you must use an account with the “Log on as a service” permissions.
- To receive events from the KUMA agent, you must use an account with Event Log Readers permissions. For domain servers, one such user account can be created so that a group policy can be used to distribute its rights to read logs to all servers and workstations in the domain.
- TCP ports 135, 445, and 49152–65535 must be opened on the remote Windows devices.
- You must run the following services on the remote machines:
- Remote Procedure Call (RPC)
- RPC Endpoint Mapper
Connector, wec type
Connectors of the wec type are used for getting data using Windows Event Forwarding (WEF) and Windows Event Collector (WEC), or local operating system logs of a Windows host when working with Windows agents. Settings for a connector of the wec type are described in the following tables.
Basic settings tab
Setting |
Description |
|---|---|
Name |
Unique name of the resource. The maximum length of the name is 128 Unicode characters. Required setting. |
Tenant |
The name of the tenant that owns the resource. Required setting. |
Type |
Connector type: wec. Required setting. |
Tags |
Tags for resource search. Optional setting. |
URL |
URL of the collector that you created to receive data using Windows Event Collector, for example, When a collector is created, an agent is automatically created that will get data on the remote device and forward it to the collector service. If you know which server the collector service will be installed on, the URL is known in advance. You can enter the URL of the collector in the URL field after completing the Installation Wizard. To do so, you first need to copy the URL of the collector in the Resources → Active services section. Required setting. |
Windows logs |
The names of the Windows logs that you want to get. By default, this drop-down list includes only preconfigured logs, but you can add custom log to the list. To do so, enter the names of the custom logs in the Windows logs field, then press ENTER. KUMA service and resource configurations may require additional changes in order to process custom logs correctly. Preconfigured logs:
If the name of at least one log is specified incorrectly, the agent using the connector does not receive events from any log, even if the names of other logs are correct. |
Description |
Description of the resource. The maximum length of the description is 4000 Unicode characters. |
Advanced settings tab
Setting |
Description |
|---|---|
Debug |
The switch enables resource logging. The toggle switch is turned off by default. |
Character encoding |
Character encoding. The default is UTF-8. |
TLS mode |
TLS encryption mode. When using TLS encryption, you cannot specify an IP address in the URL field on the Basic settings. Available values:
|
Compression |
Drop-down list for configuring Snappy compression:
|
If you edit a connector of this type, the TLS mode and Compression settings are visible and available on the connector resource as well as the collector. If you are using a connector of this type on a collector, the values of TLS mode and Compression settings are sent to the destination of automatically created agents.
To start the KUMA agent on the remote device, you must use a service account with the “Log on as a service” permissions. To receive events from the operating system log, the service user account must also have Event Log Readers permissions.
You can create one user account with “Log on as a service” and “Event Log Readers” permissions, and then use a group policy to extend the rights of this account to read the logs to all servers and workstations in the domain.
We recommend that you disable interactive logon for the service account.
Page top
Connector, etw type
Connectors of the etw type are used for getting extended logs of DNS servers. Settings for a connector of the etw type are described in the following tables.
Basic settings tab
Setting |
Description |
|---|---|
Name |
Unique name of the resource. The maximum length of the name is 128 Unicode characters. Required setting. |
Tenant |
The name of the tenant that owns the resource. Required setting. |
Type |
Connector type: etw. Required setting. |
Tags |
Tags for resource search. Optional setting. |
URL |
URL of the DNS server. Required setting. |
Session name |
Session name that corresponds to the ETW provider: Microsoft-Windows-DNSServer {EB79061A-A566-4698-9119-3ED2807060E7}. If in a connector of the etw type, the session name is specified incorrectly, an incorrect provider is specified in the session, or an incorrect method is specified for sending events (to send events correctly, on the Windows Server side, you must specify "Real time" or "File and Real time" mode), events will not arrive from the agent, an error will be recorded in the agent log on Windows, and the status of the agent will be green. At the same time, no attempt will be made to get events every 60 seconds. If you modify session settings on the Windows side, you must restart the etw agent and/or the session for the changes to take effect. For details about specifying session settings on the Windows side to receive DNS server events, see the Configuring receipt of DNS server events using the ETW agent section. Required setting. |
Extract event information |
This toggle switch enables the extraction of the minimum set of event information that can be obtained without having to download third-party metadata from the disk. This method helps conserve CPU resources on the computer with the agent. By default, this toggle switch is enabled and all event data is extracted. |
Extract event properties |
This toggle switch enables the extraction of event properties. If this toggle switch is disabled, event properties are not extracted, which helps save CPU resources on the machine with the agent. By default, this toggle switch is enabled and event properties are extracted. You can enable the Extract event properties switch only if the Extract event information toggle switch is enabled. |
Description |
Description of the resource. The maximum length of the description is 4000 Unicode characters. |
Advanced settings tab
Setting |
Description |
|---|---|
Debug |
The switch enables resource logging. The toggle switch is turned off by default. |
Character encoding |
Character encoding. The default is UTF-8. |
TLS mode |
TLS encryption mode. When using TLS encryption, you cannot specify an IP address in the URL field on the Basic settings. Available values:
|
Compression |
Drop-down list for configuring Snappy compression:
|
If you edit a connector of this type, the TLS mode and Compression settings are visible and available on the connector resource as well as the collector. If you are using a connector of this type on a collector, the values of TLS mode and Compression settings are sent to the destination of automatically created agents.
Page top
Connector, snmp type
Connectors of the snmp type are used for getting data over Simple Network Management Protocol (SNMP) when working with Windows and Linux agents. To process events received over SNMP, you must use the json normalizer. Supported SNMP protocol versions:
- snmpV1
- snmpV2
- snmpV3
Only one snmp connector created in the agent settings can be used in an agent. If you need to use multiple snmp connectors, you must create one or all snmp connectors as a separate resource and select it in the connection settings.
Available settings for a connector of the snmp type are described in the following tables.
Basic settings tab
Setting |
Description |
|---|---|
Name |
Unique name of the resource. The maximum length of the name is 128 Unicode characters. Required setting. |
Tenant |
The name of the tenant that owns the resource. Required setting. |
Type |
Connector type: snmp. Required setting. |
Tags |
Tags for resource search. Optional setting. |
Description |
Description of the resource. The maximum length of the description is 4000 Unicode characters. |
SNMP resource |
Settings for connecting to an SNMP resource:
You can add multiple connections to SNMP resources or delete an SNMP resource connection. To create a connection to an SNMP resource, click the + SNMP resource button. To delete a connection to an SNMP resource, click the delete |
Settings |
Rules for naming the received data, according to which OIDs (object identifiers) are converted to the keys with which the normalizer can interact. Available settings:
You can do the following with rules:
|
Advanced settings tab
Setting |
Description |
|---|---|
Debug |
The switch enables resource logging. The toggle switch is turned off by default. |
Character encoding |
Character encoding. The default is UTF-8. |
Connector, snmp-trap type
Connectors of the snmp-trap type are used for passively receiving events using SNMP traps when working with Windows and Linux agents. The connector receives snmp-trap events and prepares them for normalization by mapping SNMP object IDs to temporary keys. Then the message is passed to the JSON normalizer, where the temporary keys are mapped to the KUMA fields and an event is generated. To process events received over SNMP, you must use the json normalizer. Supported SNMP protocol versions:
- snmpV1
- snmpV2
Settings for a connector of the snmp-trap type are described in the following tables.
Basic settings tab
Setting |
Description |
|---|---|
Name |
Unique name of the resource. The maximum length of the name is 128 Unicode characters. Required setting. |
Tenant |
The name of the tenant that owns the resource. Required setting. |
Type |
Connector type: snmp-trap. Required setting. |
Tags |
Tags for resource search. Optional setting. |
Description |
Description of the resource. The maximum length of the description is 4000 Unicode characters. |
SNMP resource |
Connection settings for receiving snmp-trap events:
You can add multiple connections or delete a connection. To add a connection, click the + SNMP resource button. To remove a SNMP resource, click the delete |
Settings |
Rules for naming the received data, according to which OIDs (object identifiers) are converted to the keys with which the normalizer can interact. Available settings:
You can do the following with rules:
|
Advanced settings tab
Setting |
Description |
|---|---|
Debug |
The switch enables resource logging. The toggle switch is turned off by default. |
Character encoding |
Character encoding. The default is UTF-8. When receiving snmp-trap events from Windows with Russian localization, if you encounter invalid characters in the event, we recommend changing the character encoding in the snmp-trap connector to Windows 1251. |
Configuring the source of SNMP trap messages for Windows
Configuring a Windows device to send SNMP trap messages to the KUMA collector involves the following steps:
- Configuring and starting the SNMP and SNMP trap services
- Configuring the Event to Trap Translator service
Events from the source of SNMP trap messages must be received by the KUMA collector, which uses a connector of the snmp-trap type and a json normalizer.
To configure and start the SNMP and SNMP trap services in Windows 10:
- Open Settings → Apps → Apps and features → Optional features → Add feature → Simple Network Management Protocol (SNMP) and click Install.
- Wait for the installation to complete and restart your computer.
- Make sure that the SNMP service is running. If any of the following services are not running, enable them:
- Services → SNMP Service.
- Services → SNMP Trap.
- Right-click Services → SNMP Service, and in the context menu select Properties. Specify the following settings:
- On the Log On tab, select the Local System account check box.
- On the Agent tab, fill in the Contact (for example, specify
User-win10) and Location (for example, specifydetroit) fields. - On the Traps tab:
- In the Community Name field, enter community public and click Add to list.
- In the Trap destination field, click Add, specify the IP address or host of the KUMA server on which the collector that waits for SNMP events is deployed, and click Add.
- On the Security tab:
- Select the Send authentication trap check box.
- In the Accepted community names table, click Add, enter Community Name public and specify READ WRITE as the Community rights.
- Select the Accept SNMP packets from any hosts check box.
- Click Apply and confirm your selection.
- Right click Services → SNMP Service and select Restart.
To configure and start the SNMP and SNMP trap services in Windows XP:
- Open Start → Control Panel → Add or Remove Programs → Add / Remove Windows Components → Management and Monitoring Tools → Details.
- Select Simple Network Management Protocol and WMI SNMP Provider, and then click OK → Next.
- Wait for the installation to complete and restart your computer.
- Make sure that the SNMP service is running. If any of the following services are not running, enable them by setting the Startup type to Automatic:
- Services → SNMP Service.
- Services → SNMP Trap.
- Right-click Services → SNMP Service, and in the context menu select Properties. Specify the following settings:
- On the Log On tab, select the Local System account check box.
- On the Agent tab, fill in the Contact (for example, specify
User-win10) and Location (for example, specifydetroit) fields. - On the Traps tab:
- In the Community Name field, enter community public and click Add to list.
- In the Trap destination field, click Add, specify the IP address or host of the KUMA server on which the collector that waits for SNMP events is deployed, and click Add.
- On the Security tab:
- Select the Send authentication trap check box.
- In the Accepted community names table, click Add, enter Community Name public and specify READ WRITE as the Community rights.
- Select the Accept SNMP packets from any hosts check box.
- Click Apply and confirm your selection.
- Right click Services → SNMP Service and select Restart.
Changing the port for the SNMP trap service
You can change the SNMP trap service port if necessary.
To change the port of the SNMP trap service:
- Open the C:\Windows\System32\drivers\etc folder.
- Open the services file in Notepad as an administrator.
- In the service name section of the file, specify the snmp-trap connector port added to the KUMA collector for the SNMP trap service.
- Save the file.
- Open the Control Panel and select Administrative Tools → Services.
- Right-click SNMP Service and select Restart.
To configure the Event to Trap Translator service that translates Windows events to SNMP trap messages:
- In the command line, type
evntwinand press Enter. - Under Configuration type, select Custom, and click the Edit button.
- In the Event sources group of settings, use the Add button to find and add the events that you want to send to KUMA collector with the SNMP trap connector installed.
- Click the Settings button, in the opened window, select the Don't apply throttle check box, and click OK.
- Click Apply and confirm your selection.
Connector, kata/edr type
Connectors of the kata/edr type are used for getting KEDR data via the API. Settings for a connector of the kata/edr type are described in the following tables.
Basic settings tab
Setting |
Description |
|---|---|
Name |
Unique name of the resource. The maximum length of the name is 128 Unicode characters. Required setting. |
Tenant |
The name of the tenant that owns the resource. Required setting. |
Type |
Connector type: kata/edr. Required setting. |
Tags |
Tags for resource search. Optional setting. |
URL |
URL that you want to connect to. The following URL formats are supported:
You can add multiple URLs or remove an URL. KUMA does not allow saving a resource or service if the URL field contains a tab or space character. To add an URL, click the + Add button. To remove an URL, click the delete Required setting. |
Secret |
Secret that stores the credentials for connecting to the KATA/EDR server. You can select an existing secret or create a new secret. To create a new secret, select Create new. If you want to edit the settings of an existing secret, click the pencil Required setting. |
External ID |
Identifier for external systems. KUMA automatically generates an ID and populates this field with it. |
Description |
Description of the resource. The maximum length of the description is 4000 Unicode characters. |
Advanced settings tab
Setting |
Description |
|---|---|
Debug |
The switch enables resource logging. The toggle switch is turned off by default. |
Character encoding |
Character encoding. We only recommend configuring a conversion if you find invalid characters in the fields of the normalized event. By default, no value is selected. |
Number of events |
Maximum number of events in one request. By default, the value set on the KATA/EDR server is used. |
Events fetch timeout |
The time in seconds to wait for receipt of events from the KATA/EDR server. Default value: |
Client timeout |
Time in seconds to wait for a response from the KATA/EDR server. Default value: |
KEDRQL filter |
Filter of requests to the KATA/EDR server. For more details on the query language, please refer to the KEDR Help. |
Connector, vmware type
Connectors of the vmware type are used for getting VMware vCenter data via the API. Settings for a connector of the vmware type are described in the following tables.
Basic settings tab
Setting |
Description |
|---|---|
Name |
Unique name of the resource. The maximum length of the name is 128 Unicode characters. Required setting. |
Tenant |
The name of the tenant that owns the resource. Required setting. |
Type |
Connector type: vmware. Required setting. |
Tags |
Tags for resource search. Optional setting. |
URL |
URL of the VMware API. You need to include the hostname and port number in the URL. You can only specify one URL. Required setting. |
VMware credentials |
Secret that stores the user name and password for connecting to the VMware API. You can select an existing secret or create a new secret. To create a new secret, select Create new. If you want to edit the settings of an existing secret, click the pencil Required setting. |
Client timeout |
Time to wait after a request that did not return events before making a new request. The default value is 5 seconds. If you specify |
Maximum number of events |
Number of events requested from the VMware API in one request. The default value is |
Start timestamp |
Starting date and time from which you want to read events from the VMware API. By default, events are read from the VMware API from the time when the collector was started. If started after the collector is stopped, the events are read from the last saved date. |
Description |
Description of the resource. The maximum length of the description is 4000 Unicode characters. |
Advanced settings tab
Setting |
Description |
|---|---|
Debug |
The switch enables resource logging. The toggle switch is turned off by default. |
Character encoding |
Character encoding. The default is UTF-8. |
TLS mode |
TLS encryption mode. When using TLS encryption, you cannot specify an IP address in the URL field on the Basic settings. Available values:
|
Connector, elastic type
Connectors of the elastic type are used for getting Elasticsearch data. Elasticsearch version 7.0.0 is supported. Settings for a connector of the elastic type are described in the following tables.
Basic settings tab
Setting |
Description |
|---|---|
Name |
Unique name of the resource. The maximum length of the name is 128 Unicode characters. Required setting. |
Tenant |
The name of the tenant that owns the resource. Required setting. |
Type |
Connector type: elastic. Required setting. |
Tags |
Tags for resource search. Optional setting. |
Connection |
Elasticsearch server connection settings:
You can add multiple connections to an Elasticsearch server resources or delete an Elasticsearch server connection. To add an Elasticsearch server connection, click the + Add connection button. To delete an Elasticsearch server connection, click the delete |
Description |
Description of the resource. The maximum length of the description is 4000 Unicode characters. |
Advanced settings tab
Setting |
Description |
|---|---|
Debug |
The switch enables resource logging. The toggle switch is turned off by default. |
Character encoding |
Character encoding. The default is UTF-8. |
Connector, office365 type
Connectors of the office365 type are used for receiving Microsoft 365 (Office 365) data via the API.
Available settings for a connector of the office365 type are described in the following tables.
Basic settings tab
Setting |
Description |
|---|---|
Name |
Unique name of the resource. The maximum length of the name is 128 Unicode characters. Required setting. |
Tenant |
The name of the tenant that owns the resource. Required setting. |
Type |
Connector type: office365. Required setting. |
Tags |
Tags for resource search. Optional setting. |
Office365 content types |
Content types that you want to receive in KUMA. The following content types are available, providing information about actions and events in Microsoft 365, grouped by information source:
You can find detailed information about the properties of the available content types and related events in the schema on the Microsoft website. Required setting. You can select one or more content types. |
Office365 tenant ID |
Unique ID that you get after registering an account with Microsoft 365. If you do not have one, contact your administrator or Microsoft. Required setting. |
Office365 client ID |
Unique ID that you get after registering an account with Microsoft 365. If you do not have one, contact your administrator or Microsoft. Required setting. |
Authorization |
Authorization method for connecting to Microsoft 365. The following authorization methods are available:
For more information, see the section on secrets. |
Office365 credentials |
The field becomes available after selecting the authorization method. You can select one of the available authorization secrets or create a new secret of the selected type. Required setting. |
Description |
Description of the resource. The maximum length of the description is 4000 Unicode characters. |
Advanced settings tab
Setting |
Description |
|---|---|
Debug |
The switch enables resource logging. The toggle switch is turned off by default. |
Character encoding |
Character encoding. The default is UTF-8. |
Authentication host |
The URL that is used for connection and authorization. By default, a connection is made to https://login.microsoftonline.com. |
Resource host |
URL from which the events are to be received. The default address is https://manage.office.com. |
Retrospective analysis interval, hours |
The period for which all new events are requested, in hours. To avoid losing some events, it is important to set overlapping event reception intervals, because some types of Microsoft 365 content may be sent with a delay. In this case, previously received events are not duplicated. By default, all new events for the last 12 hours are requested. |
Request timeout, sec |
Time to wait for a response to a request to get new events, in seconds. The default response timeout is 30 seconds. |
Repeat interval, sec |
The time in seconds after which a failed request to get new events must be repeated. By default, a request to get new events is repeated 10 seconds after getting an error or no response within the specified timeout. |
Clear interval, sec |
How often obsolete data is deleted, in seconds. The minimum value is 300 seconds. By default, obsolete data is deleted every 1800 seconds. |
Poll interval, min |
How often requests for new events are sent, in minutes. By default, requests are sent every 10 minutes. |
Proxy server |
Proxy settings, if necessary to connect to Microsoft 365. You can select one of the available proxy servers or create a new proxy server. |
Predefined connectors
The connectors listed in the table below are included in the KUMA distribution kit.
Predefined connectors
Connector name |
Comment |
[OOTB] Continent SQL |
Obtains events from the database of the Continent hardware and software encryption system. To use it, you must configure the settings of the corresponding secret type. |
[OOTB] InfoWatch Traffic Monitor SQL |
Obtains events from the database of the InfoWatch Traffic Monitor system. To use it, you must configure the settings of the corresponding secret type. |
[OOTB] KSC MSSQL |
Obtains events from the MS SQL database of the Kaspersky Security Center system. To use it, you must configure the settings of the corresponding secret type. |
[OOTB] KSC MySQL |
Obtains events from the MySQL database of the Kaspersky Security Center system. To use it, you must configure the settings of the corresponding secret type. |
[OOTB] KSC PostgreSQL |
Obtains events from the PostgreSQL database of the Kaspersky Security Center 15.0 system. To use it, you must configure the settings of the corresponding secret type. |
[OOTB] Oracle Audit Trail SQL |
Obtains audit events from the Oracle database. To use it, you must configure the settings of the corresponding secret type. |
[OOTB] SecretNet SQL |
Obtains events from the SecretNet SQL database. To use it, you must configure the settings of the corresponding secret type. |
Secrets
Secrets are used to securely store sensitive information such as user names and passwords that must be used by KUMA to interact with external services. If a secret stores account data such as user login and password, when the collector connects to the event source, the account specified in the secret may be blocked in accordance with the password policy configured in the event source system.
Secrets can be used in the following KUMA services and features:
- Collector (when using TLS encryption).
- Connector (when using TLS encryption).
- Destinations (when using TLS encryption or authorization).
- Proxy servers.
Available settings:
- Name (required)—a unique name for this type of resource. Must contain 1 to 128 Unicode characters.
- Tenant (required)—name of the tenant that owns the resource.
- Type (required)—the type of secret.
When you select the type in the drop-down list, the parameters for configuring this secret type also appear. These parameters are described below.
- Description—up to 4,000 Unicode characters.
Depending on the secret type, different fields are available. You can select one of the following secret types:
- credentials—this type of secret is used to store account credentials required to connect to external services, such as SMTP servers. If you select this type of secret, you must fill in the User and Password fields. If the Secret resource uses the 'credentials' type to connect the collector to an event source, for example, a database management system, the account specified in the secret may be blocked in accordance with the password policy configured in the event source system.
- token—this secret type is used to store tokens for API requests. Tokens are used when connecting to IRP systems, for example. If you select this type of secret, you must fill in the Token field.
- ktl—this secret type is used to store Kaspersky Threat Intelligence Portal account credentials. If you select this type of secret, you must fill in the following fields:
- User and Password (required fields)—user name and password of your Kaspersky Threat Intelligence Portal account.
- PFX file (required)—lets you upload a Kaspersky Threat Intelligence Portal certificate key.
- PFX password (required)—the password for accessing the Kaspersky Threat Intelligence Portal certificate key.
- urls—this secret type is used to store URLs for connecting to SQL databases and proxy servers. In the Description field, you must provide a description of the connection for which you are using the secret of urls type.
You can specify URLs in the following formats: hostname:port, IPv4:port, IPv6:port, :port.
- pfx—this type of secret is used for importing a PFX file containing certificates. If you select this type of secret, you must fill in the following fields:
- PFX file (required)—this is used to upload a PFX file. The file must contain a certificate and key. PFX files may include CA-signed certificates for server certificate verification.
The certificate included in the PFX file cannot be encrypted with the AES-128-CBC algorithm. KUMA does not support such certificates.
- PFX password (required)—this is used to enter the password for accessing the certificate key.
- PFX file (required)—this is used to upload a PFX file. The file must contain a certificate and key. PFX files may include CA-signed certificates for server certificate verification.
- kata/edr—this type of secret is used to store the certificate file and private key required when connecting to the Kaspersky Endpoint Detection and Response server. If you select this type of secret, you must upload the following files:
- Certificate file—KUMA server certificate.
The file must be in PEM format. You can upload only one certificate file.
- Private key for encrypting the connection—KUMA server RSA key.
The key must be without a password and with the PRIVATE KEY header. You can upload only one key file.
You can generate certificate and key files by clicking the
 button.
- Certificate file—KUMA server certificate.
- snmpV1—this type of secret is used to store the values of Community access (for example,
publicorprivate) that is required for interaction over the Simple Network Management Protocol. - snmpV3—this type of secret is used for storing data required for interaction over the Simple Network Management Protocol. If you select this type of secret, you must fill in the following fields:
- User—user name indicated without a domain.
- Security Level—security level of the user.
- NoAuthNoPriv—messages are forwarded without authentication and without ensuring confidentiality.
- AuthNoPriv—messages are forwarded with authentication but without ensuring confidentiality.
- AuthPriv—messages are forwarded with authentication and ensured confidentiality.
Additional settings depending on the selected level may be displayed.
- Password—SNMP user authentication password. This field becomes available when the AuthNoPriv or AuthPriv security level is selected.
- Authentication Protocol—the following protocols are available: MD5, SHA, SHA224, SHA256, SHA384, SHA512. This field becomes available when the AuthNoPriv or AuthPriv security level is selected.
- Privacy Protocol—protocol used for encrypting messages. Available protocols: DES, AES. This field becomes available when the AuthPriv security level is selected.
- Privacy password—encryption password that was set when the SNMP user was created. This field becomes available when the AuthPriv security level is selected.
- certificate—this secret type is used for storing certificate files. Files are uploaded to a resource by clicking the Upload certificate file button. X.509 certificate public keys in Base64 are supported.
- fingerprint—this type of secret is used to store the Elastic fingerprint value that can be used when connecting to the Elasticsearch server.
- PublicPKI—this type of secret is used to connect a KUMA collector to ClickHouse. If you select this option, you must specify the secret containing the base64-encoded PEM private key and the public key.
Predefined secrets
The secrets listed in the table below are included in the KUMA distribution kit.
Predefined secrets
Secret name |
Description |
[OOTB] Continent SQL connection |
Stores confidential data and settings for connecting to the APKSh Kontinent database. To use it, you must specify the login name and password of the database. |
[OOTB] KSC MSSQL connection |
Stores confidential data and settings for connecting to the MS SQL database of Kaspersky Security Center (KSC). To use it, you must specify the login name and password of the database. |
[OOTB] KSC MySQL Connection |
Stores confidential data and settings for connecting to the MySQL database of Kaspersky Security Center (KSC). To use it, you must specify the login name and password of the database. |
[OOTB] Oracle Audit Trail SQL Connection |
Stores confidential data and settings for connecting to the Oracle database. To use it, you must specify the login name and password of the database. |
[OOTB] SecretNet SQL connection |
Stores confidential data and settings for connecting to the MS SQL database of the SecretNet system. To use it, you must specify the login name and password of the database. |
Segmentation rules
In KUMA, you can configure alert segmentation rules, that is, the rules for dividing similar correlation events into different alerts.
By default, if a correlation rule is triggered several times in the correlator, all correlation events created as a result of the rule triggering are attached to the same alert. Alert segmentation rules allow you to define the conditions under which different alerts are created based on the correlation events of the same type. This can be useful, for example, to divide the stream of correlation events by the number of events or to combine several events having an important distinguishing feature into a separate alert.
Alert segmentation is configured in two stages:
- Segmentation rules are created. They define the conditions for dividing the stream of correlation events.
- Segmentation rules are linked to the correlation rules within which they must be triggered.
Segmentation rule settings
Segmentation rules are created in the Resources → Segmentation rules section of the KUMA web interface.
Available settings:
- Name (required)—a unique name for this type of resource. Must contain 1 to 128 Unicode characters.
- Tenant (required)—name of the tenant that owns the resource.
- Type (required)—type of the segmentation rule. Available values:
- By filter—alerts are created if the correlation events match the filter conditions specified in the Filter group of settings.
You can use the Add condition button to add a string containing fields for identifying the condition. You can use the Add group button to add a group of filters. Group operators can be switched between AND, OR, and NOT. You can add other condition groups and individual conditions to filter groups. You can swap conditions and condition groups by dragging them by the
icon; you can also delete them using the icon.- Left operand and Right operand—used to specify the values to be processed by the operator.
The left operand contains the names of the event fields that are processed by the filter.
For the right-hand operand, you can select the type of the value: constant or list and specify the value.
- Available operators
- Left operand and Right operand—used to specify the values to be processed by the operator.
- By identical fields—an alert is created if the correlation event contains the event fields specified in the Correlation rule identical fields group of settings.
The fields are added using the Add field button. You can delete the added fields by clicking the cross icon or the Reset button.
- By event limit—an alert is created if the number of correlation events in the previous alert exceeds the value specified in the Correlation events limit field.
- By filter—alerts are created if the correlation events match the filter conditions specified in the Filter group of settings.
- Alert naming template (required)—a template for naming the alerts created according to this segmentation rule. The default value is
{{.Timestamp}}.In the template field, you can specify text, as well as event fields in the
{{.<Event field name>}}format. When generating the alert name, the event field value is substituted instead of the event field name.The name of the alert created using the segmentation rules has the following format:
<Name of the correlation rule that created the alert> (<text from the alert naming template field> <Alert creation date>). - Description—resource description: up to 4,000 Unicode characters.
Linking segmentation rules to correlation rules
Links between a segmentation rule and correlation rules are created separately for each tenant. They are displayed in the Settings → Alerts → Segmentation section of the KUMA web interface in the table with the following columns:
- Tenant—the name of the tenant that owns the segmentation rules.
- Updated—date and time of the last update of the segmentation rules.
- Disabled—this column displays a label if the segmentation rules are turned off.
To link an alert segmentation rule to the correlation rules:
- In the KUMA web interface, open the Settings → Alerts → Segmentation section.
- Select the tenant for which you would like to create a segmentation rule:
- If the tenant already has segmentation rules, select it in the table.
- If the tenant has no segmentation rules, click Add settings for a new tenant and select the relevant tenant from the Tenant drop-down list.
A table with the created links between segmentation and correlation rule is displayed.
- In the Segmentation rule links group of settings, click Add and specify the segmentation rule settings:
- Name (required)—specify the segmentation rule name in this field. Must contain 1 to 128 Unicode characters.
- Tenants and correlation rule (required)—in this drop-down list, select the tenant and its correlation rule to separate the events of this tenant into an individual alert. You can select several correlation rules.
- Segmentation rule (required)—in this group of settings, select a previously created segmentation rule that defines the segmentation conditions.
- Disabled—select this check box to disable the segmentation rule link.
- Click Save.
The segmentation rule is linked to the correlation rules. Correlation events created by the specified correlation rules are combined into a separate alert with the name defined in the segmentation rule.
To disable links between segmentation rules and correlation rules for a tenant:
- Open the Settings → Alerts section of the KUMA web interface and select the tenant whose segmentation rules you want to disable.
- Select the Disabled check box.
- Click Save.
Links between segmentation rules and correlation rules are disabled for the selected tenant.
Page top
Context tables
A context table is a container for a data array that is used by KUMA correlators for analyzing events in accordance with correlation rules. You can create context tables in the Resources section. The context table data is stored only in the correlator to which it was added using filters or actions in correlation rules.
You can populate context tables automatically using correlation rules of 'simple' and 'operational' types or import a file with data for the context table.
You can add, copy, and delete context tables, as well as edit their settings.
Context tables can be used in the following KUMA services and features:
The same context table can be used in multiple correlators. However, a separate entity of the context table is created for each correlator. Therefore, the contents of the context tables used by different correlators are different even if the context tables have the same name and ID.
Only data based on correlation rules of the correlator are added to the context table.
You can add, edit, delete, import, and export records in the context table of the correlator.
When records are deleted from context tables after their lifetime expires, service events are generated in the correlators. These events only exist in the correlators, and they are not redirected to other destinations. Service events are sent for processing by correlation rules of that correlator which uses the context table. Correlation rules can be configured to track these events so that they can be used to process events and identify threats.
Service event fields for deleting an entry from a context table are described below.
Event field |
Value or comment |
|
Event ID |
|
Time when the expired entry was deleted |
|
|
|
|
|
|
|
Correlator ID |
|
Correlator name |
|
Context table ID |
|
Key of the expired entry |
|
Number of updates for the deleted entry, incremented by one |
|
Name of the context table. |
|
Depending on the type of the entry that dropped out from the context table, the dropped-out context table entry is recorded in the corresponding type of event: for example, S.<context table field> = <context table field value> SA.<context table field> = <array of context table field values>
Context table records of the boolean type have the following format: S.<context table field> = true/false SA.<context table field> = false,true,false |
Viewing the list of context tables
To view the context table list of the correlator:
- In the KUMA web interface, select the Resources section.
- In the Services section, click the Active services button.
- In the context menu of the correlator for which you want to view context tables, select Go to context tables.
The Correlator context tables list is displayed.
The table contains the following data:
- Name—name of the context table.
- Size on disk—size of the context table.
- Directory—path to the context table on the KUMA correlator server.
Adding a context table
To add a context table:
- In the KUMA web interface, select the Resources section.
- In the Resources section, click Context tables.
- In the Context tables window, click Add.
This opens the Create context table window.
- In the Name field, enter a name for the context table.
- In the Tenant drop-down list, select the tenant that owns the resource.
- In the TTL field, specify time the record added to the context table is stored in it.
When the specified time expires, the record is deleted. The time is specified in seconds. The maximum value is
31536000(1 year).The default value is
0. If the value of the field is 0, the record is stored indefinitely. - In the Description field, provide any additional information.
You can use up to 4,000 Unicode characters.
This field is optional.
- In the Schema section, specify which fields the context table has and the data types of the fields.
Depending on the data type, a field may or may not be a key field. At least one field in the table must be a key field. The names of all fields must be unique.
To add a table row, click Add and fill in the table fields:
- In the Name field, enter the name of the field. The maximum length is 128 characters.
- In the Type drop-down list, select the data type for the field.
Possible data types of context table fields
Field data type
Can be a key field
Comment
Integer
Yes

Floating point number
Yes
String
Yes
Boolean
Yes
Timestamp
Yes
For a field of this type, it is checked that the field value is greater than or equal to zero. No other operations are provided.
IP address
Yes
For a field of this type, it is checked that the field value corresponds to the IPv4, IPv6 format. No other operations are provided.
Integer list
No
Float list
No
List of strings
No
Boolean list
No
Timestamp list
No
For a field of this type, it is checked that each item in the list is greater than or equal to zero. No other operations are provided.
IP list
No
For a field of this type, it is checked that each item of the list corresponds to the IPv4, IPv6 format. No other operations are provided.
- If you want to make a field a key field, select the Key field check box.
A table can have multiple key fields. Key fields are chosen when the context table is created, uniquely identify a table entry and cannot be changed.
If a context table has multiple key fields, each table entry is uniquely identified by multiple fields (composite key).
- Add the required number of context table rows.
After saving the context table, the schema cannot be changed.
- Click the Save button.
The context table is added.
Page top
Viewing context table settings
To view the context table settings:
- In the KUMA web interface, select the Resources section.
- In the Resources section, click Context tables.
- In the list in the Context tables window, select the context table whose settings you want to view.
This opens the context table settings window. It displays the following information:
- Name—unique name of the resource.
- Tenant—the name of the tenant that owns the resource.
- TTL—the record added to the context table is stored in it for this duration. This value is specified in seconds.
- Description—any additional information about the resource.
- Schema is an ordered list of fields and their data types, with key fields marked.
Editing context table settings
To edit context table settings:
- In the KUMA web interface, select the Resources section.
- In the Resources section, click Context tables.
- In the list in the Context tables window, select the context table whose settings you want to edit.
- Specify the values of the following parameters:
- Name—unique name of the resource.
- TTL—the record added to the context table is stored in it for this duration. This value is specified in seconds.
- Description—any additional information about the resource.
- Schema is an ordered list of fields and their data types, with key fields marked. If the context table is not used in a correlation rule, you can edit the list of fields.
If you want to edit the schema in a context table that is already being used in a correlation rule, follow the steps below.
The Tenant field is not available for editing.
- Click Save.
To edit the settings of the context table previously used by the correlator:
- Export data from the table.
- Copy and save the path to the file with the data of the table on the disk of the correlator. This path is specified in the Directory column in the Correlator context tables window. You will need this path later to delete the file from the disk of the correlator.
- Delete the context table from the correlator.
- Edit context table settings as necessary.
- Delete the file with data of the table on the disk of the correlator at the path from step 2.
- To apply the changes (delete the table), update the configuration of the correlator: in the Resources → Active services section, in the list of services, select the check box next to the relevant correlator and click Update configuration.
- Add the context table in which you edited the settings to the correlator.
- To apply the changes (add a table), update the configuration of the correlator: in the Resources → Active services section, in the list of services, select the check box next to the relevant correlator and click Update configuration.
- Adapt the fields in the exported table (see step 1) so that they match the fields of the table that you uploaded to the correlator at step 7.
- Import the adapted data to the context table.
The configuration of the context table is updated.
Page top
Duplicating context table settings
To copy a context table:
- In the KUMA web interface, select the Resources section.
- In the Resources section, click Context tables.
- Select the check box next to the context table that you want to copy.
- Click Duplicate.
- Specify the necessary settings.
- Click the Save button.
The context table is copied.
Page top
Deleting a context table
You can delete only those context tables that are not used in any of the correlators.
To delete a context table:
- In the KUMA web interface, select the Resources section.
- In the Resources section, click Context tables.
- Select the check boxes next to the context tables that you want to delete.
To delete all context tables, select the check box next to the Name column.
At least one check box must be selected.
- Click the Delete button.
- Click OK.
The context tables are deleted.
Page top
Viewing context table records
To view a list of context table records:
- In the KUMA web interface, select the Resources section.
- In the Services section, click the Active services button.
- In the context menu of the correlator for which you want to view the context table, select Go to context tables.
This opens the Correlator context tables window.
- In the Name column, select the relevant context table.
The list of records for the selected context table is displayed.
The list contains the following data:
- Key is the composite key of the record. It is comprised by one or more values of key fields, separated by the "|" character. If one of the key field values is absent, the separator character is still displayed.
For example, a record key consists of three fields:
DestinationAddress,DestinationPort, andSourceUserName. If the last two fields do not contain values, the record key is displayed as follows:43.65.76.98| |. - Record repetitions is the total number of times the record was mentioned in events and identical records were downloaded when importing context tables to KUMA.
- Expiration date – date and time when the record must be deleted.
If the TTL field had the value of 0 when the context table was created, the records of this context table are retained for 36,000 days (approximately 100 years).
- Updated is the date and time when the context table was updated.
Searching context table records
To find a record in the context table:
- In the KUMA web interface, select the Resources section.
- In the Services section, click the Active services button.
- In the context menu of the correlator in whose context table you want to find a record, select Go to context tables.
This opens the Correlator context tables window.
- In the Name column, select your context table.
This opens a window with the records of the selected context table.
- In the Search field, enter the record key value or several characters from the key.
The list of context table records displays only the records whose key contains the entered characters.
If the your search query matches records with empty key values, the text <Nothing found> is displayed in the widget on the Dashboard. We recommend clarifying the conditions of your search query.
Page top
Adding a context table record
To add a record to the context table:
- In the KUMA web interface, select the Resources section.
- In the Services section, click the Active services button.
- In the context menu of the correlator to whose context table you want to add a record, select Go to context tables.
This opens the Correlator context tables window.
- In the Name column, select the relevant context table.
The list of records for the selected context table is displayed.
- Click Add.
The Create record window opens.
- In the Value field, specify the values for fields in the Field column.
KUMA takes field names from the correlation rules with which the context table is associated. These names are not editable. The list of fields cannot be edited.
If you do not specify some of the field values, the missing fields, including key fields, are populated with default values. The key of the record is determined from the full set of fields, and the record is added to the table. If an identical key already exists in the table, an error is displayed.
- Click the Save button.
The record is added.
Page top
Editing a context table record
To edit a record in the context table:
- In the KUMA web interface, select the Resources section.
- In the Services section, click the Active services button.
- In the context menu of the correlator for which you want to edit the context table, select Go to context tables.
This opens the Correlator context tables window.
- In the Name column, select the relevant context table.
The list of records for the selected context table is displayed.
- Click on the row of the record that you want to edit.
- Specify your values in the Value column.
- Click the Save button.
The record is overwritten.
Restrictions when editing a record:
- The value of the key field of the record is not available for editing. You can change it by exporting and importing a record.
- Field names in the Field column are not editable.
- The values in the Value column must meet the following requirements:
- greater than or equal to 0 for fields of the Timestamp and Timestamp list types.
- IPv4 or IPv6 format for fields of the IP address and IP list types.
- is true or false for a Boolean field.
Deleting a context table record
To delete records from a context table:
- In the KUMA web interface, select the Resources section.
- In the Services section, click the Active services button.
- In the context menu of the correlator from whose context table you want to delete a record, select Go to context tables.
This opens the Correlator context tables window.
- In the Name column, select the relevant context table.
The list of records for the selected context table is displayed.
- Select the check boxes next to the records you want to delete.
To delete all records, select the check box next to the Key column.
At least one check box must be selected.
- Click the Delete button.
- Click OK.
The records will be deleted.
Page top
Importing data into a context table
To import data to a context table:
- In the KUMA web interface, select the Resources section.
- In the Services section, click the Active services button.
- In the context menu of the correlator to whose context table you want to import data, select Go to context tables.
This opens the Correlator context tables window.
- Select the check box next to your context table and click Import.
This opens the context table data import window.
- Click Add and select the file that you want to import.
- In the Format drop-down list select the format of the file:
- csv
- tsv
- internal
- Click the Import button.
The data from the file is imported into the context table. Records that previously existed in the context table are preserved.
When importing, KUMA checks the uniqueness of each record's key. If a record already exists, its fields are populated with new values obtained by merging the previous values with the field values of the imported record.
If no record existed in the context table, a new record is created.
Data imported from a file is not checked for invalid characters. If you use this data in widgets, widgets are displayed incorrectly if invalid characters are present in the data.
Page top
Exporting data from a context table
To export data from a context table:
- In the KUMA web interface, select the Resources section.
- In the Services section, click the Active services button.
- In the context menu of the correlator whose context table you want to export, select Go to context tables.
This opens the Correlator context tables window.
- Select the check box next to your context table and click Export.
The context table is downloaded to your computer in JSON format. The name of the downloaded file reflects the name of the context table. The order of the fields in the file is not defined.
Page top
Example of incident investigation with KUMA
Detecting an attack in the organization IT infrastructure using KUMA includes the following steps:
- Preliminary steps
- Assigning an alert to a user
- Check if the triggered correlation rule matches the data of the alert events
- Analyzing alert information
- False positive check
- Determining alert severity
- Incident creation
- Investigation
- Searching for related assets
- Searching for related events
- Recording the causes of the incident
- Response
- Restoring assets operability
- Closing the incident
The description of the steps provides an example of response actions that an analyst might take when an incident is detected in the organization's IT infrastructure. You can view the description and example for each step by clicking the link in its title. The examples are directly relevant to the step being described.
For conditions of the incident for which examples are provided, see the Incident conditions section.
For more information about response methods and tools, see the Incident Response Guide. On the Securelist website by Kaspersky, you can also find additional recommendations for incident detection and response.
Incident conditions
Parameters of the computer (hereinafter also referred to as "asset") on which the incident occurred:
- Asset operating system – Windows 10.
- Asset software – Kaspersky Endpoint Agent, Kaspersky Endpoint Security.
KUMA settings:
- Integration with Active Directory, Kaspersky Security Center, Kaspersky Endpoint Detection and Response is configured.
- SOC_package correlation rules from the application distribution kit are installed.
A cybercriminal noticed that the administrator's computer was not locked, and performed the following actions on this computer:
- Uploaded a malicious file from his server.
- Executed the command for creating a registry key in the
\HKEY_LOCAL_MACHINE\SOFTWARE\Microsoft\Windows\CurrentVersion\Runhive. - Added the file downloaded at the first step to autorun using the registry.
- Cleared the Windows Security Event Log.
- Completed the session.
Step 1. Preliminary steps
Preliminary steps are as follows:
- Event monitoring.
When a collector is created and configured in KUMA, the application writes information security events registered on controlled elements of the organization's IT infrastructure to the event database. You can find and view these events.
- Creating a correlator and correlation rules.
When a sequence of events that satisfy the conditions of a correlation rule is detected, the application generates alerts. If the same correlation rule is triggered for several events, all these events are associated with the same alert. You can use correlation rules from the distribution kit or create them manually.
- Configuring email notifications about an alert to one or more email addresses.
If notification is configured, KUMA sends a notification to the specified email addresses when a new alert is received. The alert link is displayed in the notification.
- Adding assets.
You can only perform response actions for an asset (for example, block a file from running) if the asset is added to KUMA.
Performing response action requires integrating KUMA with Kaspersky Security Center and Kaspersky Endpoint Detection and Response.
Example
The analyst has carried out the following preliminary steps:
- Installed the SOC_package correlation rules from the distribution kit and linked them to the correlator.
- Configured the sending of alert notifications to the analyst's email.
- Imported assets from Kaspersky Security Center to KUMA.
According to the incident conditions, after the administrator logged into their account, a malicious file was run, which the attacker had added to Windows autorun. The asset sent Windows security event log events to KUMA. The correlation rules were triggered for these events.
As a result, the following alerts were written to the KUMA alert database:
- R223_Collection of information about processes.
- R050_Windows Event Log was cleared. R295_System manipulations by a non-privileged process.
- R097_Startup script manipulation.
- R093_Modification of critical registry hives.
The information about the alert contains the names of the correlation rules based on which the alerts were created, and the time of the first and last event created when the rules were triggered again.
The analyst received alert notifications by email. The analyst followed the link to the R093_Changes to critical registry hives alert from the notification.
Step 2. Assigning an alert to a user
You can assign an alert to yourself or to another user.
Example As part of the incident, the analyst assigns the alert to themselves. |
Step 3. Check if the triggered correlation rule matches the data of the alert events
At this step, you must view the information about the alert and make sure that the alert event data matches the triggered correlation rule.
Example The name of the alert indicates that a critical registry hive was modified. The Related events section of the alert details displays the table of events related to the alert. The analyst sees that the table contains one event showing the path to the modified registry key, as well as the original and the new value of the key. Therefore, the correlation rule matches the event. |
Step 4. Analyzing alert information
At this step, analyze the information about the alert to determine what data is required for further analysis of the alert.
Example From the alert information, the analyst learns the following:
This information can be viewed in the details of the event that caused the alert (Alerts → R093_Modification of critical registry hives → Related events → event 2022-08-23 17:27:05), in the FileName, DeviceHostName, and SourceUserName fields respectively. |
Step 5. False positive check
At this stage, make sure that the activity that triggered the correlation rule is abnormal for the organization IT infrastructure.
Example At this step, the analyst checks whether the detected activity can be legitimate as part of normal system operation (for example, an update). The event information shows that a registry key was created under the user account using the reg.exe utility. A registry key was also created in the |
Step 6. Determining alert severity
You can change the alert severity level, if necessary.
Example The analyst assigns a high severity to the alert. |
Step 7. Incident creation
If steps 3 to 6 reveal that the alert warrants investigation, you can create an incident.
Example The analyst creates an incident in order to perform an investigation. |
Step 8. Investigation
This step includes viewing information about the assets, accounts, and alerts related to the incident in the incident information section.
Information about the impacted assets and accounts is displayed on the Related assets and Related users tabs in the incident information section.
Example The analyst opens the information about the affected asset (Incidents → the relevant incident → Related alerts → the relevant alert → Related endpoints → the relevant asset). The asset information shows that the asset belongs to the Business impact/HIGH and Device type/Workstation categories, which are critical for the organization IT infrastructure. The asset information also includes the following useful data:
The analyst opens the information about the associated user account (Incidents → the relevant incident → Related alerts → link with the relevant alert → Related users → account). The following account information may be useful:
|
Step 9. Searching for related assets
You can view the alerts that occurred on the assets related to the incident.
Example The analyst checks for other alerts that occurred on the assets related to the incident (Incidents → the relevant incident → Related alerts → the relevant alert → Related endpoints → the relevant asset → Related alerts). In the alert window, you can configure filtering by time or status to exclude outdated and processed alerts. The time when the asset alerts were registered helps the analyst to determine that these alerts are related, so they can be linked to the incident (select the relevant alerts → Link → the relevant incident → Link). The analyst also finds the associated alerts for the account and links them to the incident. All related assets that were mentioned in the new alerts are also scanned. |
Step 10. Searching for related events
You can expand your investigation scope by searching for events of related alerts.
The events can be found in the KUMA event database manually or by selecting any of the related alerts and clicking Find in events in the alert details (Incidents → the relevant incident → Related alerts → the relevant alert → Related endpoints → Find in events). The found events can be linked to the selected alert, however, the alert must be unlinked from the incident before that.
Example As a result, the analyst found the A new process has been created event, where the command to create a new registry key was recorded. Based on the event data, the analyst detected that
As a result, the analyst discovered that the file was downloaded from an external source using the Search for the related events for each incident alert allows the analyst to identify the entire attack chain. |
Step 11. Recording the causes of the incident
You can record the information necessary for the investigation in the incident change log.
Example Based on the results of the search for incident-related events, the analyst identified the causes of the incident and recorded the results of the analysis in the Change log field in incident details to pass the information to other analysts. |
Step 12. Incident response
You can perform the following response actions:
- Isolate the asset from the network.
- Perform a virus scan.
- Prevent the file from running on assets.
The listed actions are available if KUMA is integrated with Kaspersky Security Center and Kaspersky Endpoint Detection and Response.
Example
The analyst has information about the incident-related assets and the indicators of compromise. This information helps select the response actions.
As part of the incident being considered, it is recommended to perform the following actions:
- Start an unscheduled virus scan of the asset where the file was added to autorun.
The virus scan task is started by means of Kaspersky Security Center.
- Isolate the asset from the network for the period of the virus scan.
The asset isolation is performed by means of Kaspersky Endpoint Detection and Response.
- Quarantine the ChromeUpdate.bat file and create the execution prevention rules for this file on other assets in the organization.
An execution prevention rule for a file is created by means of Kaspersky Endpoint Detection and Response.
- Start an unscheduled virus scan of the asset where the file was added to autorun.
Step 13. Restoring assets operability
After the IT infrastructure is cleaned from the malicious presence, you can disable the prevention rules and asset network isolation rules in Kaspersky Endpoint Detection and Response.
Example After the investigation, response, and cleanup of the organization IT infrastructure from the traces of the attack, restoration of the asset operation can be started. For this purpose, the execution prevention rules and the network asset isolation rules can be disabled in Kaspersky Endpoint Detection and Response if they were not disabled automatically. |
Step 14. Closing the incident
After taking measures to clean up the traces of the attacker's presence from the organization's IT infrastructure, you can close the incident.
Page top
Analytics
KUMA provides extensive analytics on the data available to the application from the following sources:
- Events in storage
- Alerts
- Assets
- Accounts imported from Active Directory
- Data from collectors on the number of processed events
- Metrics
You can configure and receive analytics in the Dashboard, Reports, and Source status sections of the KUMA web interface. Analytics are built by using only the data from tenants that the user can access.
The date format depends on the localization language selected in the application settings. Possible date format options:
- English localization: YYYY-MM-DD.
- Russian localization: DD.MM.YYYY.
Working with events
In the Events section of the KUMA web interface, you can inspect events received by the application to investigate security threats or create correlation rules. The events table displays the data received after the SQL query is executed.
Events can be sent to the correlator for a retroscan.
The event date format depends on the localization language selected in the application settings. Possible date format options:
- English localization: YYYY-MM-DD.
- Russian localization: DD.MM.YYYY.
Filtering and searching events
The Events section of the KUMA web interface does not show any data by default. To view events, you need to define an SQL query in the search field and click the Run query button. The SQL query can be entered manually or it can be generated using a query builder.
Data aggregation and grouping is supported in SQL queries.
You can search for events across multiple storages. For example, you can find events to determine where a user account is being blocked or which IP addresses were used to log in to which URLs. Example query for finding a blocked user account:
SELECT * FROM `events` WHERE DestinationUserName = 'username' AND DeviceEventClassID = '4625' LIMIT 250
To search for events in multiple storages, in the drop-down list in the upper-right part of the Events section, select check boxes next to the storages you want to search.
The list displays the following storages:
- Storages of the Main tenant.
- Available storages of tenants that satisfy one of the following conditions:
- The tenant that owns the storage is enabled in the tenant filter and the user has permissions to read events in this tenant.
- The user has access to the tenant of one of the partitions of the storage and has permissions to read events in this tenant.
For example, if you have access to the collector tenant, but do not have access to the storage tenant, by default, the inaccessible tenant's storage is not displayed in the list of available storages. If a destination in the storage of a tenant that is not available to you is added to the collector of an available tenant, after an event arrives in the partition of the tenant of the collector, the storage of the unavailable tenant appears in the list of storages in the Events section.
The drop-down list of storages in the upper-right part of the Events section displays the name of the first of the selected storages and the number of selected storages, if there are several. You can hover over the drop-down list to display all of the selected storages. If a space in a storage is deleted, the storage drop-down list shows "deleted<ID of deleted space>", and the events remain searchable for the duration of the TTL.
The tenants selected in the tenant filter affect which storages are displayed in the drop-down list of storages. If you disable tenants whose storages are available to you in the tenant filter, these storages are no longer displayed in the drop-down list of storages. If these storages had been selected in the drop-down list of storages, their check boxes are cleared and events from these storages are not displayed. If only one storage is selected in the drop-down list of storages that is not from the Main tenant, and if in tenant selection you disabled the tenant that owns the selected storage, this storage is not displayed in the list of storages and KUMA automatically changes the selection to one of the storages of the Main tenant.
A simple query to all selected storages is allowed, as in the example above. If at least one of the selected storages is not available for the query, KUMA returns an error.
Limitations for searching events across multiple storages:
- When querying multiple storages, export to TSV, retroscan, or REST API requests are not available.
- A SELECT can contain only * and/or names of event fields. Aliases, functions, expressions are not allowed.
- An ORDER BY clause must also contain only event fields (no functions, constants, expressions, and so on). If a field is not present in the list of fields for the SELECT, such a field is automatically added when sending to a specific cluster. You cannot set an ORDER BY ClusterID.
- GROUP BY is not available.
Complex queries with grouping and aggregation are allowed for a single selected storage.
You can add filter conditions to an already generated SQL query in the window for viewing statistics, the events table, and the event details area:
- Changing a query from the Statistics window
To change the filtering settings in the Statistics window:
- Open Statistics details area by using one of the following methods:
- In the
 drop-down list in the top right corner of the events table select Statistics.
 - In the events table click any value and in the opened context menu select Statistics.
The Statistics details area appears in the right part of the web interface window.
- In the
- Open the drop-down list of the relevant parameter and hover your mouse cursor over the necessary value.
- Use the plus and minus signs to change the filter settings by doing one of the following:
- If you want the events selection to include only events with the selected value, click the
 icon.
icon. - If you want the events selection to exclude all events with the selected value, click the
 icon.
icon.
- If you want the events selection to include only events with the selected value, click the
As a result, the filter settings and the events table will be updated, and the new search query will be displayed in the upper part of the screen.
- Open Statistics details area by using one of the following methods:
- Changing a query from the events table
- Changing a query from the Event details area
To change the filter settings in the event details area:
- In the Events section of the KUMA web interface, click the relevant event.
The Event details area appears in the right part of the window.
- Change the filter settings by using the plus or minus icons next to the relevant settings:
- If you want the events selection to include only events with the selected value, click the icon.
- If you want the events selection to exclude all events with the selected value, click the icon.
- If you want the events selection to include only events with the selected value, click the
As a result, the filter settings and the events table will be updated, and the new search query will be displayed in the upper part of the screen.
- In the Events section of the KUMA web interface, click the relevant event.
After modifying a query, all query parameters, including the added filter conditions, are transferred to the query builder and the search field.
When you switch to the query builder, the parameters of a query entered manually in the search field are not transferred to the builder, so you will need to create your query again. Also, the query created in the builder does not overwrite the query that was entered into the search string until you click the Apply query button in the builder window.
In the SQL query input field, you can enable the display of control characters.
You can also filter events by time period. Search results can be automatically updated.
The filter configuration can be saved. Existing filter configurations can be deleted.
Filter functions are available for users regardless of their roles.
When accessing certain event fields with IDs, KUMA returns the corresponding names.
For more details on SQL, refer to the ClickHouse documentation. For SQL operators and functions supported in KUMA, see also the KUMA operator usage and supported functions.
Selecting Storage
Events that are displayed in the Events section of the KUMA web interface are retrieved from storage (from the ClickHouse cluster). Depending on the demands of your company, you may have more than one Storage. However, you can only receive events from one Storage at a time, so you must specify which one you want to use.
To select the Storage you want to receive events from,
In the Events section of the KUMA web interface, open the drop-down list of storages in the upper-right part of the section and select one or more spaces of one or more storages. You can select all available storage spaces by selecting the check box next to the storage name.
Now events from the selected storage are displayed in the events table. The name of the selected storage is displayed in the drop-down list of storages.
The drop-down list of storages displays only the clusters of tenants available to the user, and the cluster of the main tenant.
Generating an SQL query using a builder
In KUMA, you can use a query builder to generate an SQL query for filtering events.
To generate an SQL query using a builder:
- In the Events section of the KUMA web interface, click the
 button.
The filter constructor window opens.
- Generate a search query by providing data in the following parameter blocks:
SELECT—event fields that should be returned. The * value is selected by default, which means that all available event fields must be returned. To make viewing the search results easier, select the necessary fields in the drop-down list. In this case, the data only for the selected fields is displayed in the table. Note that Select * increases the duration of the request execution, but eliminates the need to manually indicate the fields in the request.
When selecting an event field, you can use the field on the right of the drop-down list to specify an alias for the column of displayed data, and you can use the right-most drop-down list to select the operation to perform on the data: count, max, min, avg, sum.
If you use aggregation functions in an SQL query, you can customize the display of columns in the event table. After executing the query without *, the columns will match the query. Sorting of events in ascending and descending order, getting statistics is also not possible.
If the query uses grouping or aggregation functions, instead of one number that was received as a response to the
SELECT max(BytesOut) FROM `events` LIMIT 250query, the radar shows a distribution of events from which this number is obtained.When filtering by alert-related events in alert investigation mode, you cannot perform operations on the data of event fields or assign names to the columns of displayed data.
- FROM—data source. Select the events value.
- WHERE—conditions for filtering events.
Conditions and groups of conditions can be added by using the Add condition and Add group buttons. The AND operator value is selected by default in the group of conditions, but you can change the operator by clicking it. Available values: AND, OR, NOT. The structure of conditions and condition groups can be changed by using the
 icon to drag and drop expressions.
Adding filter conditions:
- In the drop-down list on the left, select the event field that you want to use for filtering.
- Select the necessary operator from the middle drop-down list. The available operators depend on the type of value of the selected event field.
- Enter the value of the condition. Depending on the selected type of field, you may have to manually enter the value, select it from the drop-down list, or select it on the calendar.
You can delete filter conditions and filter condition groups by clicking
 .
. - GROUP BY—event fields or aliases to be used for grouping the returned data.
If you use data grouping in an SQL query, custom fields specified in the query are displayed in the list of events. Table columns in a group cannot be customized. In group events, you can customize the display of columns. Sorting of events in ascending and descending order, getting statistics is also not possible.
When filtering by alert-related events in alert investigation mode, you cannot group the returned data.
- ORDER BY—columns used as the basis for sorting the returned data. In the drop-down list on the right, you can select the necessary order: DESC—descending, ASC—ascending.
- LIMIT—number of strings displayed in the table.
The default value is 250.
If you are filtering events by user-defined period and the number of strings in the search results exceeds the defined value, you can click the Show next button to display additional strings in the table. This button is not displayed when filtering events by the standard period.
- Click Apply query.
The current SQL query will be overwritten. The generated SQL query is displayed in the search field.
If you want to reset the builder settings, click the Default query button.
If you want to close the builder without overwriting the existing query, click the
button in the upper-right part of the query creation window. - Click the Run query button to display the data in the table.
The table will display the search results based on the generated SQL query.
When switching to another section of the web interface, the query generated in the builder is not preserved. If you return to the Events section from another section, the builder will display the default query.
For more details on SQL, refer to the ClickHouse documentation. See also KUMA operator usage and supported functions.
Manually creating an SQL query
You can use the search field manually to create SQL queries of any complexity to filter events.
To manually generate an SQL query:
- Go to the Events section of the KUMA web interface.
An input form opens.
- Enter your SQL query into the input field. You must use single quotes in your queries.
- Click Run query to run the query.
A table of events that satisfy the criteria of your query will be displayed. If necessary, you can filter events by period.
Supported functions and operators
Function |
Description |
|---|---|
|
Event fields that you want to be returned. The following functions and operators are supported:
You can combine functions and operators in an SQL query. If you use aggregation functions in an SQL query, you can customize the display of columns in the event table. After executing the query without *, the columns will match the query. Sorting of events in ascending and descending order, getting statistics is also not possible. If the query uses grouping or aggregation functions, instead of one number that was received as a response to the |
|
Data source. When creating an SQL query, you need to specify the events value as the data source. |
|
Conditions for filtering events:
|
|
Event fields or aliases to be used for grouping the returned data. If you use data grouping in an SQL query, custom fields specified in the query are displayed in the list of events. Table columns in a group cannot be customized. In group events, you can customize the display of columns. Sorting of events in ascending and descending order, getting statistics is also not possible. |
|
Columns by which you want to sort the returned data. Possible values:
|
|
The number of rows to skip before displaying the results of the SQL query. |
|
The number of rows that can be displayed in the table. The default value is If you are filtering events by user-defined period and the number of rows in the search results exceeds the defined value, you can click the Show next button to display additional rows in the table. This button is not displayed when filtering events by the standard period. |
Examples of SQL queries
|
If you want to use a special character in a query, you need to escape this character by placing a backslash (\) character in front of it.
Example:
In the events table, all events whose Message field contains text corresponding to the |
When creating a normalizer for events, you can choose whether to retain the field values of the raw event. The data is stored in the Extra event field. This field is searched for events by using the LIKE operator.
Example:
In the events table, all events for hosts with the IP address 00.00.00.000 where the example process is running are sorted by the Timestamp column in descending order. The number of strings that can be displayed in the table is 250. |
If you created an SQL query manually in the search field and then switched to the builder, the SQL query parameters are not transferred to the builder. In this case, you will need to re-create the SQL query in the builder. The SQL query created in the builder does not overwrite the SQL query that was entered into the search string until you click the Apply query button in the builder window. If you created an SQL query in the query builder and then switched to the search field, the query parameters are transferred automatically.
Aliases must not contain spaces.
For more details on SQL, refer to the ClickHouse documentation. See also the supported ClickHouse functions.
Saving query history
In the KUMA web interface, the Events section keeps a personal history of SQL search queries. You can refer to the history of queries and quickly find a query you have used in the past.
The queries are saved in the browser. Changing your browser resets the query history. The history stores the last 32 of your queries. Queries are displayed with formatting. The date and time when the query was executed is displayed.
Only queries with correct syntax are saved in the query history.
To find a search query in history:
- In the Events section, place the cursor in the query bar.
- Click the
 (SQL query history) button in the toolbar of the query window or press Ctrl+] or Ctrl+[.
This opens the query history window. The last query you ran is displayed at the top of the list of queries.
- Select a search query. To navigate the list of saved queries, press Ctrl+] or Ctrl+[.
The selected query is pasted to the search bar.
- If necessary, run the search query. To do so, press Ctrll+Enter.
When you run a query, the query history window is closed.
You can also close the query history window by pressing the Esc key; this moves the cursor to the query editing window.
You can copy the query to the clipboard by pressing Ctrl+C. This copies the part of the query that is highlighted with the mouse, or the entire query string, limited by the box, if there was no selection.
You can save the query by pressing Ctrl+S, or by clicking the ![]() button (Save query) in the row. This closes the history window and opens the sidebar for saving the query with populated fields.
button (Save query) in the row. This closes the history window and opens the sidebar for saving the query with populated fields.
You can insert a query into the query window without running it by clicking the ![]() (Insert query) button, or by pressing Enter.
(Insert query) button, or by pressing Enter.
Managing saved search queries
In KUMA, in the Events section, you can organize saved SQL queries in a tree of folders for structured storage and quick search of SQL queries. You can edit previously saved queries, rename them, arrange queries in groups (folders) of accessible tenants, and search for previously saved queries in the search bar.
Saved queries follow the tenant access model and are visible to all users that have access to the corresponding tenants.
Saved queries are placed in the Saved queries pane. You can open or close the Saved queries pane using the  (bookmark) button on the toolbar of the query window.
The Saved queries navigation pane on the left contains the following:
- The query search window where you can search by folder name and query name.
- Tree of folders and queries, the Favorites folder.
- The query filter that displays the queries you have created (on the My tab) and all queries (on the All tab)
Displaying a query in the query window
To display a query in the query window:
- In the Events section, click the (bookmark) button.
This opens the Saved queries navigation pane.
- In the tree of folders in the Saved queries pane, click to select the relevant query.
The text of the selected query is displayed in the query window.
Saving a query to a folder or a tenant
In the Events section, after entering a query in the query window and clicking the Save current query button (floppy disk icon), you can save the SQL query to one of the folders or tenants that you can select.
To save a query to a folder:
- In the New query window, in the Filter name field, enter a name for the filter.
Consider the following when naming the filter:
- The name can contain Unicode characters.
- The minimum length of a name is 1 character, and the maximum length is 128 characters.
- Names must be unique within a tenant.
- Tab characters, new line characters, and paragraph characters are replaced with space characters.
When saving the name:
- Leading and trailing spaces are removed.
- Multiple spaces between characters are replaced with a single space character.
- In the Query field, enter the text of the SQL query.
- Select a tenant, a folder from the list of folders created in the tenant that is available to you, or create a new folder by clicking the Add folder button.
You can also add a folder in the Saved queries window: click the
button next to the tenant to open the New folder window and add the folder in that window. - Click the Save button.
The query is saved in the selected folder or tenant.
Viewing the text of a query
To view the text of a query:
- In the Events section, click the (bookmark) button.
This opens the Saved queries navigation pane.
- In the tree of folders in the Saved queries pane, click the
 button next to the relevant query.
This opens a window with the text of the query.
Setting the default query
You can set your default query that the Events section displays when opened.
To set the default query:
- In the Events section, click the (bookmark) button.
This opens the Saved queries navigation pane.
- In the tree of folders in the Saved queries pane, select the relevant query.
- Click the button and in the displayed menu, select Use by default.
The selected query becomes the default query.
Adding folders and queries to favorites
To add a folder or individual query to favorites:
- In the Events section, click the (bookmark) button.
This opens the Saved queries navigation pane.
- In the tree of folders in the Saved queries pane, select the relevant folder or query.
- Click the button and in the displayed menu, select Add to favorites.
The selected folder or resource is added to the Favorites folder.
Editing a query
To edit a query:
- In the Events section, click the (bookmark) button.
This opens the Saved queries navigation pane.
- In the tree of folders in the Saved queries pane, select the relevant query.
- Click the button and in the displayed menu, select Edit.
This opens the window for editing the saved query.
- In the window, edit the query name or text, or the folder in which you want to save the query.
- Click the Save button.
The query is updated and saved in the selected folder.
Deleting a query
To delete a query from a folder (if you have sufficient rights):
- In the Events section, click the bookmark () icon.
This opens the Saved queries navigation pane.
- In the tree of folders in the Saved queries pane, select the relevant query.
- Click the three-dot icon () and in the menu that appears, select Delete.
- Confirm deletion in the displayed window.
The query is deleted.
Page top
Filtering events by period
In KUMA, you can specify the time period to display events from.
To filter events by period:
- In the Events section of the KUMA web interface in the upper part of the window, open the time period drop-down list in the top right part of the section.
- Select a period in one of the following ways:
- If you want to specify an exact date, in the calendar on the left, select the start and end date of the period and click Apply.
You can select a date up to and including the current date. The date and time format depends on your browser settings. If the Date from or Date to field has a value and you have not edited the time value manually, when you select a date in the calendar, the Date from field is automatically populated with 00:00:00.000, and the Date to field with 23:59:59.999. If you have manually deleted the value in the Date from or Date to field, when you select a date in the calendar, the field is automatically populated with the current time. After you select a value in one of the fields, the focus switches to the other field. If your Date to is earlier than your Date from, this earlier value is automatically inserted into the Date from field.
- If you want to specify a relative period, select one of the available periods in the Relative period list on the right.
The period is calculated relative to the current time.
- If you want to specify a custom period, edit the value of the Date from and Date to fields.
You can enter an exact date and time in the DD.MM.YYYY HH:mm:ss.SSS format for the Russian localization and YYYY-MM-DD HH:mm:ss.SSS for the English localization or a period relative to the current time as a formula. You can also combine these methods if necessary. If you do not specify milliseconds when entering the exact date, 000 is substituted automatically. If you have edited the time in the Date from or Date to fields, picking a date in the calendar does not change the time component.
In the relative period formulas, you can use the now parameter for the current date and time and the interval parameterization language: + (only in the Date to field), -, / (rounding to the nearest), as well as time units: y (year), M (month), w (week), d (day), h (hour), m (minute), s (second). For example, you can specify the period now-5d to get data for the last five days, or now/w to get data from the beginning of the first day of the current week (00:00:00:000 UTC) to the current time (now).
The Date from field is required, and its value cannot exceed the value of the Date from field, and also cannot be earlier than 1970-01-01 (if specifying an exact date or a relative period). The Date to cannot be earlier than the Date from. If you do not specify a value in the Date from field, now is specified automatically.
The default setting is 5 minutes (now-5m). The bounds of the period are inclusive: for example, for the Today time range, events are displayed from the beginning (00:00:00:000 UTC) of the current day to the current time (now) inclusive, and for the Yesterday period, events are displayed from the beginning (00:00:00:000 UTC) of the previous day to 00:00:00:000 UTC of the current day.
KUMA stores time values in UTC, but in the user interface time is converted to the time zone of your browser. This is relevant to the relative periods: Today, Yesterday, This week, and This month. For example, if the time zone in your browser is UTC+3, and you select the Today period, events are displayed for the period from 03:00:00.000 until now, not from 00:00:00.000 until now.
If, when selecting a relative period, such as Today, Yesterday, This week, or This month, you want to take your time zone into account when displaying events, you need to manually add a time offset in the Date from and Date to fields (if a value other than now is specified) by adding or subtracting the correct number of hours. For example, if your browser's time zone is UTC+3 and you want to display data for Yesterday, you need to change Date from to now-1d/d-3h and Date to to now/d-3h. If you want to display data for the Today period, you only need to change the value in the Date from field to now/d-3h.
If you need results up to 23:59:59:999 of yesterday, you can use an SQL query with a filter by Timestamp or specify an exact date and time.
- If you want to specify an exact date, in the calendar on the left, select the start and end date of the period and click Apply.
- If you want to capture the last relative period for which a query was executed as an exact date and time, click the
 button.
The relative period is then converted to an exact date and time. Hovering over this button displays the date and time that will be captured. Relative periods (Today, Yesterday, This week, This month) are converted to an exact UTC date and time, other periods are converted to a date and time that takes into account the time zone of the browser.
If you have executed an SQL query with event grouping, when switching between groups in the query results, the relative time range is automatically converted to an exact date and time.
- Click Run query to run the query.
Only events registered during the specified time period are displayed. The period will be displayed in the upper part of the window.
You can also configure the display of events by using the events histogram that is displayed when you click the  button in the upper part of the Events section. Events are displayed if you click the relevant data column or select the relevant time period and click the Show events button.
Grouping events
After getting a list of events, you often need to split the events into groups to localize an information security event. KUMA can group events in a list by one or more fields.
To group events, you no longer need to manually edit the text of the query; instead, you can click a column heading in the Events section and select Add GROUP BY to the query in the context menu. You can select a sequence of multiple fields to group by, and the fields will be automatically added to the query string. Having selected your fields, click Run query. As a result, events are grouped by the specified fields. Found groups are displayed in the Groups section. They can be displayed as a table and as cards. You can toggle between the display modes.
You can exclude a group from the query:
- In Cards mode, click the - button.
- In Tables mode, right-click the group and in the context menu, select Exclude group from filter.
As a result, the query is automatically modified and the group is excluded from the query.
If you want to go back to the original query, click Revert to original query.
You can navigate through the groups and view the contents of each group.
You can do a global search in all groups or a local search in events within a selected group.
You can use more complex grouping by adding one or more fields.
You can remove a group from the grouping and in this way, go back one step.
If the grouping query returns many events, only the first 1000 events are displayed. If the query contains SELECT Count(ID), you can click the link with the total number of events in the query result to view all events. If the request does not contain Count(ID), the number of events in the group is not indicated, but you still can click the link and view the total number of events in the group.
Statistics, retrospective check by group, and export to TSV are available.
If you want the grouping result to be independent of time (because events arrive continuously), you can set a fixed relative interval and apply it as an absolute interval so that the events of interest do not drop out of the selection. To fix a relative interval, in the Events section, in the time interval drop-down list, select Apply current range. You can now manage groups within this query.
If you want to arrange the selected events by months, days, minutes, and seconds, you can group events by the Timestamp field. To group events, select a grouping option in the context menu of the Timestamp field in the event table.
If you want to normalize the value of the Timestamp field and display the time values from different sources in the same UTC time scale, select Convert to UTC in the context menu of the Timestamp field in the events table.
Page top
Displaying names instead of IDs
When accessing certain event fields with IDs, KUMA returns the corresponding names rather than IDs. This helps make the information more readable. For example, if you access the TenantID event field (which stores the tenant ID), you get the value of the TenantName event field (which stores the tenant name).
When exporting events, values of both fields are written to the file, the ID as well as the name.
The table below lists the fields that are substituted when accessed:
Requested field |
Returned field |
|
|
|
|
|
|
|
|
|
|
|
|
|
|
Substitution does not occur if an alias is assigned to the field in the SQL query. Examples:
SELECT TenantID FROM `events` LIMIT 250— in the search result, the name of the tenant is displayed in the TenantID field.SELECT TenantID AS Tenant_name FROM `events` LIMIT 250— in the search result, the tenant ID will be displayed in the Tenant_name field.
Presets
You can use
to simplify work with queries if you regularly view data for a specific set of event fields. In the line with the SQL query, you can typeSelect * and select a saved preset; in that case, the output is limited only to the fields specified in the preset. This method slows down performance but eliminates the need to write a query manually every time. Presets are saved on the KUMA Core server and are available to all KUMA users of the specified tenant.
To create a preset:
- In the Events section, click the icon.
- In the window that opens, on the Event field columns tab, select the required fields.
To simplify your search, you can start typing the field name in the Search area.
- To save the selected fields, click Save current preset.
The New preset window opens.
- In that window, specify the Name of the preset, and in the drop-down list, select the Tenant.
- Click Save.
The preset is created and saved.
To apply a preset:
- In the query entry field, enter Select *.
- In the Events section of the KUMA web interface, click the icon.
- In the opened window, use the Presets tab to select the relevant preset and click the
 button.
The fields from the selected preset are added to the SQL query field, and the columns are added to the table. No changes are made in Builder.
- Click Run query to run the query.
After the query execution completes, the columns are filled in.
Limiting the complexity of queries in alert investigation mode
When investigating an alert, the complexity of SQL queries for event filtering is limited if Related to alert is selected in the drop-down list of event sources. If this is the case, only the functions and operators listed below are available for event filtering.
If All events is selected from the drop-down list of event sources, these limitations do not apply.
SELECT- The
*character is used as a wildcard to represent any number of characters.
- The
WHEREAND,OR,NOT,=,!=,>,>=,<,<=INBETWEENLIKEinSubnet
Examples:
WHERE Type IN ('Base', 'Correlated')WHERE BytesIn BETWEEN 1000 AND 2000WHERE Message LIKE '%ssh:%'WHERE inSubnet(DeviceAddress, '10.0.0.1/24')
ORDER BYSorting can be done by column.
OFFSETSkip the indicated number of lines before printing the query results output.
LIMITThe default value is 250.
If you are filtering events by user-defined period and the number of strings in the search results exceeds the defined value, you can click the Show next button to display additional strings in the table. This button is not displayed when filtering events by the standard period.
When filtering by alert-related events in alert investigation mode, you cannot perform operations on the data of event fields or assign names to the columns of displayed data.
Page top
Saving and selecting events filter configuration
In KUMA, you can save a filter configuration and use it in the future. Other users can also use the saved filters if they have the appropriate access rights. When saving a filter, you are saving the configured settings of all the active filters at the same time, including the time-based filter, query builder, and the events table settings. Search queries are saved on the KUMA Core server and are available to all KUMA users of the selected tenant.
To save the current settings of the filter, query, and period:
- In the Events section of the KUMA web interface, click the
 icon next to the filter expression.
This opens the New filter window.
- In the window that opens, enter the name of the filter configuration in the Name field. The name can contain up to 128 Unicode characters.
- Under Select folder, select the tenant to which you want the created filter to belong and the folder inside the tenant, if necessary.
To simplify your search, you can start typing the name in the Search area.
- If necessary, click Add folder to create a new folder inside the selected tenant.
- Click Save.
The filter configuration is now saved.
To select a previously saved filter configuration:
In the Events section of the KUMA web interface, click the  icon next to the filter expression and select the relevant filter.
The selected configuration is active, which means that the search field is displaying the search query, and the upper part of the window is showing the configured settings for the period and frequency of updating the search results. Click the Run query button to submit the search query.
To add the filter configuration to favorites, you can hover over the name of the filter configuration, click the  icon next to the name of the configuration and click the Add to favorites button.
Deleting event filter configurations
To delete a previously saved filter configuration:
- In the Events section of the KUMA web interface, click the icon next to the filter search query.
This opens the Saved queries window.
- Hover over the configuration that you want to delete and click the icon next to its name.
- This opens a menu; in the menu, click the
 icon.
icon.
The filter configuration is now deleted for all KUMA users.
Page top
Supported ClickHouse functions
The following ClickHouse functions are supported in KUMA:
- Arithmetic functions.
- Arrays.
- Comparison functions.
- Logical functions.
- Type conversion functions.
- Date and time functions.
- String functions.
- String search functions.
- Conditional functions: only the regular 'if' operator; the ternary operator is not supported.
- Mathematical functions.
- Rounding functions.
- Functions for splitting and merging strings and arrays.
- Bit functions.
- Functions for working with UUIDs.
- Functions for working with URLs.
- Functions for working with IP addresses.
- Functions for working with Nullable arguments.
- Functions for working with geographic coordinates.
Functions from other sections are not supported.
For more details on SQL, refer to the ClickHouse documentation.
Page top
Viewing event detail areas
To view information about an event:
- In the application web interface window, select the Events section.
- Search for events by using the query builder or by entering a query in the search field.
The event table is displayed.
- Select the event whose information you want to view.
The event details window opens.
The Event details area appears in the right part of the web interface window and contains a list of the event's parameters with values. In this area you can:
- Include the selected field in the search or exclude it from the search by clicking or next to the setting value.
- Clicking a file hash in the FileHash field opens a list in which you can select one of the following actions:
- Show info from Threat Lookup.
This is available when integrated with Kaspersky Threat Intelligence Portal.
- Add to Internal TI of CyberTrace.
- This is available when integrated with Kaspersky CyberTrace.
- Show info from Threat Lookup.
- Open a window containing information about the asset if it is mentioned in the event fields and registered in the application.
- You can click the link containing the collector name in the Service field to view the settings of the service that registered the event.
You can also link an event to an alert if the application is in alert investigation mode and open the Correlation event details window if the selected event is a correlation event.
In the Event details area, the name of the described object is shown instead of its ID in the values of the following settings. At the same time, if you change the filtering of events by this setting (for example, by clicking to exclude events with a certain setting-value combination from search results), the object's ID, and not its name, is added to the SQL query:
- TenantID
- ServiceID
- DeviceAssetID
- SourceAssetID
- DestinationAssetID
- SourceAccountID
- DestinationAccountID
Exporting events
In KUMA, you can export information about events to a TSV file. The selection of events that will be exported to a TSV file depends on filter settings. The information is exported from the columns that are currently displayed in the events table. The columns in the exported file are populated with the available data even if they did not display in the events table in the KUMA web interface due to the special features of the SQL query.
To export information about events:
- In the Events section of the KUMA web interface, click the TSV button in the upper part of the table of events.
The new export TSV file task is created in the Task manager section.
- Find the task you created in the Task manager section.
When the file is ready to be downloaded, the Status column of the task displays the Completed status and the
 icon.
icon. - Click the task type name and select Upload from the drop-down list.
The TSV file will be downloaded using your browser's settings. By default, the file name is event-export-<date>_<time>.tsv.
The file is saved based on your web browser's settings.
Page top
Configuring the table of events
Responses to user SQL queries are presented as a table in the Events section. The fields selected in the custom query appear at the end of the table, after the default columns. This table can be updated.
The following columns are displayed in the events table by default:
- TenantID.
- Timestamp.
- Name.
- DeviceProduct.
- DeviceVendor.
- DestinationAddress.
- DestinationUserName.
In KUMA, you can customize the displayed set of event fields and their display order. The selected configuration can be saved.
When using SQL queries with data grouping and aggregation for filtering events, statistics are not available and the order of displayed columns depends on the specific SQL query.
In the events table, in the event details area, in the alert window, and in the widgets, the names of assets, accounts, and services are displayed instead of the IDs as the values of the SourceAssetID, DestinationAssetID, DeviceAssetID, SourceAccountID, DestinationAccountID, and ServiceID fields. When exporting events to a file, the IDs are saved, but columns with names are added to the file. The IDs are also displayed when you point the mouse over the names of assets, accounts, or services.
Searching for fields with IDs is only possible using IDs.
To configure the fields displayed in the events table:
- Click the icon in the upper-right corner of the events table.
A window for selecting the event fields that should be displayed in the events table will be displayed.
- Select the check boxes opposite the fields that you want to view in the table. You can search for relevant fields by using the Search field.
You can configure the table to display any event field from the KUMA event data model and the extended event schema. The Timestamp and Name parameters are always displayed in the table. Click the Default button to display only default event parameters in the events table.
When you select a check box, the events table is updated and a new column is added. When a check box is cleared, the column disappears.
You can also remove columns from the events table by clicking the column title and selecting Hide column from the drop-down list.
- If necessary, change the display order of the columns by dragging the column headers in the event tables.
- If you want to sort the events by a specific column, click its title and in the drop-down list select one of the available options: Ascending or Descending.
The selected event fields will be displayed as columns in the table of the Events section in the order you specified.
Page top
Refreshing events table
You can update the displayed event selection with the most recent entries by refreshing the web browser page. You can also refresh the events table automatically and set the frequency of updates. Automatic refresh is disabled by default.
To enable automatic refresh,
Select a refresh rate from the drop-down list in the upper-right part of the Events section:
- 5 seconds
- 15 seconds
- 30 seconds
- 1 minute
- 5 minutes
- 15 minutes
The events table now refreshes automatically.
To disable automatic refresh:
In the drop-down list of refresh rates in the upper-right part of the Events section, select No refresh.
Page top
Getting events table statistics
You can get statistics for the current events selection displayed in the events table. The selected events depend on the filter settings.
To obtain statistics:
Select Statistics from the drop-down list in the upper-right corner of the events table, or click on any value in the events table and select Statistics from the opened context menu.
The Statistics details area appears with the list of parameters from the current event selection. The numbers near each parameter indicate the number of events with that parameter in the selection. If a parameter is expanded, you can also see its five most frequently occurring values. You can find relevant parameters by using the Search fields field.
In a high availability configuration, for all event fields that contain the FQDN of the Core, the Statistics section displays core instead of the FQDN.
The Statistics window allows you to modify the events filter.
When using SQL queries with data grouping and aggregation for filtering events, statistics are not available.
Page top
Viewing correlation event details
You can view the details of a correlation event in the Correlation event details window.
To view information about a correlation event:
- In the Events section of the KUMA web interface, click a correlation event.
You can use filters to find correlation events by assigning the
correlatedvalue to theTypeparameter.The details area of the selected event will open. If the selected event is a correlation event, the Detailed view button will be displayed at the bottom of the details area.
- Click the Detailed view button.
The correlation event window will open. The event name is displayed in the upper left corner of the window.
The Correlation event details section of the correlation event window contains the following data:
- Correlation event severity—the importance of the correlation event.
- Correlation rule—the name of the correlation rule that triggered the creation of this correlation event. The rule name is represented as a link that can be used to open the settings of this correlation rule.
- Correlation rule severity—the importance of the correlation rule that triggered the correlation event.
- Correlation rule ID—the identifier of the correlation rule that triggered the creation of this correlation event.
- Tenant—the name of the tenant that owns the correlation event.
The Related events section of the correlation event window contains the table of events related to the correlation event. These are base events that actually triggered the creation of the correlation event. When an event is selected, the details area opens in the right part of the web interface window.
The Find in events link to the right of the section header is used for alert investigation.
The Related endpoints section of the correlation event window contains the table of hosts related to the correlation event. This information comes from the base events related to the correlation event. Clicking the name of the asset opens the Asset details window.
The Related users section of the correlation event window contains the table of users related to the correlation event. This information comes from the base events related to the correlation event.
Generating an SQL query using KUMA SQL functions
KUMA's SQL functions allow using the attributes of assets and accounts in search queries to filter events, generate reports and widgets (graph type: Table). You can enrich events with data from dictionaries, tables, assets, and accounts using the following sets of functions:
- The enrich function set. Allows enriching query results with fields of the asset or account, values from a dictionary of the Dictionary type or a dictionary of the Table type. The
enrichfunction set includes the following functions:enrich_assetsenrich_accountsenrich_tableenrich_dictionary
- The lookup function set. Allows adding conditions for assets and accounts to the search query. The
lookupfunction set includes the following functions:lookup_assetslookup_accountslookup_assets_category
The maximum number of events per query is 10,000.
Page top
Using the 'enrich' function set in SQL queries
The enrich function set (see the table below) is used in the SELECT clause of an SQL query to enrich the results.
When using this set of functions, you cannot group events by enriched fields.
Widgets and reports enriched by the functions must be owned by no more than one tenant.
The values of asset fields that are specified in SQL queries are case-sensitive.
Description of the 'enrich' set of functions
Function |
Event field |
Asset field |
Description |
|---|---|---|---|
|
|
|
Enriches the query result with asset fields based on the ID specified passed to the function. For example:
|
|
|
|
Enriches the query result with account fields based on the ID specified passed to the function. For example:
This function is available only for tenants that have LDAP enrichment enabled. |
|
|
|
Enriches the query result with values from a dictionary of the Table type based on event fields in the response from the ClickHouse cluster. For example:
Only one column of the table can be the key, but the record key can be a compound key. For example:
The |
|
|
|
Enriches the query result with values from a dictionary of the Dictionary type based on event fields in the response from the ClickHouse cluster. For example:
You can view the path to the dictionary in the Resources → Dictionaries section. |
Example SQL queries with an enrich function You can specify an
|
Using the 'lookup' function set in SQL queries
The lookup function set (see the table below) is used in the WHERE clause of an SQL query to add conditions for assets and accounts to the search query.
Description of the 'lookup' set of functions
Function type |
Event field |
Asset field |
Operator |
Description |
|---|---|---|---|---|
|
|
|
|
Allows you to add conditions to the query result for assets whose field values match the value specified in the query. For values that are number, you must specify a string with the required number. For example:
|
|
|
Allows you to add conditions for assets with field values that are:
For values that are number, you must specify a string with the required number. For example:
Date values can be specified in the following formats:
|
||
|
|
Allows you to add asset conditions to the query result using a string literal or a regular expression. For example:
Using a case-insensitive regular expression (PCRE2) is allowed. |
||
|
|
Allows you to add to the result asset conditions whose values match the value specified in the query. For example:
|
||
|
|
Allows you to add conditions for assets with IP addresses in the specified subnet. The IP address is specified in CIDR format. For example:
|
||
|
|
Allows you to add conditions for assets with IP addresses in the specified range. The first IP address specified in the query is the start IP address, and the second is the end address. For example:
The query filters assets with IP addresses in the range from 192.168.1.1 to 192.168.1.184. |
||
|
|
|
|
Allows you to add conditions to the query result for accounts whose field values match the value specified in the query. For values that are number, you must specify a string with the required number. For example:
|
|
|
Allows you to add conditions to the query result for accounts whose field values match the 'like' expression specified in the query. For more information about the like operator, please refer to the SQL Language Expressions reference.
|
||
|
|
|
|
Finds all events that have associated assets in the specified folder. For example:
where |
Example SQL queries with a lookup function You can specify a
|
Event route tracing
To find out which connection the events were received from, you can use the Trace event route setting. You may need to trace the route of an event when multiple agents send events to the same collector, for example, in a large infrastructure where agents are installed on dedicated WEC servers and multiple agents send events to the same collector. The event route information can be useful for troubleshooting event routing.
For the Trace event route toggle switch to become available, you must specify at least one internal destination in the agent. Also, to trace event routes, a connector of the internal type must be specified in the collector that is receiving events from the agent. After configuring and saving the agent, information about the agent's route is added to the S.KL_EventRoute field of the extended event schema.
The S.KL_EventRoute field is displayed only for new events that are received by the collector after enabling the Trace event route setting. Other services through which the event passes, including the collector, correlator (only correlation rules of the 'simple' type), and router, parse the S.KL_EventRoute field, and, if the field is not empty, add their own information to the field when they process the event.
If there is a proxy between the sender server and the agent, the proxy address is specified in the S.KL_EventRoute field on the agent, and the collector adds the proxy address to the initial part of the route in the S.KL.EventRoute field.
Connectors of the tcp/udp/http type use the internal protocol to pass the address of the host that sent the event in the S.KL_EventRoute field. If there is a proxy between the sender server and the agent, the proxy is specified indicated in the S.KL_EventRoute field. The WEC, WMI, and ETW agents use the internal protocol to pass the host name of the Windows server on which the agent is installed in the S.KL_EventRoute field.
You can enable event route tracing in one of the following ways:
- Create a new agent, specify the internal destination in it and enable the Trace event route option.
- In an existing agent, add a tab with a new connection and specify the internal destination on this tab. After you specify the internal destination, the Trace event route option becomes available. Enable the Trace event route toggle switch. After you save the agent settings, restart the agent to apply the changes.
- Unlink the automatically created agent from the collector to make the agent available for editing its settings, or duplicate the automatically created agent and proceed to configure the settings in the duplicate agent. After you specify the internal destination in the editable agent, the Trace event route option becomes available. Enable the Trace event route toggle switch. After you save the agent settings, restart the agent to apply the changes.
The Event tracing log section appears in the event card, alert card and correlation event card. This section displays information from the S.KL_EventRoute field in a processed form. Service IDs are converted to service names and displayed as clickable links. Clicking a service name opens a new browser tab with the card of the service. If you rename the service, the name of the service also changes when the event is displayed in the card, both for new events and for events that have already been received and processed. If you delete a service in the Active services section, the Event tracing log section displays Deleted instead of the hyperlink. The rest of the route information is not deleted and continues to be displayed: connector type, FQDN, and the value of the SourceAddress field. To view raw route information, you can add the S.KL_EventRoute column to the event table.
Using route information
You can use the 'Extract from JSON' function or other ClickHouse functions to get the parts of the route that you need for debugging. For more information about functions, please refer to the ClickHouse documentation: https://clickhouse.com/docs/en/sql-reference/functions/json-functions#jsonextractstringjson-indices-or-keys
The following table gives examples of queries.
Query example |
Description |
|
This query displays events for which the version of the collector is displayed in the version column. |
|
This query displays events for which the type of the collector is displayed in the connectorKind column. |
|
This query displays events received from connectors of a type other than 'wec'. |
If want to select by a different value from the S.KL_EventRoute field, you can look up the name of your parameter in the events table in the Raw column and use it in your query.
Page top
Categorization of events
Categorization allows you to use special tags (categories) to describe events of the same type coming from different sources. This helps to find events related to, for example, user authentication or command execution, and helps in writing correlation logic or displaying data in a dashboard or in reports. You can use the KUMA resource set to categorize certain types of events for specific types of event sources.
The following types of KUMA resources are used to categorize events:
- A dictionary with categories of events
- Enrichment rules for enriching events with supplemental information.
- A normalizer for creating an extended event schema field used in enrichment rules.
As part of categorization, the following attributes can be added to an event:
- Object
- Action
- Result
- Threat
- Source type
Additional attributes can be assigned to the event, which are saved in the SA.KL_EventCategory extended event schema field.
Descriptions of the possible values of the attributes used for categorizing events are provided in tables: Object attribute, Action attribute, Result attribute, Threat attribute, Source type attribute.
To customize the categorization of events on a collector:
- Import the [OOTB] Event Categorization package from the KUMA repository.
- In the collector, at the Event enrichment step, apply an event enrichment rule.
You can apply the enrichment rule when creating a new collector or for an existing collector. The rule that you need to apply depends on the event source. You can select a rule from the Categorization rules by event source table.
Event categorization works only when using Kaspersky normalizers.
- In the KUMA web interface, select the Resources → Active services section.
- Select the check box next to the modified collector and click the Update configuration button.
The enrichment rule is applied, and the categorization of events is performed.
Categorization rules by event source
System name |
Normalizer name |
Enrichment rule name |
Microsoft, OS event logs |
[OOTB] Microsoft Products for KUMA 3 |
[OOTB] Event categorization. Microsoft Products |
Microsoft Sysmon |
[OOTB] Microsoft Products for KUMA 3 |
[OOTB] Event categorization. Microsoft Products |
Auditd |
[OOTB] Linux auditd syslog for KUMA 3.2 |
[OOTB] Event categorization. Auditd |
Kaspersky Security Center |
[OOTB] KSC from SQL |
[OOTB] Event categorization. Kaspersky Security Center |
Kaspersky Security for Linux Mail Server |
[OOTB] KLMS syslog CEF |
[OOTB] Event categorization. Kaspersky Security for Linux Mail Server |
Kaspersky IoT Secure Gateway |
[OOTB] Kaspersky KISG syslog |
[OOTB] Event categorization. Kaspersky IoT Secure Gateway |
Kaspersky Container Security |
[OOTB] Syslog-CEF |
[OOTB] Event categorization. Kaspersky Container Security |
Kaspersky Industrial CyberSecurity for Networks |
[OOTB] Kaspersky Industrial CyberSecurity for Networks 4.2 syslog |
[OOTB] Event categorization. Kaspersky Industrial CyberSecurity for Networks |
Kaspersky Web Traffic Security |
[OOTB] KWTS syslog CEF |
[OOTB] Event categorization. Kaspersky Web Traffic Security |
Kaspersky Mail Security Gateway |
[OOTB] KSMG syslog CEF |
[OOTB] Event categorization. Kaspersky Mail Security Gateway |
Object attribute
Value of the Object attribute |
Description |
account |
Accounts |
configuration |
Settings |
connection |
Network connection |
container |
Containers |
data |
Data or tables in the database |
dns |
DNS queries |
file |
Files |
group |
Groups |
host |
Host |
http |
WEB requests |
image |
DLLs and drivers |
malware |
Malicious object |
permission |
Rights and privileges |
process |
Process |
registry |
Registry keys |
service |
Services and daemons |
task |
Tasks |
VM |
Virtual machine |
device |
Token, USB device, attached device |
certificate |
Certificate |
Action attribute
Value of the Action attribute |
Description |
access |
Request or grant access to an object |
add |
Create or add |
authentication |
Authenticate |
block |
Block, prevent |
delete |
Delete |
detect |
Detect or quarantine |
end |
End of the process |
info |
Informational event about the object |
load |
Load object |
modify |
Modify settings or state of the object |
read |
Read |
receive |
Receive |
request |
Query |
send |
Send |
start |
Start of the process |
write |
Write |
Result attribute
Value of the Result attribute |
Description |
error |
Error |
failure |
Failure |
success |
Success |
Threat attribute
Value of the Threat attribute |
Description |
malware |
Malicious object in the file system |
vulnerability |
Vulnerability exploits |
attack |
Attack |
ddos |
Indicators of a DDoS attack |
phishing |
Indicators of phishing |
c2 |
Command and Control |
discovery |
Reconnaissance |
policy violation |
Violation of security policies |
tools |
Suspicious tools used |
escalation |
Privilege escalation |
Source type attribute
Value of the Source type attribute |
Description |
application |
Application-level events: logins, configuration changes, errors, and so on. |
AV |
Events received from anti-virus protection systems. |
database |
Events from databases related to data manipulation. |
IDS |
Events from traffic analyzers and network protection tools. |
network |
Events containing information about network connections coming from firewalls; also events from Netflow, Jflow, and so on. |
OS |
Events from the operating system, such as Windows, Linux, Cisco IOS, HP-UX, and so on. Standard operating system tools or EDR can be the event provider. |
vpn |
VPN session events. |
web |
Events coming from WEB applications and Proxy. Application-level HTTP connection events. |
container |
Events providing information about the operation of containers. |
Granular access to events
In KUMA, users with different rights can have granular access to events. Access to events is controlled at the level of storage spaces.
You can assign spaces to users in the Spaces permissions section or directly in a user's card. After upgrading to version 3.4, the 'All spaces' space set is assigned to all existing users, that is, access to all spaces is unrestricted. An event contains a tenant ID and a space ID, therefore the user needs rights to the corresponding tenant and space to have access to the event.
Keep in mind the following special considerations involved in displaying storages:
- If a storage is not listed in the Active services section, the storage and its spaces are not displayed in the list of spaces of the set.
- If the storage service was stopped using the
systemctl stop kuma-<storage ID>command, the storage and its spaces are not displayed in the list of spaces of the set. - If the storage was started and then deleted using the
uninstallcommand, the storage and its spaces remain in the list of spaces of the set.
In the list of events, you can add the SpaceID field to the table, which will display the name of the space. The space of audit events is displayed as KUMA Audit. KUMA Default is the space inside each storage, where all events go if the storage does not have configured spaces or if the event does not match the conditions of the existing spaces.
When you export the list of events to a TSV file, the space ID and name are displayed for spaces.
To differentiate access:
- Assign appropriate roles to users.
- Configure the space sets.
You can create, edit, or delete space sets. These actions result in audit events.
- Configure the access rights of the space set: you can grant or revoke access rights of selected users.
Use cases
Migrating to KUMA 3.4 with differentiated access to events
Restricting access to spaces for all users
Allowing some users to view all events
Permitting some users to view events from a finite set of spaces
Supplementing an explicitly specified space set for a user
Page top
Dashboard
In the Dashboard section, you can monitor the security status of your organization's network.
The dashboard is a set of widgets that display network security data analytics. You can view data only for those tenants to which you have access.
A selection of widgets used in the dashboard is called a layout. You can create layouts manually or use predefined layouts. You can edit widget settings in predefined layouts as necessary. By default, the dashboard displays the Alerts Overview predefined layout.
Only users with the Main administrator, Tenant administrator, Tier 2 analyst, and Tier 1 analyst roles can create, edit, or delete layouts. Users accounts with all roles can view layouts and set default layouts. If a layout is set as default, that layout is displayed for the account every time the user navigates to the Dashboard section. The selected default layout is saved for the current user account.
The information on the dashboard is updated in accordance with the schedule configured in layout settings. If necessary, you can force the update of the data.
For convenient presentation of information on the dashboard, you can enable TV mode. This mode lets you view the dashboard in full-screen mode in FullHD resolution. In TV mode, you can also configure a slide show display for the selected layouts.
Creating a dashboard layout
To create a layout:
- Open the KUMA web interface and select the Dashboard section.
- Open the drop-down list in the top right corner of the Dashboard window and select Create layout.
The New layout window opens.
- In the Tenants drop-down list, select the tenants that will own the created layout and whose data will be used to fill the widgets of the layout.
The selection of tenants in this drop-down list does not matter if you want to create a universal layout (see below).
- In the Time period drop-down list, select the time period from which you want to get analytics:
- If you want to specify an exact date, in the calendar on the left, select the start and end date of the period and click Apply.
You can select a date up to and including the current date. The date and time format depends on your browser settings. If the Date from or Date to field has a value and you have not edited the time value manually, when you select a date in the calendar, the Date from field is automatically populated with 00:00:00.000, and the Date to field with 23:59:59.999. If you have manually deleted the value in the Date from or Date to field, when you select a date in the calendar, the field is automatically populated with the current time. After you select a value in one of the fields, the focus switches to the other field. If your Date to is earlier than your Date from, this earlier value is automatically inserted into the Date from field.
- If you want to specify a relative period, select one of the available periods in the Relative period list on the right.
The period is calculated relative to the current time.
- If you want to specify a custom period, edit the value of the Date from and Date to fields.
You can enter an exact date and time in the DD.MM.YYYY HH:mm:ss.SSS format for the Russian localization and YYYY-MM-DD HH:mm:ss.SSS for the English localization or a period relative to the current time as a formula. You can also combine these methods if necessary. If you do not specify milliseconds when entering the exact date, 000 is substituted automatically. If you have edited the time in the Date from or Date to fields, picking a date in the calendar does not change the time component.
In the relative period formulas, you can use the now parameter for the current date and time and the interval parameterization language: + (only in the Date to field), -, / (rounding to the nearest), as well as time units: y (year), M (month), w (week), d (day), h (hour), m (minute), s (second). For example, you can specify the period now-5d to get data for the last five days, or now/w to get data from the beginning of the first day of the current week (00:00:00:000 UTC) to the current time (now).
The Date from field is required, and its value cannot exceed the value of the Date from field, and also cannot be earlier than 1970-01-01 (if specifying an exact date or a relative period). The Date to cannot be earlier than the Date from. If you do not specify a value in the Date from field, now is specified automatically.
By default, the 1 day (now-1d) relative period is selected. The bounds of the period are inclusive: for example, for the Today time range, events are displayed from the beginning (00:00:00:000 UTC) of the current day to the current time (now) inclusive, and for the Yesterday period, events are displayed from the beginning (00:00:00:000 UTC) of the previous day to 00:00:00:000 UTC of the current day.
KUMA stores time values in UTC, but in the user interface time is converted to the time zone of your browser. This is relevant to the relative periods: Today, Yesterday, This week, and This month. For example, if the time zone in your browser is UTC+3, and you select Today as the data display period, data will be displayed for the period from 03:00:00.000 until now, not from 00:00:00.000 until now.
If you want to take your time zone into account when selecting a relative data display period, such as Today, Yesterday, This week, or This month, you need to manually add a time offset in the Date from and Date to fields (if a value other than now is specified) by adding or subtracting the correct number of hours. For example, if your browser's time zone is UTC+3 and you want to display data for Yesterday, you need to change Date from to now-1d/d-3h and Date to to now/d-3h. If you want to display data for the Today period, you only need to change the value in the Date from field to now/d-3h.
If you need results up to 23:59:59:999 UTC of yesterday, you can use an SQL query with a filter by Timestamp or specify an exact date and time.
- If you want to specify an exact date, in the calendar on the left, select the start and end date of the period and click Apply.
- In the Refresh every drop-down list, select how often data should be updated in layout widgets:
- never — never refresh data in widgets of the layout
- 1 minute
- 5 minutes
- 15 minutes
- 1 hour (default)
- 3 hours
- 6 hours
- 12 hours
- 24 hours
In the Add widget drop-down list, select the required widget and configure its settings. You can add multiple widgets. You can drag widgets around the window and resize them using the diagonal (
 ) button that appears when you hover over a widget.
The following limitations apply to widgets with the Pie chart, Bar chart, Line chart, Counter, and Date Histogram chart types:
- In
SELECTqueries, you can use extended event schema fields ofString,Number, andFloattypes. - In
WHEREqueries, you can use all types of extended event schema fields (String,Number,Float,Array of strings,Array of numbers, andArray of floats).
For widgets with the Table chart type, in
SELECTqueries, you can use all types of extended event schema fields (String,Number,Float,Array of strings,Array of numbers, andArray of floats).You can do the following with widgets:
- Add widgets.
- Edit widgets.
To edit widget:
- Hover over the required widget and click the gear () icon that appears.
- In the drop-down list select Edit.
The window with widget parameters opens. You can check how the widget will look like by clicking the Preview button.
- Update widget parameters and click the Save button.
- Hover over the required widget and click the gear (
You can edit and delete a widget added to the layout by hovering over the widget, clicking the gear (
) icon that appears, and then selecting Edit or Delete. - In the Layout name field, enter a unique name for this layout. Must contain 1 to 128 Unicode characters.
- If necessary, click the gear () icon on the right of the layout name field and select the check boxes next to the additional layout settings:
- Universal—if you select this check box, layout widgets display data from tenants that you select in the Selected tenants section in the menu on the left. This means that the data in the layout widgets will change based on your selected tenants without having to edit the layout settings. For universal layouts, tenants selected in the Tenants drop-down list are not taken into account.
If this check box is cleared, layout widgets display data from the tenants that are selected in the Tenants drop-down list in the layout settings. If any of the tenants selected in the layout are not available to you, their data will not be displayed in the layout widgets.
You cannot use the Active lists and context tables widget in universal layouts.
Universal layouts can only be created and edited by General administrators. Such layouts can be viewed by all users.
- Show CII-related data—if you select this check box, layout widgets will also show data on assets, alerts, and incidents related to critical information infrastructure (CII). In this case, these layouts will be available for viewing only by users whose settings have the Access to CII facilities check box selected.
If this check box is cleared, layout widgets will not display data on CII-related assets, alerts, and incidents, even if the user has access to CII objects.
- Universal—if you select this check box, layout widgets display data from tenants that you select in the Selected tenants section in the menu on the left. This means that the data in the layout widgets will change based on your selected tenants without having to edit the layout settings. For universal layouts, tenants selected in the Tenants drop-down list are not taken into account.
- Click Save.
The new layout is created and is displayed in the Dashboard section of the KUMA web interface.
Page top
Selecting a dashboard layout
To select a dashboard layout:
- Expand the list in the upper right corner of the Dashboard window.
- Select the relevant layout.
The selected layout is displayed in the Dashboard section of the KUMA web interface.
Page top
Selecting a dashboard layout as the default
To set a dashboard layout as the default:
- In the KUMA web interface, select the Dashboard section.
- Expand the list in the upper right corner of the Dashboard window.
- Hover the mouse cursor over the relevant layout.
- Click the
 icon.
icon.
The selected layout is displayed on the dashboard by default.
Page top
Editing a dashboard layout
To edit a dashboard layout:
- In the KUMA web interface, select the Dashboard section.
- Expand the list in the upper right corner of the window.
- Hover the mouse cursor over the relevant layout.
- Click the icon.
The Customizing layout window opens.
- Make the necessary changes. The settings that are available for editing are the same as the settings available when creating a layout.
- Click the Save button.
The dashboard layout is edited and displayed in the Dashboard section of the KUMA web interface.
If the layout is deleted or assigned to a different tenant while are making changes to it, an error is displayed when you click Save. The layout is not saved. Refresh the KUMA web interface page to see the list of available layouts in the drop-down list.
Page top
Deleting a dashboard layout
To delete layout:
- In the KUMA web interface, select the Dashboard section.
- Expand the list in the upper right corner of the window.
- Hover the mouse cursor over the relevant layout.
- Click the icon and confirm this action.
The layout is deleted.
Page top
Enabling and disabling TV mode
It is recommended to create a separate user with the minimum required set of right to display analytics in TV mode.
To enable TV mode:
- In the KUMA web interface, select the Dashboard section.
- Click the
 button in the upper-right corner.
The Settings window opens.
- Move the TV mode toggle switch to the Enabled position.
- To configure the slideshow display of the layouts, do the following:
- Move the Slideshow toggle switch to the Enabled position.
- In the Timeout field, indicate how many seconds to wait before switching layouts.
- In the Queue drop-down list, select the layouts to view. If no layout is selected, the slideshow mode displays all layouts available to the user one after another.
- If necessary, change the order in which the layouts are displayed using the button to drag and drop them.
- Click the Save button.
TV mode will be enabled. To return to working with the KUMA web interface, disable TV mode.
To disable TV mode:
- Open the KUMA web interface and select the Dashboard section.
- Click the button in the upper-right corner.
The Settings window opens.
- Move the TV mode toggle switch to the Disabled position.
- Click the Save button.
TV mode will be disabled. The left part of the screen shows a pane containing sections of the KUMA web interface.
When you make changes to the layouts selected for the slideshow, those changes will automatically be applied to the active slideshow sessions.
Page top
Predefined dashboard layouts
KUMA comes with a set of predefined layouts: The default refresh period for predefined layouts is Never. You can edit these layouts as needed.
Predefined layouts
Layout name |
Description of widgets in the layout |
|---|---|
Alerts Overview |
|
Incidents Overview |
|
Network Overview |
|
[OOTB] KATA & EDR |
|
[OOTB] KSC |
|
[OOTB] KSMG |
|
[OOTB] KWTS |
|
[OOTB] KSMG files and hashes* |
|
[OOTB] KSMG rules and URLs* |
|
[OOTB] KSMG results* |
|
[OOTB] KSMG e-mail subjects and accounts* |
|
*Dashboards are available starting from KUMA 3.4.1. Widgets will correctly display information when using the "[OOTB] KSMG 2.1+ syslog CEF" normalizer.
Page top
Reports
You can schedule the generation of process and object status reports in KUMA.
All reports are generated using report templates. You can find report templates in the Reports section on the Templates tab.
You can find the generated reports in the Reports section on the Generated reports tab.
To save the generated reports in HTML and PDF formats, install the required packages on the device with the KUMA Core.
When deploying KUMA in a high availability version, the time zone of the KUMA Core server and the time in the user's browser may differ. This difference is manifested by the discrepancy between the time in reports generated by schedule and the data that the user can export from widgets. To avoid this discrepancy, it is recommended to configure the report generation schedule to take into account the difference between the users' time zone and UTC.
Report template
Report templates are used to specify the analytical data to include in the report, and to configure how often reports must be generated. Users with the General administrator, Tenant administrator, Tier 2 analyst, and Tier 1 analyst roles can create, edit, or delete report templates. Reports that were generated using report templates are displayed in the Generated reports tab.
Report templates are available in the Templates tab of the Reports section, where the table of existing templates is displayed. The table has the following columns:
You can configure a set of table columns and their order, as well as change data sorting:
- You can enable or disable the display of columns in the menu that can be opened by clicking the gear () icon.
- You can change the order of columns by dragging the column headers.
- If a table column header is green, you can click it to sort the table based on that column's data.
- Name—the name of the report template.
You can sort the table by this column by clicking the title and selecting Ascending or Descending.
You can also search report templates by using the Search field that opens when you click the Name column title.
Regular expressions are used when searching for report templates.
- Schedule—the rate at which reports must be generated using the template. If the report schedule was not configured, the
disabledvalue is displayed. - Created by—the name of the user who created the report template.
- Updated—the date when the report template was last updated.
You can sort the table by this column by clicking the title and selecting Ascending or Descending.
- Last report—the date and time when the last report was generated based on the report template.
- Send by email—the check mark is displayed in this column for the report templates that notify users about generated reports via email notifications.
- Tenant—the name of the tenant that owns the report template.
You can click the name of the report template to open the drop-down list with available commands:
- Run report—use this option to generate report immediately. The generated reports are displayed on the Generated reports tab.
- Edit schedule—use this command to configure the schedule for generating reports and to define users that must receive email notifications about generated reports.
- Edit report template—use this command to configure widgets and the time period for extracting analytics.
- Duplicate report template—use this command to create a copy of the existing report template.
- Delete report template—use this command to delete the report template.
Creating report template
To create report template:
- Open the KUMA web interface and select Reports → Templates.
- Click the New template button.
The New report template window opens.
- In the Tenants drop-down list, select one or more tenants that will own the layout being created.
- In the Time period drop-down list, select the time period from which you want to get analytics:
- If you want to specify an exact date, in the calendar on the left, select the start and end date of the period and click Apply.
You can select a date up to and including the current date. The date and time format depends on your browser settings. If the Date from or Date to field has a value and you have not edited the time value manually, when you select a date in the calendar, the Date from field is automatically populated with 00:00:00.000, and the Date to field with 23:59:59.999. If you have manually deleted the value in the Date from or Date to field, when you select a date in the calendar, the field is automatically populated with the current time. After you select a value in one of the fields, the focus switches to the other field. If your Date to is earlier than your Date from, this earlier value is automatically inserted into the Date from field.
- If you want to specify a relative period, select one of the available periods in the Relative period list on the right.
The period is calculated relative to the current time.
- If you want to specify a custom period, edit the value of the Date from and Date to fields.
You can enter an exact date and time in the DD.MM.YYYY HH:mm:ss.SSS format for the Russian localization and YYYY-MM-DD HH:mm:ss.SSS for the English localization or a period relative to the current time as a formula. You can also combine these methods if necessary. If you do not specify milliseconds when entering the exact date, 000 is substituted automatically. If you have edited the time in the Date from or Date to fields, picking a date in the calendar does not change the time component.
In the relative period formulas, you can use the now parameter for the current date and time and the interval parameterization language: + (only in the Date to field), -, / (rounding to the nearest), as well as time units: y (year), M (month), w (week), d (day), h (hour), m (minute), s (second). For example, you can specify the period now-5d to get data for the last five days, or now/w to get data from the beginning of the first day of the current week (00:00:00:000 UTC) to the current time (now).
The Date from field is required, and its value cannot exceed the value of the Date from field, and also cannot be earlier than 1970-01-01 (if specifying an exact date or a relative period). The Date to cannot be earlier than the Date from. If you do not specify a value in the Date from field, now is specified automatically.
By default, the 1 day (now-1d) relative period is selected. The bounds of the period are inclusive: for example, for the Today time range, events are displayed from the beginning (00:00:00:000) of the current day to the current time (now) inclusive, and for the Yesterday period, events are displayed from the beginning (00:00:00:000) of the previous day to 00:00:00:000 of the current day.
KUMA stores time values in UTC, but in the user interface time is converted to the time zone of your browser. This is relevant to the relative periods: Today, Yesterday, This week, and This month. For example, if the time zone in your browser is UTC+3, and you select Today as the data display period, data will be displayed for the period from 03:00:00.000 until now, not from 00:00:00.000 until now.
If you want to take your time zone into account when selecting a relative data display period, such as Today, Yesterday, This week, or This month, you need to manually add a time offset in the Date from and Date to fields (if a value other than now is specified) by adding or subtracting the correct number of hours. For example, if your browser's time zone is UTC+3 and you want to display data for Yesterday, you need to change Date from to now-1d/d-3h and Date to to now/d-3h. If you want to display data for the Today period, you only need to change the value in the Date from field to now/d-3h.
If you need results up to 23:59:59:999 UTC of yesterday, you can use an SQL query with a filter by Timestamp or specify an exact date and time.
- If you want to specify an exact date, in the calendar on the left, select the start and end date of the period and click Apply.
- In the Retention field, specify how long you want to store reports that are generated according to this template.
- In the Template name field, enter a unique name for the report template. Must contain 1 to 128 Unicode characters.
In the Add widget drop-down list, select the required widget and configure its settings. You can add multiple widgets. You can drag widgets around the window and resize them using the diagonal (
) button that appears when you hover over a widget.The following limitations apply to widgets with the Pie chart, Bar chart, Line chart, Counter, and Date Histogram chart types:
- In
SELECTqueries, you can use extended event schema fields ofString,Number, andFloattypes. - In
WHEREqueries, you can use all types of extended event schema fields (String,Number,Float,Array of strings,Array of numbers, andArray of floats).
For widgets with the Table chart type, in
SELECTqueries, you can use all types of extended event schema fields (String,Number,Float,Array of strings,Array of numbers, andArray of floats).You can do the following with widgets:
- Add widgets.
- Edit widgets.
To edit widget:
- Hover over the required widget and click the gear () icon that appears.
- In the drop-down list select Edit.
The window with widget parameters opens. You can check how the widget will look like by clicking the Preview button.
- Update widget parameters and click the Save button.
- Hover over the required widget and click the gear (
You can edit and delete a widget added to the layout by hovering over the widget, clicking the gear (
) icon that appears, and then selecting Edit or Delete. - In
- You can change logo in the report template by clicking the Upload logo button.
When you click the Upload logo button, the Upload window opens and lets you choose the image file for the logo. The image must be a .jpg, .png, or .gif file no larger than 3 MB.
The added logo is displayed in the report instead of KUMA logo.
- If necessary, select the Show CII-related data check box to display data on assets, alerts, and incidents related to critical information infrastructure (CII) in the layout widgets. In this case, these layouts will be available for viewing only by users whose settings have the Access to CII facilities check box selected.
If this check box is cleared, layout widgets will not display data on CII-related assets, alerts, and incidents, even if the user has access to CII objects.
- Click Save.
The new report template is created and is displayed on the Reports → Templates tab of the KUMA web interface. You can run this report manually. If you want to have the reports generated automatically, you must configure the schedule for that.
Page top
Configuring report schedule
To configure the report schedule:
- Open the KUMA web interface and select Reports → Templates.
- In the report templates table, click the name of an existing report template and select Edit schedule in the drop-down list.
The Report settings window opens.
- If you want the report to be generated regularly:
- Turn on the Schedule toggle switch.
In the Recur every group of settings, define how often the report must be generated.
You can specify the frequency of generating reports by days, weeks, months, or years. Depending on the selected period, you should specify the time, day of the week, day of the month or the date of the report generation.
- In the Time field, enter the time when the report must be generated. You can enter the value manually or using the clock icon.
- Turn on the Schedule toggle switch.
- To select the report format and specify the report recipients, configure the following settings:
- In the Send to group of settings, click Add.
- In the Add emails window that opens, in the User group section, click Add group.
- In the field that appears, specify the email address and press Enter or click outside the entry field—the email address will be added. You can add more than one address. Reports are sent to the specified addresses every time you generate a report manually or KUMA generates a report automatically on schedule.
You should configure an SMTP connection so that generated reports can be forwarded by email.
If the recipients who received the report by email are KUMA users, they can download or view the report by clicking the links in the email. If the recipients are not KUMA users, they can follow the links but cannot log in to KUMA, so only attachments are available to them.
We recommend viewing HTML reports by clicking links in the web interface, because at some screen resolutions, the HTML report from the attachment may not be displayed correctly.
If you send an email without attachments, the recipients will have access to reports only by links and only with authorization in KUMA, without restrictions on roles or tenants.
- In the drop-down list, select the report format to send. Available formats: PDF, HTML, , Excel.
- Click Save.
Report schedule is configured.
Page top
Editing report template
To edit report template:
- Open the KUMA web interface and select Reports → Templates.
- In the report templates table click the name of the report template and select Edit report template in the drop-down list.
The Edit report template window opens.
You can also open this window on the Reports → Generated reports tab by clicking the name of a generated report and selecting in the drop-down list Edit report template.
- Make the necessary changes:
- Change the list of tenants that own the report template.
- Update the time period from which you require analytics.
- Add widgets
- Change widgets positions by dragging them.
- Resize widgets using the diagonal () button that appears when you hover over a widget.
- Edit widgets
To edit widget:
- Hover over the required widget and click the gear () icon that appears.
- In the drop-down list select Edit.
The window with widget parameters opens. You can check how the widget will look like by clicking the Preview button.
- Update widget parameters and click the Save button.
- Hover over the required widget and click the gear (
- Delete widgets by hovering over them, clicking the gear () icon that appears, and selecting Delete.
- In the field to the right from the Add widget drop-down list enter a new name of the report template. Must contain 1 to 128 Unicode characters.
- Change the report logo by uploading it using the Upload logo button. If the template already contains a logo, you must first delete it.
- Change how long reports generated using this template must be stored.
- If necessary, select or clear the Show CII-related data check box.
- Click Save.
The report template is updated and is displayed on the Reports → Templates tab of the KUMA web interface.
Page top
Copying report template
To create a copy of a report template:
- Open the KUMA web interface and select Reports → Templates.
- In the report templates table, click the name of an existing report template, and select Duplicate report template in the drop-down list.
The New report template window opens. The name of the widget is changed to
<Report template> - copy. - Make the necessary changes:
- Change the list of tenants that own the report template.
- Update the time period from which you require analytics.
- Add widgets
- Change widgets positions by dragging them.
- Resize widgets using the diagonal () button that appears when you hover over a widget.
- Edit widgets
To edit widget:
- Hover over the required widget and click the gear () icon that appears.
- In the drop-down list select Edit.
The window with widget parameters opens. You can check how the widget will look like by clicking the Preview button.
- Update widget parameters and click the Save button.
- Hover over the required widget and click the gear (
- Delete widgets by hovering over them, clicking the gear () icon that appears, and selecting Delete.
- In the field to the right from the Add widget drop-down list enter a new name of the report template. Must contain 1 to 128 Unicode characters.
- Change the report logo by uploading it using the Upload logo button. If the template already contains a logo, you must first delete it.
- Click Save.
The report template is updated and is displayed on the Reports → Templates tab of the KUMA web interface.
Page top
Deleting report template
To delete report template:
- Open the KUMA web interface and select Reports → Templates.
- In the report templates table, click the name of the report template, and select Delete report template in the drop-down list.
A confirmation window opens.
- If you want to delete only the report template, click the Delete button.
- If you want to delete a report template and all the reports that were generated using that template, click the Delete with reports button.
The report template is deleted.
Page top
Generated reports
All reports are generated using report templates. Generated reports are available on the Generated reports tab of the Reports section and are displayed in the table with the following columns:
You can configure a set of table columns and their order, as well as change data sorting:
- You can enable or disable the display of columns in the menu that can be opened by clicking the gear () icon.
- You can change the order of columns by dragging the column headers.
- If a table column header is green, you can click it to sort the table based on that column's data.
- Name—the name of the report template.
You can sort the table by this column by clicking the title and selecting Ascending or Descending.
- Time period—the time period for which the report analytics were extracted.
- Last report—date and time when the report was generated.
You can sort the table by this column by clicking the title and selecting Ascending or Descending.
- Tenant—name of the tenant that owns the report.
- User—name of the user who generated the report manually. If the report was generated by schedule, the value is blank. If the report was generated in KUMA lower than 2.1, the value is blank.
You can click the name of a report to open the drop-down list with available commands:
- Open report—use this command to open the report data window.
- Save as—use this command to save the generated report in the desired format. Available formats: HTML, PDF, CSV, split CSV, Excel. By default, 250 rows are displayed in all formats. At most 500 values can be displayed in tables in PDF and HTML formats. If you want to output more than 500 rows in a report, set your value for the LIMIT parameter in the SQL query and save the report in CSV format.
- Run report—use this option to generate report immediately. Refresh the browser window to see the newly generated report in the table.
- Edit report template—use this command to configure widgets and the time period for extracting analytics.
- Delete report—use this command to delete the report.
Viewing reports
To open report:
- Open the KUMA web interface and select Reports → Generated reports.
- In the report table, click the name of the generated report, and select Open report in the drop-down list.
The new browser window opens with the widgets displaying report analytics. If a widget displays data on events, alerts, incidents, active lists, or context tables, you can click its header to open the corresponding section of the KUMA web interface with an active filter and/or search query that is used to display data from the widget. Widgets are subject to default restrictions.
To download the data displayed on each widget in CSV format with UTF-8 encoding, press the CSV button. The downloaded file name has the format <widget name>_<download date (YYYYMMDD)>_<download time (HHMMSS)>.CSV.
To view the full data, download the report in the CSV format with the specified settings from the request.
- You can save the report in the desired format by using the Save as button.
Generating reports
You can generate report manually or configure a schedule to have it generated automatically.
To generate report manually:
- Open the KUMA web interface and select Reports → Templates.
- In the report templates table, click a report template name and select Run report in the drop-down list.
You can also generate report from the Reports → Generated reports tab by clicking the name of an existing report and in the drop-down list selecting Run report.
The report is generated and is displayed on the Reports → Generated reports tab.
To generate reports automatically, configure the report schedule.
Page top
Saving reports
To save the report in the desired format:
- Open the KUMA web interface and select Reports → Generated reports.
- In the report table, click the name of the generated report, and in the drop-down list select Save as. Then select the desired format: HTML, PDF, CSV, split CSV, Excel.
The report is saved to the download folder configured in your browser.
You can also save the report in the desired format when you view it.
Page top
Deleting reports
To delete report:
- Open the KUMA web interface and select Reports → Generated reports.
- In the report table, click the name of the generated report, and in the drop-down list select Delete report.
A confirmation window opens.
- Click OK.
Widgets
Widgets let you monitor the operation of the application. Widgets are organized into widget groups, each one related to the analytics type they provide. The following widget groups and widgets are available in KUMA:
- Events—widget for creating analytics based on events.
- Active lists—widget for creating analytics based on active lists of correlators.
- Alerts—group for alert analytics.
The group includes the following widgets:
- Active alerts—number of alerts that have not been closed.
- Active alerts by tenant—number of unclosed alerts for each tenant.
- Alerts by tenant—number of alerts of all statuses for each tenant.
- Unassigned alerts—number of alerts that have the New status.
- Alerts by assignee—number of alerts with the Assigned status, grouped by account name.
- Alerts by status—number of alerts that have the New, Opened, Assigned, or Escalated status, grouped by status.
- Alerts by severity—number of unclosed alerts grouped by their severity.
- Alerts by rule—number of unclosed alerts grouped by correlation rule.
- Latest alerts—table with information about the last 10 unclosed alerts belonging to the tenants selected in the layout.
- Alerts distribution—number of alerts created during the period configured for the widget.
- Assets—group for analytics for assets from processed events. This group includes the following widgets:
- Affected assets—table with information about the level of importance of assets and the number of unclosed alerts they are associated with.
- Affected asset categories—categories of assets linked to unclosed alerts.
- Number of assets—number of assets that were added to KUMA.
- Assets in incidents by tenant—number of assets associated with unclosed incidents. The grouping is by tenant.
- Assets in alerts by tenant—number of assets associated with unclosed alerts, grouped by tenant.
- Incidents—group for incident analytics.
The group includes the following widgets:
- Active incidents—number of incidents that have not been closed.
- Unassigned incidents—number of incidents that have the Opened status.
- Incidents distribution—number of incidents created during the period configured for the widget.
- Incidents by assignee—number of incidents with the Assigned status, grouped by user account name.
- Incidents by status—number of incidents grouped by status.
- Incidents by severity—number of unclosed incidents grouped by their severity.
- Active incidents by tenant—number of unclosed incidents grouped by tenant available to the user account.
- All incidents—number of incidents of all statuses.
- All incidents by tenant—number of incidents of all statuses, grouped by tenant.
- Affected assets in incidents—number of assets associated with unclosed incidents.
- Affected assets categories in incidents—asset categories associated with unclosed incidents.
- Affected users in Incidents—users associated with incidents.
- Latest incidents—table with information about the last 10 unclosed incidents belonging to the tenants selected in the layout.
- Event sources—group for event source analytics. The group includes the following widgets:
- Top event sources by alerts number—number of unclosed alerts grouped by event source.
- Top event sources by convention rate—number of events associated with unclosed alerts. The grouping is by event source.
In some cases, the number of alerts generated by sources may be inaccurate. To obtain accurate statistics, it is recommended to specify the Device Product event field as unique in the correlation rule, and enable storage of all base events in a correlation event. However, correlation rules with these settings consume more resources.
- Users—group for analytics related to users from processed events. The group includes the following widgets:
- Affected users in alerts—number of accounts related to unclosed alerts.
- Number of AD users—number of Active Directory accounts received via LDAP during the period configured for the widget.
In the events table, in the event details area, in the alert window, and in the widgets, the names of assets, accounts, and services are displayed instead of the IDs as the values of the SourceAssetID, DestinationAssetID, DeviceAssetID, SourceAccountID, DestinationAccountID, and ServiceID fields. When exporting events to a file, the IDs are saved, but columns with names are added to the file. The IDs are also displayed when you point the mouse over the names of assets, accounts, or services.
Searching for fields with IDs is only possible using IDs.
Basics of managing widgets
The principle of data display in the widget depends on the type of the graph. The following graph types are available in KUMA:
- Pie chart (
 ).
). - Counter (
 ).
). - Table (
 ).
). - Bar chart (
 ).
). - Date Histogram (
 ).
). - Line chart
- Stacked Bar chart
- Speedometer chart.
Basics of general widget management
The name of the widget is displayed in the upper left corner of the widgets. By clicking the link with the name of the widget about events, alerts, incidents, or active lists, you can go to the corresponding section of the KUMA web interface.
A list of tenants for which data is displayed is located under the widget name.
In the upper right corner of the widget, the period for which data is displayed on the widget is indicated (for example, 30 days  ). Keep in mind that the data displayed in the dashboard may lag behind real time because of caching. You can view the date and time of the last update by hovering over the period icon.
If the Show data for previous period setting is enabled for the widget, and the widget is displaying data for a relative period, the tooltip also displays the previous period. The previous period is calculated relative to the current period as start and end values of the current period minus the duration of the current period. For example, if data is updated daily and displayed for a month, but only the first 10 days of the month have passed, the previous period is taken to be the last 10 days of the previous month.
You can change the data display period for the widget by clicking the period icon and selecting an exact date or a relative period in the window that is displayed. If you want the widget to display data for the period selected for the layout, click the Reset button. Changing the displayed period on the layout also changes the period displayed in the widget.
The time in the widget is displayed in the local time zone set in the browser.
The CSV button is located to the left of the period icon. You can download the data displayed on the widget in CSV format (UTF-8 encoding). The downloaded file name has the format <widget name>_<download date (YYYYMMDD)>_<download time (HHMMSS)>.CSV.
The widget displays data for the period selected in widget or layout settings only for the tenants that are selected in widget or layout settings.
Basics of managing Pie chart graphs
A pie chart is displayed under the list of tenants. You can left-click the selected segment of the diagram to go to the relevant section of the KUMA web interface. The data in that section is sorted in accordance with the filters and/or search query specified in the widget.
Under the period icon, the number of events, active lists, assets, alerts, or incidents grouped by the selected criteria for the data display period will be displayed.
Examples:
|
Basics of managing Counter graphs
Graphs of this type display the sum total of selected data.
Example: The Number of assets widget displays the total number of assets added to KUMA. |
Basics of managing Table graphs
Graphs of this type display data in a table format.
Example: In the Events widget, for which the SQL query |
Basics of managing Bar chart graphs
A bar chart is displayed below the list of tenants. You can left-click the selected diagram section to go to the Events section of the KUMA web interface. The data in that section is sorted in accordance with the filters and/or search query specified in the widget. To the right of the chart, the same data is represented as a table.
Example: In the a Netflow top internal IPs widget for which the SQL query |
Basics of managing Date Histogram graphs
A date histogram is displayed below the list of tenants. You can left-click the selected section of the chart to go to the Events section of the KUMA web interface with the relevant data. The data in that section is sorted in accordance with the filters and/or search query specified in the widget. To the right of the chart, the same data is represented as a table.
Example: In the Events widget, for which the SQL query |
Basics of managing Line chart graphs
A line chart is displayed below the list of tenants. You can left-click the selected section of the chart to go to the Events section of the KUMA web interface with the relevant data. The data in that section is sorted in accordance with the filters and/or search query specified in the widget. To the right of the chart, the same data is represented as a table.
Example: In the Events widget, for which the SQL query |
Basics of managing graphs of the Stacked bar chart type
A stacked bar chart with a legend is displayed below the list of tenants. The legend displays the names of categories by which the bars are sliced. To the left of each category is a check box that lets you hide or show the category. The number of bars in the chart corresponds to the number of values in the selected grouping. The bars have captions. The color of the corresponding category in the bar is assigned automatically. When you hover over the zones of the bars, a tooltip is displayed with the value and a description of the value. You can left-click the selected diagram section to go to the Events section of the KUMA web interface.
The meaning of bar height depends on the Format setting:
- If the Absolute values format is configured, the height of the bars corresponds to the sum of the values of the measured figure.
- If the Relative values, % format is configured, all bars have the same height of 100%, and the relative heights of colored zones on the bars correspond to the ratios of the values.
If, when creating a custom widget based on the stacked bar chart, you selected the Show data for previous period option, and the standard value, category, metric aliases are used in the query, the chart displays previous-period data as separate bars. However, if instead of the standard metric, the query uses a custom metric calculation with non-standard aliases, the Show data for previous period is not taken into account when displaying the chart (see example queries below).
Examples: When creating a custom widget of the Stacked Bar chart type based on an SQL query of an Events widget, the following rules apply:
However, you can manage the count by using standard aggregation functions ( Example 1: For the Events widget, the following SQL query is specified with standard aliases, and the Show data for previous period option was selected when creating the widget:
The X-axis stands for tenants (the field specified as the Next to each bar, an additional bar is displayed with historical data, if such data was received in the query response. Example 2: For the Events widget, the following SQL query is specified with custom metrics specified as the
The X-axis stands for tenants (the field specified as The additional bar with historical data is not displayed for a query with custom metrics, even if the Show data for previous period option was selected when creating the widget. Example 3: For the Events widget, the following SQL query is specified with standard aliases:
In contrast to the similar query in example 1, in this case, the X-axis stands for the types of events (the field specified as the Example 4: For the Events widget, the following SQL query is specified with standard aliases:
The chart displays the days of the month on the X axis (the field specified as the To create a similar chart with bars arranged by date and/or time, use a query with grouping and sorting by the following fields of the
We recommend using the Date Histogram to work with data that is arranged by date and/or time. |
Special considerations for displaying data in widgets
Limitations for the displayed data
For improved readability, KUMA has limitations on the data displayed in widgets depending on its type:
- Pie chart displays a maximum of 20 slices.
- Bar chart displays a maximum of 40 bars.
- Table displays a maximum of 500 entries.
- Date histogram displays a maximum of 365 days.
Data that exceeds the specified limitations is displayed in the widget in the Other category.
You can download the full data used for building analytics in the widget in CSV format.
Summing up the data
The format of displaying the total sum of data on date histogram, bar chart and pie chart depends on the locale:
- English locale: decades (every three digits) are separated by commas, the decimal part is separated by a period.
- Russian locale: decades (every three digits) are separated by spaces, the decimal part is separated by a comma.
Creating a widget
You can create a widget in a dashboard layout while creating or editing the layout.
To create a widget:
- Create a layout or switch to editing mode for the selected layout.
- Click Add widget.
- Select a widget type from the drop-down list.
This opens the widget settings window.
- Edit the widget settings.
- If you want to see how the data will be displayed in the widget, click Preview.
- Click Add.
The widget appears in the dashboard layout.
Page top
Editing a widget
To edit a widget:
- In the KUMA web interface, select the Dashboard section.
- Expand the list in the upper right corner of the window.
- Hover the mouse cursor over the relevant layout.
- Click the pencil () icon.
The Customizing layout window opens.
- On the widget that you want to edit, click the gear () icon.
- Select Edit.
This opens the widget settings window.
- Edit the widget settings.
- Click Save in the widget settings window.
- Click Save in the Customizing layout window.
The changes are applied to the widget.
Page top
Deleting a widget
To delete a widget:
- In the KUMA web interface, select the Dashboard section.
- Expand the list in the upper right corner of the window.
- Hover the mouse cursor over the relevant layout.
- Click the button.
The Customizing layout window opens.
- In the widget you want to delete, click .
- Select Delete.
- This opens a confirmation window; in that window, click OK.
- Click the Save button.
The widget is deleted.
Page top
Events widget
You can use the Events widget to get analytics based on SQL queries.
When creating this widget, you must specify the settings described in the tables below.
The  tab:
tab:
The following table lists the settings on the tab.
Description of parameters
Setting |
Description |
|---|---|
Graph |
Graph type. The following graph types are available:
|
Format |
Data display format: Absolute values or Relative values, %. The setting is available for a Stacked Bar chart. If you select the Absolute values format, the heights of the bars correspond to the sum of the values of the measured indicator. If you select the Relative values, % format, all bars have the same height of 100%, and the relative heights of colored zones on the bars correspond to the ratios of indicator values. By default, Absolute values is selected. |
Tenant |
The tenant for which data is displayed in the widget. You can select multiple tenants. By default, data is displayed for tenants selected in layout settings. |
Time period |
Period for which data is displayed in the widget. The default is As layout, meaning that data is displayed for the period selected for the layout. You can also specify a period for the widget in one of the following ways:
For details, see the Configuring a period subsection below. |
Show data for previous period |
Enable the display of data for two periods at the same time: for the current period and for the previous period. When using a Stacked Bar chart, the Show data for previous period setting is taken into account if the query contains standard aliases: |
Storage |
Storage that is searched for events. The list displays the available spaces. You can select only one storage, but you can select one or more spaces. The values in the Storage field are independent of the selected tenants in the Tenant field. The field displays storages and spaces, like in the Events section. If the user does not have access rights to one or more spaces of the storage, the widget cannot display information; the user cannot edit the widget, but can duplicate the widget using the Duplicate button. Duplication does not depend on access rights to spaces. If a template is duplicated in widgets that have spaces specified that are not accessible to the user, the value in the Storage field is reset. Such widgets display an error: Access denied (Operation returns no results because of allowed and selected event spaces). To save the template, you need to specify spaces in widgets. In widgets that have spaces that are accessible to the user, the value of the Storage field is not reset and is saved when the template is duplicated. If the user's email address is included in the list of recipients of the scheduled report, the user gets the full version of the report, regardless of which spaces are accessible. |
SQL query field ( |
Query for filtering and searching for events manually. You can create a query in Builder by clicking You can use extended event schema fields to create a chart of the table type. For detailed information on creating an SQL query in the query constructor, see below. The following limitations apply:
|
 )
)How to create a query in Builder
To create a query in Builder:
- Specify the values of the following parameters:
- SELECT—event fields that should be returned. The number of available fields depends on the selected graph type.
- In the drop-down list on the left, select the event fields for which you want to display data in the widget.
- The middle field displays what the selected field is used for in the widget: metric or value.
If you selected the Table graph type, in the middle fields, you must specify column names using ANSII-ASCII characters.
- In the drop-down list on the right, you can select an operation to be performed on the data:
- count—event count. This operation is available only for the ID event field. Used by default for line charts, pie charts, bar charts, and counters. This is the only option for date histogram.
- max is the maximum value of the event field from the event selection.
- min is the minimum value of the event field from the event selection.
- avg is the average value of the event field from the event selection.
- sum is the sum of event field values from the event selection.
- SOURCE is the type of the data source. Only the events value is available for selection.
- WHERE—conditions for filtering events.
- In the drop-down list on the left, select the event field that you want to use for filtering.
- Select the necessary operator from the middle drop-down list. The available operators depend on the type of value of the selected event field.
- In the drop-down list on the right, enter the value of the condition. Depending on the selected type of field, you may have to manually enter the value, select it from the drop-down list, or select it on the calendar.
You can add search conditions by clicking Add condition or remove search conditions by clicking
.You can also add groups of conditions by clicking Add group. By default, groups of conditions are added with the AND operator, but you can change the it if necessary. Available values: AND, OR, NOT. Group conditions are deleted using the Delete group button.
- GROUP BY—event fields or aliases to be used for grouping the returned data. This parameter is not available for Counter graph type.
- ORDER BY—columns used as the basis for sorting the returned data. This parameter is not available for the Date Histogram and Counter graph types.
- In the drop-down list to the left, select the value that will be used for sorting.
- Select the sort order from the drop-down list on the right: ASC for ascending, DESC for descending.
- For Table type graphs, you can add sorting conditions by clicking Add column.
- LIMIT is the maximum number of data points for the widget. This parameter is not available for the Date Histogram and Counter graph types.
- SELECT—event fields that should be returned. The number of available fields depends on the selected graph type.
- Click Apply.
Example of search conditions in the query builder
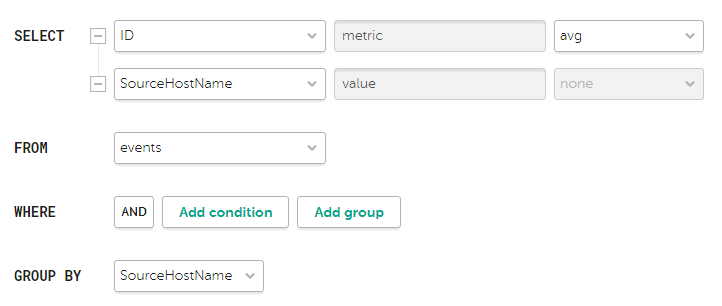
Parameters of search conditions for displaying the average number of bytes per host in the widget
The  tab:
tab:
The following table lists the settings on the tab.
The tab is displayed if on the tab in the Graph field you have selected one of the following values: Bar chart, Line chart, Date Histogram.
Description of parameters
Setting |
Description |
|---|---|
Y-min and Y-max |
Scale of the Y axis. Negative values can be displayed on chart axes. This is due to the scaling of charts on the widget and can be fixed by setting zero as the minimum chart values instead of Auto. |
X-min and X-max |
Scale of the X axis. Negative values can be displayed on chart axes. This is due to the scaling of charts on the widget and can be fixed by setting zero as the minimum chart values instead of Auto. |
Line-width |
Width of the line on the graph. This field is displayed for the Line chart graph type. |
Point size |
Point size on the graph. This field is displayed for the Line chart graph type. |
The  tab:
tab:
The following table lists the settings on the tab.
Description of parameters
Setting |
Description |
|---|---|
Name |
Name of the widget. |
Description |
Description of the widget. |
Color |
The color used for displaying the information:
This setting is available for graphs such as Bar chart, Counter, Line chart, Date Histogram. |
Horizontal |
Makes the histogram horizontal instead of vertical. When this option is enabled, when a widget displays a large amount of data, horizontal scrolling is not available and all available information is fit into the fixed size of the widget. If there is a lot of data to display, it is recommended to increase the widget size. |
Show total |
Shows sums total of the values. |
Show legend |
Displays a legend for the analytics. The toggle switch is turned on by default. |
Show nulls in legend |
Displays parameters with a null value in the legend for analytics. The toggle switch is turned off by default. |
Decimals |
Number of decimals to which the displayed value must be rounded off. |
Period segments length |
Duration of the segments into which you want to divide the period. Available for graphs of the Date Histogram type. |
Scale |
Scale for displaying data. Available for a Stacked Bar chart. The following values are possible:
The default is Linear. |
Active lists widget
You can use the Active lists widget to get analytics based on SQL queries.
When creating this widget, you must specify the settings described in the tables below.
The tab:
The following table lists the settings that must be specified on the tab.
Description of parameters
Setting |
Description |
|---|---|
Graph |
Graph type. The following graph types are available:
|
Tenant |
The tenant for which data is displayed in the widget. You can select multiple tenants. By default, data is displayed for tenants selected in layout settings. |
Correlator |
The name of the correlator that contains the active list for which you want to receive data. |
Active list |
The name of the active list for which you want to receive data. The same active list can be used by different correlators. However, a separate entity of the active list is created for each correlator. Therefore, the contents of the active lists used by different correlators differ even if the active lists have the same names and IDs. |
SQL query field |
This field lets you manually enter a query for filtering and searching active list data. The query structure is similar to that used in event search. When creating a query based on active lists, you must consider the following:
Special considerations apply when using aliases in SQL functions and SELECT, you can use double quotes and backticks: ", `. If you selected Counter as the graph type, aliases can contain Latin and Cyrillic characters, as well as spaces. When using spaces or Cyrillic, the alias must be enclosed in quotation marks: "An alias with a space", `Another alias`. When displaying data for the previous period, sorting by the count(ID) parameter may not work correctly. It is recommended to sort by the metric parameter. For example, SELECT count(ID) AS "metric", Name AS "value" FROM `events` GROUP BY Name ORDER BY metric ASC LIMIT 250. |
You can get the names of the tenants in the widget instead of their IDs.
Examples of SQL queries for receiving analytics based on active lists:
|
The tab:
The following table lists the settings that must be specified on the tab.
This tab is displayed if on the tab, in the Graph field, you have selected Bar chart.
Description of parameters
Settings |
Description |
|---|---|
Y-min and Y-max |
Scale of the Y axis. Negative values can be displayed on chart axes. This is due to the scaling of charts on the widget and can be fixed by setting zero as the minimum chart values instead of Auto. |
X-min and X-max |
Scale of the X axis. Negative values can be displayed on chart axes. This is due to the scaling of charts on the widget and can be fixed by setting zero as the minimum chart values instead of Auto. |
The tab:
The following table lists the settings that must be specified on the tab.
Description of parameters
Setting |
Description |
|---|---|
Name |
Name of the widget. |
Description |
Description of the widget. |
Color |
The color used for displaying the information:
|
Horizontal |
Makes the histogram horizontal instead of vertical. When this setting is enabled, all available information is fitted into the configured widget size. If the amount of data is great, you can increase the size of the widget to display it optimally. |
Show total |
Shows sums total of the values. |
Show legend |
Displays a legend for the analytics. The toggle switch is turned on by default. |
Show nulls in legend |
Displays parameters with a null value in the legend for analytics. The toggle switch is turned off by default. |
Context tables widget
You can use the Context tables widget to get analytics based on SQL queries.
When creating this widget, you must specify the settings described in the tables below.
The tab:
The following table lists the settings that must be specified on the tab.
Description of parameters
Setting |
Description |
|---|---|
Graph |
Graph type. The following graph types are available:
|
Tenant |
The tenant for which data is displayed in the widget. You can select multiple tenants. By default, data is displayed for tenants selected in layout settings. |
Correlator |
Name of the correlator that contains the context table for which you want to receive information. |
Context table |
Name of the context table for which you want to receive information. The same context table can be used in multiple correlators. However, a separate entity of the context table is created for each correlator. Therefore, the contents of the context tables used by different correlators are different even if the context tables have the same name and ID. |
SQL query field |
This field lets you manually enter a query for filtering and searching context table data. By default, for each widget type, the field contains a query that obtains the context table schema and the key by key fields. The query structure is similar to that used in event search. When creating a query based on context tables, you must consider the following:
Special considerations when using aliases in SQL functions and |
You can get the names of the tenants in the widget instead of their IDs.
Examples of SQL queries for receiving analytics based on active lists:
|
The tab:
The following table lists the settings that must be specified on the tab.
This tab is displayed if on the tab, in the Graph field, you have selected Bar chart.
Description of parameters
Setting |
Description |
|---|---|
Y-min and Y-max |
Scale of the Y axis. Negative values can be displayed on chart axes. This is due to the scaling of charts on the widget and can be fixed by setting zero as the minimum chart values instead of Auto. |
X-min and X-max |
Scale of the X axis. Negative values can be displayed on chart axes. This is due to the scaling of charts on the widget and can be fixed by setting zero as the minimum chart values instead of Auto. |
The tab:
The following table lists the settings that must be specified on the tab.
Description of parameters
Settings |
Description |
|---|---|
Name |
Name of the widget. |
Description |
Description of the widget. |
Color |
The color used for displaying the information:
|
Horizontal |
Makes the histogram horizontal instead of vertical. When this setting is enabled, all available information is fitted into the configured widget size. If the amount of data is great, you can increase the size of the widget to display it optimally. |
Show total |
Shows sums total of the values. |
Show legend |
Displays a legend for the analytics. The toggle switch is turned on by default. |
Show nulls in legend |
Displays parameters with a null value in the legend for analytics. The toggle switch is turned off by default. |
Assets custom widget
You can use the Assets → Customized widget to get advanced asset analytics from processed events using the query builder. In the query, you must specify the asset field and the corresponding condition or set of conditions by which you want the assets to be counted (Y-axis). You can also specify one or more additional conditions (categories) to be used for comparing the number of assets for each field.
When creating the custom widget for assets, you must specify the settings described in the tables below.
The tab:
The following table describes the settings on the tab.
Description of parameters
Setting |
Description |
|---|---|
Graph |
Graph type. The following graph types are available:
|
Format |
This setting is available for charts of the Stacked bar chart type. Data display format: Absolute values or Relative values, %. If you select the Absolute values format, the heights of the bars correspond to the sum of the values of the measured indicator. If you select the Relative values, % format, all bars have the same height of 100%, and the relative heights of colored zones on the bars correspond to the ratios of indicator values. By default, Absolute values is selected. |
Tenant |
The tenant for which data is displayed in the widget. You can select multiple tenants. By default, data is displayed for tenants selected in layout settings. |
Asset category |
The asset category for which the widget is displaying data. |
Search in uncategorized assets |
This setting lets you display assets that do not have a category. This check box is cleared by default. |
Select axes group of settings |
|
Y-axis |
Required setting. Asset field and the condition or set of conditions specified for this field, that define how assets are to be counted. |
Y-axis category |
Category for the selected field. Not used for a graph of the Counter type. This setting is optional for Y-axis fields whose values are enumerations (can be selected from a finite list of values). For all other fields, this parameter is required. |
Group by tenant |
This setting is available for charts of the Stacked bar chart type. Enables additional grouping of assets by tenant. If the check box is selected, assets on the chart are broken up along the X-axis into bars corresponding to individual tenants. If the check box is cleared, all assets are displayed on the same bar. This check box is cleared by default. |
The tab:
The following table describes the settings on the tab.
Description of parameters
Setting |
Description |
|---|---|
Name |
Name of the widget. |
Description |
Description of the widget. |
Show total |
This setting is available for charts of the Pie chart type. Enables the display of totals in the chart, in addition to the selected categories. If this check box is enabled, the sum of the values of all specified categories is displayed in the center of the pie chart and in the legend in a separate Total column. The toggle switch is turned off by default. |
Color |
This setting is available for charts of the Counter type. The color used for displaying the information:
|
Horizontal |
Makes the histogram horizontal instead of vertical. When this option is enabled, when a widget displays a large amount of data, horizontal scrolling is not available and all available information is fit into the fixed size of the widget. If there is a lot of data to display, it is recommended to increase the widget size. |
Show legend |
Displays a legend for the analytics. The toggle switch is turned on by default. |
Show nulls in legend |
Displays parameters with a null value in the legend for analytics. The toggle switch is turned off by default. |
Decimals |
Number of decimals to which the displayed value must be rounded off. |
Scale |
Available for a Stacked bar chart. Scale for displaying data. The following values are possible:
The default is Linear. |
Other widgets
This section describes the settings of all widgets except the Events and Active lists widgets.
The set of parameters available for a widget depends on the type of graph that is displayed on the widget. The following graph types are available in KUMA:
- Pie chart ().
- Counter ().
- Table ().
- Bar chart ().
- Date Histogram ().
- Line chart
- Stacked Bar chart
- Speedometer chart.
Settings for pie charts
The following table below lists the settings of a Pie chart.
Description of parameters
Setting |
Description |
|---|---|
Name |
Name of the widget. |
Description |
Description of the widget. |
Tenant |
The tenant for which data is displayed in the widget. You can select multiple tenants. By default, data is displayed for tenants selected in layout settings. |
Time period |
Period for which data is displayed in the widget. The default is As layout, meaning that data is displayed for the period selected for the layout. You can also specify a period for the widget in one of the following ways:
For details, see the Configuring a period subsection below. |
Show total |
Shows sums total of the values. |
Show legend |
Displays a legend for the analytics. The toggle switch is turned on by default. |
Show nulls in legend |
Displays parameters with a null value in the legend for analytics. The toggle switch is turned off by default. |
Decimals |
Number of decimals to which the displayed value must be rounded off. |
Settings for counters
The following table below lists the settings of a Counter.
Description of parameters
Setting |
Description |
|---|---|
Name |
Name of the widget. |
Description |
Description of the widget. |
Tenant |
The tenant for which data is displayed in the widget. You can select multiple tenants. By default, data is displayed for tenants selected in layout settings. |
Time period |
Period for which data is displayed in the widget. The default is As layout, meaning that data is displayed for the period selected for the layout. You can also specify a period for the widget in one of the following ways:
For details, see the Configuring a period subsection below. |
Settings for tables
The following table below lists the settings of a Table.
Description of parameters
Setting |
Description |
|---|---|
Name |
Name of the widget. |
Description |
Description of the widget. |
Tenant |
The tenant for which data is displayed in the widget. You can select multiple tenants. By default, data is displayed for tenants selected in layout settings. |
Time period |
Period for which data is displayed in the widget. The default is As layout, meaning that data is displayed for the period selected for the layout. You can also specify a period for the widget in one of the following ways:
For details, see the Configuring a period subsection below. |
Show data for previous period |
Enabling the display of data for the current and previous periods simultaneously. |
Color |
The color used for displaying the information:
|
Decimals |
Number of decimals to which the displayed value must be rounded off. |
Settings for Bar charts, Stacked bar charts, and Date Histograms
The table below lists the settings for the Bar chart and Date Histogram type graphs located on the tab.
Description of parameters
Setting |
Description |
|---|---|
Y-min and Y-max |
Scale of the Y axis. Negative values can be displayed on chart axes. This is due to the scaling of charts on the widget and can be fixed by setting zero as the minimum chart values instead of Auto. |
X-min and X-max |
Scale of the X axis. Negative values can be displayed on chart axes. This is due to the scaling of charts on the widget and can be fixed by setting zero as the minimum chart values instead of Auto. |
Decimals |
Number of decimals to which the displayed value must be rounded off. |
The table below lists the settings for the Bar chart, Stacked bar chart, and Date Histogram type graphs located on the tab.
Description of parameters
Setting |
Description |
|---|---|
Name |
Name of the widget. |
Description |
Description of the widget. |
Tenant |
The tenant for which data is displayed in the widget. You can select multiple tenants. By default, data is displayed for tenants selected in layout settings. |
Time period |
Period for which data is displayed in the widget. The default is As layout, meaning that data is displayed for the period selected for the layout. You can also specify a period for the widget in one of the following ways:
For details, see the Configuring a period subsection below. |
Show data for previous period |
Enables the display of data simultaneously for the current and previous periods. |
Color |
The color used for displaying the information:
|
Horizontal |
Makes the histogram horizontal instead of vertical. When this setting is enabled, all available information is fitted into the configured widget size. If the amount of data is great, you can enlarge the widget to better fit the data. |
Show total |
Shows sums total of the values. |
Show legend |
Displays a legend for the analytics. The toggle switch is turned on by default. |
Show nulls in legend |
Displays parameters with a null value in the legend for analytics. The toggle switch is turned off by default. |
Period segments length |
Duration of the segments into which you want to divide the period. Available for graphs of the Date Histogram type. |
Configuring a period
For graphs such as Pie chart, Counter, Table, Bar chart, Stacked bar chart, Date Histogram, you can configure the period for displaying data in the widget using the Period setting. By default, the data display period of the widget is the same as the data display period of the dashboard.
To configure the data display period, do one of the following:
- If necessary, change the date and time in the Time period setting in one of the following ways:
- If you want to specify an exact date, in the calendar on the left, select the start and end date of the period and click Apply.
You can select a date up to and including the current date. The date and time format depends on your browser settings. If the Date from or Date to field has a value and you have not edited the time value manually, when you select a date in the calendar, the Date from field is automatically populated with 00:00:00.000, and the Date to field with 23:59:59.999. If you have manually deleted the value in the Date from or Date to field, when you select a date in the calendar, the field is automatically populated with the current time. After you select a value in one of the fields, the focus switches to the other field. If your Date to is earlier than your Date from, this earlier value is automatically inserted into the Date from field.
- If you want to specify a relative period, select one of the available periods in the Relative period list on the right.
The period is calculated relative to the current time.
- If you want to specify a custom period, edit the value of the Date from and Date to fields.
You can enter an exact date and time in the DD.MM.YYYY HH:mm:ss.SSS format for the Russian localization and YYYY-MM-DD HH:mm:ss.SSS for the English localization or a period relative to the current time as a formula. You can also combine these methods if necessary. If you do not specify milliseconds when entering the exact date, 000 is substituted automatically. If you have edited the time in the Date from or Date to fields, picking a date in the calendar does not change the time component.
In the relative period formulas, you can use the now parameter for the current date and time and the interval parameterization language: + (only in the Date to field), -, / (rounding to the nearest), as well as time units: y (year), M (month), w (week), d (day), h (hour), m (minute), s (second). For example, you can specify the period now-5d to get data for the last five days, or now/w to get data from the beginning of the first day of the current week (00:00:00:000 UTC) to the current time (now).
The Date from field is required, and its value cannot exceed the value of the Date from field, and also cannot be earlier than 1970-01-01 (if specifying an exact date or a relative period). The Date to cannot be earlier than the Date from. If you do not specify a value in the Date from field, now is specified automatically.
KUMA stores time values in UTC, but in the user interface time is converted to the time zone of your browser. This is relevant to the relative periods: Today, Yesterday, This week, and This month. For example, if the time zone in your browser is UTC+3, and you select Today as the data display period, data will be displayed for the period from 03:00:00.000 until now, not from 00:00:00.000 until now.
If you want to take your time zone into account when selecting a relative data display period, such as Today, Yesterday, This week, or This month, you need to manually add a time offset in the Date from and Date to fields (if a value other than now is specified) by adding or subtracting the correct number of hours. For example, if your browser's time zone is UTC+3 and you want to display data for Yesterday, you need to change Date from to now-1d/d-3h and Date to to now/d-3h. If you want to display data for the Today period, you only need to change the value in the Date from field to now/d-3h.
If you need results up to 23:59:59:999 UTC of yesterday, you can use an SQL query with a filter by Timestamp or specify an exact date and time.
The bounds of the period are inclusive: for example, for the Today time range, events are displayed from the beginning (00:00:00:000 UTC) of the current day to the current time (now) inclusive, and for the Yesterday period, events are displayed from the beginning (00:00:00:000 UTC) of the previous day to 00:00:00:000 UTC of the current day. You can view the date and time of the last data update and the exact period for which the data is displayed by hovering over the period icon in the widget.
If the Show data for previous period setting is enabled for the widget, and the widget is displaying data for a relative period, the tooltip also displays the previous period. The previous period is calculated relative to the current period as start and end values of the current period minus the duration of the current period. For example, if data is updated daily and displayed for a month, but only the first 10 days of the month have passed, the previous period is taken to be the last 10 days of the previous month.
- If you want to specify an exact date, in the calendar on the left, select the start and end date of the period and click Apply.
- If you want the widget to display data for the period selected for the layout, click the Reset button. Changing the displayed period on the layout also changes the period displayed in the widget.
Displaying tenant names in widgets of the "Active list" type
If you want the names of tenants to be displayed in Active list widgets instead of tenant IDs, in correlation rules of the correlator, configure the function for populating the active list with information about the corresponding tenant.
The configuration process involves the following steps:
- Export the list of tenants.
- Create a dictionary of the Table type.
- Import the list of tenants obtained at step 1 into the dictionary created at step 2 of these instructions.
- Add a local variable with the dict function for mapping the tenant name to tenant ID to the correlation rule.
Example:
- Variable:
TenantName - Value:
dict ('<Name of the previously created dictionary with tenants>', TenantID)
- Variable:
- Add a Set action to the correlation rule, which writes the value of the previously created variable to the active list in the <key>-<value> format. As the key, specify the field of the active list (for example,
Tenant), and in the value field, specify the variable (for example,$TenantName).
When this rule triggers, the name of the tenant mapped by the dict function to the ID in the tenant dictionary is placed in the active list. When creating widgets based on active lists, the widget displays the name of the tenant instead of the tenant ID.
Page top
Working with alerts
Alerts are created when a sequence of events is received that triggers a correlation rule. You can find more information about alerts in this section.
In the Alerts section of the KUMA web interface, you can view and process the alerts registered by the application. Alerts can be filtered. When you click the alert name, a window with its details opens.
The alert date format depends on the localization language selected in the application settings. Possible date format options:
- English localization: YYYY-MM-DD.
- Russian localization: DD.MM.YYYY.
Alert life cycle
Below is the life cycle of an alert:
- KUMA creates an alert when a correlation rule is triggered. The alert is named after the correlation rule that generated it. Alert is assigned the New status.
Alerts with the New status continue to be updated with data when correlation rules are triggered. If the alert status changes, the alert is no longer updated with new events, and if the correlation rule is triggered again, a new alert is created.
- A security officer assigns the alert to an operator for investigation. The alert status changes to assigned.
- The operator performs one of the following actions:
- Close the alert as false a positive (alert status changes to closed).
- Respond to the threat and close the alert (alert status changes to closed).
- Creates an incident based on the alert (the alert status changes to In incident).
Alert overflow
Each alert and its related events cannot exceed the size of 16 MB. When this limit is reached:
- New events can no longer be linked to the alert.
- The alert has an Overflowed tag displayed in the Detected column. The same tag is displayed in the Details on alert section of the alert details window.
Overflowed alerts should be handled as soon as possible because new events are not added to overflowed alerts. You can filter out all events that could be linked to an alert after the overflow by clicking the All possible related events link.
Alert segmentation
Using the segmentation rules, the stream of correlation events of the same type can be divided to create more than one alert.
Configuring alerts table
The main part of the Alerts section shows a table containing information about registered alerts.
The following columns are displayed in the alerts table:
- Severity (
 )—shows the importance of a possible security threat: Critical
  , High
  , Medium
  , or Low
  .
. - Name—alert name.
If Overflowed tag is displayed next to the alert name, it means the alert size has reached or is about to reach the limit and should be processed as soon as possible.
- Status—current status of an alert:
- New—a new alert that hasn't been processed yet.
- Assigned—the alert has been processed and assigned to a security officer for investigation or response.
- Closed—the alert was closed. Either it was a false alert, or the security threat was eliminated.
- Escalated—an incident was generated based on this alert.
- Assigned to—the name of the security officer the alert was assigned to for investigation or response.
- Incident—name of the incident to which this alert is linked.
- First seen—the date and time when the first correlation event of the event sequence was created, triggering creation of the alert.
- Last seen—the date and time when the last correlation event of the event sequence was created, triggering creation of the alert.
- Categories—categories of alert-related assets with the highest severity. No more than three categories are displayed.
- Tenant—the name of the tenant that owns the alert.
- CII—an indication whether the related to the alert assets are the CII objects. The column is hidden from the users who do not have access to CII objects.
You can view the alert filtering tools by clicking the column headers. When filtering alerts based on a specific parameter, the corresponding header of the alerts table is highlighted in yellow.
Click the  button to configure the displayed columns of the alerts table.
In the Search field, you can enter a regular expression for searching alerts based on their related assets, users, tenants, and correlation rules. Parameters that can be used for a search:
- Assets: name, FQDN, IP address.
- Active Directory accounts: attributes displayName, SAMAccountName, and UserPrincipalName.
- Correlation rules: name.
- KUMA users who were assigned alerts: name, login, email address.
- Tenants: name.
Filtering alerts
In KUMA, you can perform alert selection by using the filtering and sorting tools in the Alerts section.
The filter settings can be saved. Existing filters can be deleted.
Page top
Saving and selecting an alert filter
In KUMA, you can save changes to the alert table settings as filters. Filters are saved on the KUMA Core server and are available to all KUMA users of the tenant for which they were created.
To save the current filter settings:
- In the Alerts section of KUMA open the Filters drop-down list.
- Select Save current filter.
A field will appear for entering the name of the new filter and selecting the tenant that will own it.
- Enter a name for the filter. The name must be unique for alert filters, incident filters, and event filters.
- In the Tenant drop-down list, select the tenant that will own the filter and click Save.
The filter is saved.
To select a previously saved filter:
- In the Alerts section of KUMA open the Filters drop-down list.
- Select the relevant filter.
To select the default filter, put an asterisk to the left of the relevant filter name in the Filters drop-down list.
The filter is selected.
To reset the current filter settings,
Open the Filters drop-down list and select Clear filters.
Page top
Deleting an alert filter
To delete a previously saved filter:
- In the Alerts section of KUMA open the Filters drop-down list.
- Click next to the configuration that you want to delete.
- Click OK.
The filter is deleted for all KUMA users.
Page top
Viewing details on an alert
To view details on an alert:
- In the application web interface window, select the Alerts section.
The alerts table is displayed.
- Click the name of the alert whose details you want to view.
This opens a window containing information about the alert.
The upper part of the alert details window contains a toolbar and shows the alert severity and the user name to which the alert is assigned. In this window, you can process the alert: change its severity, assign it to a user, and close and create an incident based on the alert.
Details on alert section
This section lets you view basic information about an alert. It contains the following data:
- Correlation rule severity is the severity of the correlation rule that triggered the creation of the alert.
- Max asset category severity—the highest severity of an asset category assigned to assets related to this alert. If multiple assets are related to the alert, the largest value is displayed.
- Linked to incident—if the alert is linked to an incident, the name and status of the alert are displayed. If the alert is not linked to an incident, the field is blank.
- First seen—the date and time when the first correlation event of the event sequence was created, triggering creation of the alert.
- Last seen—the date and time when the last correlation event of the event sequence was created, triggering creation of the alert.
- Alert ID—the unique identifier of an alert in KUMA.
- Tenant—the name of the tenant that owns the alert.
- Correlation rule—the name of the correlation rule that triggered the creation of the alert. The rule name is represented as a link that can be used to open the settings of this correlation rule.
- Overflowed is a tag meaning that the alert size has reached or will soon reach the limit of 16 MB and the alert must be handled. New events are not added to the overflowed alerts, but you can click the All possible related events link to filter all events that could be related to the alert if there were no overflow.
A quick alert overflow may mean that the corresponding correlation rule is configured incorrectly, and this leads to frequent triggers. Overflowed alerts should be handled as soon as possible to correct the correlation rule if necessary.
Related events section
This section contains a table of events related to the alert. If you click the arrow (![]() ) icon near a correlation rule, the base events from this correlation rule will be displayed. Events can be sorted by severity and time.
) icon near a correlation rule, the base events from this correlation rule will be displayed. Events can be sorted by severity and time.
Selecting an event in the table opens the details area containing information about the selected event. The details area also displays the Detailed view button, which opens a window containing information about the correlation event.
The Find in events links below correlation events and the Find in events button to the right of the section heading are used to go to alert investigation.
You can use the Download events button to download information about related events into a CSV file (in UTF-8 encoding). The file contains columns that are populated in at least one related event.
Some CSV file editors interpret the separator value (for example, \n) in the CSV file exported from KUMA as a line break, not as a separator. This may disrupt the line division of the file. If you encounter a similar issue, you may need to additionally edit the CSV file received from KUMA.
In the events table, in the event details area, in the alert window, and in the widgets, the names of assets, accounts, and services are displayed instead of the IDs as the values of the SourceAssetID, DestinationAssetID, DeviceAssetID, SourceAccountID, DestinationAccountID, and ServiceID fields. When exporting events to a file, the IDs are saved, but columns with names are added to the file. The IDs are also displayed when you point the mouse over the names of assets, accounts, or services.
Searching for fields with IDs is only possible using IDs.
Related endpoints section
This section contains a table of assets related to the alert. Asset information comes from events that are related to the alert. You can search for assets by using the Search for IP addresses or FQDN field. Assets can be sorted using the Count and Endpoint columns.
This section also displays the assets related to the alert. Clicking the name of the asset opens the Asset details window.
You can use the Download assets button to download information about related assets into a CSV file (in UTF-8 encoding). The following columns are available in the file: Count, Name, IP address, FQDN, Categories.
Related users section
This section contains a table of users related to the alert. User information comes from events that are related to the alert. You can search for users using the Search for users field. Users can be sorted by the Count, User, User principal name and Email columns.
You can use the Download users button to download information about related users into a CSV file (in UTF-8 encoding). The following columns are available in the file: Count, User, User principal name, Email, Domain, Tenant.
Change log section
This section contains entries about changes made to the alert by users. Changes are automatically logged, but it is also possible to add comments manually. Comments can be sorted by using the Time column.
If necessary, you can enter a comment for the alert in the Comment field and click Add to save it.
Changing alert names
To change the alert name:
- In the KUMA web interface window, select the Alerts section.
The alerts table is displayed.
- Click the name of the alert whose details you want to view.
This opens a window containing information about the alert.
- In the upper part of the window, click and in the field that opens, enter the new name of the alert. To confirm the name, press ENTER or click outside the entry field.
Alert name is changed.
Processing alerts
You can change the alert severity, assign an alert to a user, close the alert, or create an incident based on the alert.
To process an alert:
- Select required alerts using one of the methods below:
- In the Alerts section of the KUMA web interface, click the alert whose information you want to view.
The Alert window opens and provides an alert processing toolbar at the top.
- In the Alerts section of the KUMA web interface, select the check box next to the required alert. It is possible to select more than one alert.
Alerts with the closed status cannot be selected for processing.
A toolbar will appear at the bottom of the window.
- In the Alerts section of the KUMA web interface, click the alert whose information you want to view.
- If you want to change the severity of an alert, select the required value in the Severity drop-down list:
- Low
- Medium
- High
- Critical
The severity of the alert changes to the selected value.
- If you want to assign an alert to a user, select the relevant user from the Assign to drop-down list.
You can assign the alert to yourself by selecting Me.
The status of the alert will change to Assigned and the name of the selected user will be displayed in the Assign to drop-down list.
- In the Related users section, select a user and configure Active Directory response settings.
- After the related user is selected, in the Account details window that opens, click Response via Active Directory.
- In the AD command drop-down list, select one of the following values:
- Add account to group
- Remove account from group
- Reset account password
- Block account
- Click Apply.
- If required, create an incident based on the alert:
- Click Create incident.
The window for creating an incident will open. The alert name is used as the incident name.
- Update the desired incident parameters and click the Save button.
The incident is created, and the alert status is changed to Escalated. An alert can be unlinked from an incident by selecting it and clicking Unlink.
- Click Create incident.
- If you want to close the alert:
- Click Close alert.
A confirmation window opens.
- Select the reason for closing the alert:
- Responded. This means the appropriate measures were taken to eliminate the security threat.
- Incorrect data. This means the alert was a false positive and the received events do not indicate a security threat.
- Incorrect correlation rule. This means the alert was a false positive and the received events do not indicate a security threat. The correlation rule may need to be updated.
- Click OK.
The status of the alert is changed to Closed. Alerts with this status are no longer updated with new correlation events and aren't displayed in the alerts table unless the Closed check box is selected in the Status drop-down list in the alerts table. You cannot change the status of a closed alert or assign it to another user.
- Click Close alert.
Alert investigation
Alert investigation is used when you need to find more information about the threat that triggered the alert — is the threat real, what is its origin, what elements of the network environment are affected by it, how should the threat be dealt with. Studying the events related to the correlation events that triggered an alert can help you determine the course of action.
For convenience of investigating alerts, make sure that time is synchronized on all devices involved in the event life cycle (event sources, KUMA servers, client hosts) with the help of Network Time Protocol (NTP) servers.
The alert investigation mode is enabled in KUMA when you click the Find in events link in the alert window or the correlation event window. When the alert investigation mode is enabled, the events table is shown with filters automatically set to match the events from the alert or correlation event. The filters also match the time period of the alert duration or the time when the correlation event was registered. You can change these filters to find other events and learn more about the processes related to the threat.
An additional  drop-down list becomes available in alert investigation mode:
- All events—view all events.
- Related to alert (selected by default)—view only events related to the alert.
When filtering events related to an alert, there are limitations on the complexity of SQL search queries.
You can manually assign an event of any type except the correlation event to an alert. Only events that are not related to the alert can be linked to it.
You can create and save event filters in alert investigation mode. When using this filter in normal mode, all events that match the filter criteria are selected regardless of whether or not they are related to the alert that was selected for alert investigation.
To link an event to an alert:
- In the Alerts section of the KUMA web interface, click the alert that you want to link to the event.
The Alert window opens.
- In the Related events section, click the Find in events button.
The events table is opened and displayed with active date and time filters matching the date and time of events linked to the alert. The columns show the settings used by the correlation rule to generate the alert. The Link to alert column is also added to the events table showing the events linked to the alert.
- In the drop-down list select All events.
- If necessary, modify the filters to find the event that you need to link to the alert.
- Select the relevant event and click the Link to alert button in the lower part of the event details area.
The event will be linked to the alert. You can unlink this event from the alert by clicking in the Unlink from alert detailed view.
When an event is linked to or unlinked from an alert, a corresponding entry is added to the Change log section in the Alert window. You can click the link in this entry to open the details area and unlink or link the event to the alert by clicking the corresponding button.
Page top
Retention of alerts and incidents
The alert and incident retention conditions are determined by the following criteria:
- Retention period. By default, alerts and incidents are retained in KUMA for a year. This period can be changed by editing the application startup parameters in the file /usr/lib/systemd/system/kuma-core.service on the KUMA Core server. See the "Setting the retention period for alerts and incidents" section later in this article.
- Deletion conditions. After the expiration of the specified retention period, if certain conditions are satisfied, alerts and incidents may be retained further. See the "Alert and incident deletion conditions" section later in this article.
There are no limitations on the size of a stored alert.
Setting the retention period for alerts and incidents
You can change the alert and incident retention period in one of the following ways:
- In the KUMA web interface
- On the command line
To change the retention period for alerts and incidents in the KUMA web interface:
- In the KUMA web interface, go to the Settings → Other → General section.
- In the General window, under Core properties, specify the Alert retention period, days.
The retention period for alerts and incidents will be changed.
To change the retention period for alerts and incidents on the command line:
- Log in to the OS of the server where the KUMA Core is installed.
- In the /usr/lib/systemd/system/kuma-core.service file, edit the following string by inserting the necessary number of days:
ExecStart=/opt/kaspersky/kuma/kuma core --alerts.retention <retention period for alerts and incidents in days> --external :7220 --internal :7210 --mongo mongodb://localhost:27017> --external :7220 --internal :7210 - Restart KUMA by running the following commands in sequence:
systemctl daemon-reloadsystemctl restart kuma-core
The retention period for alerts and incidents will be changed.
Alert and incident deletion conditions
KUMA applies the following alert and incident deletion conditions:
- If an alert is older than the retention period, its events are deleted regardless of the alert status.
- If an alert is older than the retention period, has the Closed status, and is not linked to an incident, the alert is deleted.
- If an alert is older than the retention period (regardless of the alert status) and is linked to an incident whose retention period has not yet expired, the alert events are deleted, the alert itself without events is available for display and remains linked to the incident without the events.
- If the incident is older than the retention period, the status of the incident is Closed, and it has no linked alerts, the incident is deleted.
- If an incident is older than the retention period, the status of the incident is Closed, and only alerts older than the retention period are linked to it (the status of alerts linked to a closed incident is always Closed, incident closed), the incident is deleted together with all its alerts and events.
- If an incident is older than the retention period (regardless of the status of the incident), and it has linked alerts that have not yet expired, nothing is deleted.
- If an incident is older than the retention period, has a status other than Closed, and alerts older than the retention period are linked to the incident, the incident is not deleted, alerts are not deleted, but events of the alerts are deleted.
- Empty alerts (alerts without events whose retention period has expired) are deleted together with incidents when the incident satisfes deletion conditions in accordance with the retention period are satisfied (the incident has the Closed status and its retention period has expired).
- If an incident is older than the retention period, the status of the incident is Closed, and the incident has linked alerts that are older than the retention period and some alerts that have not yet expired, the incident is not deleted; alerts that have not yet expired are not deleted; events of expired alerts are deleted, and the alerts themselves remain empty and linked to the incident.
The conditions are independent, none of the conditions are mutually exclusive.
Page top
Alert notifications
Standard KUMA notifications are sent by email when alerts are generated and assigned. You can configure delivery of alert generation notifications based on a custom email template.
To configure delivery of alert generation notifications based on a custom template:
- In the KUMA web interface, open Settings → Alerts → Notification rules.
- Select the tenant for which you want to create a notification rule:
- If the tenant already has notification rules, select it in the table.
- If the tenant has no notification rules, click Add tenant and select the relevant tenant from the Tenant drop-down list.
- Under Notification rules, click Add and specify the notification rule settings:
- Name (required)—specify the notification rule name in this field.
- Recipient emails (required)—in this settings block, you can use the Email button to add the email addresses to which you need to send notifications about alert generation. Addresses are added one at a time.
Cyrillic domains are not supported. For example, a notification cannot be sent to
login@domain.us. - Correlation rules (required)—in this settings block, you must select one or more correlation rules that, when triggered, will cause notification sending.
The window displays a tree structure representing the correlation rules from the shared tenant and the user-selected tenant. To select a rule, select the check box next to it. You can select the check box next to a folder to select all correlation rules in that folder and its subfolders.
- Template (required)—in this settings block, you must select an email template that will be used to create the notifications. To select a template, click the icon, select the required template in the opened window, and click Save.
You can create a template by clicking the plus icon or edit the selected template by clicking the pencil icon.
- Disabled—by selecting this check box, you can disable the notification rule.
- Click Save.
The notification rule is created. When an alert is created based on the selected correlation rules, notifications created based on custom email templates will be sent to the specified email addresses. Standard KUMA notifications about the same event will not be sent to the specified addresses.
To disable notification rules for a tenant:
- In the KUMA web interface, open Settings → Alerts → Notification rules and select the tenant whose notification rules you want to disable.
- Select the Disabled check box.
- Click Save.
The notification rules of the selected tenant are disabled.
For disabled notification rules, the correctness of the specified parameters is not checked; at the same time, notifications cannot be enabled for a tenant if incorrect rules exist. If you create or edit individual notification rules with tenant notification rules disabled, before enabling tenant notification rules, it is recommended to: 1) disable all individual notification rules, 2) enable tenant notification rules, 3) enable individual notification rules one by one.
Page top
Working with incidents
In the Incidents section of the KUMA web interface, you can create, view and process incidents. You can also filter incidents if needed. Clicking the name of an incident opens a window containing information about the incident.
Incidents can be exported to NCIRCC.
The retention period for incidents is one year, but this setting can be changed.
The date format of the incident depends on the localization language selected in the application settings. Possible date format options:
- English localization: YYYY-MM-DD.
- Russian localization: DD.MM.YYYY.
About the incidents table
The main part of the Incidents section shows a table containing information about registered incidents. If required, you can change the set of columns and the order in which they are displayed in the table.
How to customize the incidents table
- Click the gear () icon in the upper-right corner of the incidents table.
The table customization window opens.
- Select the check boxes opposite the settings that you want to view in the table.
When you select a check box, the events table is updated and a new column is added. When a check box is cleared, the column disappears.
You can search for table parameters using the Search field.
By pressing the Default button, the following columns are selected for display:
- Name.
- Threat duration.
- Assigned.
- Created.
- Tenant.
- Status.
- Hits count.
- Severity.
- Affected asset categories.
- Change the display order of the columns as needed by dragging the column headings.
- If you want to sort the incidents by a specific column, click its title and select one of the available options in the drop-down list: Ascending or Descending.
- To filter incidents by a specific parameter, click on the column header and select the required filters from the drop-down list. The set of filters available in the drop-down list depends on the selected column.
- To remove filters, click the relevant column heading and select Clear filter.
Available columns of the incidents table:
- Name—the name of the incident. Names of incidents received from NCIRCC have the ALRT* prefix.
- Threat duration—the time span during which the incident occurred (the time between the first and the last event related to the incident).
- Assigned to—the name of the security officer to whom the incident was assigned for investigation or response.
- Created—the date and time when the incident was created. This column allows you to filter incidents by the time they were created.
- The following preset periods are available: Today, Yesterday, This week, Previous week.
- If required, you can set an arbitrary period by using the calendar that opens when you select Before date, After date, or In period.
- Tenant—the name of the tenant that owns the incident.
- Status—current status of the incident:
- Opened—new incident that has not been processed yet.
- Assigned—the incident has been processed and assigned to a security officer for investigation or response.
- Closed—the incident is closed; the security threat has been resolved.
- Alerts number—the number of alerts included in the incident. Only the alerts of those tenants to which you have access are taken into account.
- Severity shows how important a possible security threat is: Critical , High , Medium , Low .
- Affected asset categories—categories of alert-related assets with the highest severity. No more than three categories are displayed.
- Updated—the date and time of the last change made in the incident.
- First event and Last event—dates and times of the first and last events in the incident.
- Incident category and Incident type—category and type of threat assigned to the incident.
- Export to NCIRCC—the status of incident data export to NCIRCC:
- Not exported—the data was not forwarded to NCIRCC.
- Export failed—an attempt to forward data to NCIRCC ended with an error, and the data was not transmitted.
- Exported—data on the incident has been successfully transmitted to NCIRCC.
- Branch—data on the specific node where the incident was created. Incidents of your node are displayed by default. This column is displayed only when hierarchy mode is enabled.
- CII—an indication of whether the incident involves assets that are CII objects. The column is hidden from the users who do not have access to CII objects.
In the Search field, you can enter a regular expression for searching incidents based on their related assets, users, tenants, and correlation rules. Parameters that can be used for a search:
- Assets: name, FQDN, IP address.
- Active Directory accounts: attributes displayName, SAMAccountName, and UserPrincipalName.
- Correlation rules: name.
- KUMA users who were assigned alerts: name, login, email address.
- Tenants: name.
When filtering incidents based on a specific parameter, the corresponding column in the incidents table is highlighted in yellow.
Page top
Saving and selecting incident filter configuration
In KUMA, you can save changes to incident table settings as filters. Filter configurations are saved on the KUMA Core server and are available to all KUMA users of the tenant for which they were created.
To save the current filter configuration settings:
- In the Incidents section of KUMA, open the Select filter drop-down list.
- Select Save current filter.
A window will open for entering the name of the new filter and selecting the tenant that will own the filter.
- Enter a name for the filter configuration. The name must be unique for alert filters, incident filters, and event filters.
- In the Tenant drop-down list, select the tenant that will own the filter and click Save.
The filter configuration is now saved.
To select a previously saved filter configuration:
- In the Incidents section of KUMA, open the Select filter drop-down list.
- Select the configuration you want.
The filter configuration is now active.
You can select the default filter by putting an asterisk to the left of the required filter configuration name in the Filters drop-down list.
To reset the current filter settings,
open the Filters drop-down and select Clear filter.
Page top
Deleting incident filter configurations
To delete a previously saved filter configuration:
- In the Incidents section of KUMA, open the Filters drop-down list.
- Click the button next to the configuration you want to delete.
- Click OK.
The filter configuration is now deleted for all KUMA users.
Page top
Viewing information about an incident
To view information about an incident:
- In the application web interface window, select the Incidents section.
- Select the incident whose information you want to view.
This opens a window containing information about the incident.
Some incident parameters are editable. Incidents automatically created in KUMA based on a notification from NCIRCC have the ALRT* prefix.
In the upper part of the Incident details window, there is a toolbar and the name of the user to whom the incident is assigned. The window sections are displayed as tabs. You can click a tab to move to the relevant section. In this window, you can process the incident: assign it to a user, combine it with another incident, or close it.
The Description section contains the following data:
- Created—the date and time when the incident was created.
- Name—the name of the incident.
You can change the name of an incident by entering a new name in the field and clicking Save The name must contain 1 to 128 Unicode characters.
- Tenant—the name of the tenant that owns the incident.
The tenant can be changed by selecting the required tenant from the drop-down list and clicking Save
- Status—current status of the incident:
- Opened—new incident that has not been processed yet.
- Assigned—the incident has been processed and assigned to a security officer for investigation or response.
- Closed—the incident is closed; the security threat has been resolved.
- Severity—the severity of the threat posed by the incident. Possible values:
- Critical
- High
- Medium
- Low
Severity can be changed by selecting the required value from the drop-down list and clicking Save.
- Affected asset categories—the assigned categories of assets associated with the incident.
- First event time and Last event time—dates and times of the first and last events in the incident.
- Type and Category—type and category of the threat assigned to the incident. You can change these values by selecting the relevant value from the drop-down list and clicking Save.
- Export to NCIRCC—information on whether or not this incident was exported to NCIRCC.
- Description—description of the incident.
To change the description, edit the text in the field and click Save. The description can contain no more than 256 Unicode characters.
- Related tenants—tenants associated with incident-related alerts, assets, and users.
- Available tenants—tenants whose alerts can be linked to the incident automatically.
The list of available tenants can be changed by checking the boxes next to the required tenants in the drop-down list and clicking Save.
The Related alerts section contains a table of alerts related to the incident. When you click on the alert name, a window opens with detailed information about this alert.
The Related endpoints and Related users sections contain tables with data on assets and users related to the incident. This information comes from alerts that are related to the incident.
You can add data to the tables in the Related alerts, Related endpoints and Related users sections by clicking the Link button in the appropriate section and selecting the object to be linked to the incident in the opened window. If required, you can unlink objects from the incident. To do this, select the objects as required, click Unlink in the section to which they belong, and save the changes. If objects were automatically added to the incident, they cannot be unlinked until the alert mentioning those objects is unlinked. The set of the fields in the tables can be changed by clicking the gear (![]() ) button in the relevant section. You can search the data in the tables of these sections using the Search fields.
) button in the relevant section. You can search the data in the tables of these sections using the Search fields.
The Change log section contains a record of the changes you and your users made to the incident. Changes are automatically logged, but it is also possible to add comments manually.
In the NCIRCC integration section, you can monitor the incident status in NCIRCC. In this section, you can also export incident data to NCIRCC, send files to NCIRCC, and exchange messages with NCIRCC experts.
If incident settings have been modified on the NCIRCC side, a corresponding notification is displayed in the incident window in KUMA. In this case, for the settings whose values were modified, the window displays the values from KUMA and the values from NCIRCC.
Page top
Incident creation
To create an incident:
- Open the KUMA web interface and select the Incidents section.
- Click Create incident.
The window for creating an incident will open.
- Fill in the mandatory parameters of the incident:
- In the Name field enter the name of the incident. The name must contain 1 to 128 Unicode characters.
- In the Tenant drop-down list, select the tenant that owns the created incident.
- If necessary, provide other parameters for the incident:
- In the Severity drop-down list, select the severity of the incident. Available options: Low, Medium, High, Critical.
- In the First event time and Last event time fields, specify the time range in which events related to the incident were received.
- In the Category and Type drop-down lists, select the category and type of the incident. The available incident types depend on the selected category.
- Add the incident Description. The description can contain no more than 256 Unicode characters.
- In the Available tenants drop-down list, select the tenants whose alerts can be linked to the incident automatically.
- In the Related alerts section, add alerts related to the incident.
- In the Related endpoints section, add assets related to the incident.
- In the Related users section, add users related to the incident.
- Add a Comment to the incident.
- Click Save.
The incident has been created.
Page top
Incident processing
For convenience of processing incidents, make sure that time is synchronized on all devices involved in the event life cycle (event sources, KUMA servers, client hosts) with the help of Network Time Protocol (NTP) servers.
You can assign an incident to a user, aggregate it with other incidents, or close it.
To process an incident:
- Select required incidents using one of the methods below:
- In the Incidents section of the KUMA web interface, click on the incident to be processed.
The incident window will open, displaying a toolbar on the top.
- In the Incidents section of the KUMA web console, select the check box next to the required incidents.
A toolbar will appear at the bottom of the window.
- In the Incidents section of the KUMA web interface, click on the incident to be processed.
- In the Assign to drop-down list, select the user to whom you want to assign the incident.
You can assign the incident to yourself by selecting Me.
The status of the incident changes to assigned and the name of the selected user is displayed in the Assign to drop-down list.
- In the Related users section, select a user and configure Active Directory response settings.
- After the related user is selected, in the Account details window that opens, click Response via Active Directory.
- In the AD command drop-down list, select one of the following values:
- Add account to group
- Remove account from group
- Reset account password
- Block account
- Click Apply.
- If required, edit the incident parameters.
- After investigating, close the incident:
- Click Close.
A confirmation window opens.
- Select the reason for closing the incident:
- confirmed. This means the incident was valid and appropriate measures were taken to eliminate the security threat.
- not confirmed. This means the incident was a false positive and the received events do not indicate a security threat.
- Click Close.
The Closed status will be assigned to the incident. Incidents with this status cannot be edited, and they are displayed in the incidents table only if you selected the Closed check box in the Status drop-down list when filtering the table. You cannot change the status of a closed incident or assign it to another user, but you can aggregate it with another incident.
- Click Close.
- If requited, aggregate the selected incidents with another incident:
- Click Merge. In the opened window, select the incident in which all data from the selected incidents should be placed.
- Confirm your selection by clicking Merge.
The incidents will be aggregated.
The incident has been processed.
Page top
Changing incidents
To change the parameters of an incident:
- In the Incidents section of the KUMA web interface, click on the incident you want to modify.
The Incident window opens.
- Make the necessary changes to the parameters. All incident parameters that can be set when creating it are available for editing.
- Click Save.
The incident will be modified.
Page top
Automatic linking of alerts to incidents
In KUMA, you can configure automatic linking of generated alerts to existing incidents if alerts and incidents have related assets or users in common. If this setting is enabled, when creating an alert the application searches for incidents falling into a specified time interval that includes assets or users from the alert. In addition, the application checks whether the generated alert pertains to the tenants specified in the incidents' Available tenants parameter. If a matching incident is found, the application links the generated alert to the incident it found.
To set up automatic linking of alerts to incidents:
- In the KUMA web interface, open Settings → Incidents → Automatic linking of alerts to incidents.
- Select the Enable check box in the Link by assets and/or Link by accounts parameter blocks depending on the types of connections between incidents and alerts that you are looking for.
- Define the Incidents must not be older than value for the parameters that you want to use when searching links. The generated alerts will be compared with incidents no older than the specified interval.
Automatic linking of alerts to incidents is configured.
To disable automatic linking of alerts to incidents,
In the KUMA web interface, under Settings → Incidents → Automatic linking of alerts to incidents, select the Disabled check box.
Page top
Categories and types of incidents
For your convenience, you can assign categories and types. If an incident has been assigned a NCIRCC category, it can be exported to NCIRCC.
Categories and types of incidents that can be exported to NCIRCC
The categories of incidents can be viewed or changed under Settings → Incidents → Incident types, in which they are displayed as a table. By clicking on the column headers, you can change the table sorting options. The resource table contains the following columns:
- Category—a common characteristic of an incident or cyberattack. The table can be filtered by the values in this column.
- Type—the class of the incident or cyberattack.
- NCIRCC category—incident type according to NCIRCC nomenclature. Incidents that have been assigned custom types and categories cannot be exported to NCIRCC. The table can be filtered by the values in this column.
- Vulnerability—specifies whether the incident type indicates a vulnerability.
- Created—the date the incident type was created.
- Updated—the date the incident type was modified.
To add an incident type:
- In the KUMA web interface, under Settings → Incidents → Incident types, click Add.
The incident type creation window will open.
- Fill in the Type and Category fields.
- If the created incident type matches the NCIRCC nomenclature, select the NCIRCC category check box.
- If the incident type indicates a vulnerability, check Vulnerability.
- Click Save.
The incident type has been created.
Page top
Interaction with NCIRCC
In KUMA, you can interact with the National Computer Incident Response & Coordination Center (hereinafter NCIRCC) in the following ways:
- Export incidents to NCIRCC.
- Supplement the exported incident with data when requested by NCIRCC.
- Send files to NCIRCC.
- Exchange messages with NCIRCC experts.
- View the changes made by NCIRCC to the parameters of exported incidents.
- Process incidents with the ALRT* prefix that are automatically created in KUMA based on a notification from NCIRCC.
Data in KUMA and NCIRCC is synchronized every 5-10 minutes.
Conditions for NCIRCC interaction
To interact with NCIRCC, the following conditions must be met:
- The application license includes the GosSOPKA module.
- NCIRCC integration is configured.
- The Can interact with NCIRCC check box is selected in the settings of the users whose responsibilities include interaction with NCIRCC.
NCIRCC interaction workflow
In KUMA, the process of sending incidents to NCIRCC to be processed consists of the following stages:
- Creating an incident and checking it for compliance with NCIRCC requirements
You can create an incident or get it from a child KUMA node. Before sending data to the NCIRCC, make sure that the incident category meets NCIRCC requirements.
- Exporting the incident to NCIRCC
If the incident is successfully exported to NCIRCC, its Export to NCIRCC setting is set to Exported. In the lower part of the incident window, a chat with NCIRCC experts becomes available.
At NCIRCC, the incident received from you is assigned a registration number and status. This information is displayed in the incident window in the NCIRCC integration section and in automatic chat messages.
If all the necessary data is provided to NCIRCC, the incident is assigned the Under examination status. The settings of the incident having this status can be edited, but the updated information cannot be sent from KUMA to NCIRCC. You can view the difference between the incident data in KUMA and in NCIRCC.
- Supplementing incident data
If NCIRCC experts do not have enough information to process an incident, they can assign it the More information required status. In KUMA, this status is displayed in the incident window in the NCIRCC integration section. Users are notified about the status change.
If necessary, you can attach a file to the incident.
When the data is supplemented, the incident is re-exported to NCIRCC with earlier information updated. The incidents in the child nodes cannot be modified from the parent KUMA node. It must be done by employees of the child KUMA nodes.
If the incident is successfully supplemented with data, it is assigned the Under examination status.
- Completing incident processing
After the NCIRCC experts process the incident, the NCIRCC status is changed to Decision made. In KUMA, this status is displayed in the incident window in the NCIRCC integration section.
Upon receiving this status, the incident is automatically closed in KUMA. Interaction with NCIRCC on this incident by means of KUMA becomes impossible.
Exporting data to NCIRCC
To export an incident to NCIRCC:
- In the Incidents section of the KUMA web interface, open the incident you want to export.
- Click the Export to NCIRCC button in the lower part of the window.
- If you have not specified the category and type of incident, specify this information in the window that opens and click the Export to NCIRCC button.
This opens the export settings window.
If you specified the category and type of the incident in the incident card, you need to save the incident before exporting it to NCIRCC. - Specify the settings on the Basic tab of the Export to NCIRCC window:
- On the Basic settings tab, fill in the required fields:
Company name, Asset owner, Incident category, Incident type, Description, value of the TLP protocol, Incident creation date, Status, Affected system name, Affected system category, Affected system function, Location.
- If you want to submit information about a personal data leak, select the Information about PD leakage check box, which enables the Information about PD leakage tab. This check box is cleared by default.
The Operator name, INN, and Operator address fields are populated automatically with the values specified when setting up the NCIRCC integration. However, the field values can be edited when preparing the data export to NCIRCC.
Personal data leak fields are available for the Notification about a computer incident category for the following notification types:
- Malware infection
- Compromised user account
- Unauthorized disclosure of information
- Successful exploitation of a vulnerability
- Event is not related to a computer attack
- Product info (required)—this table becomes available if you selected Notification about a detected vulnerability as the incident category.
You can use the Add new element button to add a string to the table. In the Name column, you must indicate the name of the application (for example,
MS Office). Specify the application version in the Version column (for example,2.4). - Vulnerability ID—if necessary, specify the identifier of the detected vulnerability. For example,
CVE-2020-1231.This field becomes available if you selected Notification about a detected vulnerability as the incident category.
- Product category—if necessary, specify the name and version of the vulnerable product. For example,
Microsoft operating systems and their components.This field becomes available if you selected Notification about a detected vulnerability as the incident category.
- If you want to submit information about a personal data leak, select the Information about PD leakage check box, which enables the Information about PD leakage tab. This check box is cleared by default.
- If required, define the settings on the Advanced tab of the Export to NCIRCC window.
The available settings on the tab depend on the selected category and type of incident:
- Detection tool—specify the name of the product that was used to register the incident. For example,
KUMA 1.5. - Assistance required—select this check box if you need help from GosSOPKA employees.
- Incident end time—specify the date and time when the critical information infrastructure (CII object) was restored to normal operation after a computer incident, computer attack was ended, or a vulnerability was fixed.
- Availability impact—assess the degree of impact that the incident had on system availability:
- High
- Low
- None
- Integrity impact—assess the degree of impact that the incident had on system integrity:
- High
- Low
- None
- Confidentiality impact—assess the degree of impact that the incident had on data confidentiality:
- High
- Low
- None
- Custom impact—specify other significant impacts from the incident.
- City—indicate the city where your organization is located.
- Detection tool—specify the name of the product that was used to register the incident. For example,
- If assets are attached to the incident, you can specify their settings on the Technical details tab.
This tab becomes active only if you select the Affected system has Internet connection check box.
If you need to edit or supplement the information previously specified on the Technical details tab, you should do this in your GosSOPKA account, even if NCIRCC experts requested additional information from you, and you can edit the exported incident.
The categories of the listed assets must match the category of the affected CII in your system.
- Click Export.
- Confirm the export.
Information about the incident is submitted to NCIRCC, and the Export to NCIRCC incident setting is changed to Exported. At NCIRCC, the incident received from you is assigned a registration number and status. This information is displayed in the incident window in the NCIRCC integration section.
It is possible to change the data in the exported incident only if the NCIRCC experts requested additional information from you. If no additional information was requested, but you need to update the exported incident, you should do it in your GosSOPKA dashboard.
After the incident is successfully exported, the Compare KUMA incident to NCIRCC data button is displayed at the bottom of the screen. When you click this button, a window opens, where the differences in the incident data between KUMA and NCIRCC are highlighted.
Page top
Getting incidents from NCIRCC
After upgrading to version 3.4.1, at each startup, KUMA Core sends a request to get new incident cards to the address specified in the URL field in KUMA's NCIRCC integration settings, and then continues sending requests every 10 minutes. If a new incident appears in the NCIRCC user account dashboard, KUMA registers the incident with the ALRT* prefix and further interaction with NCIRCC is carried out in context of the created incident.
Interaction with NCIRCC is available even if the incident in KUMA has the Closed status: you can edit the value of the NCIRCC status field and chat with NCIRCC.
Notifications about messages from NCIRCC are sent to the email addresses of users with the General administrator role.
Fields of a new incident are populated as shown in the following table.
Field values of an incident received from NCIRCC.
Field name |
Value |
|---|---|
Created by |
When an incident is created in KUMA, creation date and time are automatically specified. Example: 2024-10-08 05:32:39 |
Name |
ID or registration number of the incident (message) in GosSOPKA. Example: ALRT-xx-xx-xxx |
Tenant |
The tenant in which incidents received from NCIRCC must be created. By default, all incidents are created in the Main tenant. You can change the incident creation tenant in the NCIRCC integration settings. Example: Main. |
Status |
Initial status of the KUMA incident. Example: Open. |
Severity |
Degree of significance of the potential security threat. Default: Critical. Possible values: Critical, High, Medium, Low. |
Affected asset categories |
Empty. This value can be filled in manually. |
First event time |
Empty. This value can be filled in manually. |
Last event time |
Empty. This value can be filled in manually. |
Description |
The value from the event_description field of the message sent by NCIRCC. Can be edited. Example: message from NCIRCC. |
Related tenants |
Same as the Tenant field. Example: Main. |
Available tenants |
Same as the Tenant field. Example: Main. |
Related alerts |
Empty. This value can be filled in manually. |
Related endpoints |
Empty. This value can be filled in manually. |
Related users |
Empty. This value can be filled in manually. |
Change log |
Empty. This value can be filled in manually. |
NCIRCC integration section |
|
Category |
Category of the message card. Dictionary value. Possible values: Message from NCIRCC. This field is not editable. |
Type |
Type of the information security event. Value from the dictionary. Possible values: Infected resource, Source of malware email messages, Source of malware modules, Malware C&C center, Element of malware infrastrucure, Resource slowdown, Source of exploit, Source of user account compromise, Participant of network traffic capture, Source of unauthorized access, Source of unauthorized modification of information, Source of spam, Publication of information illegal in the Russian Federation, Hosting of a phishing resource, Unauthorized content, Participant of DDoS attack, Compromised user account, Network Scan Source, Participant of fraud, Source of social engineering threat, Vulnerable resource, Suspected phishing resource, Threat of personal data compromise, Threat of computer attack. This field is not editable.
|
Status of export to NCIRCC |
Imported from NCIRCC. This field is not editable. |
NCIRCC message processing progress section |
|
NCIRCC status |
NCIRCC message processing status. Value from the dictionary. This field is editable. Possible values: New, In progress, Decision made, Interaction completed, Archived. |
Result |
Result of the decision made. Value from the dictionary. This field is editable. Possible values: Measures taken, Information taken into account, Information not confirmed. |
Chat with NCIRCC section |
|
UUID |
Unique ID of the NCIRCC message. |
Company |
Short name of the GosSOPKA subject organization. |
Category |
Category of the message card. Dictionary value. Example: message from NCIRCC. |
Type |
Type of the information security event. Value from the dictionary. Example: infected resource. |
Creation time |
Date and time when the NCIRCC message was registered. Follows the ISO 8601 standard. UTC time is used. |
Time of detection |
Date and time when the incident was detected. Follows the ISO 8601 standard. UTC time is used. |
Incident end time |
Date and time when the incident ended. Follows the ISO 8601 standard. UTC time is used. |
Updated |
Date and time when the message card was last updated. Follows the ISO 8601 standard. UTC time is used. |
Event description |
Brief description of the information security event. Up to 5000 Unicode characters. |
Owner name |
Owner of the information resource. Up to 5000 Unicode characters. |
Incident ID in NCIRCC |
Registration number of the message. Example: ALRT-20-12-2914. |
TLP |
TLP limitation marker. Dictionary value. Possible values: TLP:WHITE, TLP:GREEN, TLP:AMBER, TLP:RED. |
Technical details section |
|
The Technical details group of fields is displayed with the field values obtained from the message. Which NCIRCC message fields are present in the Technical details group depends on the Information security event type, and the set of fields may differ depending on the incident. Pay close attention to the field values in your NCIRCC account. Values are not editable. |
|
Supplementing incident data on request
If NCIRCC experts need additional information about the incident, they may request it from you. In this case, the incident status changes to More information required in the NCIRCC integration section of the incident window. The following KUMA users receive email notifications about the status change: the user to whom the incident is assigned and the user who exported the incident to NCIRCC.
If an incident is assigned the More information required status in NCIRCC, the following actions are also available for this incident in KUMA:
- Upload files to NCIRCC.
- Re-export the incident data to NCIRCC with updates or additions to the previously provided information. This action completes supplementing the incident data.
Sending files to NCIRCC
You can attach a file to an incident if the incident has one of the following NCIRCC statuses: New, In progress, More information required, Decision made. The file will be available both in NCIRCC and in the KUMA web interface.
For a hierarchical deployment of KUMA, files can only be uploaded to NCIRCC from the parent KUMA node. At the same time, log entries about the file download are visible in the child nodes of KUMA.
In the incident change log, messages about the files uploaded to NCIRCC by KUMA users are added. Messages about adding files by NCIRCC are not added to the log.
To attach a file to an incident:
- In the Incidents section of the KUMA web interface, open the incident you want to attach a file to.
- In the NCIRCC integration section of the incident window, select the File tab and click the Send file to NCIRCC button.
The file selection window opens.
- Select the required file no larger than 50 MB and confirm your selection.
The file is attached to the incident and available for both NCIRCC experts and KUMA users.
Data in KUMA and NCIRCC is synchronized every 5-10 minutes.
Page top
Communication with NCIRCC experts
After the incident is successfully exported to NCIRCC, a chat with NCIRCC experts becomes available at the bottom of the screen. You can exchange messages since successful incident export to NCIRCC until it is closed in NCIRCC.
The chat window with the message history and the field for entering new messages is available on the Chat tab in the NCIRCC integration section of the incident window.
Data in KUMA and NCIRCC is synchronized every 5-10 minutes.
Supported categories and types of NCIRCC incidents
The table below lists the categories and types of incidents that can be exported to NCIRCC:
Incident category |
Incident type |
Computer incident notification
|
Slowed operation of the resource due to a DDoS attack |
Malware infection |
|
Network traffic interception |
|
Compromised user account |
|
Unauthorized data modification |
|
Unauthorized disclosure of information |
|
Publication of illegal information on the resource |
|
Successful exploitation of a vulnerability |
|
Event is not related to a computer attack |
|
Use of a controlled resource for attacks |
|
Notification about a computer attack |
DDoS attack |
Unsuccessful authorization attempts |
|
Malware injection attempts |
|
Attempts to exploit a vulnerability |
|
Publication of fraudulent information |
|
Network scanning |
|
Social engineering |
|
Notification about a detected vulnerability |
Vulnerable resource |
Notifications about the incident status change in NCIRCC
In the event of certain changes in the status or data of an incident at NCIRCC, KUMA users receive the following notifications by email:
- Notification about receiving a message from NCIRCC.
- Additional data request notification.
- Notification about the incident status change in NCIRCC.
- Notification about automatic closure of an incident.
The following users receive notifications:
- The user to whom the incident was assigned.
- The user who exported the incident to NCIRCC.
Retroscan
In normal mode, the correlator handles only events coming from collectors in real time. Retroscan lets you apply correlation rules to historical events if you want to debug correlation rules or analyze historical data.
To test a rule, you do not need to replay the incident in real time, instead you can run the rule in Retroscan mode to process historical events which include the incident of interest.
You can use a search query to define a list of historical events to retrospectively scan, you can also specify a search period and the storage that you want to search for events. You can configure a task to have alerts generated and response rules applied during the retroscan of events.
Retroscanned events are not enriched with data from CyberTrace or the Kaspersky Threat Intelligence Portal.
Active lists are updated during retroscanning.
A retroscan cannot be performed on selections of events obtained using SQL queries that group data and contain arithmetic expressions.
To use Retroscan:
- In the Events section of the KUMA web interface, create the required event selection:
- Select the storage.
- Configure search expression using the constructor or search query.
- Select the required period.
- Open the
 drop-down list and choose Retroscan.
The Retroscan window opens.
- In the Correlator drop-down list, select the Correlator to feed selected events to.
- In the Correlation rules drop-down list, select the Correlation rules that must be used when processing events. If no rules are selected at this step, the scan is performed with all correlation rules applied.
- If you want responses to be executed when processing events, turn on the Execute responses toggle switch.
- If you want alerts to be generated during event processing, turn on the Create alerts toggle switch.
- Click the Create task button.
The retroscan task is created in the Task manager section.
To view scan results, in the Task manager section of the KUMA web interface, click the task you created and select Go to Events from the drop-down list.
This opens a new browser tab containing a table of events that were processed during the retroscan and the aggregation and correlation events that were created during event processing. Correlation events generated by the retroscan have an additional ReplayID field that stores the unique ID of the retrospective scan run. An analyst can restart the retroscan from the context menu of the task. New correlation events will have a different ReplayID.
Depending on your browser settings, you may be prompted for confirmation before your browser can open the new tab containing the retroscan results. For more details, please refer to the documentation for your specific browser.
Page top
Contacting Technical Support
If you are unable to resolve your problem by consulting the documentation of the application, please contact Kaspersky Technical Support.
Kaspersky provides technical support for this application throughout its lifecycle (please refer to the product support lifecycle page).
When processing your request, Kaspersky Technical Support may need a report generated by the collect.sh utility. For detailed information on using the utility, please refer to the Knowledge Base.
Page top
REST API
You can access KUMA from third-party solutions using the API. The KUMA REST API operates over HTTP and consists of a set of request/response methods. Two versions are supported:
- REST API v1 — the FQDN array is not used in requests.
- REST API v2 — the FQDN array is used in requests.
- REST API v2.1 — the FQDN array is used in requests.
REST API requests must be sent to the following address:
https://<KUMA Core FQDN>/api/<API version>/<request>
Example: https://kuma.example.com:7223/api/v1 https://kuma.example.com:7223/api/v2 https://kuma.example.com:7223/api/v2.1 |
By default the 7223 port is used for API requests. You can change the port.
To change port used for REST API requests:
- Log in to the OS of the server where the KUMA Core is installed.
- In the file /etc/systemd/system/multi-user.target.wants/kuma-core.service change the following string, adding required port:
ExecStart=/opt/kaspersky/kuma/kuma core --external :7220 --internal :7210 --mongo mongodb://localhost:27017 --rest <required port number for REST API requests> - Restart KUMA by running the following commands in sequence:
systemctl daemon-reloadsystemctl restart kuma-core
New port is used for REST API.
Make sure that the port is available and is not closed by the firewall.
Authentication header: Authorization: Bearer <token>
Default data format: JSON
Date and time format: RFC 3339
Intensity of requests: unlimited
Creating a token
To generate a token for a user:
- In the KUMA web interface, open Settings → Users.
In the right part of the Settings section the Users table will be displayed.
- Select the relevant user and click the Generate token button in the details area that opens on the right.
The New token window opens.
- If necessary, set the token expiration date:
- Select the No expiration date check box.
- In the Expiration date field, use the calendar to specify the date and time when the created token will expire.
- Click the Generate token button.
When you click this button, the user details area displays a field containing the automatically created token. When the window is closed, the token is no longer displayed. If you did not copy the token before closing the window, you will have to generate a new token.
- Click Save.
The token is generated and can be used for API requests. These same steps can be taken to generate a token in your account profile.
Page top
Configuring permissions to access the API
In KUMA, you can configure the specific operations that can be performed on behalf of each user. Permissions can be configured only for users created in KUMA.
To configure available operations for a user:
- In the KUMA web interface, open Settings → Users.
In the right part of the Settings section the Users table will be displayed.
- Select the relevant user and click the API access rights button in the details area that opens on the right.
This opens a window containing a list of available operations. By default, all API requests are available to a user.
- Select or clear the check box next to the relevant operation.
- Click Save.
Available operations for the user are configured.
The available operations can be configured in the same way in your account profile.
Page top
Authorizing API requests
Each REST API request must include token-based authorization. The user whose token is used to make the API request must have the permissions to perform this type of request.
Each request must be accompanied by the following header:
Authorization: Bearer <token>
Possible errors:
HTTP code |
Description |
message field value |
details field value |
400 |
Invalid header |
invalid authorization header |
Example: <example> |
403 |
The token does not exist or the owner user is disabled |
access denied |
|
Standard error
Errors returned by KUMA have the following format:
|
Viewing a list of active lists on the correlator
GET /api/v1/activeLists
The target correlator must be running.
Access: General administrator, Tenant administrator, Tier 2 analyst, Tier 1 analyst.
Query parameters
Name |
Data type |
Mandatory |
Description |
Value example |
correlatorID |
string |
Yes |
Correlator service ID |
00000000-0000-0000-0000-000000000000 |
Response
HTTP code: 200
Format: JSON
|
Possible errors
HTTP code |
Description |
message field value |
details field value |
400 |
Correlator service ID is not specified |
query parameter required |
correlatorID |
403 |
The user does not have the required role in the correlator tenant |
access denied |
|
404 |
The service with the specified identifier (correlatorID) was not found |
service not found |
|
406 |
The service with the specified ID (correlatorID) is not a correlator |
service is not correlator |
|
406 |
The correlator did not execute the first start |
service not paired |
|
406 |
The correlator tenant is disabled |
tenant disabled |
|
50x |
Failed to access the correlator API |
correlator API request failed |
various |
500 |
Failed to decode the response body received from the correlator |
correlator response decode failed |
various |
500 |
Any other internal errors |
various |
various |
Import entries to an active list
POST /api/v1/activeLists/import
The target correlator must be running.
Access: General administrator, Tenant administrator, Tier 2 analyst, Tier 1 analyst.
Query parameters
Name |
Data type |
Mandatory |
Description |
Value example |
correlatorID |
string |
Yes |
Correlator service ID |
00000000-0000-0000-0000-000000000000 |
activeListID |
string |
If activeListName is not specified |
Active list ID |
00000000-0000-0000-0000-000000000000 |
activeListName |
string |
If activeListID is not specified |
Active list name |
Attackers |
format |
string |
Yes |
Format of imported entries |
csv, tsv, internal |
keyField |
string |
For the CSV and TSV formats only |
The name of the field in the header of the CSV or TSV file that will be used as the key field of the active list record. The values of this field must be unique |
ip |
clear |
bool |
No |
Clear the active list before importing. If the parameter is present in the URL query, then its value is assumed to be true. The values specified by the user are ignored. Example: /api/v1/activeLists/import?clear |
|
Request body
Format |
Contents |
csv |
The first line is the header, which lists the comma-separated fields. The rest of the lines are the values corresponding to the comma-separated fields in the header. The number of fields in each line must be the same. |
tsv |
The first line is the header, which lists the TAB-separated fields. The remaining lines are the values corresponding to the TAB-separated fields in the header. The number of fields in each line must be the same. |
internal |
Each line contains one individual JSON object. Data in the internal format can be received by exporting the contents of the active list from the correlator in the KUMA web console. |
Response
HTTP code: 204
Possible errors
HTTP code |
Description |
message field value |
details field value |
400 |
Correlator service ID is not specified |
query parameter required |
correlatorID |
400 |
Neither the activeListID parameter nor the activeListName parameter is specified |
one of query parameters required |
activeListID, activeListName |
400 |
The format parameter is not specified |
query parameter required |
format |
400 |
The format parameter is invalid |
invalid query parameter value |
format |
400 |
The keyField parameter is not specified |
query parameter required |
keyField |
400 |
The request body has a zero-length |
request body required |
|
400 |
The CSV or TSV file does not contain the field specified in the keyField parameter |
correlator API request failed |
line 1: header does not contain column <name> |
400 |
Request body parsing error |
correlator API request failed |
line <number>: <message> |
403 |
The user does not have the required role in the correlator tenant |
access denied |
|
404 |
The service with the specified identifier (correlatorID) was not found |
service not found |
|
404 |
No active list was found |
active list not found |
|
406 |
The service with the specified ID (correlatorID) is not a correlator |
service is not correlator |
|
406 |
The correlator did not execute the first start |
service not paired |
|
406 |
The correlator tenant is disabled |
tenant disabled |
|
406 |
A name search was conducted for the active list (activeListName), and more than one active list was found |
more than one matching active lists found |
|
50x |
Failed to access the correlator API |
correlator API request failed |
various |
500 |
Failed to decode the response body received from the correlator |
correlator response decode failed |
various |
500 |
Any other internal errors |
various |
various |
Searching alerts
GET /api/v1/alerts
Access: General administrator, Tenant administrator, Tier 2 analyst, Tier 1 analyst, Junior analyst, Interaction with NCIRCC, Access to CII.
Query parameters
Name |
Data type |
Mandatory |
Description |
Value example |
page |
number |
No |
Page number. Starts with 1. The page size is 250 entries. If the parameter is not specified, the default value is 1. |
1 |
id |
string |
No |
Alert ID. If the parameter is specified several times, then a list is generated and the logical OR operator is applied. |
00000000-0000-0000-0000-000000000000 |
TenantID |
string |
No |
Alert tenant ID. If the parameter is specified several times, then a list is generated and the logical OR operator is applied. If the user does not have the required role in the specified tenant, then this tenant is ignored. |
00000000-0000-0000-0000-000000000000 |
name |
string |
No |
Alert name. Case-insensitive regular expression (PCRE). |
alert |
timestampField |
string |
No |
The name of the alert field that is used to perform sorting (DESC) and search by period (from – to). lastSeen by default. |
lastSeen, firstSeen |
from |
string |
No |
Lower bound of the period in RFC3339 format. <timestampField> >= <from> |
2021-09-06T00:00:00Z (UTC) 2021-09-06T00:00:00.000Z (UTC, including milliseconds) 2021-09-06T00:00:00Z+00:00 (MSK) |
to |
string |
No |
Upper bound of the period in RFC3339 format. <timestampField> <= <to> |
2021-09-06T00:00:00Z (UTC) 2021-09-06T00:00:00.000Z (UTC, including milliseconds) 2021-09-06T00:00:00Z+00:00 (MSK) |
status |
string |
No |
Alert status. If the parameter is specified several times, then a list is generated and the logical OR operator is applied. |
new, assigned, escalated, closed |
withEvents |
bool |
No |
Include normalized KUMA events associated with found alerts in the response. If the parameter is present in the URL query, then its value is assumed to be true. The values specified by the user are ignored. Example: /api/v1/alerts?withEvents |
|
withAffected |
bool |
No |
Include information about the assets and accounts associated with the found alerts in the report. If the parameter is present in the URL query, then its value is assumed to be true. The values specified by the user are ignored. Example: /api/v1/alerts?withAffected |
|
Response
HTTP code: 200
Format: JSON
|
Possible errors
HTTP code |
Description |
message field value |
details field value |
400 |
Invalid value of the "page" parameter |
invalid query parameter value |
page |
400 |
Invalid value of the "status" parameter |
invalid status |
<status> |
400 |
Invalid value of the "timestampField" parameter |
invalid timestamp field |
|
400 |
Invalid value of the "from" parameter |
cannot parse from |
various |
400 |
Invalid value of the "to" parameter |
cannot parse to |
various |
400 |
The value of the "from" parameter is greater than the value of the "to" parameter |
from cannot be greater than to |
|
500 |
Any other internal errors |
various |
various |
Closing alerts
POST /api/v1/alerts/close
The target correlator must be running.
Access: General administrator, Tenant administrator, Tier 2 analyst, Tier 1 analyst, Junior analyst, Interaction with NCIRCC, Access to CII.
Request body
Format: JSON
Name |
Data type |
Mandatory |
Description |
Value example |
id |
string |
Yes |
Alert ID |
00000000-0000-0000-0000-000000000000 |
reason |
string |
Yes |
Reason for closing the alert |
responded, incorrect data, incorrect correlation rule |
Response
HTTP code: 204
Possible errors
HTTP code |
Description |
message field value |
details field value |
400 |
Alert ID is not specified |
id required |
|
400 |
The reason for closing the alert is not specified |
reason required |
|
400 |
Invalid value of the "reason" parameter |
invalid reason |
|
403 |
The user does not have the required role in the alert tenant |
access denied |
|
404 |
Alert not found |
alert not found |
|
406 |
Alert tenant disabled |
tenant disabled |
|
406 |
Alert already closed |
alert already closed |
|
500 |
Any other internal errors |
various |
various |
Searching assets
GET /api/v1/assets
Information about the software of assets from KSC is not stored in KUMA and is not shown in the response.
Access: General administrator, Tenant administrator, Tier 2 analyst, Tier 1 analyst, Junior analyst, Access to NCIRCC, Access to CII.
Query parameters
Name |
Data type |
Mandatory |
Description |
Value example |
page |
number |
No |
Page number. Starts with 1. The page size is 250 entries. If the parameter is not specified, the default value is 1. |
1 |
id |
string |
No |
Asset ID. If the parameter is specified several times, then a list is generated and the logical OR operator is applied. |
00000000-0000-0000-0000-000000000000 |
TenantID |
string |
No |
Asset tenant ID. If the parameter is specified several times, then a list is generated and the logical OR operator is applied. If the user does not have the required role in the specified tenant, then this tenant is ignored. |
00000000-0000-0000-0000-000000000000 |
name |
string |
No |
Asset name. Case-insensitive regular expression (PCRE). |
asset ^My asset$ |
fqdn |
string |
No |
Asset FQDN. Case-insensitive regular expression (PCRE). |
^com$ example.com |
ip |
string |
No |
Asset IP address. Case-insensitive regular expression (PCRE). |
10.10 ^192.168.1.2$ |
mac |
string |
No |
Asset MAC address. Case-insensitive regular expression (PCRE). |
^00:0a:95:9d:68:16$ |
Response
HTTP code: 200
Format: JSON
|
Possible errors
HTTP code |
Description |
message field value |
details field value |
400 |
Invalid value of the "page" parameter |
invalid query parameter value |
page |
500 |
Any other internal errors |
various |
various |
Importing assets
Details on identifying, creating, and updating assets
Assets are imported according to the asset data merging rules.
POST /api/v1/assets/import
Bulk creation or update of assets.
If the FQDN of an asset is specified, it acts as the unique ID of the asset within the tenant. If more than one FQDN is specified, the first FQDN from the specified array of FQDNs is used. If no FQDN is specified, the first IP address in the specified array of addresses is used to identify the asset. If the asset name is not specified, either FQDN or the first IP address is used as the name. Assets imported from KSC cannot be updated, therefore, FQDN conflicts may occur during the import process if a KSC asset with a the same FQDN already exists in the tenant. Such conflicts prevent the processing of the conflicting asset, but do not prevent the processing of other assets specified in the request body. Allows you to populate custom fields by uuid from the assetsCustomFields settings.
Access: General administrator, Tenant administrator, Tier 2 analyst, Tier 1 analyst.
Request body
Format: JSON
|
Request mandatory fields
Name |
Data type |
Mandatory |
Description |
Value example |
TenantID |
string |
Yes |
Tenant ID |
00000000-0000-0000-0000-000000000000 |
assets |
[]Asset |
Yes |
Array of imported assets |
|
Asset mandatory fields
Name |
Data type |
Mandatory |
Description |
Value example |
fqdn |
string |
If the ipAddresses array is not specified |
Asset FQDN. You can specify multiple values separated by commas. It is recommended that you specify the FQDN and not just the host name. Priority indicator for asset identification. |
my-asset-1.example.com my-asset-1 |
ipAddresses |
[]string |
If FQDN is not specified |
Array of IP addresses for the asset. IPv4 or IPv6. The first element of the array is used as a secondary indicator for asset identification. |
["192.168.1.1", "192.168.2.2"] ["2001:0db8:85a3:0000:0000:8a2e:0370:7334"] |
Response
HTTP code: 200
Format: JSON
|
Possible errors
HTTP code |
Description |
message field value |
details field value |
400 |
Tenant ID is not specified |
tenantID required |
|
400 |
Attempt to import assets into the Shared tenant |
import into shared tenant not allowed |
|
400 |
Not a single asset was specified in the request body |
at least one asset required |
|
400 |
None of the mandatory fields is specified |
one of fields required |
asset[<index>]: fqdn, ipAddresses |
400 |
Invalid FQDN |
invalid value |
asset[<index>].fqdn |
400 |
Invalid IP address |
invalid value |
asset[<index>].ipAddresses[<index>] |
400 |
IP address is repeated |
duplicated value |
asset[<index>].ipAddresses |
400 |
Invalid MAC address |
invalid value |
asset[<index>].macAddresses[<index>] |
400 |
MAC address is repeated |
duplicated value |
asset[<index>].macAddresses |
403 |
The user does not have the required role in the specified tenant |
access denied |
|
404 |
The specified tenant was not found |
tenant not found |
|
406 |
The specified tenant was disabled |
tenant disabled |
|
500 |
Any other internal errors |
various |
various |
Deleting assets
POST /api/v1/assets/delete
Access: General administrator, Tenant administrator, Tier 2 analyst, Tier 1 analyst.
Request body
Format: JSON
Name |
Data type |
Mandatory |
Description |
Value example |
TenantID |
string |
Yes |
Tenant ID |
00000000-0000-0000-0000-000000000000 |
ids |
[]string |
If neither the ipAddresses array nor the FQDNs are specified |
List of asset IDs |
["00000000-0000-0000-0000-000000000000"] |
fqdns |
[]string |
If neither the ipAddresses array nor the IDs are specified |
Array of asset FQDNs |
["my-asset-1.example.com", "my-asset-1"] |
ipAddresses |
[]string |
If neither the IDs nor FQDNs are specified |
Array of main IP addresses of the asset. |
["192.168.1.1", "2001:0db8:85a3:0000:0000:8a2e:0370:7334"] |
Response
HTTP code: 200
Format: JSON
|
Possible errors
HTTP code |
Description |
message field value |
details field value |
400 |
Tenant ID is not specified |
tenantID required |
|
400 |
Attempt to delete an asset from the Shared tenant |
delete from shared tenant not allowed |
|
400 |
None of the mandatory fields is specified |
one of fields required |
ids, fqdns, ipAddresses |
400 |
Invalid FQDN specified |
invalid value |
fqdns[<index>] |
400 |
Invalid IP address specified |
invalid value |
ipAddresses[<index>] |
403 |
The user does not have the required role in the specified tenant |
access denied |
|
404 |
The specified tenant was not found |
tenant not found |
|
406 |
The specified tenant was disabled |
tenant disabled |
|
500 |
Any other internal errors |
various |
various |
Searching events
POST /api/v1/events
Access: General administrator, Tenant administrator, Tier 2 analyst, Tier 1 analyst, Junior analyst, Access to NCIRCC, Access to CII.
Request body
Format: JSON
Request
Name |
Data type |
Mandatory |
Description |
Value example |
period |
Period |
Yes |
Search period |
|
sql |
string |
Yes |
SQL query |
SELECT * FROM events WHERE Type = 3 ORDER BY Timestamp DESC LIMIT 1000 SELECT sum(BytesOut) as TotalBytesSent, SourceAddress FROM events WHERE DeviceVendor = 'netflow' GROUP BY SourceAddress LIMIT 1000 SELECT count(Timestamp) as TotalEvents FROM events LIMIT 1 |
ClusterID |
string |
No, if the cluster is the only one |
Storage cluster ID. You can find it by requesting a list of services with kind = storage. The cluster ID will be in the resourceID field. |
00000000-0000-0000-0000-000000000000 |
rawTimestamps |
bool |
No |
Display timestamps in their current format—Milliseconds since EPOCH. False by default. |
true or false |
emptyFields |
bool |
No |
Display empty fields for normalized events. False by default. |
true or false |
Period
Name |
Data type |
Mandatory |
Description |
Value example |
from |
string |
Yes |
Lower bound of the period in RFC3339 format. Timestamp >= <from> |
2021-09-06T00:00:00Z (UTC) 2021-09-06T00:00:00.000Z (UTC, including milliseconds) 2021-09-06T00:00:00Z+00:00 (MSK) |
to |
string |
Yes |
Upper bound of the period in RFC3339 format. Timestamp <= <to> |
2021-09-06T00:00:00Z (UTC) 2021-09-06T00:00:00.000Z (UTC, including milliseconds) 2021-09-06T00:00:00Z+00:00 (MSK) |
Response
HTTP code: 200
Format: JSON
Result of executing the SQL query
Possible errors
HTTP code |
Description |
message field value |
details field value |
|---|---|---|---|
400 |
The lower bounds of the range is not specified |
period.from required |
|
400 |
The lower bounds of the range is in an unsupported format |
cannot parse period.from |
various |
400 |
The lower bounds of the range is equal to zero |
period.from cannot be 0 |
|
400 |
The upper bounds of the range is not specified |
period.to required |
|
400 |
The upper bounds of the range is in an unsupported format |
cannot parse period.to |
various |
400 |
The upper bounds of the range is equal to zero |
period.to cannot be 0 |
|
400 |
The lower bounds of the range is greater than the upper bounds |
period.from cannot be greater than period.to |
|
400 |
Invalid SQL query |
invalid sql |
various |
400 |
An invalid table appears in the SQL query |
the only valid table is `events` |
|
400 |
The SQL query lacks a LIMIT |
sql: LIMIT required |
|
400 |
The LIMIT in the SQL query exceeds the maximum (1000) |
sql: maximum LIMIT is 1000 |
|
404 |
Storage cluster not found |
cluster not found |
|
406 |
The clusterID parameter was not specified, and many clusters were registered in KUMA |
multiple clusters found, please provide clusterID |
|
500 |
No available cluster nodes |
no nodes available |
|
50x |
Any other internal errors |
event search failed |
various |
Viewing information about the cluster
GET /api/v1/events/clusters
Access: The main tenant clusters are accessible to all users.
Query parameters (URL Query)
Name |
Data type |
Mandatory |
Description |
Value example |
|---|---|---|---|---|
page |
number |
No |
Page number. Starts with 1. The page size is 250 entries. If the parameter is not specified, the default value is 1. |
1 |
id |
string |
No |
Cluster ID. If the parameter is specified several times, then a list is generated and the logical OR operator is applied |
00000000-0000-0000-0000-000000000000 |
TenantID |
string |
No |
Tenant ID. If the parameter is specified several times, then a list is generated and the logical OR operator is applied. If the user does not have the required role in the specified tenant, then this tenant is ignored. |
00000000-0000-0000-0000-000000000000 |
name |
string |
No |
Cluster name. Case-insensitive regular expression (PCRE). |
cluster |
Response
HTTP code: 200
Format: JSON
|
Possible errors
HTTP code |
Description |
message field value |
details field value |
|---|---|---|---|
400 |
Invalid value of the "page" parameter |
invalid query parameter value |
page |
500 |
Any other internal errors |
various |
various |
Resource search
GET /api/v1/resources
Access: General administrator, Tenant administrator, Tier 2 analyst, Tier 1 analyst, Access to shared resources.
Only the General administrator and the Tenant administrator have access to resources of the 'storage' type.
Query parameters (URL Query)
Name |
Data type |
Mandatory |
Description |
Value example |
page |
number |
No |
Page number. Starts with 1. The page size is 250 entries. If the parameter is not specified, the default value is 1. |
1 |
id |
string |
No |
Resource ID. If the parameter is specified several times, then a list is generated and the logical OR operator is applied. |
00000000-0000-0000-0000-000000000000 |
TenantID |
string |
No |
Resource tenant ID. If the parameter is specified several times, then a list is generated and the logical OR operator is applied. If the user does not have the required role in the specified tenant, then this tenant is ignored. |
00000000-0000-0000-0000-000000000000 |
name |
string |
No |
Resource name. Case-insensitive regular expression (PCRE). |
resource |
kind |
string |
No |
Resource type. If the parameter is specified several times, then a list is generated and the logical OR operator is applied |
collector, correlator, storage, activeList, aggregationRule, connector, correlationRule, dictionary, enrichmentRule, destination, filter, normalizer, responseRule, search, agent, proxy, secret, segmentationRule, emailTemplate, contextTable, eventRouter |
Response
HTTP code: 200
Format: JSON
|
Possible errors
HTTP code |
Description |
message field value |
details field value |
400 |
Invalid value of the "page" parameter |
invalid query parameter value |
page |
400 |
Invalid value of the "kind" parameter |
invalid kind |
<kind> |
500 |
Any other internal errors |
various |
various |
Loading resource file
POST /api/v1/resources/upload
Access: General administrator, Tenant administrator, Tier 2 analyst, Tier 1 analyst.
User rights are not checked at the time of upload, instead they are checked at the time of import, when a tenant is already selected. Therefore, if the user account is not trusted, in the KUMA web interface, go to the Settings → Users section, select the user account, and in the Using KUMA via API section, select API access rights. This opens the API access rights window; in that window, clear the POST /resources/toc and POST /resources/upload check boxes.
Request body
Encrypted contents of the resource file in binary format.
Response
HTTP code: 200
Format: JSON
File ID. It should be specified in the body of requests for viewing the contents of the file and for importing resources.
|
Possible errors
HTTP code |
Description |
message field value |
details field value |
400 |
The file size exceeds the maximum allowable (64 MB) |
maximum file size is 64 MB |
|
403 |
The user does not have the required roles in any of the tenants |
access denied |
|
500 |
Any other internal errors |
various |
various |
Viewing the contents of a resource file
POST /api/v1/resources/toc
Access: General administrator, Tenant administrator, Tier 2 analyst, Tier 1 analyst.
Request body
Format: JSON
Name |
Data type |
Mandatory |
Description |
Value example |
fileID |
string |
Yes |
The file ID obtained as a result of loading the resource file. |
00000000-0000-0000-0000-000000000000 |
password |
string |
Yes |
Resource file password. |
SomePassword!88 |
Response
HTTP code: 200
Format: JSON
File version, list of resources, categories, and folders.
The ID of the retrieved resources must be used when importing.
|
Importing resources
POST /api/v1/resources/import
Access: General administrator, Tenant administrator, Tier 2 analyst, Tier 1 analyst.
Request body
Name |
Data type |
Mandatory |
Description |
Value example |
|
fileID |
string |
Yes |
The file ID obtained as a result of loading the resource file. |
00000000-0000-0000-0000-000000000000 |
|
password |
string |
Yes |
Resource file password. |
SomePassword!88 |
|
TenantID |
string |
Yes |
ID of the target tenant |
00000000-0000-0000-0000-000000000000 |
|
actions |
map[string]uint8 |
Yes |
Mapping of the resource ID to the action that must be taken in relation to it. |
0—do not import (used when resolving conflicts) 1—import (should initially be assigned to each resource) 2—replace (used when resolving conflicts)
|
Response
HTTP code |
Body |
|
204 |
|
|
409 |
The imported resources conflict with the existing ones by ID. In this case, you need to repeat the import operation while specifying the following actions for these resources: 0—do not import 2—replace
|
Exporting resources
POST /api/v1/resources/export
Access: General administrator, Tenant administrator, Tier 2 analyst, Tier 1 analyst, Access to shared resources.
Request body
Format: JSON
Name |
Data type |
Mandatory |
Description |
Value example |
ids |
[]string |
Yes |
Resource IDs to be exported |
["00000000-0000-0000-0000-000000000000"] |
password |
string |
Yes |
Exported resource file password |
SomePassword!88 |
TenantID |
string |
Yes |
ID of the tenant that owns the exported resources |
00000000-0000-0000-0000-000000000000 |
Response
HTTP code: 200
Format: JSON
ID of the file with the exported resources. It should be used in a request to download the resource file.
|
Downloading the resource file
GET /api/v1/resources/download/<id>
Here "id" is the file ID obtained as a result of executing a resource export request.
Access: General administrator, Tenant administrator, Tier 2 analyst, Tier 1 analyst.
Response
HTTP code: 200
Encrypted contents of the resource file in binary format.
Possible errors
HTTP code |
Description |
message field value |
details field value |
400 |
File ID not specified |
route parameter required |
id |
400 |
The file ID is not a valid UUID |
id is not a valid UUID |
|
403 |
The user does not have the required roles in any of the tenants |
access denied |
|
404 |
File not found |
file not found |
|
406 |
The file is a directory |
not regular file |
|
500 |
Any other internal errors |
various |
various |
Search for services
GET /api/v1/services
Access: General administrator, Tenant administrator, Tier 2 analyst, Tier 1 analyst.
Query parameters (URL Query)
Name |
Data type |
Mandatory |
Description |
Value example |
page |
number |
No |
Page number. Starts with 1. The page size is 250 entries. If the parameter is not specified, the default value is 1. |
1 |
id |
string |
No |
Service ID. If the parameter is specified several times, then a list is generated and the logical OR operator is applied. |
00000000-0000-0000-0000-000000000000 |
TenantID |
string |
No |
Service tenant ID. If the parameter is specified several times, then a list is generated and the logical OR operator is applied. If the user does not have the required role in the specified tenant, then this tenant is ignored. |
00000000-0000-0000-0000-000000000000 |
name |
string |
No |
Service name. Case-insensitive regular expression (PCRE). |
service |
kind |
string |
No |
Service type. If the parameter is specified several times, then a list is generated and the logical OR operator is applied. |
collector, correlator, storage, agent |
fqdn |
string |
No |
Service FQDN. Case-insensitive regular expression (PCRE). |
hostname ^hostname.example.com$ |
paired |
bool |
No |
Display only those services that executed the first start. If the parameter is present in the URL query, then its value is assumed to be true. The values specified by the user are ignored. Example: /api/v1/services?paired |
|
Response
HTTP code: 200
Format: JSON
|
Possible errors
HTTP code |
Description |
message field value |
details field value |
400 |
Invalid value of the "page" parameter |
invalid query parameter value |
page |
400 |
Invalid value of the "kind" parameter |
invalid kind |
<kind> |
500 |
Any other internal errors |
various |
various |
Tenant search
GET /api/v1/tenants
Only tenants available to the user are displayed.
Access: General administrator, Administrator, Tier 2 analyst, Tier 1 analyst, Junior analyst, Interaction with NCIRCC, Access to CII, Access to shared resources.
Query parameters (URL Query)
Name |
Data type |
Mandatory |
Description |
Value example |
page |
number |
No |
Page number. Starts with 1. The page size is 250 entries. If the parameter is not specified, the default value is 1. |
1 |
id |
string |
No |
Tenant ID. If the parameter is specified several times, then a list is generated and the logical OR operator is applied. |
00000000-0000-0000-0000-000000000000 |
name |
string |
No |
Tenant name. Case-insensitive regular expression (PCRE). |
tenant |
main |
bool |
No |
Only display the main tenant. If the parameter is present in the URL query, then its value is assumed to be true. The values specified by the user are ignored. Example: /api/v1/tenants?main |
|
Response
HTTP code: 200
Format: JSON
|
Possible errors
HTTP code |
Description |
message field value |
details field value |
400 |
Invalid value of the "page" parameter |
invalid query parameter value |
page |
500 |
Any other internal errors |
various |
various |
View token bearer information
GET /api/v1/users/whoami
Response
HTTP code: 200
Format: JSON
|
Dictionary updating in services
POST /api/v1/dictionaries/update
You can update only dictionaries in dictionary resources of the table type.
Access: General administrator, Tenant administrator, Tier 2 analyst for all tenants except the Shared tenant; General administrator for the Shared tenant; Tier 1 analyst — only their own.
Query parameters (URL Query)
Name |
Data type |
Mandatory |
Description |
Value example |
dictionaryID |
string |
Yes |
ID of the dictionary that will be updated. |
00000000-0000-0000-0000-000000000000 |
The update affects all services where the specified dictionary is used. If an update in one of the services ends with an error, this does not interrupt updates in the other services.
Request body
Multipart field name |
Data type |
Mandatory |
Description |
Value example |
file |
CSV file |
Yes |
The request contains a CSV file. Data of the existing dictionary is being replaced with data from this file. The first line of the CSV file containing the column names must not be changed. |
key columns,column1,column2 key1,k1col1,k1col2 key2,k2col1,k2col2 |
Response
HTTP code: 200
Format: JSON
type Response struct { ServicesFailedToUpdate []UpdateError `json:"servicesFailedToUpdate"` } type UpdateError struct { ID string `json:"id"` Err error `json:"err"` } |
Returns only errors for services in which the dictionaries have not been updated.
Possible errors
HTTP code |
Description |
message field value |
details field value |
400 |
Invalid request body |
request body decode failed |
Error |
400 |
Null count of dictionary lines |
request body required |
|
400 |
Dictionary ID not specified |
invalid value |
dictionaryID |
400 |
Incorrect value of dictionary line |
invalid value |
rows or rows[i] |
400 |
Dictionary with the specified ID has an invalid type (not table) |
can only update table dictionary |
|
400 |
Attempt to change dictionary columns |
columns must not change with update |
|
403 |
No access to requested resource |
access denied |
|
404 |
Service not found |
service not found |
|
404 |
Dictionary not found |
dictionary not found |
Service ID |
500 |
Any other internal errors |
various |
various |
Dictionary retrieval
GET /api/v1/dictionaries
You can get only dictionaries in dictionary resources of the table type.
Access: General administrator, Tenant administrator, Tier 2 analyst, Tier 1 analyst.
Query parameters (URL Query)
Name |
Data type |
Mandatory |
Description |
Value example |
dictionaryID |
string |
Yes |
ID of the dictionary that will be received |
00000000-0000-0000-0000-000000000000 |
Response
HTTP code: 200
Format: text/plain; charset=utf-8
A CSV file is returned with the dictionary data in the response body.
Page top
Viewing custom fields of the assets
GET /api/v1/settings/id/:id
The user can view a list of custom fields made by the KUMA user in the application web interface.
A custom field is a bucket for entering text. If necessary, the default value and the mask can be used to validate the entered text in the following format: https://pkg.go.dev/regexp/syntax. All forward slash characters in the mask must be shielded.
Access: General administrator, Main tenant administrator; Tier 1 or Tier 2 analyst of the Main tenant (must have rights to the requested setting).
Query parameters
Name |
Data type |
Mandatory |
Description |
Value example |
id |
string |
Yes |
Configuration ID of the custom fields |
00000000-0000-0000-0000-000000000000 |
Response
HTTP code: 200
Format: JSON
|
Possible errors
HTTP code |
Description |
message field value |
details field value |
404 |
Parameters not found: invalid ID or parameters are missing |
Not found in database |
null |
500 |
Any other internal errors |
various |
various |
Creating a backup of the KUMA Core
GET /api/v1/system/backup
Access: General administrator.
The request has no parameters.
The tar.gz archive containing the backup copy of the KUMA Core is returned in response to the request. The backup copy is not saved on the host where the Core is installed. The certificates are included in the backup copy.
If the operation is successful, an audit event is generated with the following parameters:
DeviceAction = "Core backup created"SourceUserID = "<user-login>"
You can restore the KUMA Cores from a backup using the following API request: POST /api/v1/system/restore.
Restoring the KUMA Core from the backup
POST /api/v1/system/restore
Access: General administrator.
The request has no parameters.
The request body must contain an archive with the backup copy of the KUMA Core, obtained as a result of the following API request execution: GET /api/v1/system/backup.
After receiving the archive with the backup copy, KUMA performs the following actions:
- Extracts the archive with the backup copy of the KUMA Core to a temporary directory.
- Compares the current KUMA version with the backup KUMA version. Data may only be restored from a backup if it is restored to the KUMA of the same version as the backup one.
If the versions match, an audit event is generated with the following parameters:
DeviceAction = "Core restore scheduled"SourceUserID = "<name of the user who initiated KUMA restore from a backup copy>"
- If the versions match, data is restored from the backup copy of the KUMA Core.
- The temporary directory is deleted, and KUMA starts normally.
The
WARN: restored from backuprecord is added to the KUMA Core log.
Viewing the list of context tables in the correlator
GET /api/v1/contextTables
The target correlator must be running.
Access: General administrator, Tenant administrator, Tier 2 analyst, Tier 1 analyst.
Query parameters (URL Query)
Name |
Data type |
Mandatory |
Description |
Value example |
correlatorID |
string |
Yes |
Correlator service ID |
00000000-0000-0000-0000-000000000000 |
Response
HTTP code: 200
Format: JSON
type Response []ContextTableInfo
type ContextTableInfo struct {
ID string `json:"id"`
Name string `json:"name"`
Dir string `json:"dir"`
Records uint64 `json:"records"`
WALSize uint64 `json:"walSize"`
}
Possible errors
HTTP code |
Description |
message field value |
details field value |
|---|---|---|---|
400 |
Correlator service ID is not specified. |
query parameter required |
correlatorID |
403 |
The user does not have the required role in the correlator tenant. |
access denied |
- |
404 |
The service with the specified ID (correlatorID) was not found. |
service not found |
- |
406 |
The service with the specified ID (correlatorID) is not a correlator. |
service is not correlator |
- |
406 |
The correlator did not execute the first start. |
service not paired |
- |
406 |
The tenant of the correlator is disabled. |
tenant disabled |
- |
50x |
Failed to gain access to the correlator API. |
correlator API request failed |
various |
500 |
Failed to decode the body of the response received from the correlator. |
correlator response decode failed |
various |
500 |
Any other internal error. |
various |
various |
Importing records into a context table
POST /api/v1/contextTables/import
The target correlator must be running.
Access: General administrator, Tenant administrator, Tier 2 analyst, Tier 1 analyst (can import data into any correlator table of an accessible tenant, even if the context table was created in the Shared tenant).
Query parameters (URL Query)
Name |
Data type |
Mandatory |
Description |
Value example |
correlatorID |
string |
Yes |
Correlator service ID |
00000000-0000-0000-0000-000000000000 |
contextTableID |
string |
If contextTableName is not specified |
Context table ID |
00000000-0000-0000-0000-000000000000 |
contextTableName |
string |
If contextTableID is not specified |
Name of the context table |
Attackers |
format |
string |
Yes |
Format of imported entries |
CSV, TSV, internal |
clear |
bool |
No |
Clear the context table before importing. If the parameter is present in the URL query, its value is assumed to be true. The values specified by the user are ignored. |
/api/v1/contextTables/import?clear |
Request body
Format |
Contents |
CSV |
The first row is the header, which lists the comma-separated fields. The rest of the rows are the comma-separated values corresponding to the fields in the header. The number of fields in each row must be the same, and it must match the number of fields in the schema of the context table. List field values are separated by the "|" character. For example, the value of a list of integers might be 1|2|3. |
TSV |
The first row is the header, which lists the TAB-separated fields. The rest of the rows are the TAB-separated values corresponding to the fields in the header. The number of fields in each row must be the same, and it must match the number of fields in the schema of the context table. List field values are separated by the "|" character. |
internal |
Each line contains one individual JSON object. Data in the 'internal' format can be obtained by exporting the contents of the context table from the correlator in the KUMA web console. |
Response
HTTP code: 204
Possible errors
HTTP code |
Description |
message field value |
details field value |
|---|---|---|---|
400 |
Correlator service ID is not specified. |
query parameter required |
correlatorID |
400 |
Neither the contextTableID parameter nor the contextTableName parameter is specified |
one of query parameters required |
contextTableID, contextTableName |
400 |
The 'format' parameter is not specified |
query parameter required |
format |
400 |
The 'format' parameter is invalid |
invalid query parameter value |
format |
400 |
The request body has zero length |
request body required |
- |
400 |
Error parsing the request body, including the non-conformance of the field names and types of the record being imported with the schema of the context table. |
correlator API request failed |
various |
403 |
The user does not have the required role in the correlator tenant. |
access denied |
- |
404 |
The service with the specified ID (correlatorID) was not found. |
service not found |
- |
404 |
The context table was not found. |
context table not found |
- |
406 |
The service with the specified ID (correlatorID) is not a correlator. |
service is not correlator |
- |
406 |
The correlator did not execute the first start. |
service not paired |
- |
406 |
The tenant of the correlator is disabled. |
tenant disabled |
- |
406 |
More than one context table found by a search for contextTableName. |
more than one matching context tables found |
- |
50x |
Failed to gain access to the correlator API. |
correlator API request failed |
various |
500 |
Error preparing data for importing into the correlator service. |
context table process import request failed |
various |
500 |
Any other internal error. |
various |
various |
Exporting records from a context table
GET /api/v1/contextTables/export
The target correlator must be running.
Access: General administrator, Tenant administrator, Tier 2 analyst, Tier 1 analyst.
Query parameters (URL Query)
Name |
Data type |
Mandatory |
Description |
Value example |
correlatorID |
string |
Yes |
Correlator service ID |
00000000-0000-0000-0000-000000000000 |
contextTableID |
string |
If contextTableName is not specified |
Context table ID |
00000000-0000-0000-0000-000000000000 |
contextTableName |
string |
If contextTableID is not specified |
Name of the context table |
Attackers |
Response
HTTP code: 200
Format: application/octet-stream
Body: exported context table data, in the 'internal' format: each row contains one individual JSON object.
Possible errors
HTTP code |
Description |
message field value |
details field value |
|---|---|---|---|
400 |
Correlator service ID is not specified. |
query parameter required |
correlatorID |
400 |
Neither the contextTableID parameter nor the contextTableName parameter is specified |
one of query parameters required |
contextTableID, contextTableName |
403 |
The user does not have the required role in the correlator tenant. |
access denied |
- |
404 |
The service with the specified ID (correlatorID) was not found. |
service not found |
- |
404 |
The context table was not found. |
context table not found |
- |
406 |
The service with the specified ID (correlatorID) is not a correlator. |
service is not correlator |
- |
406 |
The correlator did not execute the first start. |
service not paired |
- |
406 |
The tenant of the correlator is disabled. |
tenant disabled |
- |
406 |
More than one context table found by a search for contextTableName. |
more than one matching context tables found |
- |
50x |
Failed to gain access to the correlator API. |
correlator API request failed |
various |
500 |
Any other internal error. |
various |
various |
Viewing a list of active lists on the correlator
GET /api/v2/activeLists
The target correlator must be running.
Access: General administrator, Tenant administrator, Tier 2 analyst, Tier 1 analyst.
Query parameters
Name |
Data type |
Mandatory |
Description |
Value example |
correlatorID |
string |
Yes |
Correlator service ID |
00000000-0000-0000-0000-000000000000 |
Response
HTTP code: 200
Format: JSON
|
Possible errors
HTTP code |
Description |
message field value |
details field value |
400 |
Correlator service ID is not specified |
query parameter required |
correlatorID |
403 |
The user does not have the required role in the correlator tenant |
access denied |
- |
404 |
The service with the specified identifier (correlatorID) was not found |
service not found |
- |
406 |
The service with the specified ID (correlatorID) is not a correlator |
service is not correlator |
- |
406 |
The correlator did not execute the first start |
service not paired |
- |
406 |
The correlator tenant is disabled |
tenant disabled |
- |
50x |
Failed to access the correlator API |
correlator API request failed |
various |
500 |
Failed to decode the response body received from the correlator |
correlator response decode failed |
various |
500 |
Any other internal errors |
various |
various |
Import entries to an active list
POST /api/v2/activeLists/import
The target correlator must be running.
Access: General administrator, Tenant administrator, Tier 2 analyst, Tier 1 analyst (can import data into any correlator list of an accessible tenant, even if the active list was created in the Shared tenant).
Query parameters (URL Query)
Name |
Data type |
Mandatory |
Description |
Value example |
correlatorID |
string |
Yes |
Correlator service ID |
00000000-0000-0000-0000-000000000000 |
activeListID |
string |
If activeListName is not specified |
Active list ID |
00000000-0000-0000-0000-000000000000 |
activeListName |
string |
If activeListID is not specified |
Active list name |
Attackers |
format |
string |
Yes |
Format of imported entries |
CSV, TSV, internal |
keyField |
string |
For the CSV and TSV formats only |
The name of the field in the header of the CSV or TSV file that will be used as the key field of the active list record. The values of this field must be unique |
ip |
clear |
bool |
No |
Clear the active list before importing. If the parameter is present in the URL query, then its value is assumed to be true. The values specified by the user are ignored. |
/api/v2/activeLists/import?clear |
Request body
Format |
Contents |
CSV |
The first line is the header, which lists the comma-separated fields. The rest of the lines are the values corresponding to the comma-separated fields in the header. The number of fields in each line must be the same. |
TSV |
The first line is the header, which lists the TAB-separated fields. The remaining lines are the values corresponding to the TAB-separated fields in the header. The number of fields in each line must be the same. |
internal |
Each line contains one individual JSON object. Data in the internal format can be received by exporting the contents of the active list from the correlator in the KUMA web console. |
Response
HTTP code: 204
Possible errors
HTTP code |
Description |
message field value |
details field value |
400 |
Correlator service ID is not specified |
query parameter required |
correlatorID |
400 |
Neither the activeListID parameter nor the activeListName parameter is specified |
one of query parameters required |
activeListID, activeListName |
400 |
The format parameter is not specified |
query parameter required |
format |
400 |
The format parameter is invalid |
invalid query parameter value |
format |
400 |
The keyField parameter is not specified |
query parameter required |
keyField |
400 |
The request body has a zero-length |
request body required |
- |
400 |
The CSV or TSV file does not contain the field specified in the keyField parameter |
correlator API request failed |
various |
400 |
Request body parsing error |
correlator API request failed |
various |
403 |
The user does not have the required role in the correlator tenant |
access denied |
- |
404 |
The service with the specified identifier (correlatorID) was not found |
service not found |
- |
404 |
No active list was found |
active list not found |
- |
406 |
The service with the specified ID (correlatorID) is not a correlator |
service is not correlator |
- |
406 |
The correlator did not execute the first start |
service not paired |
- |
406 |
The correlator tenant is disabled |
tenant disabled |
- |
406 |
A search was performed using the name of the active list (activeListName), and more than one active list was found |
more than one matching active lists found |
- |
50x |
Failed to access the correlator API |
correlator API request failed |
various |
500 |
Failed to decode the response body received from the correlator |
correlator response decode failed |
various |
500 |
Any other internal errors |
various |
various |
Searching alerts
GET /api/v2/alerts
Access: General administrator, Tenant administrator, Tier 2 analyst, Tier 1 analyst, Junior analyst, Interaction with NCIRCC, Access to CII.
Query parameters
Name |
Data type |
Mandatory |
Description |
Value example |
page |
number |
No |
Page number. Starts with 1. The page size is 250 entries. If the parameter is not specified, the default value is 1. |
1 |
id |
string |
No |
Alert ID. If the parameter is specified several times, then a list is generated and the logical OR operator is applied. |
00000000-0000-0000-0000-000000000000 |
TenantID |
string |
No |
Alert tenant ID. If the parameter is specified several times, then a list is generated and the logical OR operator is applied. If the user does not have the required role in the specified tenant, then this tenant is ignored. |
00000000-0000-0000-0000-000000000000 |
name |
string |
No |
Alert name. Case-insensitive regular expression (PCRE). |
alert |
timestampField |
string |
No |
The name of the alert field that is used to perform sorting (DESC) and search by period (from – to). lastSeen by default. |
lastSeen, firstSeen |
from |
string |
No |
Lower bound of the period in RFC3339 format. <timestampField> >= <from> |
2021-09-06T00:00:00Z (UTC) 2021-09-06T00:00:00.000Z (UTC, including milliseconds) 2021-09-06T00:00:00Z+00:00 (MSK) |
to |
string |
No |
Upper bound of the period in RFC3339 format. <timestampField> <= <to> |
2021-09-06T00:00:00Z (UTC) 2021-09-06T00:00:00.000Z (UTC, including milliseconds) 2021-09-06T00:00:00Z+00:00 (MSK) |
status |
string |
No |
Alert status. If the parameter is specified several times, then a list is generated and the logical OR operator is applied. |
new, assigned, escalated, closed |
withEvents |
bool |
No |
Include normalized KUMA events associated with found alerts in the response. If the parameter is present in the URL query, then its value is assumed to be true. The values specified by the user are ignored. Example: /api/v1/alerts?withEvents |
- |
withAffected |
bool |
No |
Include information about the assets and accounts associated with the found alerts in the report. If the parameter is present in the URL query, then its value is assumed to be true. The values specified by the user are ignored. Example: /api/v1/alerts?withAffected |
- |
Response
HTTP code: 200
Format: JSON
|
Possible errors
HTTP code |
Description |
message field value |
details field value |
400 |
Invalid value of the "page" parameter |
invalid query parameter value |
page |
400 |
Invalid value of the "status" parameter |
invalid status |
<status> |
400 |
Invalid value of the "timestampField" parameter |
invalid timestamp field |
- |
400 |
Invalid value of the "from" parameter |
cannot parse from |
various |
400 |
Invalid value of the "to" parameter |
cannot parse to |
various |
400 |
The value of the "from" parameter is greater than the value of the "to" parameter |
from cannot be greater than to |
- |
500 |
Any other internal errors |
various |
various |
Closing alerts
POST /api/v2/alerts/close
The target correlator must be running.
Access: General administrator, Tenant administrator, Tier 2 analyst, Tier 1 analyst, Junior analyst, Interaction with NCIRCC, Access to CII.
Request body
Format: JSON
Name |
Data type |
Mandatory |
Description |
Value example |
id |
string |
Yes |
Alert ID |
00000000-0000-0000-0000-000000000000 |
reason |
string |
Yes |
Reason for closing the alert |
responded, incorrect data, incorrect correlation rule |
Response
HTTP code: 204
Possible errors
HTTP code |
Description |
message field value |
details field value |
400 |
Alert ID is not specified |
id required |
- |
400 |
The reason for closing the alert is not specified |
reason required |
- |
400 |
Invalid value of the "reason" parameter |
invalid reason |
- |
403 |
The user does not have the required role in the alert tenant |
access denied |
- |
404 |
Alert not found |
alert not found |
- |
406 |
Alert tenant disabled |
tenant disabled |
- |
406 |
Alert already closed |
alert already closed |
- |
500 |
Any other internal errors |
various |
various |
Searching assets
GET /api/v2/assets
Information about the software of assets from KSC is not stored in KUMA and is not shown in the response.
Access: General administrator, Tenant administrator, Tier 2 analyst, Tier 1 analyst, Junior analyst, Access to NCIRCC, Access to CII.
The "Access to shared resources" role is issued only for the Shared tenant; this tenant cannot have any assets, but it has categories. For this role, nothing is returned in the response.
Query parameters
Name |
Data type |
Mandatory |
Description |
Value example |
page |
number |
No |
Page number. Starts with 1. The page size is 250 entries. If the parameter is not specified, the default value is 1. |
1 |
id |
string |
No |
Asset ID. If the parameter is specified several times, then a list is generated and the logical OR operator is applied. |
00000000-0000-0000-0000-000000000000 |
TenantID |
string |
No |
Asset tenant ID. If the parameter is specified several times, then a list is generated and the logical OR operator is applied. If the user does not have the required role in the specified tenant, then this tenant is ignored. |
00000000-0000-0000-0000-000000000000 |
name |
string |
No |
Asset name. Case-insensitive regular expression (PCRE). |
asset ^My asset$ |
fqdn |
string |
No |
Asset FQDN. Case-insensitive regular expression (PCRE). |
example.com |
ip |
string |
No |
Asset IP address. Case-insensitive regular expression (PCRE). |
10.10 ^192.168.1.2$ |
mac |
string |
No |
Asset MAC address. Case-insensitive regular expression (PCRE). |
^00:0a:95:9d:68:16$ |
Response
HTTP code: 200
Format: JSON
|
Possible errors
HTTP code |
Description |
message field value |
details field value |
400 |
Invalid value of the "page" parameter |
invalid query parameter value |
page |
500 |
Any other internal errors |
various |
various |
Importing assets
Details on identifying, creating, and updating assets
Assets are imported according to the asset data merging rules.
POST /api/v2/assets/import
Bulk creation or update of assets.
If the FQDN of an asset is specified, it acts as the unique ID of the asset within the tenant. If more than one FQDN is specified, the first FQDN from the specified array of FQDNs is used. If no FQDN is specified, the first IP address in the specified array of addresses is used to identify the asset. If the asset name is not specified, either FQDN or the first IP address is used as the name. Assets imported from KSC cannot be updated, therefore, FQDN conflicts may occur during the import process if a KSC asset with a the same FQDN already exists in the tenant. Such conflicts prevent the processing of the conflicting asset, but do not prevent the processing of other assets specified in the request body. Allows you to populate custom fields by uuid from the assetsCustomFields settings.
Access: General administrator, Tenant administrator, Tier 2 analyst, Tier 1 analyst.
Request body
Format: JSON
|
Request mandatory fields
Name |
Data type |
Mandatory |
Description |
Value example |
TenantID |
string |
Yes |
Tenant ID |
00000000-0000-0000-0000-000000000000 |
assets |
[]Asset |
Yes |
Array of imported assets |
|
Asset mandatory fields
Name |
Data type |
Mandatory |
Description |
Value example |
fqdn |
string |
If the ipAddresses array is not specified |
Asset FQDN. You can specify multiple values separated by commas. It is recommended that you specify the FQDN and not just the host name. Priority indicator for asset identification. |
[my-asset-1.example.com] [my-asset-1] |
ipAddresses |
[]string |
If FQDN is not specified |
Array of IP addresses for the asset. IPv4 or IPv6. The first element of the array is used as a secondary indicator for asset identification. |
["192.168.1.1", "192.168.2.2"] ["2001:0db8:85a3:0000:0000:8a2e:0370:7334"] |
Response
HTTP code: 200
Format: JSON
|
Possible errors
HTTP code |
Description |
message field value |
details field value |
400 |
Tenant ID is not specified |
tenantID required |
- |
400 |
Attempt to import assets into the Shared tenant |
import into shared tenant not allowed |
- |
400 |
Not a single asset was specified in the request body |
at least one asset required |
- |
400 |
None of the mandatory fields is specified |
one of fields required |
asset[<index>]: fqdn, ipAddresses |
400 |
Invalid FQDN |
invalid value |
asset[<index>].fqdn |
400 |
Invalid IP address |
invalid value |
asset[<index>].ipAddresses[<index>] |
400 |
IP address is repeated |
duplicated value |
asset[<index>].ipAddresses |
400 |
Invalid MAC address |
invalid value |
asset[<index>].macAddresses[<index>] |
400 |
MAC address is repeated |
duplicated value |
asset[<index>].macAddresses |
403 |
The user does not have the required role in the specified tenant |
access denied |
- |
404 |
The specified tenant was not found |
tenant not found |
- |
406 |
The specified tenant was disabled |
tenant disabled |
- |
500 |
Any other internal errors |
various |
various |
Deleting assets
POST /api/v2/assets/delete
Access: General administrator, Tenant administrator, Tier 2 analyst, Tier 1 analyst.
Request body
Format: JSON
Name |
Data type |
Mandatory |
Description |
Value example |
TenantID |
string |
Yes |
Tenant ID |
00000000-0000-0000-0000-000000000000 |
ids |
[]string |
If neither the ipAddresses array nor the FQDNs are specified |
List of asset IDs |
["00000000-0000-0000-0000-000000000000"] |
fqdns |
[]string |
If neither the ipAddresses array nor the IDs are specified |
Array of asset FQDNs |
["my-asset-1.example.com", "my-asset-1"] |
ipAddresses |
[]string |
If neither the IDs nor FQDNs are specified |
Array of main IP addresses of the asset. |
["192.168.1.1", "2001:0db8:85a3:0000:0000:8a2e:0370:7334"] |
Response
HTTP code: 200
Format: JSON
|
Possible errors
HTTP code |
Description |
message field value |
details field value |
400 |
Tenant ID is not specified |
tenantID required |
- |
400 |
Attempt to delete an asset from the Shared tenant |
delete from shared tenant not allowed |
- |
400 |
None of the mandatory fields is specified |
one of fields required |
ids, fqdns, ipAddresses |
400 |
Invalid FQDN specified |
invalid value |
fqdns[<index>] |
400 |
Invalid IP address specified |
invalid value |
ipAddresses[<index>] |
403 |
The user does not have the required role in the specified tenant |
access denied |
- |
404 |
The specified tenant was not found |
tenant not found |
- |
406 |
The specified tenant was disabled |
tenant disabled |
- |
500 |
Any other internal errors |
various |
various |
Searching events
POST /api/v2/events
Only search queries or aggregation queries (SELECT) are allowed.
Access: General administrator, Tenant administrator, Tier 2 analyst, Tier 1 analyst, Junior analyst, Access to NCIRCC, Access to CII.
Request body
Format: JSON
Request
Name |
Data type |
Mandatory |
Description |
Value example |
period |
Period |
Yes |
Search period |
|
sql |
string |
Yes |
SQL query |
SELECT * FROM events WHERE Type = 3 ORDER BY Timestamp DESC LIMIT 1000 SELECT sum(BytesOut) as TotalBytesSent, SourceAddress FROM events WHERE DeviceVendor = 'netflow' GROUP BY SourceAddress LIMIT 1000 SELECT count(Timestamp) as TotalEvents FROM events LIMIT 1 |
ClusterID |
string |
No, if the cluster is the only one |
Storage cluster ID. You can find it by requesting a list of services with kind = storage. The cluster ID will be in the resourceID field. |
00000000-0000-0000-0000-000000000000 |
rawTimestamps |
bool |
No |
Display timestamps in their current format—Milliseconds since EPOCH. False by default. |
true or false |
emptyFields |
bool |
No |
Display empty fields for normalized events. False by default. |
true or false |
Period
Name |
Data type |
Mandatory |
Description |
Value example |
from |
string |
Yes |
Lower bound of the period in RFC3339 format. Timestamp >= <from> |
2021-09-06T00:00:00Z (UTC) 2021-09-06T00:00:00.000Z (UTC, including milliseconds) 2021-09-06T00:00:00Z+00:00 (MSK) |
to |
string |
Yes |
Upper bound of the period in RFC3339 format. Timestamp <= <to> |
2021-09-06T00:00:00Z (UTC) 2021-09-06T00:00:00.000Z (UTC, including milliseconds) 2021-09-06T00:00:00Z+00:00 (MSK) |
Response
HTTP code: 200
Format: JSON
Result of executing the SQL query
Possible errors
HTTP code |
Description |
message field value |
details field value |
|---|---|---|---|
400 |
The lower bounds of the range is not specified |
period.from required |
- |
400 |
The lower bounds of the range is in an unsupported format |
cannot parse period.from |
various |
400 |
The lower bounds of the range is equal to zero |
period.from cannot be 0 |
- |
400 |
The upper bounds of the range is not specified |
period.to required |
- |
400 |
The upper bounds of the range is in an unsupported format |
cannot parse period.to |
various |
400 |
The upper bounds of the range is equal to zero |
period.to cannot be 0 |
- |
400 |
The lower bounds of the range is greater than the upper bounds |
period.from cannot be greater than period.to |
- |
400 |
Invalid SQL query |
invalid sql |
various |
400 |
An invalid table appears in the SQL query |
the only valid table is `events` |
- |
400 |
The SQL query lacks a LIMIT |
sql: LIMIT required |
- |
400 |
The LIMIT in the SQL query exceeds the maximum (1000) |
sql: maximum LIMIT is 1000 |
- |
404 |
Storage cluster not found |
cluster not found |
- |
406 |
The clusterID parameter was not specified, and many clusters were registered in KUMA |
multiple clusters found, please provide clusterID |
- |
500 |
No available cluster nodes |
no nodes available |
- |
50x |
Any other internal errors |
event search failed |
various |
Viewing information about the cluster
GET /api/v2/events/clusters
Access: The main tenant clusters are accessible to all users.
Query parameters (URL Query)
Name |
Data type |
Mandatory |
Description |
Value example |
|---|---|---|---|---|
page |
number |
No |
Page number. Starts with 1. The page size is 250 entries. If the parameter is not specified, the default value is 1. |
1 |
id |
string |
No |
Cluster ID. If the parameter is specified several times, then a list is generated and the logical OR operator is applied |
00000000-0000-0000-0000-000000000000 |
TenantID |
string |
No |
Tenant ID. If the parameter is specified several times, then a list is generated and the logical OR operator is applied. If the user does not have the required role in the specified tenant, then this tenant is ignored. |
00000000-0000-0000-0000-000000000000 |
name |
string |
No |
Cluster name. Case-insensitive regular expression (PCRE). |
cluster |
Response
HTTP code: 200
Format: JSON
|
Possible errors
HTTP code |
Description |
message field value |
details field value |
|---|---|---|---|
400 |
Invalid value of the "page" parameter |
invalid query parameter value |
page |
500 |
Any other internal errors |
various |
various |
Resource search
GET /api/v2/resources
Access: General administrator, Tenant administrator, Tier 2 analyst, Tier 1 analyst, Access to shared resources.
Only the General administrator and the Tenant administrator have access to resources of the 'storage' type.
Query parameters (URL Query)
Name |
Data type |
Mandatory |
Description |
Value example |
page |
number |
No |
Page number. Starts with 1. The page size is 250 entries. If the parameter is not specified, the default value is 1. |
1 |
id |
string |
No |
Resource ID. If the parameter is specified several times, then a list is generated and the logical OR operator is applied. |
00000000-0000-0000-0000-000000000000 |
TenantID |
string |
No |
Resource tenant ID. If the parameter is specified several times, then a list is generated and the logical OR operator is applied. If the user does not have the required role in the specified tenant, then this tenant is ignored. |
00000000-0000-0000-0000-000000000000 |
name |
string |
No |
Resource name. Case-insensitive regular expression (PCRE). |
resource |
kind |
string |
No |
Resource type. If the parameter is specified several times, then a list is generated and the logical OR operator is applied |
collector, correlator, storage, activeList, aggregationRule, connector, correlationRule, dictionary, enrichmentRule, destination, filter, normalizer, responseRule, search, agent, proxy, secret, segmentationRule, emailTemplate, contextTable, eventRouter |
Response
HTTP code: 200
Format: JSON
|
Possible errors
HTTP code |
Description |
message field value |
details field value |
400 |
Invalid value of the "page" parameter |
invalid query parameter value |
page |
400 |
Invalid value of the "kind" parameter |
invalid kind |
<kind> |
500 |
Any other internal errors |
various |
various |
Loading resource file
POST /api/v2/resources/upload
Access: General administrator, Tenant administrator, Tier 2 analyst, Tier 1 analyst.
Request body
Encrypted contents of the resource file in binary format.
Response
HTTP code: 200
Format: JSON
File ID. It should be specified in the body of requests for viewing the contents of the file and for importing resources.
|
Possible errors
HTTP code |
Description |
message field value |
details field value |
400 |
The file size exceeds the maximum allowable (64 MB) |
maximum file size is 64 MB |
- |
403 |
The user does not have the required roles in any of the tenants |
access denied |
- |
500 |
Any other internal errors |
various |
various |
Viewing the contents of a resource file
POST /api/v2/resources/toc
Access: General administrator, Tenant administrator, Tier 2 analyst, Tier 1 analyst.
Request body
Format: JSON
Name |
Data type |
Mandatory |
Description |
Value example |
fileID |
string |
Yes |
The file ID obtained as a result of loading the resource file. |
00000000-0000-0000-0000-000000000000 |
password |
string |
Yes |
Resource file password. |
SomePassword!88 |
Response
HTTP code: 200
Format: JSON
File version, list of resources, categories, and folders.
The ID of the retrieved resources must be used when importing.
|
Importing resources
POST /api/v2/resources/import
Access: General administrator, Tenant administrator, Tier 2 analyst, Tier 1 analyst.
Request body
Name |
Data type |
Mandatory |
Description |
Value example |
|
fileID |
string |
Yes |
The file ID obtained as a result of loading the resource file. |
00000000-0000-0000-0000-000000000000 |
|
password |
string |
Yes |
Resource file password. |
SomePassword!88 |
|
TenantID |
string |
Yes |
ID of the target tenant |
00000000-0000-0000-0000-000000000000 |
|
actions |
map[string]uint8 |
Yes |
Mapping of the resource ID to the action that must be taken in relation to it. |
0—do not import (used when resolving conflicts) 1—import (should initially be assigned to each resource) 2—replace (used when resolving conflicts)
|
Response
HTTP code |
Body |
|
204 |
|
|
409 |
The imported resources conflict with the existing ones by ID. In this case, you need to repeat the import operation while specifying the following actions for these resources: 0—do not import 2—replace
|
Exporting resources
POST /api/v2/resources/export
Access: General administrator, Tenant administrator, Tier 2 analyst, Tier 1 analyst, Access to shared resources.
Request body
Format: JSON
Name |
Data type |
Mandatory |
Description |
Value example |
ids |
[]string |
Yes |
Resource IDs to be exported |
["00000000-0000-0000-0000-000000000000"] |
password |
string |
Yes |
Exported resource file password |
SomePassword!88 |
TenantID |
string |
Yes |
ID of the tenant that owns the exported resources |
00000000-0000-0000-0000-000000000000 |
Response
HTTP code: 200
Format: JSON
ID of the file with the exported resources. It should be used in a request to download the resource file.
|
Downloading the resource file
GET /api/v2/resources/download/<id>
Here "id" is the file ID obtained as a result of executing a resource export request.
Access: General administrator, Tenant administrator, Tier 2 analyst, Tier 1 analyst.
Response
HTTP code: 200
Encrypted contents of the resource file in binary format.
Possible errors
HTTP code |
Description |
message field value |
details field value |
400 |
File ID not specified |
route parameter required |
id |
400 |
The file ID is not a valid UUID |
id is not a valid UUID |
- |
403 |
The user does not have the required roles in any of the tenants |
access denied |
- |
404 |
File not found |
file not found |
- |
406 |
The file is a directory |
not regular file |
- |
500 |
Any other internal errors |
various |
various |
Search for services
GET /api/v2/services
Access: General administrator, Tenant administrator, Tier 2 analyst, Tier 1 analyst.
Query parameters (URL Query)
Name |
Data type |
Mandatory |
Description |
Value example |
page |
number |
No |
Page number. Starts with 1. The page size is 250 entries. If the parameter is not specified, the default value is 1. |
1 |
id |
string |
No |
Service ID. If the parameter is specified several times, then a list is generated and the logical OR operator is applied. |
00000000-0000-0000-0000-000000000000 |
TenantID |
string |
No |
Service tenant ID. If the parameter is specified several times, then a list is generated and the logical OR operator is applied. If the user does not have the required role in the specified tenant, then this tenant is ignored. |
00000000-0000-0000-0000-000000000000 |
name |
string |
No |
Service name. Case-insensitive regular expression (PCRE). |
service |
kind |
string |
No |
Service type. If the parameter is specified several times, then a list is generated and the logical OR operator is applied. |
collector, correlator, storage, agent |
fqdn |
string |
No |
Service FQDN. Case-insensitive regular expression (PCRE). |
hostname ^hostname.example.com$ |
paired |
bool |
No |
Display only those services that executed the first start. If the parameter is present in the URL query, then its value is assumed to be true. The values specified by the user are ignored. Example: /api/v1/services?paired |
|
Response
HTTP code: 200
Format: JSON
|
Possible errors
HTTP code |
Description |
message field value |
details field value |
400 |
Invalid value of the "page" parameter |
invalid query parameter value |
page |
400 |
Invalid value of the "kind" parameter |
invalid kind |
<kind> |
500 |
Any other internal errors |
various |
various |
Tenant search
GET /api/v2/tenants
Only tenants available to the user are displayed.
Access: General administrator, Administrator, Tier 2 analyst, Tier 1 analyst, Junior analyst, Interaction with NCIRCC, Access to CII, Access to shared resources.
Query parameters (URL Query)
Name |
Data type |
Mandatory |
Description |
Value example |
page |
number |
No |
Page number. Starts with 1. The page size is 250 entries. If the parameter is not specified, the default value is 1. |
1 |
id |
string |
No |
Tenant ID. If the parameter is specified several times, then a list is generated and the logical OR operator is applied. |
00000000-0000-0000-0000-000000000000 |
name |
string |
No |
Tenant name. Case-insensitive regular expression (PCRE). |
tenant |
main |
bool |
No |
Only display the main tenant. If the parameter is present in the URL query, then its value is assumed to be true. The values specified by the user are ignored. Example: /api/v1/tenants?main |
|
Response
HTTP code: 200
Format: JSON
|
Possible errors
HTTP code |
Description |
message field value |
details field value |
400 |
Invalid value of the "page" parameter |
invalid query parameter value |
page |
500 |
Any other internal errors |
various |
various |
View token bearer information
GET /api/v2/users/whoami
Response
HTTP code: 200
Format: JSON
|
Dictionary updating in services
POST /api/v2/dictionaries/update
You can update only dictionaries in dictionary resources of the table type.
Access: General administrator, Tenant administrator, Tier 2 analyst, Tier 1 analyst.
Query parameters (URL Query)
Name |
Data type |
Mandatory |
Description |
Value example |
dictionaryID |
string |
Yes |
ID of the dictionary that will be updated. |
00000000-0000-0000-0000-000000000000 |
The update affects all services where the specified dictionary is used. If an update in one of the services ends with an error, this does not interrupt updates in the other services.
Request body
Multipart field name |
Data type |
Mandatory |
Description |
Value example |
file |
CSV file |
Yes |
The request contains a CSV file. Data of the existing dictionary is being replaced with data from this file. The first line of the CSV file containing the column names must not be changed. |
key columns,column1,column2 key1,k1col1,k1col2 key2,k2col1,k2col2 |
Response
HTTP code: 200
Format: JSON
type Response struct { ServicesFailedToUpdate []UpdateError `json:"servicesFailedToUpdate"` } type UpdateError struct { ID string `json:"id"` Err error `json:"err"` } |
Returns only errors for services in which the dictionaries have not been updated.
Possible errors
HTTP code |
Description |
message field value |
details field value |
400 |
Invalid request body |
request body decode failed |
Error |
400 |
Null count of dictionary lines |
request body required |
- |
400 |
Dictionary ID not specified |
invalid value |
dictionaryID |
400 |
Incorrect value of dictionary line |
invalid value |
rows or rows[i] |
400 |
Dictionary with the specified ID has an invalid type (not table) |
can only update table dictionary |
- |
400 |
Attempt to change dictionary columns |
columns must not change with update |
- |
403 |
No access to requested resource |
access denied |
- |
404 |
Service not found |
service not found |
- |
404 |
Dictionary not found |
dictionary not found |
Service ID |
500 |
Any other internal errors |
various |
various |
Dictionary retrieval
GET /api/v2/dictionaries
You can get only dictionaries in dictionary resources of the table type.
Access: General administrator, Tenant administrator, Tier 2 analyst, Tier 1 analyst.
Query parameters (URL Query)
Name |
Data type |
Mandatory |
Description |
Value example |
dictionaryID |
string |
Yes |
ID of the dictionary that will be received |
00000000-0000-0000-0000-000000000000 |
Response
HTTP code: 200
Format: text/plain; charset=utf-8
A CSV file is returned with the dictionary data in the response body.
Page top
Viewing custom fields of the assets
GET /api/v2/settings/id/:id
The user can view a list of custom fields made by the KUMA user in the application web interface.
A custom field is a bucket for entering text. If necessary, the default value and the mask can be used to validate the entered text in the following format: https://pkg.go.dev/regexp/syntax. All forward slash characters in the mask must be shielded.
Access: General administrator, Main tenant administrator.
Query parameters
Name |
Data type |
Mandatory |
Description |
Value example |
id |
string |
Yes |
Configuration ID of the custom fields |
00000000-0000-0000-0000-000000000000 |
Response
HTTP code: 200
Format: JSON
|
Possible errors
HTTP code |
Description |
message field value |
details field value |
404 |
Parameters not found: invalid ID or parameters are missing |
Not found in database |
null |
500 |
Any other internal errors |
various |
various |
Creating a backup of the KUMA Core
GET /api/v2/system/backup
Access: General administrator.
The request has no parameters.
The tar.gz archive containing the backup copy of the KUMA Core is returned in response to the request. The backup copy is not saved on the host where the Core is installed. The certificates are included in the backup copy.
If the operation is successful, an audit event is generated with the following parameters:
DeviceAction = "Core backup created"SourceUserID = "<user-login>"
You can restore the KUMA Cores from a backup using the following API request: POST /api/v2/system/restore.
Restoring the KUMA Core from the backup
POST /api/v2/system/restore
Access: General administrator.
The request has no parameters.
The request body must contain an archive with the backup copy of the KUMA Core, obtained as a result of the following API request execution: GET /api/v2/system/backup.
After receiving the archive with the backup copy, KUMA performs the following actions:
- Extracts the archive with the backup copy of the KUMA Core to a temporary directory.
- Compares the current KUMA version with the backup KUMA version. Data may only be restored from a backup if it is restored to the KUMA of the same version as the backup one.
If the versions match, an audit event is generated with the following parameters:
DeviceAction = "Core restore scheduled"SourceUserID = "<name of the user who initiated KUMA restore from a backup copy>"
- If the versions match, data is restored from the backup copy of the KUMA Core.
- The temporary directory is deleted, and KUMA starts normally.
The
WARN: restored from backuprecord is added to the KUMA Core log.
Viewing the list of context tables in the correlator
GET /api/v2/contextTables
The target correlator must be running.
Access: General administrator, Tenant administrator, Tier 2 analyst, Tier 1 analyst.
Query parameters (URL Query)
Name |
Data type |
Mandatory |
Description |
Value example |
correlatorID |
string |
Yes |
Correlator service ID |
00000000-0000-0000-0000-000000000000 |
Response
HTTP code: 200
Format: JSON
type Response []ContextTableInfo
type ContextTableInfo struct {
ID string `json:"id"`
Name string `json:"name"`
Dir string `json:"dir"`
Records uint64 `json:"records"`
WALSize uint64 `json:"walSize"`
}
Possible errors
HTTP code |
Description |
message field value |
details field value |
|---|---|---|---|
400 |
Correlator service ID is not specified. |
query parameter required |
correlatorID |
403 |
The user does not have the required role in the correlator tenant. |
access denied |
- |
404 |
The service with the specified ID (correlatorID) was not found. |
service not found |
- |
406 |
The service with the specified ID (correlatorID) is not a correlator. |
service is not correlator |
- |
406 |
The correlator did not execute the first start. |
service not paired |
- |
406 |
The tenant of the correlator is disabled. |
tenant disabled |
- |
50x |
Failed to gain access to the correlator API. |
correlator API request failed |
various |
500 |
Failed to decode the body of the response received from the correlator. |
correlator response decode failed |
various |
500 |
Any other internal error. |
various |
various |
Importing records into a context table
POST /api/v2/contextTables/import
The target correlator must be running.
Access: General administrator, Tenant administrator, Tier 2 analyst, Tier 1 analyst (can import data into any correlator table of an accessible tenant, even if the context table was created in the Shared tenant).
Query parameters (URL Query)
Name |
Data type |
Mandatory |
Description |
Value example |
correlatorID |
string |
Yes |
Correlator service ID |
00000000-0000-0000-0000-000000000000 |
contextTableID |
string |
If contextTableName is not specified |
Context table ID |
00000000-0000-0000-0000-000000000000 |
contextTableName |
string |
If contextTableID is not specified |
Name of the context table |
Attackers |
format |
string |
Yes |
Format of imported entries |
CSV, TSV, internal |
clear |
bool |
No |
Clear the context table before importing. If the parameter is present in the URL query, its value is assumed to be true. The values specified by the user are ignored. |
/api/v2/contextTables/import?clear |
Request body
Format |
Contents |
CSV |
The first row is the header, which lists the comma-separated fields. The rest of the rows are the comma-separated values corresponding to the fields in the header. The number of fields in each row must be the same, and it must match the number of fields in the schema of the context table. List field values are separated by the "|" character. For example, the value of a list of integers might be 1|2|3. |
TSV |
The first row is the header, which lists the TAB-separated fields. The rest of the rows are the TAB-separated values corresponding to the fields in the header. The number of fields in each row must be the same, and it must match the number of fields in the schema of the context table. List field values are separated by the "|" character. |
internal |
Each line contains one individual JSON object. Data in the 'internal' format can be obtained by exporting the contents of the context table from the correlator in the KUMA web console. |
Response
HTTP code: 204
Possible errors
HTTP code |
Description |
message field value |
details field value |
|---|---|---|---|
400 |
Correlator service ID is not specified. |
query parameter required |
correlatorID |
400 |
Neither the contextTableID parameter nor the contextTableName parameter is specified |
one of query parameters required |
contextTableID, contextTableName |
400 |
The 'format' parameter is not specified |
query parameter required |
format |
400 |
The 'format' parameter is invalid |
invalid query parameter value |
format |
400 |
The request body has zero length |
request body required |
- |
400 |
Error parsing the request body, including the non-conformance of the field names and types of the record being imported with the schema of the context table. |
correlator API request failed |
various |
403 |
The user does not have the required role in the correlator tenant. |
access denied |
- |
404 |
The service with the specified ID (correlatorID) was not found. |
service not found |
- |
404 |
The context table was not found. |
context table not found |
- |
406 |
The service with the specified ID (correlatorID) is not a correlator. |
service is not correlator |
- |
406 |
The correlator did not execute the first start. |
service not paired |
- |
406 |
The tenant of the correlator is disabled. |
tenant disabled |
- |
406 |
More than one context table found by a search for contextTableName. |
more than one matching context tables found |
- |
50x |
Failed to gain access to the correlator API. |
correlator API request failed |
various |
500 |
Error preparing data for importing into the correlator service. |
context table process import request failed |
various |
500 |
Any other internal error. |
various |
various |
Exporting records from a context table
GET /api/v2/contextTables/export
The target correlator must be running.
Access: General administrator, Tenant administrator, Tier 2 analyst, Tier 1 analyst.
Query parameters (URL Query)
Name |
Data type |
Mandatory |
Description |
Value example |
correlatorID |
string |
Yes |
Correlator service ID |
00000000-0000-0000-0000-000000000000 |
contextTableID |
string |
If contextTableName is not specified |
Context table ID |
00000000-0000-0000-0000-000000000000 |
contextTableName |
string |
If contextTableID is not specified |
Name of the context table |
Attackers |
Response
HTTP code: 200
Format: application/octet-stream
Body: exported context table data, in the 'internal' format: each row contains one individual JSON object.
Possible errors
HTTP code |
Description |
message field value |
details field value |
|---|---|---|---|
400 |
Correlator service ID is not specified. |
query parameter required |
correlatorID |
400 |
Neither the contextTableID parameter nor the contextTableName parameter is specified |
one of query parameters required |
contextTableID, contextTableName |
403 |
The user does not have the required role in the correlator tenant. |
access denied |
- |
404 |
The service with the specified ID (correlatorID) was not found. |
service not found |
- |
404 |
The context table was not found. |
context table not found |
- |
406 |
The service with the specified ID (correlatorID) is not a correlator. |
service is not correlator |
- |
406 |
The correlator did not execute the first start. |
service not paired |
- |
406 |
The tenant of the correlator is disabled. |
tenant disabled |
- |
406 |
More than one context table found by a search for contextTableName. |
more than one matching context tables found |
- |
50x |
Failed to gain access to the correlator API. |
correlator API request failed |
various |
500 |
Any other internal error. |
various |
various |
Appendices
This section provides information that complements the main document text with reference information.
Commands for components manual starting and installing
This section contains the parameters of KUMA's executable file /opt/kaspersky/kuma/kuma that can be used to manually start or install KUMA services. This may be useful for when you need to see output in the server operating system console.
Commands parameters
Commands |
Description |
|
Start KUMA administration tools. |
|
Install, start, or remove a collector service. |
|
Install, start, or uninstall a Core service. |
|
Install, start, or remove a correlator service. |
|
Install, start, or remove an agent service. |
|
Get information about available commands and parameters. |
|
Get information about license. |
|
Start or install a Storage. |
|
Get information about version of the application. |
Flags:
-h, --h are used to get help about any kuma command. For example, kuma <component> --help.
Examples:
kuma versionis used to get version of the KUMA installer.kuma core -his used to get help aboutcorecommand of KUMA installer.kuma collector --core <address of the server where the collector should obtain its settings> --id <ID of the installed service> --api.port <port>is used to start collector service installation.
Integrity check of KUMA files
You can check the integrity of KUMA components in the following ways:
- Manually, by running the script below
- On a schedule or automatically at application startup, with results recorded in the system log
Manual integrity check
The integrity of KUMA components is checked using a set of scripts based on the integrity_checker tool and located in the/opt/kaspersky/kuma/integrity/bin directory. An integrity check uses manifest xml files in the/opt/kaspersky/kuma/integrity/manifest/* directory, protected by a Kaspersky cryptographic signature.
Running the integrity check tool requires a user account with permissions at least matching those of the KUMA account.
The integrity check tool processes each KUMA component individually, and it must be run on servers that has the appropriate components installed. An integrity check also checks the xml file that was used.
To check the integrity of component files:
- Run the following command to navigate to the directory that contains the set of scripts:
cd /opt/kaspersky/kuma/integrity/bin - Then run one of the following commands that matches the KUMA component you want to check:
./check_all.shfor KUMA Core and Storage components../check_core.shfor KUMA Core components../check_collector.shfor KUMA collector components../check_collector.shfor KUMA correlator components../check_storage.shfor storage components../check_event_router.shfor event router components../check_kuma_exe.sh <full path to kuma.exe omitting file name> forKUMA Agent for Windows. The standard location of the agent executable file on the Windows device is: C:\Program Files\Kaspersky Lab\KUMA\.
The integrity of the component files is checked.
The result of checking each component is displayed in the following format:
- The Summary section describes the number of scanned objects along with the scan status: integrity not confirmed / object skipped / integrity confirmed:
- Manifests – the number of manifest files processed.
- Files – the number of KUMA files processed.
- Directories – not used when KUMA integrity checking is performed.
- Registries – not used when KUMA integrity checking is performed.
- Registry values – not used when KUMA integrity checking is performed.
- Component integrity check result:
- SUCCEEDED – integrity confirmed.
- FAILED – integrity violated.
On a schedule or automatically at application startup
KUMA is a distributed, multi-component solution, and the location of its components on hosts is not known before the installation stage, therefore the configuration of the automatic integrity check of the components cannot be provided with the distribution kit and must be configured at the deployment stage.
We recommend checking the integrity of KUMA components when starting the application and on a schedule. We recommend scheduling an integrity check once a day. You can do this using scripts included in the distribution kit:
- manual_integrity_check.sh
The script checks the integrity of all components or selected components. You can configure the scheduled integrity check with third-party applications and utilities, such as the cron utility. You can also run this script to manually check the integrity of components.
- systemd_integrity_check.sh
Use this script to self-test the integrity of application components at startup. To add automatic integrity checking, run this script on each host where KUMA components are installed. The script should be run once. The integrity of the component is checked every time the KUMA service is started or restarted.
If, after deployment, you add new KUMA services (for example, a new collector), run the systemd_integrity_check.sh script on the hosts with the new services. Otherwise, the integrity of the new components will not be checked at startup.
If the check cannot verify the integrity of the component, the component does not run. KUMA will keep trying to start the service after checking its integrity. The results of the check are recorded in the system audit log. In this situation, either stop the service or eliminate the cause of the integrity violation.
Prerequisites
Before running the scripts:
- Move the script files to the /opt/kaspersky/kuma/integrity/bin/ directory.
- Grant the necessary permissions to run scripts to the 'kuma' user. To do so, run the following commands:
chown kuma:kuma ./systemd_integrity_check.shchmod +x ./systemd_integrity_check.shchown kuma:kuma ./manual_integrity_check.shchmod +x ./manual_integrity_check.sh
Running scripts
manual_integrity_check.sh
To check the integrity of the components, run the script on the host where the KUMA components are installed:
/opt/kaspersky/kuma/integrity/bin# ./manual_integrity_check.sh --core --collector --eventRouter --correlator --storage
This script checks the integrity of components which you specify in command line options. If you do not specify any components, the script checks all components.
systemd_integrity_check.sh
To add an automatic integrity check of application components at startup or on restart of the KUMA service, run the following command:
/opt/kaspersky/kuma/integrity/bin# ./systemd_integrity_check.sh
Both scripts log the results of component integrity checks in the system audit log. To view the log, use the dmesg command:
sudo dmesg
Normalized event data model
This section presents the KUMA normalized event data model. All events that are processed by KUMA Correlator to detect alerts must be compliant to this model. The maximum size of an event that can be processed by the KUMA collector is 4 MB.
Events that are not compliant to this data model must be converted to this format (or normalized) using Collectors.
Normalized event data model
Field name |
Data type |
Field size |
Description |
|
The name of a field reflects its purpose. The fields can be modified.
|
||||
ApplicationProtocol |
String |
31 characters |
Name of the application layer protocol. For example, HTTPS, SSH, Telnet. |
|
BytesIn |
Number |
From -9223372036854775808 to 9223372036854775807 |
Number of bytes received. |
|
BytesOut |
Number |
From -9223372036854775808 to 9223372036854775807 |
Number of bytes sent. |
|
DestinationAddress |
String |
45 characters |
IPv4 or IPv6 address of the asset that the action will be performed on. For example, 0.0.0.0 or xxxx:xxxx:xxxx:xxxx:xxxx:xxxx:xxxx:xxxx |
|
DestinationCity |
String |
1,023 characters |
City corresponding to the IP address from the DestinationAddress field. |
|
DestinationCountry |
String |
1023 characters |
Country corresponding to the IP address from the DestinationAddress field. |
|
DestinationDnsDomain |
String |
255 characters |
The DNS portion of the fully qualified domain name of the destination. |
|
DestinationHostName |
String |
1023 characters |
Host name of the destination. FQDN of the destination, if available. |
|
DestinationLatitude |
Floating point number |
+/- 1.7E-308 to 1.7E+308 |
Longitude corresponding to the IP address from the DestinationAddress field. |
|
DestinationLongitude |
Floating point number |
+/- 1.7E-308 to 1.7E+308 |
Latitude corresponding to the IP address from the DestinationAddress field. |
|
DestinationMacAddress |
String |
17 characters |
MAC address of the destination. For example, aa:bb:cc:dd:ee:00 |
|
DestinationNtDomain |
String |
255 characters |
Windows Domain Name of the destination. |
|
DestinationPort |
Number |
From -9223372036854775808 to 9223372036854775807 |
Port number of the destination. |
|
DestinationProcessID |
Number |
From -9223372036854775808 to 9223372036854775807 |
System process ID registered on the destination. |
|
DestinationProcessName |
String |
1023 characters |
Name of the system process registered on the destination. For example, sshd, telnet. |
|
DestinationRegion |
String |
1023 characters |
Region corresponding to the IP address from the DestinationAddress field. |
|
DestinationServiceName |
String |
1023 characters |
Name of the service on the destination side. For example, sshd. |
|
DestinationTranslatedAddress |
String |
45 characters |
Translated IPv4 or IPv6 address of the destination. For example, 0.0.0.0 or xxxx:xxxx:xxxx:xxxx:xxxx:xxxx:xxxx:xxxx |
|
DestinationTranslatedPort |
Number |
From -9223372036854775808 to 9223372036854775807 |
Port number at the destination after translation. |
|
DestinationUserID |
String |
1023 characters |
User ID of the destination. |
|
DestinationUserName |
String |
1023 characters |
User name of the destination. |
|
DestinationUserPrivileges |
String |
1023 characters |
Names of roles that identify user privileges at the destination. For example, User, Guest, Administrator, etc. |
|
DeviceAction |
String |
63 characters |
Action that was taken by the event source. For example, blocked, detected. |
|
DeviceAddress |
String |
45 characters |
IPv4 or IPv6 address of the device from which the event was received. For example, 0.0.0.0 or xxxx:xxxx:xxxx:xxxx:xxxx:xxxx:xxxx:xxxx |
|
DeviceCity |
String |
1023 characters |
City corresponding to the IP address from the DeviceAddress field. |
|
DeviceCountry |
String |
1023 characters |
Country corresponding to the IP address from the DeviceAddress field. |
|
DeviceDnsDomain |
String |
255 characters |
DNS part of the fully qualified domain name of the device from which the event was received. |
|
DeviceEventClassID |
String |
1023 characters |
Event type ID assigned by the event source. |
|
DeviceExternalID |
String |
255 characters |
ID of the device or product assigned by the event source. |
|
DeviceFacility |
String |
1023 characters |
Value of the facility parameter set by the event source. |
|
DeviceHostName |
String |
100 characters |
Name of the device from which the event was received. FQDN of the device, if available. |
|
DeviceInboundinterface |
String |
128 characters |
Name of the incoming connection interface. |
|
DeviceLatitude |
Floating point number |
+/- 1.7E-308 to 1.7E+308 |
Longitude corresponding to the IP address from the DeviceAddress field. |
|
DeviceLongitude |
Floating point number |
+/- 1.7E-308 to 1.7E+308 |
Latitude corresponding to the IP address from the DeviceAddress field |
|
DeviceMacAddress |
String |
17 characters |
MAC address of the asset from which the event was received. For example, aa:bb:cc:dd:ee:00 |
|
DeviceNtDomain |
String |
255 characters |
Windows Domain Name of the device. |
|
DeviceOutboundinterface |
String |
128 characters |
Name of the outgoing connection interface. |
|
DevicePayloadID |
String |
128 characters |
The payload's unique ID that is associated with the raw event. |
|
DeviceProcessID |
Number |
From -9223372036854775808 to 9223372036854775807 |
ID of the system process on the device that generated the event. |
|
DeviceProcessName |
String |
1023 characters |
Name of the process. |
|
DeviceProduct |
String |
63 characters |
Name of the product that generated the event. The DeviceVendor, DeviceProduct, and DeviceVersion all uniquely identify the log source. |
|
DeviceReceiptTime |
Number |
From -9223372036854775808 to 9223372036854775807 |
Time when the device received the event. |
|
DeviceRegion |
String |
1023 characters |
Region corresponding to the IP address from the DeviceAddress field. |
|
DeviceTimeZone |
String |
255 characters |
Time zone of the device on which the event was generated. |
|
DeviceTranslatedAddress |
String |
45 characters |
Re-translated IPv4 or IPv6 address of the device from which the event was received. For example, 0.0.0.0 or xxxx:xxxx:xxxx:xxxx:xxxx:xxxx:xxxx:xxxx |
|
DeviceVendor |
String |
63 characters |
Vendor name of the event source. The DeviceVendor, DeviceProduct, and DeviceVersion all uniquely identify the log source. |
|
DeviceVersion |
String |
31 characters |
Product version of the event source. The DeviceVendor, DeviceProduct, and DeviceVersion all uniquely identify the log source. |
|
EndTime |
Number |
From -9223372036854775808 to 9223372036854775807 |
Date and time (timestamp) when the event ended. |
|
EventOutcome |
String |
63 characters |
Result of the operation. For example, success, failure. |
|
ExternalID |
String |
40 characters |
Field in which the ID can be saved. |
|
FileCreateTime |
Number |
From -9223372036854775808 to 9223372036854775807 |
File creation time. |
|
FileHash |
String |
255 characters |
Hash of the file. Example: CA737F1014A48F4C0B6DD43CB177B0AFD9E5169367544C494011E3317DBF9A509CB1E5DC1E85A941BBEE3D7F2AFBC9B1 |
|
FileID |
String |
1023 characters |
ID of the file. |
|
FileModificationTime |
Number |
From -9223372036854775808 to 9223372036854775807 |
Time when the file was last modified. |
|
FileName |
String |
1023 characters |
Filename without specifying the file path. |
|
FilePath |
String |
1023 characters |
File path, including the file name. |
|
FilePermission |
String |
1023 characters |
List of file permissions. |
|
FileSize |
Number |
From -9223372036854775808 to 9223372036854775807 |
File size. |
|
FileType |
String |
1023 characters |
File type. |
|
Message |
String |
1023 characters |
Brief description of the event. |
|
Name |
String |
512 characters |
Name of the event. |
|
OldFileCreateTime |
Number |
From -9223372036854775808 to 9223372036854775807 |
Time when the OLD file was created from the event. The time is specified in UTC0. In the KUMA web interface, the value is displayed based in the timezone of the user's browser. |
|
OldFileHash |
String |
255 characters |
Hash of the OLD file. Example: CA737F1014A48F4C0B6DD43CB177B0AFD9E5169367544C494011E3317DBF9A509CB1E5DC1E85A941BBEE3D7F2AFBC9B1 |
|
OldFileID |
String |
1023 characters |
ID of the OLD file. |
|
OldFileModificationTime |
Number |
From -9223372036854775808 to 9223372036854775807 |
Time when the OLD file was last modified. |
|
OldFileName |
String |
1023 characters |
Name of the OLD file (without the file path). |
|
OldFilePath |
String |
1023 characters |
Path to the OLD file, including the file name. |
|
OldFilePermission |
String |
1023 characters |
List of permissions of the OLD file. |
|
OldFileSize |
Number |
From -9223372036854775808 to 9223372036854775807 |
Size of the OLD file. |
|
OldFileType |
String |
1023 characters |
Type of the OLD file. |
|
Reason |
String |
1023 characters |
Information about the reason for the event. |
|
RequestClientApplication |
String |
1023 characters |
Value of the "user-agent" parameter of the http request. |
|
RequestContext |
String |
2,048 characters |
Description of the http request context. |
|
RequestCookies |
String |
1023 characters |
Cookies associated with the http request. |
|
RequestMethod |
String |
1023 characters |
Method used when making the http request. |
|
RequestUrl |
String |
1023 characters |
Requested URL. |
|
Severity |
String |
1023 characters |
Priority. This can be the Severity field or the Level field of the raw event. |
|
SourceAddress |
String |
45 characters |
IPv4 or IPv6 address of the source. Example format: 0.0.0.0 or xxxx:xxxx:xxxx:xxxx:xxxx:xxxx:xxxx:xxxx |
|
SourceCity |
String |
1023 characters |
City corresponding to the IP address from the SourceAddress field. |
|
SourceCountry |
String |
1023 characters |
Country corresponding to the IP address from the SourceAddress field. |
|
SourceDnsDomain |
String |
255 characters |
The DNS portion of the fully qualified domain name of the source. |
|
SourceHostName |
String |
1023 characters |
Windows Domain Name of the event source device. |
|
SourceLatitude |
Floating point number |
+/- 1.7E-308 to 1.7E+308 |
Longitude corresponding to the IP address from the SourceAddress field. |
|
SourceLongitude |
Floating point number |
+/- 1.7E-308 to 1.7E+308 |
Latitude corresponding to the IP address from the SourceAddress field. |
|
SourceMacAddress |
String |
17 characters |
MAC address of the source. Format example: aa:bb:cc:dd:ee:00 |
|
SourceNtDomain |
String |
255 characters |
Windows Domain Name of the source. |
|
SourcePort |
Number |
From -9223372036854775808 to 9223372036854775807 |
Source port number. |
|
SourceProcessID |
Number |
From -9223372036854775808 to 9223372036854775807 |
System process ID. |
|
SourceProcessName |
String |
1023 characters |
Name of the system process at the source. For example, sshd, telnet, etc. |
|
SourceRegion |
String |
1023 characters |
Region corresponding to the IP address from the SourceAddress field. |
|
SourceServiceName |
String |
1023 characters |
Name of the service on the source side. For example, sshd. |
|
SourceTranslatedAddress |
String |
45 characters |
Translated IPv4 or IPv6 address of the source. Example format: 0.0.0.0 or xxxx:xxxx:xxxx:xxxx:xxxx:xxxx:xxxx:xxxx |
|
SourceTranslatedPort |
Number |
From -9223372036854775808 to 9223372036854775807 |
Port number of the source after translation. |
|
SourceUserID |
String |
1023 characters |
User ID of the source. |
|
SourceUserName |
String |
1023 characters |
User name of the source. |
|
SourceUserPrivileges |
String |
1023 characters |
Names of roles that identify user privileges of the source. For example, User, Guest, Administrator, etc. |
|
StartTime |
Number |
From -9223372036854775808 to 9223372036854775807 |
Date and time (timestamp) when the activity associated with the event began. |
|
Tactic |
String |
128 characters |
Name of the tactic from the MITRE ATT&CK matrix. |
|
Technique |
String |
128 characters |
Name of the technique from the MITRE ATT&CK matrix. |
|
TransportProtocol |
String |
31 characters |
Name of the Transport layer protocol of the OSI model (TCP, UDP, etc). |
|
Type |
Number |
From -9223372036854775808 to 9223372036854775807 |
Event type: 1 - basic, 2 - aggregated, 3 - correlation, 4 - audit, 5 - monitoring. |
|
Fields the purpose of which can be defined by the user. The fields can be modified. |
||||
DeviceCustomDate1 |
Number, timestamp |
From -9223372036854775808 to 9223372036854775807 |
Field for mapping a date and time value (timestamp). The time is specified in UTC0. In the KUMA web interface, the value is displayed based in the timezone of the user's browser. |
|
DeviceCustomDate1Label |
String |
1023 characters |
Field for describing the purpose of the DeviceCustomDate1 field. |
|
DeviceCustomDate2 |
Number, timestamp |
From -9223372036854775808 to 9223372036854775807 |
Field for mapping a date and time value (timestamp). The time is specified in UTC0. In the KUMA web interface, the value is displayed based in the timezone of the user's browser. |
|
DeviceCustomDate2Label |
String |
1023 characters |
Field for describing the purpose of the DeviceCustomDate2 field. |
|
DeviceCustomFloatingPoint1 |
Floating point number |
+/- 1.7E-308 to 1.7E+308 |
Field for mapping floating point numbers. |
|
DeviceCustomFloatingPoint1Label |
String |
1023 characters |
Field for describing the purpose of the DeviceCustomFloatingPoint1 field. |
|
DeviceCustomFloatingPoint2 |
Floating point number |
+/- 1.7E-308 to 1.7E+308 |
Field for mapping floating point numbers. |
|
DeviceCustomFloatingPoint2Label |
String |
1023 characters |
Field for describing the purpose of the DeviceCustomFloatingPoint2 field. |
|
DeviceCustomFloatingPoint3 |
Floating point number |
+/- 1.7E-308 to 1.7E+308 |
Field for mapping floating point numbers. |
|
DeviceCustomFloatingPoint3Label |
String |
1023 characters |
Field for describing the purpose of the DeviceCustomFloatingPoint3 field. |
|
DeviceCustomFloatingPoint4 |
Floating point number |
+/- 1.7E-308 to 1.7E+308 |
Field for mapping floating point numbers. |
|
DeviceCustomFloatingPoint4Label |
String |
1023 characters |
Field for describing the purpose of the DeviceCustomFloatingPoint4 field. |
|
DeviceCustomIPv6Address1 |
String |
45 characters |
Field for mapping an IPv6 address value. Format example: y:y:y:y:y:y:y:y |
|
DeviceCustomIPv6Address1Label |
String |
1023 characters |
Field for describing the purpose of the DeviceCustomIPv6Address1 field. |
|
DeviceCustomIPv6Address2 |
String |
45 characters |
Field for mapping an IPv6 address value. Format example: y:y:y:y:y:y:y:y |
|
DeviceCustomIPv6Address2Label |
String |
1023 characters |
Field for describing the purpose of the DeviceCustomIPv6Address2 field. |
|
DeviceCustomIPv6Address3 |
String |
45 characters |
Field for mapping an IPv6 address value. Format example: y:y:y:y:y:y:y:y |
|
DeviceCustomIPv6Address3Label |
String |
1023 characters |
Field for describing the purpose of the DeviceCustomIPv6Address3 field. |
|
DeviceCustomIPv6Address4 |
String |
45 characters |
Field for mapping an IPv6 address value. For example, y:y:y:y:y:y:y:y |
|
DeviceCustomIPv6Address4Label |
String |
1023 characters |
Field for describing the purpose of the DeviceCustomIPv6Address4 field. |
|
DeviceCustomNumber1 |
Number |
From -9223372036854775808 to 9223372036854775807 |
Field for mapping an integer value. |
|
DeviceCustomNumber1Label |
String |
1023 characters |
Field for describing the purpose of the DeviceCustomNumber1 field. |
|
DeviceCustomNumber2 |
Number |
From -9223372036854775808 to 9223372036854775807 |
Field for mapping an integer value. |
|
DeviceCustomNumber2Label |
String |
1023 characters |
Field for describing the purpose of the DeviceCustomNumber2 field. |
|
DeviceCustomNumber3 |
Number |
From -9223372036854775808 to 9223372036854775807 |
Field for mapping an integer value. |
|
DeviceCustomNumber3Label |
String |
1023 characters |
Field for describing the purpose of the DeviceCustomNumber3 field. |
|
DeviceCustomString1 |
String |
4,000 characters |
Field for mapping a string value. |
|
DeviceCustomString1Label |
String |
1,023 characters |
Field for describing the purpose of the DeviceCustomString1 field. |
|
DeviceCustomString2 |
String |
4,000 characters |
Field for mapping a string value. |
|
DeviceCustomString2Label |
String |
1023 characters |
Field for describing the purpose of the DeviceCustomString2 field. |
|
DeviceCustomString3 |
String |
4,000 characters |
Field for mapping a string value. |
|
DeviceCustomString3Label |
String |
1023 characters |
Field for describing the purpose of the DeviceCustomString3 field. |
|
DeviceCustomString4 |
String |
4,000 characters |
Field for mapping a string value. |
|
DeviceCustomString4Label |
String |
1023 characters |
Field for describing the purpose of the DeviceCustomString4 field. |
|
DeviceCustomString5 |
String |
4,000 characters |
Field for mapping a string value. |
|
DeviceCustomString5Label |
String |
1023 characters |
Field for describing the purpose of the DeviceCustomString5 field. |
|
DeviceCustomString6 |
String |
4,000 characters |
Field for mapping a string value. |
|
DeviceCustomString6Label |
String |
1023 characters |
Field for describing the purpose of the DeviceCustomString6 field. |
|
DeviceDirection |
Number |
From -9223372036854775808 to 9223372036854775807 |
Field for describing the direction of connection for an event. "0" - incoming connection, "1" - outgoing connection. |
|
DeviceEventCategory |
String |
1023 characters |
Event category assigned by the device that sent the event to SIEM. |
|
FlexDate1 |
Number, timestamp |
From -9223372036854775808 to 9223372036854775807 |
Field for mapping a date and time value (timestamp). The time is specified in UTC0. In the KUMA web interface, the value is displayed based in the timezone of the user's browser. |
|
FlexDate1Label |
String |
128 characters |
Field for describing the purpose of the FlexDate1Label field. |
|
FlexNumber1 |
Number |
From -9223372036854775808 to 9223372036854775807 |
Field for mapping an integer value. |
|
FlexNumber1Label |
String |
128 characters |
Field for describing the purpose of the FlexNumber1Label field. |
|
FlexNumber2 |
Number |
From -9223372036854775808 to 9223372036854775807 |
Field for mapping an integer value. |
|
FlexNumber2Label |
String |
128 characters |
Field for describing the purpose of the FlexNumber2Label field. |
|
FlexString1 |
String |
1023 characters |
Field for mapping a string value. |
|
FlexString1Label |
String |
128 characters |
Field for describing the purpose of the FlexString1Label field. |
|
FlexString2 |
String |
1023 characters |
Field for mapping a string value. |
|
FlexString2Label |
String |
128 characters |
Field for describing the purpose of the FlexString2Label field. |
|
Service fields. Cannot be edited. |
||||
AffectedAssets |
Nested [Affected] structure |
- |
Nested structure from which you can query alert-related assets and user accounts, and find out the number of times they appear in alert events. |
|
AggregationRuleID |
String |
- |
ID of the aggregation rule. |
|
AggregationRuleName |
String |
- |
Name of the aggregation rule that processed the event. |
|
BaseEventCount |
Number |
- |
For an aggregated base event, this is the number of base events that were processed by the aggregation rule. For a correlation event, this is the number of base events that were processed by the correlation rule that generated the correlation event. |
|
BaseEvents |
Nested [Event] list |
- |
Nested structure containing a list of base events. This field can be filled in for correlation events. |
|
Code |
String |
- |
In a base event, this is the code of a process, function or operation return from the source. |
|
CorrelationRuleID |
String |
- |
ID of the correlation rule. |
|
CorrelationRuleName |
String |
- |
Name of the correlation rule that triggered the creation of the correlation event. Filled only for correlation events. |
|
DestinationAccountID |
String |
- |
This field stores the user ID. |
|
DestinationAssetID |
String |
- |
This field stores the asset ID of the destination. |
|
DeviceAssetID |
String |
- |
This field stores the ID of the asset that sent the event to SIEM. |
|
Extra |
Nested [string:string] dictionary |
- |
During normalization of a raw event, this field can be used to place those fields that have not been mapped to KUMA event fields. This field can be filled in only for base events. The maximum size of the field is 4 MB. |
|
GroupedBy |
String |
- |
List of names of the fields that were used for grouping in the correlation rule. It is filled in only for the correlation event. |
|
ID |
String |
- |
Unique event ID of UUID type. For a base event that is generated on the collector, the ID is generated by the collector. The correlator generates the ID of a correlation event. The ID never changes its value. |
|
Raw |
String |
- |
Non-normalized text of the original raw event. Maximum field size is 16,384 bytes. |
|
ReplayID |
String |
- |
ID of the retroscan that generated the event. |
|
ServiceID |
String |
- |
ID of the service instance: correlator, collector, storage. |
|
ServiceName |
String |
- |
Name of the microservice instance that the KUMA administrator assigns when creating the microservice. |
|
SourceAccountID |
String |
- |
This field stores the user ID. |
|
SourceAssetID |
String |
- |
This field stores the asset ID of the event source. |
|
SpaceID |
String |
- |
ID of the space. |
|
TenantID |
String |
- |
This field stores the ID of the tenant. |
|
TI |
Nested [string:string] dictionary |
- |
Field that contains categories in a dictionary format received from an external Threat Intelligence source based on indicators from an event. |
|
TICategories |
map[string] |
- |
This field contains categories received from an external TI provider based on the indicators contained in the event. |
|
Timestamp |
Number |
- |
Timestamp of the base event created in the collector. Creation time of the correlation event created by the collector. The time is specified in UTC0. In the KUMA web interface, the value is displayed based in the timezone of the user's browser. |
|
Nested Affected structure
Field |
Data type |
Description |
|
Nested |
List and number of assets associated with the alert. |
|
Nested |
List and number of user accounts associated with the alert. |
Nested AffectedRecord structure
Field |
Data type |
Description |
|
String |
ID of the asset or user account. |
|
Number |
The number of times an asset or user account appears in alert-related events. |
Fields generated by KUMA
KUMA generates the following fields that cannot be modified: BranchID, BranchName, DestinationAccountName, DestinationAssetName, DeviceAssetName, SourceAccountName, SourceAssetName, TenantID (the field displays the name of the tenant, an enriched value, while the tenant ID is used for searching the database).
Page top
Configuring the data model of a normalized event from KATA EDR
To investigate the information, the IDs of the event and the KATA/EDR process must go to certain fields of the normalized event. To build a process tree for events coming from KATA/EDR, you must configure the copying of data from the fields of the raw events to the fields of the normalized event in KUMA normalizers as follows:
- For any KATA/EDR events, you must configure normalization with copying of the following fields:
- The
EventTypefield of the KATA/EDR event must be copied to theDeviceEventCategoryfield of the normalized KUMA event. - The
HostNamefield of the KATA/EDR event must be copied to theDeviceHostNamefield of the normalized KUMA event.
- The
- For any event where
DeviceProduct = 'KATA', normalization must be configured in accordance with the table below.Normalization of event fields from KATA/EDR
KATA/EDR event field
Normalized event field
IOATag
DeviceCustomIPv6Address2
IOATag
IOAImportance
DeviceCustomIPv6Address1
IOAImportance
FilePath
FilePath
FileName
FileName
Md5
FileHash
FileSize
FileSize
- For events listed in the table below, additional normalization with field copying must be configured in accordance with the table.
Additional normalization with copying of event fields from KATA/EDR
Event
Raw event field
Normalized event field
Process
UniqueParentPid
FlexString1
UniquePid
FlexString2
HostName
DeviceHostName
FileName
FileName
AppLock
UniquePid
FlexString2
HostName
DeviceHostName
FileName
FileName
BlockedDocument
UniquePid
FlexString2
HostName
DeviceHostName
FileName
FileName
Module
UniquePid
FlexString2
HostName
DeviceHostName
FileName
FileName
FileChange
UniquePid
FlexString2
HostName
DeviceHostName
FileName
FileName
Driver
HostName
DeviceHostName
FileName
FileName
ProductName
DeviceCustomString5,
ProductName
ProductVendor
DeviceCustomString6
ProductVendor
Connection
UniquePid
FlexString2
HostName
DeviceHostName
URI
RequestURL
RemoteIP
DestinationAddress
RemotePort
DestinationPort
PortListen
UniquePid
FlexString2
HostName
DeviceHostName
LocalIP
SourceAddress
LocalPort
SourcePort
Registry
UniquePid
FlexString2
HostName
DeviceHostName
ValueName
DeviceCustomString5
New Value Name
KeyName
DeviceCustomString4
New Key Name
PreviousKeyName
FlexString2
Old Key Name
ValueData
DeviceCustomString6
New Value Data
PreviousValueData
FlexString1
Old Value Data
ValueType
FlexNumber1
Value Type
PreviousValueType
FlexNumber2
Previous Value Type
SystemEventLog
UniquePid
FlexString2
HostName
DeviceHostName
OperationResult
EventOutcome
EventId
DeviceCustomNumber3
EventId
EventRecordId
DeviceCustomNumber2
EventRecordId
Channel
DeviceCustomString6
Channel
ProviderName
SourceUserID
ThreatDetect
UniquePid
FlexString2
HostName
DeviceHostName
VerdictName
EventOutcome
DetectedObjectType
OldFileType
isSilent
FlexString1
Is Silent
RecordId
DeviceCustomString5
Record ID
DatabaseTimestamp
DeviceCustomDate2
Database Timestamp
ThreatDetectProcessingResult
UniquePid
FlexString2
HostName
DeviceHostName
ThreatStatus
DeviceCustomString5
Threat Status
PROCESS_INTERPRET_FILE_RUN
UniquePid
FlexString2
HostName
DeviceHostName
FileName
FileName
InterpretedFilePath
OldFilePath
InterpretedFileSize
OldFileSize
InterpretedFileHash
OldFileHash
PROCESS_CONSOLE_INTERACTIVE_INPUT
UniquePid
FlexString2
HostName
DeviceHostName
InteractiveInputText
DeviceCustomString4
Command Line
AMSI SCAN
UniquePid
FlexString2
HostName
DeviceHostName
ObjectContent
DeviceCustomString5
Object Content
Alert data model
This section describes the KUMA alert data model. Alerts are created by correlators whenever information security threats are detected using correlation rules. Alerts must be investigated to eliminate these threats.
Alert field |
Data type |
Description |
|
String |
Unique ID of the alert. |
|
String |
ID of the tenant that owns the alert. The value is inherited from the correlator that generated the alert. |
|
String |
Tenant name. |
|
String |
ID of the rule used as the basis for generating the alert. |
|
String |
Name of the correlation rule used as the basis for generating the alert. |
|
String |
Alert status. Possible values:
|
|
Number |
Alert severity. Possible values:
|
|
|
Parameter showing how the alert severity level was determined. Possible values:
|
|
Number |
Time when the first correlation event was created from the alert. |
|
Number |
Time when the last correlation event was created from the alert. |
|
Number |
Date of the last modification to the alert parameters. |
|
String |
ID of the KUMA user assigned to examine the alert. |
|
String |
Name of the KUMA user assigned to examine the alert. |
|
Nested list of strings |
List of event fields used to group events in the correlation rule. |
|
String |
Reason for closing the alert. Possible values:
|
|
|
Indicator that the alert is overflowed, which means that the size of the alert and the events associated with it exceeds 16 MB. Possible values:
|
|
String |
Maximum severity of the asset categories associated with the alert. |
|
String |
ID of the alert in the IRP / SOAR application, if integration with such an application is configured in KUMA. |
|
String |
Link to a section in the IRP / SOAR application that displays information about an alert imported from KUMA. |
|
String |
ID of the incident to which the alert is linked. |
|
String |
Name of the incident to which the alert is linked. |
|
String |
Name of the segmentation rule used to group correlation events in the alert. |
|
String |
ID of the hierarchy branch in which the alert was generated. Indicated for a hierarchical deployment of KUMA. |
|
String |
Name of the hierarchy branch in which the alert was generated. Indicated for a hierarchical deployment of KUMA. |
|
Nested |
Nested structure with lines indicating changes to alert statuses and assignments, and user comments. |
|
Nested |
Nested structure from which you can query the correlation events associated with the alert. |
|
Nested |
Nested structure from which you can query assets associated with the alert. |
|
Nested |
Nested structure from which you can query the user accounts associated with the alert. |
|
Nested |
Nested structure from which you can query alert-related assets and user accounts, and find out the number of times they appear in alert events. |
Nested Affected structure
Field |
Data type |
Description |
|
Nested |
List and number of assets associated with the alert. |
|
Nested |
List and number of user accounts associated with the alert. |
Nested AffectedRecord structure
Field |
Data type |
Description |
|
String |
ID of the asset or user account. |
|
Number |
The number of times an asset or user account appears in alert-related events. |
Nested EventWrapper structure
Field |
Data type |
Description |
|
Nested |
Event fields. |
|
String |
Comment added when events were added to the alert. |
|
Number |
Date when events were added to the alert. |
Nested Action structure
Field |
Data type |
Description |
|
Number |
Date when the action was taken on the alert. |
|
String |
User ID. |
|
String |
Type of action. |
|
String |
Value. |
|
Nested |
Event fields. |
|
String |
Cluster ID. |
Asset data model
The structure of an asset is represented by fields that contain values. Fields can also contain nested structures.
Asset field |
Value type |
Description |
|
String |
Asset ID. |
|
String |
Tenant name. |
|
Number |
Asset deletion date. |
|
Number |
Asset creation date. |
|
String |
Tenant ID. |
|
Nested list of strings |
Asset categories. |
|
Nested |
Changes asset categories. |
|
Nested dictionary:
|
IDs of incidents. |
|
Nested list of strings |
Asset IP addresses. |
|
String |
Asset FQDN. |
|
Number |
Asset importance. |
|
String with |
Indicator of whether the asset has been marked for deletion from KUMA. |
|
Number |
Date of last update of the asset. |
|
Nested list of strings |
Asset MAC addresses. |
|
Nested list of numbers |
IP address in number format. |
|
Nested |
Asset owner information. |
|
Nested |
Asset operating system information. |
|
String |
Asset name. |
|
Nested |
Software installed on the asset. |
|
Nested |
Asset vulnerabilities. |
|
String |
KICS/KATA server IP address. |
|
Number |
KICS/KATA connector ID. |
|
Number |
KICS/KATA asset ID. |
|
String |
KICS/KATA asset status. |
|
Nested |
Asset hardware information received from KICS/KATA. |
|
Nested |
Asset software information received from KICS/KATA. |
|
Nested |
Asset vulnerability information received from KICS/KATA. |
|
Nested |
Basic information about the asset from various sources. |
|
String with |
Indicator that asset details have been imported from KSC. |
|
String |
ID of the KSC Agent from which the asset information was received. |
|
String |
FQDN of the KSC Server. |
|
String |
KSC instance ID. |
|
String |
KSC Server host name. |
|
Number |
KSC group ID. |
|
String |
KSC group name. |
|
Number |
Date when information about the asset was last received from KSC. |
|
Nested dictionary:
|
Information about Kaspersky applications installed on the asset received from KSC. |
|
Nested |
Asset hardware information received from KSC. |
|
Nested |
Asset software information received from KSC. |
|
Nested |
Asset vulnerability information received from KSC. |
Nested Category structure
Field |
Value type |
Description |
|
String |
Category ID. |
|
String |
Tenant ID. |
|
String |
Tenant name. |
|
String |
Parent category. |
|
Nested list of strings |
Structure of categories. |
|
String |
Category name. |
|
Number |
Last update of the category. |
|
Number |
Category creation date. |
|
String |
Category description. |
|
Number |
Category importance. |
|
String |
Asset category assignment type. |
|
Number |
Categorization date. |
|
String |
Category assignment interval. |
Nested OwnerInfo structure
Field |
Value type |
Description |
|
String |
Name of the asset owner. |
Nested OS structure
Field |
Value type |
Description |
|
String |
Name of the operating system. |
|
Number |
Operating system version. |
Nested Software structure
Field |
Value type |
Description |
|
String |
Software name. |
|
String |
Software version. |
|
String |
Software publisher. |
|
String |
Installation date. |
|
|
Indicates whether the software has an MSI installer. |
Nested Vulnerability structure
Field |
Value type |
Description |
|
String |
Vulnerability ID assigned by Kaspersky. |
|
String |
Software name. |
|
String |
URL containing the vulnerability description. |
|
String |
Recommended update. |
|
String |
Recommended update. |
|
String |
Vulnerability severity. |
|
Number |
Vulnerability severity. |
|
Nested list of strings |
CVE vulnerability ID. |
|
|
Indicates whether an exploit exists. |
|
|
Indicates whether malware exists. |
Nested KICSSystemInfo structure
Field |
Value type |
Description |
|
String |
Device model. |
|
String |
Device version. |
|
String |
Vendor. |
Nested KICSRisk structure
Field |
Value type |
Description |
|
Number |
KICS/KATA risk ID. |
|
String |
Risk name. |
|
String |
Risk type. |
|
String |
Risk description. |
|
String |
Link to risk description. |
|
Number |
Risk severity. |
|
Number |
CVSS score. |
Nested Sources structure
Field |
Value type |
Description |
|
Nested |
Asset information received from KSC. |
|
Nested |
Asset information received through the REST API. |
|
Nested |
Manually entered information about the asset. |
|
Nested |
Asset information received from KICS/KATA. |
Nested Sources structure
Field |
Value type |
Description |
|
Nested list of strings |
Asset MAC addresses. |
|
Nested list of numbers |
IP address in number format. |
|
Nested |
Asset owner information. |
|
Nested |
Asset operating system information. |
|
String |
Asset name. |
|
Nested list of strings |
Asset IP addresses. |
|
String |
Asset FQDN. |
|
Number |
Asset importance. |
|
String with |
Indicator of whether the asset has been marked for deletion from KUMA. |
|
Number |
Date of last update of the asset. |
Nested structure ProductInfo
Field |
Value type |
Description |
|
String |
Software version. |
|
String |
Software name. |
Nested Hardware structure
Field |
Value type |
Description |
|
Nested |
List of network cards of the asset. |
|
Nested |
List of asset processors. |
|
Nested |
Asset RAM list. |
|
Nested |
List of asset drives. |
Nested NetCard structure
Field |
Value type |
Description |
|
String |
Network card ID. |
|
Nested list of strings |
MAC addresses of the network card. |
|
String |
Network card name. |
|
String |
Network card manufacture. |
|
String |
Driver version. |
Nested RAM structure
Field |
Value type |
Description |
|
String |
RAM frequency. |
|
Number |
Amount of RAM, in bytes. |
Nested CPU structure
Field |
Value type |
Description |
|
String |
CPU ID. |
|
String |
CPU name. |
|
String |
Number of cores. |
|
String |
Frequency. |
Nested Disk structure
Field |
Value type |
Description |
|
Number |
Available disk space. |
|
Number |
Total disk space. |
User account data model
User account fields can be addressed from email templates and during event correlation.
Field |
Value type |
Description |
|
String |
User account ID. |
|
String |
Active Directory attribute. User account ID in Active Directory. |
|
String |
Tenant ID. |
|
String |
Tenant name. |
|
Number |
Last update of user account. |
|
String |
Domain. |
|
String |
Active Directory attribute. User name. |
|
String |
Active Directory attribute. Displayed user name. |
|
String |
Active Directory attribute. LDAP object name. |
|
String |
Active Directory attribute. Employee ID. |
|
String |
Active Directory attribute. User email address. |
|
String |
Active Directory attribute. Alternate email address. |
|
String |
Active Directory attribute. Mobile phone number. |
|
String |
Active Directory attribute. Security ID. |
|
String |
Active Directory attribute. Login. |
|
String |
Active Directory attribute. Phone number. |
|
String |
Active Directory attribute. User principal name (UPN). |
|
|
Indicator that determines whether a user account is obsolete. |
|
List of strings |
Active Directory attribute. AD groups joined by the user. This attribute can be used for an event search during correlation. |
|
|
Indicator that determines whether a user account should be designated as obsolete. |
|
Number |
User account creation date. |
|
String |
Active Directory attribute. Last name of the user. |
|
String |
Active Directory attribute. User account type. |
|
String |
Active Directory attribute. Job title of the user. |
|
String |
Active Directory attribute. User's department. |
|
String |
Active Directory attribute. User's division. |
|
String |
Active Directory attribute. User's supervisor. |
|
String |
Active Directory attribute. User's location. |
|
String |
Active Directory attribute. User's company. |
|
String |
Active Directory attribute. Company address. |
|
String |
Active Directory attribute. Delivery address. |
|
List of strings |
Active Directory attribute. Objects under control of the user. |
|
Number |
Active Directory attribute. AD account type. |
|
Number |
Active Directory attribute. User account creation date. |
|
Number |
Active Directory attribute. User account modification date. |
|
Number |
Active Directory attribute. User account expiration date. |
|
Number |
Active Directory attribute. Date of last unsuccessful login attempt. |
KUMA audit events
Audit events are created when certain security-related actions are completed in KUMA. These events are used to ensure system integrity.
To view audit events, go to the Events section in KUMA and add "SELECT * FROM 'events' WHERE Type=4" to the query.
As a result of executing the query, audit events are displayed in the Events section if the user role allows viewing audit events.
Event fields with general information
Every audit event has the event fields described below.
Event field name |
Field value |
ID |
Unique event ID in the form of an UUID. |
Timestamp |
Event time. |
DeviceHostName |
The event source host. For audit events, it is the hostname where kuma-core is installed, because it is the source of events. |
DeviceTimeZone |
Timezone of the system time of the server hosting the KUMA Core in the format +- |
Type |
Type of the audit event. For audit event the value is |
TenantID |
ID of the main tenant. |
DeviceVendor |
|
DeviceProduct |
|
EndTime |
Event creation time. |
User was successfully signed in or failed to sign in
Event field name |
Field value |
DeviceAction |
|
EventOutcome |
|
SourceTranslatedAddress |
This field contains the value of the HTTP header x-real-ip or x-forwarded-for. If these headers are absent, the field will be empty. |
SourceAddress |
The address from which the user logged in. If the user logged in using a proxy, there will be a proxy address. |
SourcePort |
Port from which the user logged in. If the user logged in using a proxy, there will be a port on the proxy side. |
SourceUserName |
User login. |
SourceUserID |
User ID. |
Message |
Description of the error; appears only if an error occurred during login. Otherwise, the field will be empty. |
User login successfully changed
Event field name |
Field value |
DeviceAction |
|
EventOutcome |
|
SourceTranslatedAddress |
This field contains the value of the HTTP header x-real-ip or x-forwarded-for. If these headers are absent, the field will be empty. |
SourceAddress |
The address from which the user logged in. If the user logged in using a proxy, there will be a proxy address. |
SourcePort |
Port from which the user logged in. If the user logged in using a proxy, there will be a port on the proxy side. |
SourceUserName |
User login that was used to change data. |
SourceUserID |
User ID that was used to change data. |
DestinationUserName |
User login whose data was changed. |
DestinationUserID |
User ID whose data was changed. |
DeviceCustomString1 |
Current value of the login. |
DeviceCustomString1Label |
|
DeviceCustomString2 |
Value of the login before it was changed. |
DeviceCustomString2Label |
|
User role was successfully changed
Event field name |
Field value |
DeviceAction |
|
EventOutcome |
|
SourceTranslatedAddress |
This field contains the value of the HTTP header x-real-ip or x-forwarded-for. If these headers are absent, the field will be empty. |
SourceAddress |
The address from which the user logged in. If the user logged in using a proxy, there will be a proxy address. |
SourcePort |
Port from which the user logged in. If the user logged in using a proxy, there will be a port on the proxy side. |
SourceUserName |
User login that was used to change data. |
SourceUserID |
User ID that was used to change data. |
DestinationUserName |
User login whose data was changed. |
DestinationUserID |
User ID whose data was changed. |
DeviceCustomString1 |
Current value of the role. |
DeviceCustomString1Label |
|
DeviceCustomString2 |
Value of the role before it was changed. |
DeviceCustomString2Label |
|
Other data of the user was successfully changed
Event field name |
Field value |
DeviceAction |
|
EventOutcome |
|
SourceTranslatedAddress |
This field contains the value of the HTTP header x-real-ip or x-forwarded-for. If these headers are absent, the field will be empty. |
SourceAddress |
The address from which the user logged in. If the user logged in using a proxy, there will be a proxy address. |
SourcePort |
Port from which the user logged in. If the user logged in using a proxy, there will be a port on the proxy side. |
SourceUserName |
User login that was used to change data. |
SourceUserID |
User ID that was used to change data. |
DestinationUserName |
User login whose data was changed. |
DestinationUserID |
User ID whose data was changed. |
User successfully logged out
This event appears only when the user pressed the logout button.
This event will not appear if the user is logged out due to the end of the session or if the user logs in again from another browser.
Event field name |
Field value |
DeviceAction |
|
EventOutcome |
|
SourceTranslatedAddress |
This field contains the value of the HTTP header x-real-ip or x-forwarded-for. If these headers are absent, the field will be empty. |
SourceAddress |
The address from which the user logged in. If the user logged in using a proxy, there will be a proxy address. |
SourcePort |
Port from which the user logged in. If the user logged in using a proxy, there will be a port on the proxy side. |
SourceUserName |
User login. |
SourceUserID |
User ID. |
User password was successfully changed
Event field name |
Field value |
DeviceAction |
|
EventOutcome |
|
SourceTranslatedAddress |
This field contains the value of the HTTP header x-real-ip or x-forwarded-for. If these headers are absent, the field will be empty. |
SourceAddress |
The address from which the user logged in. If the user logged in using a proxy, there will be a proxy address. |
SourcePort |
Port from which the user logged in. If the user logged in using a proxy, there will be a port on the proxy side. |
SourceUserName |
User login that was used to change data. |
SourceUserID |
User ID that was used to change data. |
DestinationUserName |
User login whose data was changed. |
DestinationUserID |
User ID whose data was changed. |
User was successfully created
Event field name |
Field value |
DeviceAction |
|
EventOutcome |
|
SourceTranslatedAddress |
This field contains the value of the HTTP header x-real-ip or x-forwarded-for. If these headers are absent, the field will be empty. |
SourceAddress |
The address from which the user logged in. If the user logged in using a proxy, there will be a proxy address. |
SourcePort |
Port from which the user logged in. If the user logged in using a proxy, there will be a port on the proxy side. |
SourceUserName |
User login that was used to create the user account. |
SourceUserID |
User ID that was used to create the user account. |
DestinationUserName |
User login for which the user account was created. |
DestinationUserID |
User ID for which the user account was created. |
DeviceCustomString1 |
Role of the created user. |
DeviceCustomString1Label |
|
User role was successfully assigned
Event field name |
Field value |
DeviceAction |
|
EventOutcome |
|
SourceTranslatedAddress |
This field contains the value of the HTTP header x-real-ip or x-forwarded-for. If these headers are absent, the field will be empty. |
SourceAddress |
The address from which the user logged in. If the user logged in using a proxy, there will be a proxy address. |
SourcePort |
Port from which the user logged in. If the user logged in using a proxy, there will be a port on the proxy side. |
SourceUserName |
Login of the user for whom the data changes were made. |
SourceUserID |
ID of the user for whom the data changes were made. |
DestinationUserPrivileges |
Role name. Available values: general admin, admin, analyst, operator. |
DeviceCustomString5 |
ID of the tenant used to assign the role. |
DeviceCustomString5Label |
|
DeviceCustomString6 |
Tenant name. |
DeviceCustomString6Label |
|
User role was successfully revoked
Event field name |
Field value |
DeviceAction |
|
EventOutcome |
|
SourceTranslatedAddress |
This field contains the value of the HTTP header x-real-ip or x-forwarded-for. If these headers are absent, the field will be empty. |
SourceAddress |
The address from which the user logged in. If the user logged in using a proxy, there will be a proxy address. |
SourcePort |
Port from which the user logged in. If the user logged in using a proxy, there will be a port on the proxy side. |
SourceUserName |
Login of the user who makes the changes. |
SourceUserID |
ID of the user who makes the changes. |
DestinationUserName |
Login of the user for whom the changes are made. |
DestinationUserID |
ID of the user for whom the changes are made. |
DestinationUserPrivileges |
Role name. Available values: general admin, admin, analyst, operator. |
DeviceCustomString5 |
ID of the tenant used to assign the role. |
DeviceCustomString5Label |
|
DeviceCustomString6 |
Tenant name. |
DeviceCustomString6Label |
|
The user has successfully edited the set of fields settings to define sources
Event field name |
Field value |
DeviceAction |
|
DeviceFacility |
|
EventOutcome |
|
SourceUserName |
Login of the user who makes the changes. |
SourceUserID |
ID of the user who makes the changes. |
DeviceCustomString5 |
Updated set of fields, | is used as the delimiter. |
User access token was successfully changed
Event field name |
Field value |
DeviceAction |
|
EventOutcome |
|
SourceTranslatedAddress |
This field contains the value of the HTTP header x-real-ip or x-forwarded-for. If these headers are absent, the field will be empty. |
SourceAddress |
The address from which the user logged in. If the user logged in using a proxy, there will be a proxy address. |
SourcePort |
Port from which the user logged in. If the user logged in using a proxy, there will be a port on the proxy side. |
SourceUserName |
User login that was used to change data. |
SourceUserID |
User ID that was used to change the data. |
DestinationUserName |
User login whose data was changed. |
DestinationUserID |
ID of the user whose data was changed. |
Changed the set of spaces to differentiate access to events
Event field name |
Field value |
DeviceAction |
|
EventOutcome |
|
SourceTranslatedAddress |
This field contains the value of the HTTP header x-real-ip or x-forwarded-for. If these headers are absent, the field will be empty. |
SourceAddress |
The address from which the user logged in. If the user logged in using a proxy, there will be a proxy address. |
SourcePort |
Port from which the user logged in. If the user logged in using a proxy, there will be a port on the proxy side. |
SourceUserName |
User login that was used to edit settings. |
DeviceCustomString5 |
ID of the space set. |
DeviceCustomString5Label |
|
DeviceCustomString3 |
Name of the space set. |
DeviceCustomString3Label |
|
Service was successfully created
Event field name |
Field value |
DeviceAction |
|
EventOutcome |
|
SourceTranslatedAddress |
This field contains the value of the HTTP header x-real-ip or x-forwarded-for. If these headers are absent, the field will be empty. |
SourceAddress |
The address from which the user logged in. If the user logged in using a proxy, there will be a proxy address. |
SourcePort |
Port from which the user logged in. If the user logged in using a proxy, there will be a port on the proxy side. |
SourceUserName |
User login that was used to create the service. |
SourceUserID |
User ID that was used to create the service. |
DeviceExternalID |
Service ID. |
DeviceProcessName |
Service name. |
DeviceFacility |
Service type. |
DeviceCustomString5 |
Tenant ID. |
DeviceCustomString5Label |
|
DeviceCustomString6 |
Tenant name. |
DeviceCustomString6Label |
|
Service was successfully deleted
Event field name |
Field value |
DeviceAction |
|
EventOutcome |
|
SourceTranslatedAddress |
This field contains the value of the HTTP header x-real-ip or x-forwarded-for. If these headers are absent, the field will be empty. |
SourceAddress |
The address from which the user logged in. If the user logged in using a proxy, there will be a proxy address. |
SourcePort |
Port from which the user logged in. If the user logged in using a proxy, there will be a port on the proxy side. |
SourceUserName |
User login that was used to delete the service. |
SourceUserID |
User ID that was used to delete the service. |
DeviceExternalID |
Service ID. |
DeviceProcessName |
Service name. |
DeviceFacility |
Service type. |
DestinationAddress |
Address of the device that was used to start the service. If the service has never been started before, the field will be empty. |
DestinationHostName |
The FQDN of the machine that was used to start the service. If the service has never been started before, the field will be empty. |
DeviceCustomString5 |
Tenant ID. |
DeviceCustomString5Label |
|
DeviceCustomString6 |
Tenant name. |
DeviceCustomString6Label |
|
Service was successfully reloaded
Event field name |
Field value |
DeviceAction |
|
EventOutcome |
|
SourceTranslatedAddress |
This field contains the value of the HTTP header x-real-ip or x-forwarded-for. If these headers are absent, the field will be empty. |
SourceAddress |
The address from which the user logged in. If the user logged in using a proxy, there will be a proxy address. |
SourcePort |
Port from which the user logged in. If the user logged in using a proxy, there will be a port on the proxy side. |
SourceUserName |
User login that was used to reset the service. |
SourceUserID |
User ID that was used to restart the service. |
DeviceExternalID |
Service ID. |
DeviceProcessName |
Service name. |
DeviceFacility |
Service type. |
DeviceCustomString5 |
Tenant ID. |
DeviceCustomString5Label |
|
DeviceCustomString6 |
Tenant name. |
DeviceCustomString6Label |
|
Service was successfully restarted
Event field name |
Field value |
DeviceAction |
|
EventOutcome |
|
SourceTranslatedAddress |
This field contains the value of the HTTP header x-real-ip or x-forwarded-for. If these headers are absent, the field will be empty. |
SourceAddress |
The address from which the user logged in. If the user logged in using a proxy, there will be a proxy address. |
SourcePort |
Port from which the user logged in. If the user logged in using a proxy, there will be a port on the proxy side. |
SourceUserName |
User login that was used to restart the service. |
SourceUserID |
User ID that was used to restart the service. |
DeviceExternalID |
Service ID. |
DeviceProcessName |
Service name. |
DeviceFacility |
Service type. |
DeviceCustomString5 |
Tenant ID. |
DeviceCustomString5Label |
|
DeviceCustomString6 |
Tenant name. |
DeviceCustomString6Label |
|
Service was successfully started
Event field name |
Field value |
DeviceAction |
|
EventOutcome |
|
SourceTranslatedAddress |
This field contains the value of the HTTP header x-real-ip or x-forwarded-for. If these headers are absent, the field will be empty. |
SourceAddress |
Address that reported information about service start. It may be a proxy address if the information passed through a proxy. |
SourcePort |
Port that reported information about service start. It may be a proxy port if the information passed through a proxy. |
DeviceExternalID |
Service ID. |
DeviceProcessName |
Service name. |
DeviceFacility |
Service type. |
DestinationAddress |
Address of the device where the service was started. |
DestinationHostName |
FQDN of the device where the service was started. |
DeviceCustomString5 |
Tenant ID. |
DeviceCustomString5Label |
|
DeviceCustomString6 |
Tenant name. |
DeviceCustomString6Label |
|
Service was successfully paired
Event field name |
Field value |
DeviceAction |
|
EventOutcome |
|
SourceTranslatedAddress |
This field contains the value of the HTTP header x-real-ip or x-forwarded-for. If these headers are absent, the field will be empty. |
SourceAddress |
Address that sent a service pairing request. It may be a proxy address if the request passed through a proxy. |
SourcePort |
Port that sent a service pairing request. It may be a proxy port if the request passed through a proxy. |
DeviceExternalID |
Service ID. |
DeviceProcessName |
Service name. |
DeviceFacility |
Service type. |
DeviceCustomString5 |
Tenant ID. |
DeviceCustomString5Label |
|
DeviceCustomString6 |
Tenant name. |
DeviceCustomString6Label |
|
Service status was changed
Event field name |
Field value |
DeviceAction |
|
DeviceExternalID |
Service ID. |
DeviceProcessName |
Service name. |
DeviceFacility |
Service type. |
DestinationAddress |
Address of the device where the service was started. |
DestinationHostName |
FQDN of the device where the service was started. |
DeviceCustomString1 |
|
DeviceCustomString1Label |
|
DeviceCustomString2 |
|
DeviceCustomString2Label |
|
DeviceCustomString5 |
Tenant ID. |
DeviceCustomString5Label |
|
DeviceCustomString6 |
Tenant name. |
DeviceCustomString6Label |
|
Storage partition was deleted by user
Event field name |
Field value |
DeviceAction |
|
EventOutcome |
|
SourceTranslatedAddress |
This field contains the value of the HTTP header x-real-ip or x-forwarded-for. If these headers are absent, the field will be empty. |
SourceAddress |
The address from which the user logged in. If the user logged in using a proxy, there will be a proxy address. |
SourcePort |
Port from which the user logged in. If the user logged in using a proxy, there will be a port on the proxy side. |
SourceUserName |
User login that was used to delete partition. |
SourceUserID |
User ID that was used to delete partition. |
Name |
Storage name | Tenant of the partition being moved or deleted | Name of the space to which the partition belongs. |
Message |
|
Storage partition was deleted automatically due to expiration
Event field name |
Field value |
DeviceAction |
|
EventOutcome |
|
Name |
Storage name | Tenant of the partition being moved or deleted | Name of the space to which the partition belongs. |
DeviceCustomDate1 |
Partition creation date. |
DeviceCustomDate1Label |
|
SourceServiceName |
scheduler |
DeviceCustomString1 |
Node ID. |
DeviceCustomString1Label |
|
Message |
If moved:
If deleted:
|
DeviceCustomNumber1 |
Storage partition size in bytes. |
DeviceCustomNumber1Label |
|
DeviceCustomNumber2 |
Number of events in the storage partition. |
DeviceCustomNumber2Label |
|
Storage partition was deleted automatically or moved due to exceeding the storage capacity.
In KUMA, you can set a condition for storage partitions to have the disk partition automatically moved or deleted if the configured maximum size of such a partition is reached or exceeded. The maximum storage capacity can be configured in one of the following ways:
- Specify a percentage of the entire disk partition where the storage is installed.
- Set the size of the disk partition in GB.
If the condition is checked and it is found that the size of the storage is equal to or greater than the configured size in percent or GB, an audit event is generated and the storage partition is moved or deleted.
Event field name |
Field value |
DeviceAction |
If the storage partition size is specified as a percentage of the disk size, the value is If the storage partition size is specified in GB, the value is |
EventOutcome |
|
Name |
Storage name | Tenant of the partition being moved or deleted | Name of the space to which the partition belongs. |
DeviceCustomDate1 |
Partition creation date. |
DeviceCustomDate1Label |
|
SourceServiceName |
|
DeviceCustomString1 |
Node ID. |
DeviceCustomString1Label |
|
Message |
If moved:
If deleted:
|
DeviceCustomNumber1 |
Storage partition size in bytes. |
DeviceCustomNumber1Label |
|
DeviceCustomNumber2 |
Number of events in the storage partition. |
DeviceCustomNumber2Label |
|
Active list was successfully cleared or operation failed
Audit events for active lists are created only for actions performed by users. Audit events are not generated when the active lists are modified using correlation rules. If you need to track such changes, you can do so using alerts.
The event can be assigned the succeeded or failed status.
Since the request to clear an active list is made over a remote connection, a data transfer error may occur at any moment: both before and after deletion.
This means that the active list may be cleared successfully, but the event is assigned the failed status, because EventOutcome returns the TCP/IP connection status of the request, but not the succeeded or failed status of the active list clearing.
Event field name |
Field value |
DeviceAction |
|
EventOutcome |
|
SourceTranslatedAddress |
This field contains the value of the HTTP header x-real-ip or x-forwarded-for. If these headers are absent, the field will be empty. |
SourceAddress |
The address from which the user logged in. If the user logged in using a proxy, there will be a proxy address. |
SourcePort |
Port from which the user logged in. If the user logged in using a proxy, there will be a port on the proxy side. |
SourceUserName |
User login that was used to clear the active list. |
SourceUserID |
User ID that was used to clear the active list. |
DeviceExternalID |
Service ID whose active list was cleared. |
ExternalID |
Active list ID. |
Name |
Active list name. |
Message |
If EventOutcome = |
DeviceCustomString5 |
Service tenant ID. Some errors prevent adding tenant information to the event. |
DeviceCustomString5Label |
tenant ID |
DeviceCustomString6 |
Tenant name. |
DeviceCustomString6Label |
tenant name |
Active list item was successfully changed, or operation was unsuccessful
Audit events for active lists are created only for actions performed by users. Audit events are not generated when the active lists are modified using correlation rules. If you need to track such changes, you can do so using alerts.
The event can be assigned the succeeded or failed status.
Since the request to change an active list item is made over a remote connection, a data transfer error may occur at any moment: both before and after the change.
This means that the active list item may be changed successfully, but the event is assigned the failed status, because EventOutcome returns the TCP/IP connection status of the request, but not the succeeded or failed status of the active list item change.
Event field name |
Field value |
DeviceAction |
|
EventOutcome |
|
SourceTranslatedAddress |
This field contains the value of the HTTP header x-real-ip or x-forwarded-for. If these headers are absent, the field will be empty. |
SourceAddress |
The address from which the user logged in. If the user logged in using a proxy, there will be a proxy address. |
SourcePort |
Port from which the user logged in. If the user logged in using a proxy, there will be a port on the proxy side. |
SourceUserName |
User login used to change the active list item. |
SourceUserID |
User ID used to change the active list item. |
DeviceExternalID |
Service ID for which the active list is changed. |
ExternalID |
Active list ID. |
Name |
Active list name. |
DeviceCustomString1 |
Key name. |
DeviceCustomString1Label |
|
Message |
If EventOutcome = |
DeviceCustomString5 |
Service tenant ID. Some errors prevent adding tenant information to the event. |
DeviceCustomString5Label |
|
DeviceCustomString6 |
Tenant name |
DeviceCustomString6Label |
|
Active list item was successfully deleted or operation was unsuccessful
Audit events for active lists are created only for actions performed by users. Audit events are not generated when the active lists are modified using correlation rules. If you need to track such changes, you can do so using alerts.
The event can be assigned the succeeded or failed status.
Since the request to delete an active list item is made over a remote connection, a data transfer error may occur at any moment: both before and after deletion.
This means that the active list item may be deleted successfully, but the event is assigned the failed status, because EventOutcome returns the TCP/IP connection status of the request, but not the succeeded or failed status of the active list item deletion.
Event field name |
Field value |
DeviceAction |
|
EventOutcome |
|
SourceTranslatedAddress |
This field contains the value of the HTTP header x-real-ip or x-forwarded-for. If these headers are absent, the field will be empty. |
SourceAddress |
The address from which the user logged in. If the user logged in using a proxy, there will be a proxy address. |
SourcePort |
Port from which the user logged in. If the user logged in using a proxy, there will be a port on the proxy side. |
SourceUserName |
User login that was used to delete the item from the active list. |
SourceUserID |
User ID that was used to delete the item from the active list. |
DeviceExternalID |
Service ID whose active list was cleared. |
ExternalID |
Active list ID. |
Name |
Active list name. |
DeviceCustomString1 |
Key name. |
DeviceCustomString1Label |
|
Message |
If EventOutcome = |
DeviceCustomString5 |
Service tenant ID. Some errors prevent adding tenant information to the event. |
DeviceCustomString5Label |
|
DeviceCustomString6 |
Tenant name. |
DeviceCustomString6Label |
|
Active list was successfully imported or operation failed
Audit events for active lists are created only for actions performed by users. Audit events are not generated when the active lists are modified using correlation rules. If you need to track such changes, you can do so using alerts.
Active list items are imported in parts via a remote connection.
Since the import is performed via a remote connection, a data transfer error can occur at any time: when the data is imported partially or completely. EventOutcome returns the connection status, not the import status.
Event field name |
Field value |
DeviceAction |
|
EventOutcome |
|
SourceTranslatedAddress |
This field contains the value of the HTTP header x-real-ip or x-forwarded-for. If these headers are absent, the field will be empty. |
SourceAddress |
The address from which the user logged in. If the user logged in using a proxy, there will be a proxy address. |
SourcePort |
Port from which the user logged in. If the user logged in using a proxy, there will be a port on the proxy side. |
SourceUserName |
User login that was used to perform the import. |
SourceUserID |
User ID that was used to perform the import. |
DeviceExternalID |
Service ID for which an import was performed. |
ExternalID |
Active list ID. |
Name |
Active list name. |
Message |
If EventOutcome = |
DeviceCustomString5 |
Service tenant ID. Some errors prevent adding tenant information to the event. |
DeviceCustomString5Label |
|
DeviceCustomString6 |
Tenant name |
DeviceCustomString6Label |
|
Active list was exported successfully
Audit events for active lists are created only for actions performed by users. Audit events are not generated when the active lists are modified using correlation rules. If you need to track such changes, you can do so using alerts.
Event field name |
Field value |
DeviceAction |
|
EventOutcome |
|
SourceTranslatedAddress |
This field contains the value of the HTTP header x-real-ip or x-forwarded-for. If these headers are absent, the field will be empty. |
SourceAddress |
The address from which the user logged in. If the user logged in using a proxy, there will be a proxy address. |
SourcePort |
Port from which the user logged in. If the user logged in using a proxy, there will be a port on the proxy side. |
SourceUserName |
User login that was used to perform the export. |
SourceUserID |
User ID that was used to perform the export. |
DeviceExternalID |
Service ID for which an export was performed. |
ExternalID |
Active list ID. |
Name |
Active list name. |
DeviceCustomString5 |
Service tenant ID. Some errors prevent adding tenant information to the event. |
DeviceCustomString5Label |
|
DeviceCustomString6 |
Tenant name |
DeviceCustomString6Label |
|
Resource was successfully added
Event field name |
Field value |
DeviceAction |
|
EventOutcome |
|
SourceTranslatedAddress |
This field contains the value of the HTTP header x-real-ip or x-forwarded-for. If these headers are absent, the field will be empty. |
SourceAddress |
The address from which the user logged in. If the user logged in using a proxy, there will be a proxy address. |
SourcePort |
Port from which the user logged in. If the user logged in using a proxy, there will be a port on the proxy side. |
SourceUserName |
User login that was used to add the resource. |
SourceUserID |
User ID that was used to add the resource. |
DeviceExternalID |
Resource ID. |
DeviceProcessName |
Resource name. |
DeviceFacility |
Resource type:
|
DeviceCustomString5 |
Tenant ID. |
DeviceCustomString5Label |
|
DeviceCustomString6 |
Tenant name. |
DeviceCustomString6Label |
|
Resource was successfully deleted
Event field name |
Field value |
DeviceAction |
|
EventOutcome |
|
SourceTranslatedAddress |
This field contains the value of the HTTP header x-real-ip or x-forwarded-for. If these headers are absent, the field will be empty. |
SourceAddress |
The address from which the user logged in. If the user logged in using a proxy, there will be a proxy address. |
SourcePort |
Port from which the user logged in. If the user logged in using a proxy, there will be a port on the proxy side. |
SourceUserName |
User login that was used to delete the resource. |
SourceUserID |
User ID that was used to delete the resource. |
DeviceExternalID |
Resource ID. |
DeviceProcessName |
Resource name. |
DeviceFacility |
Resource type:
|
DeviceCustomString5 |
Tenant ID. |
DeviceCustomString5Label |
|
DeviceCustomString6 |
Tenant name. |
DeviceCustomString6Label |
|
Resource was successfully updated
Event field name |
Field value |
DeviceAction |
|
EventOutcome |
|
SourceTranslatedAddress |
This field contains the value of the HTTP header x-real-ip or x-forwarded-for. If these headers are absent, the field will be empty. |
SourceAddress |
The address from which the user logged in. If the user logged in using a proxy, there will be a proxy address. |
SourcePort |
Port from which the user logged in. If the user logged in using a proxy, there will be a port on the proxy side. |
SourceUserName |
User login that was used to update the resource. |
SourceUserID |
User ID that was used to update the resource. |
DeviceExternalID |
Resource ID. |
DeviceProcessName |
Resource name. |
DeviceFacility |
Resource type:
|
DeviceCustomString5 |
Tenant ID. |
DeviceCustomString5Label |
|
DeviceCustomString6 |
Tenant name. |
DeviceCustomString6Label |
|
Asset was successfully created
Event field name |
Field value |
DeviceAction |
|
EventOutcome |
|
SourceTranslatedAddress |
This field contains the value of the HTTP header x-real-ip or x-forwarded-for. If these headers are absent, the field will be empty. |
SourceAddress |
The address from which the user logged in. If the user logged in using a proxy, there will be a proxy address. |
SourcePort |
Port from which the user logged in. If the user logged in using a proxy, there will be a port on the proxy side. |
SourceUserName |
User login that was used to add the asset. |
SourceUserID |
User ID that was used to add the asset. |
DeviceAssetID |
Asset ID. |
SourceHostName |
Asset ID. |
Name |
Asset name. |
DeviceCustomString1 |
Comma-separated IP addresses of the asset. |
DeviceCustomString1Label |
|
DeviceCustomString5 |
Tenant ID. |
DeviceCustomString5Label |
|
DeviceCustomString6 |
Tenant name. |
DeviceCustomString6Label |
|
Asset was successfully deleted
Event field name |
Field value |
DeviceAction |
|
EventOutcome |
|
SourceTranslatedAddress |
This field contains the value of the HTTP header x-real-ip or x-forwarded-for. If these headers are absent, the field will be empty. |
SourceAddress |
The address from which the user logged in. If the user logged in using a proxy, there will be a proxy address. |
SourcePort |
Port from which the user logged in. If the user logged in using a proxy, there will be a port on the proxy side. |
SourceUserName |
User login that was used to add the asset. |
SourceUserID |
User ID that was used to add the asset. |
DeviceAssetID |
Asset ID. |
SourceHostName |
Asset ID. |
Name |
Asset name. |
DeviceCustomString1 |
Comma-separated IP addresses of the asset. |
DeviceCustomString1Label |
|
DeviceCustomString5 |
Tenant ID. |
DeviceCustomString5Label |
|
DeviceCustomString6 |
Tenant name. |
DeviceCustomString6Label |
|
Asset category was successfully added
Event field name |
Field value |
DeviceAction |
|
EventOutcome |
|
SourceTranslatedAddress |
This field contains the value of the HTTP header x-real-ip or x-forwarded-for. If these headers are absent, the field will be empty. |
SourceAddress |
The address from which the user logged in. If the user logged in using a proxy, there will be a proxy address. |
SourcePort |
Port from which the user logged in. If the user logged in using a proxy, there will be a port on the proxy side. |
SourceUserName |
User login that was used to add the category. |
SourceUserID |
User ID that was used to add the category. |
DeviceExternalID |
Category ID. |
Name |
Category name. |
DeviceCustomString5 |
Tenant ID. |
DeviceCustomString5Label |
|
DeviceCustomString6 |
Tenant name. |
DeviceCustomString6Label |
|
Asset category was deleted successfully
Event field name |
Field value |
DeviceAction |
|
EventOutcome |
|
SourceTranslatedAddress |
This field contains the value of the HTTP header x-real-ip or x-forwarded-for. If these headers are absent, the field will be empty. |
SourceAddress |
The address from which the user logged in. If the user logged in using a proxy, there will be a proxy address. |
SourcePort |
Port from which the user logged in. If the user logged in using a proxy, there will be a port on the proxy side. |
SourceUserName |
User login that was used to delete the category. |
SourceUserID |
User ID that was used to delete the category. |
DeviceExternalID |
Category ID. |
Name |
Category name. |
DeviceCustomString5 |
Tenant ID. |
DeviceCustomString5Label |
|
DeviceCustomString6 |
Tenant name. |
DeviceCustomString6Label |
|
Settings were updated successfully
Event field name |
Field value |
DeviceAction |
|
EventOutcome |
|
SourceTranslatedAddress |
This field contains the value of the HTTP header x-real-ip or x-forwarded-for. If these headers are absent, the field will be empty. |
SourceAddress |
The address from which the user logged in. If the user logged in using a proxy, there will be a proxy address. |
SourcePort |
Port from which the user logged in. If the user logged in using a proxy, there will be a port on the proxy side. |
SourceUserName |
User login that was used to update the settings. |
SourceUserID |
User ID that was used to update the settings. |
DeviceFacility |
Type of settings. |
DeviceCustomString5 |
Tenant ID. |
DeviceCustomString5Label |
|
DeviceCustomString6 |
Tenant name. |
DeviceCustomString6Label |
|
Tenant was successfully created
Event field name |
Field value |
DeviceAction |
|
EventOutcome |
|
SourceTranslatedAddress |
This field contains the value of the HTTP header x-real-ip or x-forwarded-for. If these headers are absent, the field will be empty. |
SourceAddress |
The address from which the user logged in. If the user logged in using a proxy, there will be a proxy address. |
SourcePort |
Port from which the user logged in. If the user logged in using a proxy, there will be a port on the proxy side. |
SourceUserName |
User login used to create the tenant. |
SourceUserID |
User ID used to create the tenant. |
DeviceCustomString5 |
Tenant ID. |
DeviceCustomString5Label |
|
DeviceCustomString6 |
Tenant name. |
DeviceCustomString6Label |
|
Tenant was successfully enabled
Event field name |
Field value |
DeviceAction |
|
EventOutcome |
|
SourceTranslatedAddress |
This field contains the value of the HTTP header x-real-ip or x-forwarded-for. If these headers are absent, the field will be empty. |
SourceAddress |
The address from which the user logged in. If the user logged in using a proxy, there will be a proxy address. |
SourcePort |
Port from which the user logged in. If the user logged in using a proxy, there will be a port on the proxy side. |
SourceUserName |
User login used to enable the tenant. |
SourceUserID |
User ID used to enable the tenant. |
DeviceCustomString5 |
Tenant ID. |
DeviceCustomString5Label |
|
DeviceCustomString6 |
Tenant name. |
DeviceCustomString6Label |
|
Tenant was successfully disabled
Event field name |
Field value |
DeviceAction |
|
EventOutcome |
|
SourceTranslatedAddress |
This field contains the value of the HTTP header x-real-ip or x-forwarded-for. If these headers are absent, the field will be empty. |
SourceAddress |
The address from which the user logged in. If the user logged in using a proxy, there will be a proxy address. |
SourcePort |
Port from which the user logged in. If the user logged in using a proxy, there will be a port on the proxy side. |
SourceUserName |
User login used to disable the tenant. |
SourceUserID |
User ID used to disable the tenant. |
DeviceCustomString5 |
Tenant ID. |
DeviceCustomString5Label |
|
DeviceCustomString6 |
Tenant name. |
DeviceCustomString6Label |
|
Other tenant data was successfully changed
Event field name |
Field value |
DeviceAction |
|
EventOutcome |
|
SourceTranslatedAddress |
This field contains the value of the HTTP header x-real-ip or x-forwarded-for. If these headers are absent, the field will be empty. |
SourceAddress |
The address from which the user logged in. If the user logged in using a proxy, there will be a proxy address. |
SourcePort |
Port from which the user logged in. If the user logged in using a proxy, there will be a port on the proxy side. |
SourceUserName |
User login that was used to change the tenant data. |
SourceUserID |
User ID that was used to change the tenant data. |
DeviceCustomString5 |
Tenant ID. |
DeviceCustomString5Label |
|
DeviceCustomString6 |
Tenant name. |
DeviceCustomString6Label |
|
Updated data retention policy after changing drives
Event field name |
Field value |
DeviceAction |
|
EventOutcome |
|
SourceTranslatedAddress |
This field contains the value of the HTTP header x-real-ip or x-forwarded-for. If these headers are absent, the field will be empty. |
SourceAddress |
The address from which the user logged in. If the user logged in using a proxy, there will be a proxy address. |
SourcePort |
Port from which the user logged in. If the user logged in using a proxy, there will be a port on the proxy side. |
SourceUserName |
User login that was used to change the tenant data. |
SourceUserID |
User ID that was used to change the tenant data. |
The dictionary was successfully updated on the service or operation was unsuccessful
Event field name |
Field value |
DeviceAction |
|
EventOutcome |
|
SourceTranslatedAddress |
This field contains the value of the HTTP header x-real-ip or x-forwarded-for. If these headers are absent, the field will be empty. |
SourceAddress |
The address from which the user logged in. If the user logged in using a proxy, there will be a proxy address. |
SourcePort |
Port from which the user logged in. If the user logged in using a proxy, there will be a port on the proxy side. |
SourceUserName |
User login that was used to create the service. |
SourceUserID |
User ID that was used to create the service. |
DeviceExternalID |
Service ID. |
ExternalID |
Dictionary ID. |
DeviceProcessName |
Service name. |
DeviceFacility |
Service type. |
DeviceCustomString5 |
Tenant ID. |
DeviceCustomString5Label |
|
DeviceCustomString6 |
Tenant name. |
DeviceCustomString6Label |
|
Message |
If EventOutcome = |
Response in Active Directory
Event field name |
Field value |
DeviceAction |
|
DeviceFacility |
|
EventOutcome |
|
SourceTranslatedAddress |
This field contains the value of the HTTP header x-real-ip or x-forwarded-for. If these headers are absent, the field will be empty. |
SourceAddress |
The address from which the user logged in. If the user logged in using a proxy, there will be a proxy address. |
SourcePort |
Port from which the user logged in. If the user logged in using a proxy, there will be a port on the proxy side. |
SourceUserName |
User login that was used to change the tenant data. |
SourceUserID |
User ID that was used to change the tenant data. |
DeviceCustomString3 |
Response rule name: CHANGE_PASSWORD, ADD_TO_GROUP, REMOVE_FROM_GROUP, BLOCK_USER. |
DeviceCustomString3Label |
|
DeviceCustomString5 |
Tenant ID. |
DeviceCustomString5Label |
|
DeviceCustomString6 |
Tenant name. |
DeviceCustomString6Label |
|
DestinationUserName |
The Active Directory user account to which the response is invoked (sAMAccountName). |
DestinationNtDomain |
Domain of the Active Directory user account to which the response is invoked. |
DestinationUserID |
Account UUID in KUMA. |
FlexString1 |
Information about the group where the user was added or deleted. |
FlexString1Label |
|
Request sent to KIRA
Event field name |
Field value |
DeviceAction |
|
EventOutcome |
|
SourceUserName |
User login used to send the request. |
SourceUserID |
User ID used to send the request. |
DeviceCustomString1 |
The resulting string that was sent. |
DeviceCustomString1Label |
|
DeviceCustomString2 |
ID of the event from which the request was sent. |
DeviceCustomString2Label |
|
DeviceCustomString3 |
ID of the task created to send the request. |
DeviceCustomString3Label |
|
KICS/KATA response
Event field name |
Field value |
DeviceAction |
|
DeviceFacility |
|
EventOutcome |
|
SourceTranslatedAddress |
This field contains the value of the HTTP header x-real-ip or x-forwarded-for. If these headers are absent, the field will be empty. |
SourceAddress |
The address from which the user logged in. If the user logged in using a proxy, there will be a proxy address. |
SourcePort |
Port from which the user logged in. If the user logged in using a proxy, there will be a port on the proxy side. |
SourceUserName |
Login of the user who sent the request. |
SourceUserID |
ID of the user who sent the request. |
DeviceCustomString3 |
Response rule name: |
DeviceCustomString3Label |
|
DeviceCustomString5 |
Tenant ID. |
DeviceCustomString5Label |
|
DeviceCustomString6 |
Tenant name. |
DeviceCustomString6Label |
|
DeviceAssetID |
Asset ID. |
SourceHostName |
Asset FQDN. |
Name |
Asset name. |
DeviceCustomString1 |
List of IP addresses for the asset. |
DeviceCustomString1Label |
|
Kaspersky Automated Security Awareness Platform response
Event field name |
Field value |
DeviceAction |
|
DeviceFacility |
|
EventOutcome |
|
Message |
Description of the error, if an error occurred, otherwise the field is empty. |
SourceTranslatedAddress |
This field contains the value of the HTTP header x-real-ip or x-forwarded-for. If these headers are absent, the field will be empty. |
SourceAddress |
The address from which the user logged in. If the user logged in using a proxy, there will be a proxy address. |
SourcePort |
Port from which the user logged in. If the user logged in using a proxy, there will be a port on the proxy side. |
SourceUserName |
Login of the user who sent the request. |
SourceUserID |
ID of the user who sent the request. |
DeviceCustomString1 |
The manager of the user to whom the course is assigned. |
DeviceCustomString1Label |
|
DeviceCustomString3 |
Information about the group where the user belonged. Not available for |
DeviceCustomString3Label |
|
DeviceCustomString4 |
Information about the group where the user was added. |
DeviceCustomString4Label |
|
DeviceCustomString5 |
Tenant ID. |
DeviceCustomString5Label |
|
DeviceCustomString6 |
Tenant name. |
DeviceCustomString6Label |
|
DestinationUserID |
ID of the Active Directory user account which causes the response. |
DestinationUserName |
Account name (sAMAccountName). |
DestinationNtDomain |
Domain of the Active Directory user account which causes the response. |
KEDR response
Event field name |
Field value |
DeviceAction |
|
DeviceFacility |
|
EventOutcome |
|
Message |
Description of the error, if an error occurred, otherwise the field is empty. |
SourceTranslatedAddress |
This field contains the value of the HTTP header x-real-ip or x-forwarded-for. If these headers are absent, the field will be empty. |
SourceAddress |
The address from which the user logged in. If the user logged in using a proxy, there will be a proxy address. |
SourcePort |
Port from which the user logged in. If the user logged in using a proxy, there will be a port on the proxy side. |
SourceUserName |
Login of the user who sent the request. |
SourceUserID |
ID of the user who sent the request. |
SourceAssetID |
KUMA asset ID which causes the response. The value is not specified if the response is based on a hash or for all assets. |
DeviceExternalID |
The external ID assigned to KUMA in KEDR. If there is only one external ID, it is not filled in when started on user hosts. |
DeviceCustomString1 |
List of IP/FQDN addresses of the asset for the host prevention rule based on the selected hash from the event card. |
DeviceCustomString1Label |
|
DeviceCustomString2 |
Sensor ID parameter in KEDR (UUIDv4 | 'all' | 'custom'). |
DeviceCustomString2Label |
|
ServiceID |
ID of the service that caused the response. Filled in only in case of automatic response. |
DeviceCustomString3 |
Task type name: |
DeviceCustomString3Label |
|
DeviceCustomString5 |
Tenant ID. |
DeviceCustomString5Label |
|
DeviceCustomString6 |
Tenant name. |
DeviceCustomString6Label |
|
Correlation rules
The file that can be downloaded by clicking the link describes the correlation rules that are included in the distribution kit of Kaspersky Unified Monitoring and Analysis Platform version 3.4. It provides the scenarios covered by rules, the conditions of their use, and the necessary sources of events.
The correlation rules described in this document are contained in the KUMA distribution in the SOC_package and Network_package files and are protected by passwords: SOC_package1 and Network_package1. Only one of the following versions of the SOC rule set can be used at a time: [OOTB] SOC Content - RU, [OOTB] SOC Content - ENG, [OOTB] SOC Content - RU for KUMA 3.4 or [OOTB] SOC Content - ENG for KUMA 3.4, [OOTB] Network Package - RU, or [OOTB] Network Package - ENG.
You can import correlation rules into KUMA. See the Importing resources section of the Online Help: https://support.kaspersky.com/KUMA/3.4/en-US/242787.htm.
You can add imported correlation rules to correlators that your organization uses. See the Online Help section Step 3. Correlation: https://support.kaspersky.com/KUMA/3.4/en-US/221168.htm.
Download a description of correlation rules
Description of correlation rule packages
The distribution kit of Kaspersky Unified Monitoring and Analysis Platform 3.2 includes the correlation rule packages listed in the table below.
Correlation rule packages
Package name |
Description |
|---|---|
[OOTB] SOC Content - RU |
Correlation rule package for KUMA version 2.1 or later with Russian localization. This package is no longer supported. |
[OOTB] SOC Content - ENG |
Correlation rule package for KUMA version 2.1 or later with English localization. This package is no longer supported. |
[OOTB] SOC Content - RU for KUMA 3.2 |
Correlation rule package for KUMA version 3.2 or later with Russian localization. The rules contain information about MITRE ATT&CK matrix coverage. |
[OOTB] SOC Content - ENG for KUMA 3.2 |
Correlation rule package for KUMA version 3.2 or later with English localization. The rules contain information about the MITRE ATT&CK matrix coverage. |
[OOTB] Network Package - RU |
Package of correlation rules aimed at detecting network activity anomalies, for KUMA version 3.2 and later with Russian localization. The rules contain information about MITRE ATT&CK matrix coverage. |
[OOTB] Network Package - ENG |
Package of correlation rules aimed at detecting network activity anomalies, for KUMA version 3.2 and later with English localization. The rules contain information about the MITRE ATT&CK matrix coverage. |
Automatic rule suppression
The SOC_package correlation rules package allows automatically suppressing the triggering of rules if the triggering frequency exceeds thresholds.
The automatic suppression option works as follows: if a rule is triggered more than 100 times in 1 minute and this behavior occurs at least 5 times in the span of 10 minutes, the rule is added to the stop list.
- When placed in the stop list for the first time, the rule is disabled for 1 hour.
- If this happens again, it is placed in the list for 24 hours.
- All subsequent occurrences place it in the list for 7 days.
The logic is described in the resources: rules, active lists, and dictionaries, which are located in the "SOC_package/System/Rule disabling by condition" directory.
You can customize settings and thresholds in accordance with your requirements.
To enable the automatic suppression option, set the enable setting to 1 in the "SOC_package/Integration/Rule disabling configuration" dictionary.
To disable the automatic suppression option, set the enable setting to 0 in the "SOC_package/Integration/Rule disabling configuration" dictionary.
By default, automatic suppression is enabled and the enable setting is set to 1.
Audit events
Correlation rules from the "[OOTB] SOC Content" resource set use the audit events that are listed in the table below.
Audit events
Event source |
Audit events |
|---|---|
CheckPoint |
Anti Malware, Threat Emulation |
Cisco ASA, FTD, PIX |
106021, 320001, 322001, 322002, 322003, 405001, 405002 |
CyberTrace |
alert |
DNS |
query |
KATA |
TAA has tripped on events database |
KSC |
GNRL_EV_ATTACK_DETECTED, GNRL_EV_SUSPICIOUS_OBJECT_FOUND, GNRL_EV_VIRUS_FOUND, GNRL_EV_WEB_URL_BLOCKED, KLSRV_HOST_STATUS_CRITICAL, KLSRV_HOST_STATUS_OK, KLSRV_HOST_STATUS_WARNING |
KSMG |
LMS_EV_SCAN_LOGIC_AV_STATUS, LMS_EV_SCAN_LOGIC_KT_STATUS, LMS_EV_SCAN_LOGIC_CF_STATUS, LMS_EV_SCAN_LOGIC_AP_STATUS |
KUMA |
Correlation rule |
Windows Event Log Powershell |
4103, 4104 |
Windows Event Log Security |
1102, 4624, 4625, 4656, 4657, 4662, 4663, 4672, 4688, 4697, 4720, 4722, 4723, 4724, 4725, 4726, 4727, 4728, 4729, 4730, 4731, 4732, 4733, 4734, 4735, 4737, 4738, 4768, 4769, 4771, 5136, 5140, 5145 |
Windows Event Log System |
7036, 7045 |
Windows Event Log Defender |
1006, 1015, 1116, 1117, 5001, 5010, 5012, 5101 |
Netflow, FW |
Traffic log |
Palo Alto |
virus |
auditd |
ADD_USER, DEL_USER, PATH, SYSCALL, USER_AUTH, USER_LOGIN, execve |
Sending test events to KUMA
KUMA allows sending test events to the system. Use the option of sending test events to KUMA to test rules, reports, dashboards, and also to check the resource consumption of the collector with different event streams. Events can only be sent to a collector that receives events over TCP or HTTP.
To send test events, you need:
- The 'kuma' file started with certain options.
In the following instructions, the file with raw events is named send_test_events.txt as an example. You can use your own file name.
- A configuration file in which you define the parameters for running the executable file.
In the following instructions, the configuration file is named config_for_test_events as an example. You can use your own file name.
To send test events:
- Get sample events to send to KUMA:
- In the KUMA web interface, in the Events section, in the upper right corner, click the icon and in the displayed window, on the Event fields columns tab, select the check box for the Raw field. The 'Raw' column is displayed in the Events window.
- Search for events.
- Export your search results: in the Events window, in the upper right corner, click
 and select Export TSV.
 - Go to the KUMA Task manager section and click the Export events task; in the context menu, select Download.
The <
name of file with exported events>.tsv file is displayed in the Downloads section.If you are not collecting raw events, enable collection for a short time by setting the Keep raw event setting of the normalizer to Always. After the collection is completed, restore the previous value of the Keep raw event setting.
- Create a text file named send_test_events.txt and copy the contents of the
Rawfield from <name of file with exported events>.tsv to a text file named send_test_events.txt. - Save send_test_events.txt.
- In the KUMA web interface, in the Events section, in the upper right corner, click the
- Create a config_for_test_events configuration file and add the following lines to the file:
{"kind": "<tcp or http>","name": "-","connection": {"name": "-","kind": "<tcp or http>","urls": ["<IP address of the KUMA collector for receiving events over TCP>:<port of the KUMA collector for receiving event over TCP>"]}}Save the config_for_test_events configuration file.
- Ensure that network connectivity exists between the server sending events and the server on which the collector is installed.
- To send the contents of the test event file to the KUMA collector, run the following command:
/opt/kaspersky/kuma/kuma tools load --raw --events /home/events/send_test_events.txt --cfg home/events/config_for_test_events --limit 1500 --replay 100000Available settings
Setting
Description
--eventsFull path to the file containing raw events.
Required setting. If the full path is not specified, the command does not run.
--cfgPath to the configuration file.
Required setting. If the full path is not specified, the command does not run.
--limitStream to be sent to the collector, in events per second (EPS).
Required setting. If no value is specified, the command does not run.
--replayNumber of events to send.
Required setting. If no value is specified, the command does not run.
The step for --replay is 10000. The minimum value is 10000.
--replay 16 sends 10000 events.
--replay 16000 sends 20000 events.
As a result of running the command, test events are successfully sent to the KUMA collector. You can verify the arrival of test events by searching for related events in the KUMA web interface.
Page top
Time format
KUMA supports processing information passed to the fields of the event data model with the timestamp type (EndTime, StartTime, DeviceCustomDate1, etc) in the following formats:
- "May 8, 2009 5:57:51 PM",
- "oct 7, 1970",
- "oct 7, '70",
- "oct. 7, 1970",
- "oct. 7, 70",
- "Mon Jan 2 15:04:05 2006",
- "Mon Jan 2 15:04:05 MST 2006",
- "Mon Jan 02 15:04:05 -0700 2006",
- "Monday, 02-Jan-06 15:04:05 MST",
- "Mon, 02 Jan 2006 15:04:05 MST",
- "Tue, 11 Jul 2017 16:28:13 +0200 (CEST)",
- "Mon, 02 Jan 2006 15:04:05 -0700",
- "Mon 30 Sep 2018 09:09:09 PM UTC",
- "Mon Aug 10 15:44:11 UTC+0100 2015",
- "Thu, 4 Jan 2018 17:53:36 +0000",
- "Fri Jul 03 2015 18:04:07 GMT+0100 (GMT Daylight Time)",
- "Sun, 3 Jan 2021 00:12:23 +0800 (GMT+08:00)",
- "September 17, 2012 10:09am",
- "September 17, 2012 at 10:09am PST-08",
- "September 17, 2012, 10:10:09",
- "October 7, 1970",
- "October 7th, 1970",
- "12 Feb 2006, 19:17",
- "12 Feb 2006 19:17",
- "14 May 2019 19:11:40.164",
- "7 oct 70",
- "7 oct 1970",
- "03 February 2013",
- "1 July 2013",
- "2013-Feb-03".
dd/Mon/yyyy format
- "06/Jan/2008:15:04:05 -0700",
- "06/Jan/2008 15:04:05 -0700".
mm/dd/yyyy format
- "3/31/2014",
- "03/31/2014",
- "08/21/71",
- "8/1/71",
- "4/8/2014 22:05",
- "04/08/2014 22:05",
- "4/8/14 22:05",
- "04/2/2014 03:00:51",
- "8/8/1965 12:00:00 AM",
- "8/8/1965 01:00:01 PM",
- "8/8/1965 01:00 PM",
- "8/8/1965 1:00 PM",
- "8/8/1965 12:00 AM",
- "4/02/2014 03:00:51",
- "03/19/2012 10:11:59",
- "03/19/2012 10:11:59.3186369".
yyyy/mm/dd format
- "2014/3/31",
- "2014/03/31",
- "2014/4/8 22:05",
- "2014/04/08 22:05",
- "2014/04/2 03:00:51",
- "2014/4/02 03:00:51",
- "2012/03/19 10:11:59",
- "2012/03/19 10:11:59.3186369".
yyyy:mm:dd format
- "2014:3:31",
- "2014:03:31",
- "2014:4:8 22:05",
- "2014:04:08 22:05",
- "2014:04:2 03:00:51",
- "2014:4:02 03:00:51",
- "2012:03:19 10:11:59",
- "2012:03:19 10:11:59.3186369".
Format containing Chinese characters
"2014年04月08日"
yyyy-mm-ddThh format
- "2006-01-02T15:04:05+0000",
- "2009-08-12T22:15:09-07:00",
- "2009-08-12T22:15:09",
- "2009-08-12T22:15:09.988",
- "2009-08-12T22:15:09Z",
- "2017-07-19T03:21:51:897+0100",
- "2019-05-29T08:41-04" without seconds, 2-character TZ.
yyyy-mm-dd hh:mm:ss format
- "2014-04-26 17:24:37.3186369",
- "2012-08-03 18:31:59.257000000",
- "2014-04-26 17:24:37.123",
- "2013-04-01 22:43",
- "2013-04-01 22:43:22",
- "2014-12-16 06:20:00 UTC",
- "2014-12-16 06:20:00 GMT",
- "2014-04-26 05:24:37 PM",
- "2014-04-26 13:13:43 +0800",
- "2014-04-26 13:13:43 +0800 +08",
- "2014-04-26 13:13:44 +09:00",
- "2012-08-03 18:31:59.257000000 +0000 UTC",
- "2015-09-30 18:48:56.35272715 +0000 UTC",
- "2015-02-18 00:12:00 +0000 GMT",
- "2015-02-18 00:12:00 +0000 UTC",
- "2015-02-08 03:02:00 +0300 MSK m=+0.000000001",
- "2015-02-08 03:02:00.001 +0300 MSK m=+0.000000001",
- "2017-07-19 03:21:51+00:00",
- "2014-04-26",
- "2014-04",
- "2014",
- "2014-05-11 08:20:13,787".
yyyy-mm-dd-07:00 format
"2020-07-20+08:00"
mm.dd.yyyy format
- "3.31.2014",
- "03.31.2014",
- "08.21.71".
yyyy.mm.dd format
- "2014.03.30"
yyyymmdd format and similar
- "20140601",
- "20140722105203".
yymmdd hh:mm:yy format
"171113 14:14:20"
Unix timestamp format
- "1332151919",
- "1384216367189",
- "1384216367111222",
- "1384216367111222333".
Mapping fields of predefined normalizers
The file available via the download link contains a description of the field mapping of preset normalizers.
Download Description of field mapping of preset normalizers.
Page top
Deprecated resources
List of deprecated resources
Name |
Resource type |
Description |
|---|---|---|
[Deprecated][OOTB] Microsoft SQL Server xml |
Normalizer |
This normalizer was removed from the resource set in KUMA 3.2. If you were using this normalizer, you must migrate to the [OOTB] Microsoft Products for KUMA 3 normalizer. |
[Deprecated][OOTB] Windows Basic |
Normalizer |
This normalizer was removed from the resource set in KUMA 3.2. If you were using this normalizer, you must migrate to the [OOTB] Microsoft Products for KUMA 3 normalizer. |
[Deprecated][OOTB] Windows Extended v.0.3 |
Normalizer |
This normalizer was removed from the resource set in KUMA 3.2. If you were using this normalizer, you must migrate to the [OOTB] Microsoft Products for KUMA 3 normalizer. |
[Deprecated][OOTB] Cisco ASA Extended v 0.1 |
Normalizer |
This normalizer was removed from the resource set in KUMA 3.2. If you were using this normalizer, you must migrate to the [OOTB] Cisco ASA and IOS syslog normalizer. |
[Deprecated][OOTB] Cisco Basic |
Normalizer |
This normalizer was removed from the resource set in KUMA 3.2. If you were using this normalizer, you must migrate to the [OOTB] Cisco ASA and IOS syslog normalizer. |
[Deprecated][OOTB] Linux audit and iptables syslog |
Normalizer |
This normalizer was removed from the resource set in KUMA 3.4. In KUMA 3.2, we recommend using the [OOTB] Linux auditd syslog for KUMA 3.2 normalizer. |
[Deprecated][OOTB] Linux audit.log file |
Normalizer |
This normalizer was removed from the resource set in KUMA 3.4. In KUMA 3.2, we recommend using the [OOTB] Linux auditd file for KUMA 3.2 normalizer. |
[OOTB] Checkpoint Syslog CEF by CheckPoint |
Normalizer |
This normalizer was removed from the resource set in KUMA 3.4. In KUMA 3.4 and newer versions, we recommend using the [OOTB] Checkpoint syslog normalizer. |
[OOTB] Eltex MES Switches |
Normalizer |
This normalizer was removed from the resource set in KUMA 3.4. In KUMA 3.4 and newer versions, we recommend using the [OOTB] Eltex MES syslog, [OOTB] Eltex ESR syslog normalizers. |
[OOTB] PTsecurity NAD |
Normalizer |
This normalizer was removed from the resource set in KUMA 3.4. In KUMA 3.4 and newer versions, we recommend using the [OOTB] PTsecurity NAD json normalizer. |
[OOTB][AD] Granted TGS without TGT (Golden Ticket) |
Rule |
The rule was removed from the KUMA 3.4 resource set. |
[OOTB][AD] Possible Kerberoasting attack |
Rule |
The rule was removed from the KUMA 3.4 resource set. |
[OOTB][AD][Technical] 4768. TGT Requested |
Rule |
The rule was removed from the KUMA 3.4 resource set. |
[OOTB][AD] List of requested TGT. EventID 4768 |
Active list |
The list was removed from the KUMA 3.4 resource set. |
Generating events for testing a normalizer
If necessary, you can generate your own example events to test your normalizer. Such testing makes it easier to write regular expressions and lets you see which values end up in the KUMA event fields.
Keep in mind the following special considerations:
- This tests simulates event processing. Example events in the Example event field are intended for displaying examples in the Field mapping section. Examples of the parent normalizer are used to generate examples of child normalizers, taking into account the Field to pass into normalizer setting.
- Mutations cannot be applied.
To test the normalizer, you need to add an example event to the Event examples field in the selected normalizer and start generating events by using the relevant command. As a result of running the command, KUMA takes the example event from the Example event field and sends events to the normalizer with the specified interval. If necessary, you can specify multiple examples to get events for multiple examples.
To test the normalizer:
- Select the collector that you want to use for testing:
- If the collector is installed on the server and running, stop the collector service:
sudo systemctl stop kuma-collector-<collector service ID copied from the KUMA web interface>.service - If the collector is not running, or is in the process of being created or edited, proceed to the next step.
- If the collector is installed on the server and running, stop the collector service:
- In the collector creation wizard, if necessary, fill in or edit the required fields at the Connect event sources step and at the Transport step, then proceed to the Parsing step:
- Link a normalizer by selecting it from the drop-down list, or create a normalizer.
- In the Event examples field, add example events. For example, for a json normalizer, you can add the following value:
{"name": "test_events", "address": "10.12.12.31"}. You can specify multiple examples if you want to receive events for multiple examples in the same normalizer. Events are generated for each example.
- In the Collector Installation Wizard, go to the Routing step and specify the storage where you want to save test events.
- Review the collector settings and click Save.
- Go to the Active services section in KUMA and click Add to add a collector. This opens the Choose a service window; in that window, select the collector and click Create service. The collector is displayed in the Active services list.
- Check the status of the collector to which events are being sent. The collector status should be red.
- Run the event generation command with the necessary parameters:
- If the collector is not installed on the server, but only added in the Active services section:
sudo /opt/kaspersky/kuma/kuma collector --core <FQDN of the KUMA Core server>:<port used by the KUMA Core for internal communication (port 7210 is used by default)> --generator.interval <interval in seconds for generating and sending events> --id <collector service ID copied from the KUMA web interface> --api.port <number of a free, unused API port>If the value of the event generation and sending interval is not specified or it is set to zero, events are not generated.
- If the collector is installed on the server:
sudo /opt/kaspersky/kuma/kuma collector --generator.interval <value of the event generation and sending interval in seconds> --id <collector service ID copied from the KUMA web interface> --api.port <number of a free, unused API port>If the value of the event generation and sending interval is not specified or it is set to zero, events are not generated.
- If the collector is not installed on the server, but only added in the Active services section:
As a result, KUMA generates events and sends them to the normalizer, observing the specified interval.
You can verify that events have been created and satisfy your expectations in the Events section. For additional information about the check, see the /etc/systemd/system/multi-user.target.wants/kuma-collector-<collector service ID copied from the KUMA web interface>.service file.
If the result does not meet expectations, modify the example event:
- If the collector is not installed on the server and has only been in the Active services section, edit the Event examples field in the normalizer of the collector and save the collector settings.
- If the collector is installed on the server and stopped as a service, edit the Event examples field in the normalizer of the collector, save the collector settings, go to the Active services section, select the collector, and refresh the collector settings by clicking Refresh.
If the result meets expectations:
- Disable event generation, for example, by pressing Ctrl+C on the command line.
- Start the collector service; if the service is already installed on the server, but has been stopped:
sudo systemctl start kuma-collector-<collector service ID copied from the KUMA web interface>.service - If the collector has only been added in the Active services section, but has not been installed on the server yet, install the collector on the server using the following command:
sudo /opt/kaspersky/kuma/kuma collector --core <FQDN of the KUMA Core server>:<port used by KUMA Core server for internal communication (port 7210 by default)> --id <collector service ID copied from the KUMA web interface> --api.port <port used for communication with the installed component> --install
Information about third-party code
Information about third-party code is in the LEGAL_NOTICES file located in the /opt/kaspersky/kuma/LEGAL_NOTICES folder.
Page top
Trademark notices
Registered trademarks and service marks are the property of their respective owners.
AMD is a trademark or registered trademark of Advanced Micro Devices, Inc.
Apache and Apache Cassandra are either registered trademarks or trademarks of the Apache Software Foundation.
Ubuntu, LTS are registered trademarks of Canonical Ltd.
Cisco, IOS, Snort are registered trademarks or trademarks of Cisco Systems, Inc. and/or its affiliates in the United States and certain other countries.
Citrix, Citrix NetScaler are either a registered trademark or a trademark of Cloud Software Group, Inc., and/or its subsidiaries in the United States and/or other countries.
Dameware is the exclusive property of SolarWinds Worldwide, LLC or its affiliates, is registered with the U.S. Patent and Trademark Office, and may be registered or pending registration in other countries.
Dell Technologies, Dell, and other trademarks are trademarks of Dell Inc or its subsidiaries.
The Grafana word mark and the Grafana logo are either registered trademarks/service marks or trademarks/service marks of Coding Instinct AB, in the United States and other countries and are used with Coding Instinct’s permission. We are not affiliated with, endorsed or sponsored by Coding Instinct, or the Grafana community. We are not affiliated with, endorsed, or sponsored by Coding Instinct, or the Grafana community.
Elasticsearch is a trademark of Elasticsearch BV, registered in the U.S. and in other countries.
ESET is a trademark or registered trademark of ESET spol. s r.o. or the relevant ESET company.
F5 is a trademark of F5 Networks, Inc. in the U.S. and in certain other countries.
Firebird is a registered trademark of the Firebird Foundation.
Fortinet, FortiGate, FortiMail, FortiSOAR are either registered trademarks or trademarks of Fortinet, Inc. in the United States and/or other countries.
The FreeBSD mark is a registered trademark of The FreeBSD Foundation.
Google, Chrome, Google Chrome are trademarks of Google LLC.
HUAWEI, Huawei Eudemon are trademarks of Huawei Technologies Co., Ltd.
IBM, Guardium, InfoSphere are trademarks of International Business Machines Corporation, registered in many jurisdictions worldwide.
Intel, Core are trademarks of Intel Corporation or its subsidiaries.
Juniper Networks and JUNOS are trademarks or registered trademarks of Juniper Networks, Inc. in the United States and other countries.
Linux is the registered trademark of Linus Torvalds in the U.S. and other countries.
Microsoft, Active Directory, Azure, Excel, Halo, Hyper-V, Lync, Office 365, Outlook, PowerShell, SharePoint, Skype, SQL Server, Windows, Windows PowerShell, and Windows Server are trademarks of the Microsoft group of companies.
Mozilla and Firefox are trademarks of the Mozilla Foundation in the U.S. and other countries.
NetApp is a trademark or registered trademark of NetApp, Inc. in the United States and/or other countries.
Netskope, the Netskope logo, and other Netskope product names referenced herein are trademarks of Netskope, Inc. and/or one of its subsidiaries, and may be registered in the United States Patent and Trademark Office and in other countries.
OpenSSL is a trademark owned by the OpenSSL Software Foundation.
OpenVPN is a registered trademark of OpenVPN, Inc.
Oracle is a registered trademark of Oracle and/or its affiliates.
Python is a trademark or registered trademark of the Python Software Foundation.
Red Hat, Red Hat Enterprise Linux, CentOS are trademarks or registered trademarks of Red Hat, Inc. or its subsidiaries in the United States and other countries.
Ansible is a registered trademark of Red Hat, Inc. in the United States and other countries.
Sendmail, and other product designations or names are trademarks or registered trademarks of Sendmail, Inc.
Debian is a registered trademark of Software in the Public Interest, Inc.
The CommuniGate Pro name is a trademark or registered trademark of Stalker Software, Inc.
Symantec is a trademark or registered trademark of Symantec Corporation or its affiliates in the U.S. and other countries.
OpenAPI is a trademark of The Linux Foundation.
Kubernetes is a registered trademark of The Linux Foundation in the United States and other countries.
Rocky Linux is a trademark of The Rocky Enterprise Software Foundation.
Trend Micro is a trademark or registered trademark of Trend Micro Incorporated.
The names, images, logos and pictures identifying UserGate’s products and services are proprietary marks of UserGate and/or its subsidiaries or affiliates, and the products themselves are proprietary to UserGate.
UNIX is a registered trademark in the United States and other countries, licensed exclusively through X/Open Company Limited.
ClickHouse is a trademark of YANDEX LLC.
Zabbix is a registered trademark of Zabbix SIA.
ViPNet is a registered trademark of Infotecs.
Page topGlossary
Aggregation
Combining several messages of the same type from the event source into a single event.
Cluster
A group of servers on which the KUMA application has been installed and that have been clustered together for centralized management using the application's web interface.
Collector
KUMA component that receives messages from event sources, processes them, and transmits them to a storage, correlator, and/or third-party services to identify suspected information security incidents (alerts).
Connector
A KUMA component that ensures transport for receiving data from external systems.
Correlation rule
KUMA resource used to recognize defined sequences of processed events and perform specific actions after recognition.
Dashboard
Component of the KUMA system that performs data visualization.
Enrichment
The conversion of the textual representation of an event using dictionaries, constants, calls to the DNS service, and other tools.
Event
An instance of activity of network devices, application software, information security tools, operating systems, and other devices that can be detected and recorded. For example, events include: successful user logon events, log clear events, anti-virus software disable event.
Filter
The set of conditions the application uses to select events for further processing.
KUMA web interface
A KUMA service that provides a user interface to configure and track KUMA operations.
Network port
A TCP and UDP protocol setting that defines the destination of IP-format data packets that are transmitted to a host over a network and allows various applications running on the same host to receive the data independently of each other. Each application processes the data sent to a specific port (sometimes it is said that the application listens to this port number).
It's standard practice to assign standard port numbers to certain common network protocols (for example, web servers usually receive data over HTTP on TCP port 80), although in general an application can use any protocol on any port. Possible values: from 1 to 65,535.
Normalization
A process that formats data received from an event in accordance with the fields of the KUMA event data model. During normalization, the data may be modified in accordance with certain rules (for example, changing upper case characters to lower case, replacing certain sequences of characters with others, etc.).
Normalizer
System component responsible for processing raw events from event sources. One normalizer processes events from one device or software of one specific version.
Parsing
The process of organizing data and converting incoming events into KUMA format.
Raw event
An event that has not passed the normalization stage in KUMA.
Report
KUMA resource that is used to generate a dataset based on user-defined filter criteria.
Role
A set of access privileges established to grant the KUMA web interface user the authority to perform tasks.
SELinux (Security-Enhanced Linux)
A system for controlling process access to operating system resources based on the use of security policies.
SIEM
Security Information and Event Management system. A solution for managing information and events in a company's security system.
STARTTLS
Text exchange protocol enhancement that lets you create an encrypted connection (TLS or SSL) directly over an ordinary TCP connection instead of opening a separate port for the encrypted connection.
UserPrincipalName
UserPrincipalName (UPN)—user name in email address format, such as username@domain.com.
The UPN must match the actual email address of the user. In this example, username is the user name in the Active Directory domain (user logon name), and domain.com is the UPN suffix. They are separated by the @ character. The DNS name of the Active Directory domain is used as the default UPN suffix in Active Directory.