Contents
- KUMA services
- Services tools
- Service resource sets
- Creating a storage
- Creating a correlator
- Creating an event router
- Creating a collector
- Predefined collectors
- Creating an agent
- Creating a set of resources for an agent
- Managing connections for an agent
- Creating an agent service in the KUMA web interface
- Installing an agent in a KUMA network infrastructure
- Automatically created agents
- Update agents
- Transferring events from isolated network segments to KUMA
- Transferring events from Windows machines to KUMA
- AI services
KUMA services
Services are the main components of KUMA that help the system to manage events: services allow you to receive events from event sources and subsequently bring them to a common form that is convenient for finding correlation, as well as for storage and manual analysis. Each service consists of two parts that work together:
- One part of the service is created in the KUMA web interface based on a resource set for services.
- The second part of the service is installed in the network infrastructure where the KUMA system is deployed as one of its components. The server part of a service can consist of multiple instances: for example, services of the same agent or storage can be installed on multiple devices at once.
On the server side, KUMA services are located in the
/opt/kaspersky/kumadirectory.When you install KUMA in high availability mode, only the KUMA Core is installed in the cluster. Collectors, correlators, and storages are hosted on hosts outside of the Kubernetes cluster.
Parts of services are connected to each other via the service ID.
Service types:
- Storages are used to save events.
- Correlators are used to analyze events and search for defined patterns.
- Collectors are used to receive events and convert them to KUMA format.
- Agents are used to receive events on remote devices and forward them to KUMA collectors.
In the KUMA web interface, services are displayed in the Resources → Active services section in table format. The table of services can be updated using the Refresh button and sorted by columns by clicking on the active headers. You can also configure the columns displayed in the table. To do so, click the gear button in the upper-right corner to display a drop-down list. In that drop-down list, select check boxes next to the names of the columns that you want to display in the table. You can leave any single column in the list to be displayed.
The maximum table size is not limited. If you want to select all services, scroll to the end of the table and select the Select all check box, which selects all available services in the table.
Table columns:
- Status—service status:
- Green means the service is running and accessible from the Core server.
- Red means the service is not running or is not accessible from the Core server.
- Yellow is the status that applies to all services except the agent. The yellow status means that the service is running, but there are errors in the service log, or there are alerts for the service from Victoria Metrics. You can view the error message by hovering the mouse cursor over the status of the service in the Active services section.
- Purple is the status that is applied to running services whose configuration file in the database has changed, but that have no other errors. If a service has an incorrect configuration file and has errors, for example, from Victoria Metrics, status of the service is yellow.
- Gray means that if a deleted tenant had a running service that is still running, that service is displayed with a gray status on the Active services page. Services with the gray status are kept when you delete the tenant to let you copy the ID and remove services on your servers. Only the General administrator can delete services with the gray status. When a tenant is deleted, the services of that tenant are assigned to the Main tenant.
- Type—type of service: agent, collector, correlator, storage, event router.
- Name—name of the service. Clicking on the name of the service opens its settings.
- Version—service version.
- Tenant—the name of the tenant that owns the service.
- FQDN—fully qualified domain name of the service server.
- IP address—IP address of the server where the service is installed.
- API port—Remote Procedure Call port number.
- Uptime—Uptime of the service.
- Created—the date and time when the service was created.
- UUID—Unique ID of the service.
By default, this column is not displayed in the table. You can add it to the table by clicking the gear icon in the upper-right part of the table of services and selecting the check box next to the name of the UUID column in the drop-down list.
You can sort data in the table in ascending and descending order, as well as by the Status parameter and by the service type in the Type column. To sort active services, right-click the context menu and select one or more statuses and a type.
You can use the buttons in the upper part of the Services window to perform the following group actions:
- Add service
You can create new services based on existing service resource sets. We do not recommend creating services outside the main tenant without first carefully planning the inter-tenant interactions of various services and users.
- Refresh
You can refresh the list of active services.
- Update configuration
The Update settings button is not available if the KUMA Core service is among the services selected for group actions or if any of the selected services has the grey status. To make the Update settings button available for group actions, clear the check box from the KUMA Core service and services with the grey status.
- Restart
To perform an action with an individual service, right-click the service to display its context menu. The following actions are available:
- Reset certificate
- Delete
- Download log
If you want to receive detailed information, enable the Debug mode in the service settings.
- Copy service ID
You need this ID to install, restart, stop, or delete the service.
- Go to Events
- Go to active lists
- Go to context tables
- Go to partitions
To change a service, select a service under Resources → Active services. This opens a window with a resource set based on which the service was created. You can edit the settings of the resource set and save your changes. To apply the saved changes, restart the service.
If, when changing the settings of a collector resource set, you change or delete conversions in a normalizer connected to it, the edits will not be saved, and the normalizer itself may be corrupted. If you need to modify conversions in a normalizer that is already part of a service, the changes must be made directly to the normalizer under Resources → Normalizers in the web interface.
Services tools
This section describes the tools for working with services available in the Resources → Active services section of the KUMA web interface.
Getting service identifier
The service identifier is used to bind parts of the service residing within KUMA and installed in the network infrastructure into a single complex. An identifier is assigned to a service when it is created in KUMA, and is then used when installing the service to the server.
To get the identifier of a service:
- Log in to the KUMA web interface and open Resources → Active services.
- Select the check box next to the service whose ID you want to obtain, and click Copy ID.
The identifier of the service will be copied to the clipboard. For instance, this ID can be used to install the service on a server.
Page topStopping, starting, checking status of the service
While managing KUMA, you may need to perform the following operations.
- Temporarily stop the service. For example, when restoring the Core from backup, or to edit service settings related to the operating system.
- Start the service.
- Check the status of the service.
The table below lists commands that may be useful while managing KUMA.
Commands for stopping, starting, and checking the status of a service
Service |
Stop service |
Start service |
Check the status of the service |
|---|---|---|---|
Core |
|
|
|
Services with an ID:
|
|
|
|
Services without an ID:
|
|
|
|
Windows agents |
To stop an agent service: 1. Copy the agent ID in the KUMA web interface. 2. Connect to the host on which you want to start the KUMA agent service. 3. Run PowerShell as an account that has administrative privileges. 4. Run the following command in PowerShell:
|
To start an agent service: 1. Copy the agent ID in the KUMA web interface. 2. Connect to the host on which you want to start the KUMA agent service. 3. Run PowerShell as an account that has administrative privileges. 4. Run the following command in PowerShell:
|
To view the status of an agent service: 1. In Windows, go to the Start → Services menu, and in the list of services, double-click the relevant KUMA agent. 2. This opens a window; in that window, view the status of the agent in the Service status field. |
Restarting the service
To restart the service:
- Log in to the KUMA web interface and open Resources → Active services.
- Select the check box next to the service and select the necessary option:
- Update configuration—perform a hot update of a running service configuration. For example, you can change the field mapping settings or the destination point settings this way.
- Restart—stop a service and start it again. This option is used to modify the port number or connector type.
Restarting KUMA agents:
- KUMA Windows Agent can be restarted as described above only if it is running on a remote computer. If the service on the remote computer is inactive, you will receive an error when trying to restart from KUMA. In that case you must restart KUMA Windows Agent service on the remote Windows machine. For information on restarting Windows services, refer to the documentation specific to the operating system version of your remote Windows computer.
- KUMA Agent for Linux stops when this option is used. To start the agent again, you must execute the command that was used to start it.
- Reset certificate—remove certificates that the service uses for internal communication. This option may not be used to renew the Core certificate. To renew KUMA Core certificates, they must be reissued.
Special considerations for deleting Windows agent certificates:
- If the agent has the green status and you select Reset certificate, KUMA deletes the current certificate and creates a new one, the agent continues working with the new certificate.
- If the agent has the red status and you select Reset certificate, KUMA generates an error that the agent is not running. In the %PROGRAMDATA%\Kaspersky Lab\KUMA\agent\<agent ID>\certificates folder, manually delete the internal.cert and internal.key files and start the agent manually. When the agent starts, a new certificate is created automatically.
Special considerations for deleting Linux agent certificates:
- Regardless of the agent status, apply the Reset certificate option in the web interface to delete the certificate in the databases.
- In the agent installation directory, /opt/kaspersky/agent/<Agent ID>/certificates, manually delete the internal.cert and internal.key files.
- Since the Reset certificate option stops the agent, to continue its operation, start the agent manually. When the agent starts, a new certificate is created automatically.
Deleting the service
Before deleting the service get its ID. The ID will be required to remove the service for the server.
To remove a service in the KUMA web interface:
- Log in to the KUMA web interface and open Resources → Active services.
- Select the check box next to the service you want to delete, and click Delete.
A confirmation window opens.
- Click OK.
The service has been deleted from KUMA.
To remove a service from the server, run the following command:
sudo /opt/kaspersky/kuma/kuma <collector/correlator/storage> --id <service ID> --uninstall
The service has been deleted from the server.
Partitions window
If the storage service was created and installed, you can view its partitions in the Partitions table.
To open Partitions table:
- Log in to the KUMA web interface and open Resources → Active services.
- Select the check box next to the relevant storage and click Go to partitions.
The Partitions table opens.
The table has the following columns:
- Tenant—the name of the tenant that owns the stored data.
- Created—partition creation date.
- Space—the name of the space.
- Size—the size of the space.
- Events—the number of stored events.
- Transfer to cold storage—the date when data will be migrated from the ClickHouse clusters to cold storage disks.
- Expires—the date when the partition expires. After this date, the partition and the events it contains are no longer available.
You can delete partitions.
To delete a partition:
- Open the Partitions table (see above).
- Open the
 drop-down list to the left from the required partition.
 - Select Delete.
A confirmation window opens.
- Click OK.
The partition has been deleted. Audit event partitions cannot be deleted.
Page topSearching for related events
You can search for events processed by the Correlator or the Collector services.
To search for events related to the Correlator or the Collector service:
- Log in to the KUMA web interface and open Resources → Active services.
- Select the check box next to the required correlator or collector and click Go to Events.
This opens a new browser tab with the KUMA Events section open.
- To find events, click the
 icon.
icon.A table with events selected by the search expression
ServiceID = <ID of the selected service> will be displayed.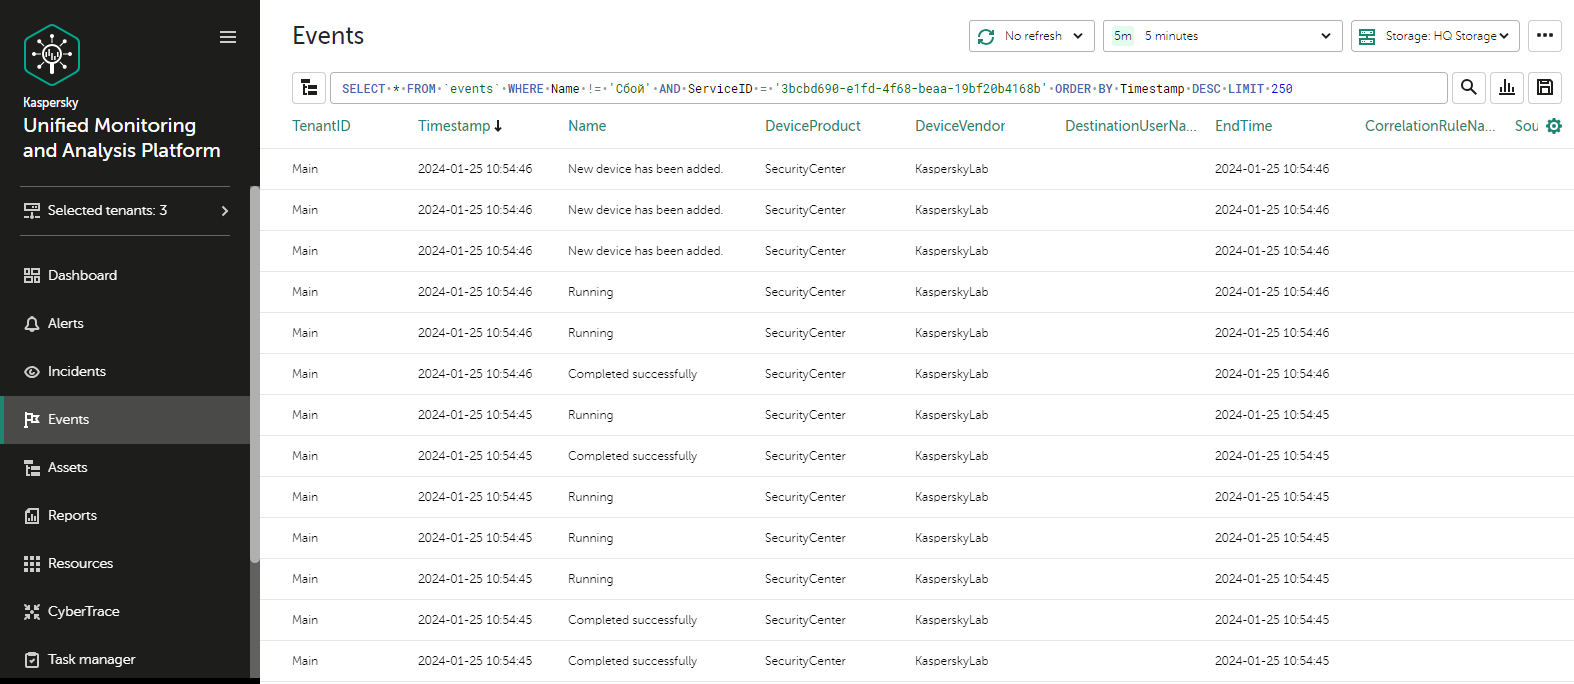
Event search results
When searching for events, you may encounter the following shard unavailability error:
Code: 279. DB::NetException: All connection tries failed. Log: \\n\\nTimeout exceeded while connecting to socket (host.example.com:port, connection timeout 1000 ms)\\nTimeout exceeded while connecting to socket (host.example.com:port, connection timeout 1000 ms)\\nTimeout exceeded while connecting to socket (host.example.com:port, connection timeout 1000 ms)\\n\\n: While executing Remote. (ALL_CONNECTION_TRIES_FAILED) (version 23.8.8.207)\\n\"}",
In this case, you need to override the ClickHouse configuration in storage settings.
To override the ClickHouse configuration:
- In the KUMA web interface, in the Resources → Storages section, click the storage resource that you want to edit.
This opens the Edit storage window.
- To skip unavailable shards when searching, insert the following lines into the ClickHouse configuration override field:
<profiles>
<default>
<skip_unavailable_shards>1</skip_unavailable_shards>
</default>
</profiles>
- To apply the ClickHouse configuration, click Save.
- Restart the storage services that depend on this resource.
This resolves the shard unavailability error, and you can proceed to search for events processed by a particular correlator or collector.
Page topService resource sets
Service resource sets are a resource type, a KUMA component, a set of settings based on which the KUMA services are created and operate. Resource sets for services are collections of resources.
Any resources added to a resource set must be owned by the same tenant that owns the created resource set. An exception is the shared tenant, whose owned resources can be used in the sets of resources of other tenants.
Resource sets for services are displayed in the Resources → <Resource set type for the service> section of the KUMA web interface. Available types:
- Collectors
- Correlators
- Storages
- Agents
When you select the required type, a table opens with the available sets of resources for services of this type. The resource table contains the following columns:
- Name—the name of a resource set. Can be used for searching and sorting.
- Updated—the date and time of the last update of the resource set. Can be used for sorting.
- Created by—the name of the user who created the resource set.
- Description—the description of the resource set.
Creating a storage
A storage consists of two parts: one part is created inside the KUMA web interface, and the other part is installed on network infrastructure servers intended for storing events. The server part of a KUMA storage consists of ClickHouse nodes collected into a cluster. ClickHouse clusters can be supplemented with cold storage disks.
For each ClickHouse cluster, a separate storage must be installed.
Prior to storage creation, carefully plan the cluster structure and deploy the necessary network infrastructure. When choosing a ClickHouse cluster configuration, consider the specific event storage requirements of your organization.
We recommend using the ext4 file system.
A storage is created in several steps:
- Creating a resource set for a storage in the KUMA web interface
- Creating a storage service in the KUMA web interface
- Installing storage nodes in the network infrastructure
When creating storage cluster nodes, verify the network connectivity of the system and open the ports used by the components.
If the storage settings are changed, the service must be restarted.
ClickHouse cluster structure
A ClickHouse cluster is a logical group of devices that possess all accumulated normalized KUMA events. It consists of one or more logical shards.
A shard is a logical group of devices that possess a specific portion of all normalized events accumulated in the cluster. It consists of one or more replicas. Increasing the number of shards lets you do the following:
- Accumulate more events by increasing the total number of servers and disk space.
- Absorb a larger stream of events by distributing the load associated with an influx of new events.
- Reduce the time taken to search for events by distributing search zones among multiple devices.
A replica is a device that is a member of a logical shard and possesses a single copy of that shard's data. If multiple replicas exist, it means multiple copies exist (the data is replicated). Increasing the number of replicas lets you do the following:
- Improve high availability.
- Distribute the total load related to data searches among multiple machines (although it's best to increase the number of shards for this purpose).
A keeper is a device that participates in coordination of data replication at the whole cluster level. At least one device per cluster must have this role. The recommended number of the devices with this role is 3. The number of devices involved in coordinating replication must be an odd number. The keeper and replica roles can be combined in one machine.
Page topClickHouse cluster node settings
Prior to storage creation, carefully plan the cluster structure and deploy the necessary network infrastructure. When choosing a ClickHouse cluster configuration, consider the specific event storage requirements of your organization.
When creating ClickHouse cluster nodes, verify the network connectivity of the system and open the ports used by the components.
For each node of the ClickHouse cluster, you need to specify the following settings:
- Fully qualified domain name (FQDN)—a unique address to access the node. Specify the entire FQDN, for example,
kuma-storage.example.com. - Shard, replica, and keeper IDs—the combination of these settings determines the position of the node in the ClickHouse cluster structure and the node role.
Node roles
The roles of the nodes depend on the specified settings:
- shard, replica, keeper—the node participates in the accumulation and search of normalized KUMA events and helps coordinate data replication at the cluster-wide level.
- shard, replica—the node participates in the accumulation and search of normalized KUMA events.
- keeper—the node does not accumulate normalized events, but helps coordinate data replication at the cluster-wide level. Dedicated keepers must be specified at the beginning of the list in the Resources → Storages → <Storage> → Basic settings → ClickHouse cluster nodes section.
ID requirements:
- If multiple shards are created in the same cluster, the shard IDs must be unique within this cluster.
- If multiple replicas are created in the same shard, the replica IDs must be unique within this shard.
- The keeper IDs must be unique within the cluster.
Example of ClickHouse cluster node IDs:
- shard 1, replica 1, keeper 1;
- shard 1, replica 2;
- shard 2, replica 1;
- shard 2, replica 2, keeper 3;
- shard 2, replica 3;
- keeper 2.
Cold storage of events
In KUMA, you can configure the migration of legacy data from a ClickHouse cluster to the cold storage. Cold storage can be implemented using the local disks mounted in the operating system or the Hadoop Distributed File System (HDFS). Cold storage is enabled when at least one cold storage disk is specified. If multiple storages are used, a cold storage disk or a HDFS disk must be mounted at the path specified in the storage configuration on each node with data. If a cold storage disk is not configured and the server runs out of disk space in hot storage, the storage service is stopped. If both hot storage and cold storage are configured, and space runs out on the cold storage disk, the KUMA storage service is stopped. We recommend avoiding such situations by adding custom event storage conditions in hot storage.
Cold storage disks can be added or removed. If you have added multiple cold storage disks, data is written to them in a round-robin manner. If data to be written to disk would take up more space than is available on that disk, this data and all subsequent data is written round-robin to the next cold storage disks. If you added only two cold storage disks, the data is written to the drive that has free space left.
After changing the cold storage settings, the storage service must be restarted. If the service does not start, the reason is specified in the storage log.
If the cold storage disk specified in the storage settings has become unavailable (for example, out of order), this may lead to errors in the operation of the storage service. In this case, recreate a disk with the same path (for local disks) or the same address (for HDFS disks) and then delete it from the storage settings.
Rules for moving the data to the cold storage disks
You can configure the storage conditions for events in hot storage of the ClickHouse cluster by setting a limit based on retention time or on maximum storage size. When cold storage is used, every 15 minutses and after each Core restart, KUMA checks if the specified storage conditions are satisfied:
- KUMA gets the partitions for the storage being checked and groups the partitions by cold storage disks and spaces.
- For each space, KUMA checks whether the specified storage condition is satisfied.
- If the condition is satisfied (for example, if the space contains that exceed their retention time, or if the size of the storage has reached or exceeded limit specified in the condition), KUMA transfers all partitions with the oldest date to cold storage disks or deletes these partitions if no cold storage disk is configured or if it is configured incorrectly. This action is repeated while the configured storage condition remains satisfied in the space; for example, if after deleting partitions for a date, the storage size still exceeds the maximum size specified in the condition.
KUMA generates audit events when data transfer starts and ends, or when data is removed.
- If retention time is configured in KUMA, whenever partitions are transferred to cold storage disks, it is checked whether the configured conditions are satisfied on the disk. If events are found on the disk that have been stored for longer than the Event retention time, which is counted from the moment the events were received in KUMA, the solution deletes these events or all partitions for the oldest date.
KUMA generates audit events when it deletes data.
If the ClickHouse cluster disks are 95% full, the biggest partitions are automatically moved to the cold storage disks. This can happen more often than once per hour.
During data transfer, the storage service remains operational, and its status stays green in the Resources → Active services section of the KUMA web interface. When you hover over the status icon, a message is displayed about the data transfer. When a cold storage disk is removed, the storage service has the yellow status.
Special considerations for storing and accessing events
- When using HDFS disks for cold storage, protect your data in one of the following ways:
- Configure a separate physical interface in the VLAN, where only HDFS disks and the ClickHouse cluster are located.
- Configure network segmentation and traffic filtering rules that exclude direct access to the HDFS disk or interception of traffic to the disk from ClickHouse.
- Events located in the ClickHouse cluster and on the cold storage disks are equally available in the KUMA web interface. For example, when you search for events or view events related to alerts.
- You can disable the storage of events or audit events on cold storage disks. To do so, specify the following in storage settings:
- If you do not want to store events on cold storage disks, do one of the following:
- If in the Storage condition options field, you have a gigabyte or percentage based storage condition selected, in the Event retention time, specify
0. - If in the Storage condition options field, you have a storage condition in days, in the Event retention time field, specify the same number of days as in the Storage condition options field.
- If in the Storage condition options field, you have a gigabyte or percentage based storage condition selected, in the Event retention time, specify
- If you do not want to store audit events on cold storage disks, in the Audit cold retention period field, specify
0(days).
- If you do not want to store events on cold storage disks, do one of the following:
Special considerations for using HDFS disks
- Before connecting HDFS disks, create directories for each node of the ClickHouse cluster on them in the following format:
<HDFS disk host>/<shard ID>/<replica ID>. For example, if a cluster consists of two nodes containing two replicas of the same shard, the following directories must be created:- hdfs://hdfs-example-1:9000/clickhouse/1/1/
- hdfs://hdfs-example-1:9000/clickhouse/1/2/
Events from the ClickHouse cluster nodes are migrated to the directories with names containing the IDs of their shard and replica. If you change these node settings without creating a corresponding directory on the HDFS disk, events may be lost during migration.
- HDFS disks added to storage operate in the JBOD mode. This means that if one of the disks fails, access to the storage will be lost. When using HDFS, take high availability into account and configure RAID, as well as storage of data from different replicas on different devices.
- The speed of event recording to HDFS is usually lower than the speed of event recording to local disks. The speed of accessing events in HDFS, as a rule, is significantly lower than the speed of accessing events on local disks. When using local disks and HDFS disks at the same time, the data is written to them in turn.
- HDFS is used only as distributed file data storage of ClickHouse. Compression mechanisms of ClickHouse, not HDFS, are used to compress data.
- The ClickHouse server must have write access to the corresponding HDFS storage.
Removing cold storage disks
Before physically disconnecting cold storage disks, remove these disks from the storage settings.
To remove a disk from the storage settings:
- In the KUMA web interface, under Resources → Storages, select the relevant storage.
This opens the storage.
- In the window, in the Disks for cold storage section, in the required disk's group of settings, click Delete disk.
Data from removed disk is automatically migrated to other cold storage disks or, if there are no such disks, to the ClickHouse cluster. While data is being migrated, the status icon of the storage turns yellow and an hourglass icon is displayed. Audit events are generated when data transfer starts and ends.
- After event migration is complete, the disk is automatically removed from the storage settings. It can now be safely disconnected.
Removed disks can still contain events. If you want to delete them, you can manually delete the data partitions using the DROP PARTITION command.
If the cold storage disk specified in the storage settings has become unavailable (for example, out of order), this may lead to errors in the operation of the storage service. In this case, create a disk with the same path (for local disks) or the same address (for HDFS disks) and then delete it from the storage settings.
Page topDetaching, archiving, and attaching partitions
If you want to optimize disk space and speed up queries in KUMA, you can detach data partitions in ClickHouse, archive partitions, or move partitions to a drive. If necessary, you can later reattach the partitions you need and perform data processing.
Detaching partitions
To detach partitions:
- Determine the shard on all replicas of which you want to detach the partition.
- Get the partition ID using the following command:
sudo /opt/kaspersky/kuma/clickhouse/bin/client.sh -d kuma --multiline --query "SELECT partition, name FROM system.parts;" |grep 20231130In this example, the command returns the partition ID for November 30, 2023.
- One each replica of the shard, detach the partition using the following command and specifying the partition ID:
sudo /opt/kaspersky/kuma/clickhouse/bin/client.sh -d kuma --multiline --query "ALTER TABLE events_local_v2 DETACH PARTITION ID '<partition ID>'"
As a result, the partition is detached on all replicas of the shard. Now you can move the data directory to a drive or archive the partition.
Archiving partitions
To archive detached partitions:
- Find the detached partition in disk subsystem of the server:
sudo find /opt/kaspersky/kuma/clickhouse/data/ -name <ID of the detached partition>\* Change to the 'detached' directory that contains the detached partition, and while in the 'detached' directory, perform the archival:sudo cd <path to the 'detached' directory containing the detached partition>sudo zip -9 -r detached.zip *For example:
sudo cd /opt/kaspersky/kuma/clickhouse/data/store/d5b/d5bdd8d8-e1eb-4968-95bd-d8d8e1eb3968/detached/sudo zip -9 -r detached.zip *
The partition is archived.
Attaching partitions
To attach archived partitions to KUMA:
- Increase the Retention period value.
KUMA deletes data based on the date specified in the Timestamp field, which records the time when the event is received, and based on the Retention period value that you set for the storage.
Before restoring archived data, make sure that the Retention period value overlaps the date in the Timestamp field. If this is not the case, the archived data will be deleted within 1 hour.
- Place the archive partition in the 'detached' section of your storage and extract the archive:
sudounzip detached.zip -d<path to the 'detached' directory>For example:
sudounzip detached.zip -d/opt/kaspersky/kuma/clickhouse/data/store/d5b/d5bdd8d8-e1eb-4968-95bd-d8d8e1eb3968/detached/ - Run the command to attach the partition:
sudo /opt/kaspersky/kuma/clickhouse/bin/client.sh -d kuma --multiline --query "ALTER TABLE events_local_v2 ATTACH PARTITION ID '<partition ID>'"Repeat the steps of extracting the archive and attaching the partition on each replica of the shard.
As a result, the archived partition is attached and its events are again available for search.
Page topCreating a set of resources for a storage
In the KUMA web interface, a storage service is created based on the resource set for the storage.
To create a resource set for a storage in the KUMA web interface:
- In the KUMA web interface, under Resources → Storages, click Add storage.
This opens the Create storage window.
- On the Basic settings tab, in the Storage name field, enter a unique name for the service you are creating. The name must contain 1 to 128 Unicode characters.
- In the Tenant drop-down list, select the tenant that will own the storage.
- In the Tags drop-down list, select the tags for the resource set that you are creating.
The list includes all available tags created in the tenant of the resource and in the Shared tenant. You can find a tag in the list by typing its name in the field. If the tag you entered does not exist, you can press Enter or click Add to create it.
- You can optionally add up to 256 Unicode characters describing the service in the Description field.
- In the Storage condition options field, select an event storage condition in the ClickHouse cluster for the storage, which, when satisfied, will cause events to be transferred to cold storage disks or deleted if cold storage is not configured or is configured incorrectly. The condition is applied to the default space and to events from deleted spaces.
By default, ClickHouse moves events to cold storage disks or deletes them if more than 97% of the storage is full. KUMA also applies an additional 365 days storage condition when creating a storage. You can configure custom storage conditions for more stable performance of the storage.
To set the storage condition, do one of the following:
- If you want to limit the storage period for events, select Days from the drop-down list, and in the field, specify the maximum event storage period (in days) in the ClickHouse hot storage cluster.
After the specified period, events are automatically transferred to cold storage disks or deleted from the ClickHouse cluster, starting with the partitions with the oldest date. The minimum value is 1. The default value is 365.
- If you want to limit the maximum storage size, select GB from the drop-down list, and in the field, specify the maximum storage size in gigabytes.
When the storage reaches the specified size, events are automatically transferred to cold storage disks or deleted from the ClickHouse cluster, starting with the partitions with the oldest date. The minimum value and default value is 1.
- If you want to limit the storage size to a percentage of disk space that is available to the storage (according to VictoriaMetrics), select Percentage from the drop-down list, and in the field, specify the maximum storage size as a percentage of the available disk space. In this case, the condition can also be triggered when the disk space available to the storage is decreased.
When the storage reaches the specified percentage of disk space available to it, events are automatically transferred to cold storage disks or deleted from the ClickHouse cluster, starting with the partitions with the oldest date. Possible values: 1 to 95. The default value is 80. If you want to use percentages for all storage spaces, the sum total of percentages in the conditions of all spaces may not exceed 95, but we recommend specifying a limit of at most 90% for the entire storage or for individual spaces.
We do not recommend specifying small percentage values because this increases the probability of data loss in the storage.
For [OOTV] Storage, the default event storage period is 2 days. If you want to use this storage, you can change the event storage condition for it, if necessary.
- If you want to limit the storage period for events, select Days from the drop-down list, and in the field, specify the maximum event storage period (in days) in the ClickHouse hot storage cluster.
- If you want to use an additional storage condition, click Add storage condition and specify an additional storage condition as described in step 6.
The maximum number of conditions is two, and you can combine only conditions the following types:
- Days and storage size in GB
- Days and storage size as a percentage
If you want to delete a storage condition, click the X icon next to this condition.
- In the Audit retention period field, specify the period, in days, to store audit events. The minimum value and default value is
365. - If cold storage is required, specify the event storage term:
- Event retention time specifies the total KUMA event storage duration in days, counting from the moment when the event is received. When the specified period expires, events are automatically deleted from the cold storage disk. The default value is 0.
The event retention time is calculated as the sum of the event retention time in the ClickHouse hot storage cluster until the condition specified in the Storage condition options setting is triggered, and the event retention time on the cold storage disk. After one of storage conditions is triggered, the data partition for the earliest date is moved to the cold storage disk, and there it remains until the event retention time in KUMA expires.
Depending on the specified storage condition, the resulting retention time is as follows:
- If you specified a storage condition in days, the Event retention time must be strictly greater than the number of days specified in the storage condition. You can calculate the cold retention period for events as the Event retention time minus the number of days specified in the Storage condition options setting.
If you do not want to store events on the cold storage disk, you can specify the same number of days in the Event retention time field as in the storage condition.
- If you specified the storage condition in terms of disk size (absolute or percentage), the minimum value of the Event retention time is 1. The cold storage duration for events is calculated as Event retention time minus the number of days from the receipt of the event to triggering of the condition and the disk partition filling up, but until the condition is triggered, calculating an exact duration is impossible. In this case, we recommend specifying a relatively large value for Event retention time to avoid events being deleted.
If you do not want to store events on the cold storage disk, you can set Event retention time to 0.
- If you specified a storage condition in days, the Event retention time must be strictly greater than the number of days specified in the storage condition. You can calculate the cold retention period for events as the Event retention time minus the number of days specified in the Storage condition options setting.
- Audit cold retention period—the number of days to store audit events. The minimum value is 0.
The Event retention time and Audit cold retention period settings become available only after at least one cold storage disk has been added.
- Event retention time specifies the total KUMA event storage duration in days, counting from the moment when the event is received. When the specified period expires, events are automatically deleted from the cold storage disk. The default value is 0.
- If you want to change ClickHouse settings, in the ClickHouse configuration override field, paste the lines with settings from the ClickHouse configuration XML file /opt/kaspersky/kuma/clickhouse/cfg/config.xml. Specifying the root elements <yandex>, </yandex> is not required. Settings passed in this field are used instead of the default settings.
Example:
<merge_tree>
<parts_to_delay_insert>600</parts_to_delay_insert>
<parts_to_throw_insert>1100</parts_to_throw_insert>
</merge_tree>
- Use the Debug toggle switch to specify whether resource logging must be enabled. If you want to only log errors for all KUMA components, disable debugging. If you want to get detailed information in the logs, enable debugging.
- If necessary, in the ClickHouse cluster nodes section, add ClickHouse cluster nodes to the storage.
There can be multiple nodes. You can add nodes by clicking the Add node button or remove nodes by clicking the X icon of the relevant node.
Available settings:
- In the FQDN field, enter the fully qualified domain name of the node that you want to add. For example,
kuma-storage-cluster1-server1.example.com. - In the Shard ID, Replica ID, and Keeper ID fields, specify the role of the node in the ClickHouse cluster. The shard and keeper IDs must be unique within the cluster, the replica ID must be unique within the shard. The following example shows how to populate the ClickHouse cluster nodes section for a storage with dedicated keepers in a distributed installation. You can adapt this example according to your needs.
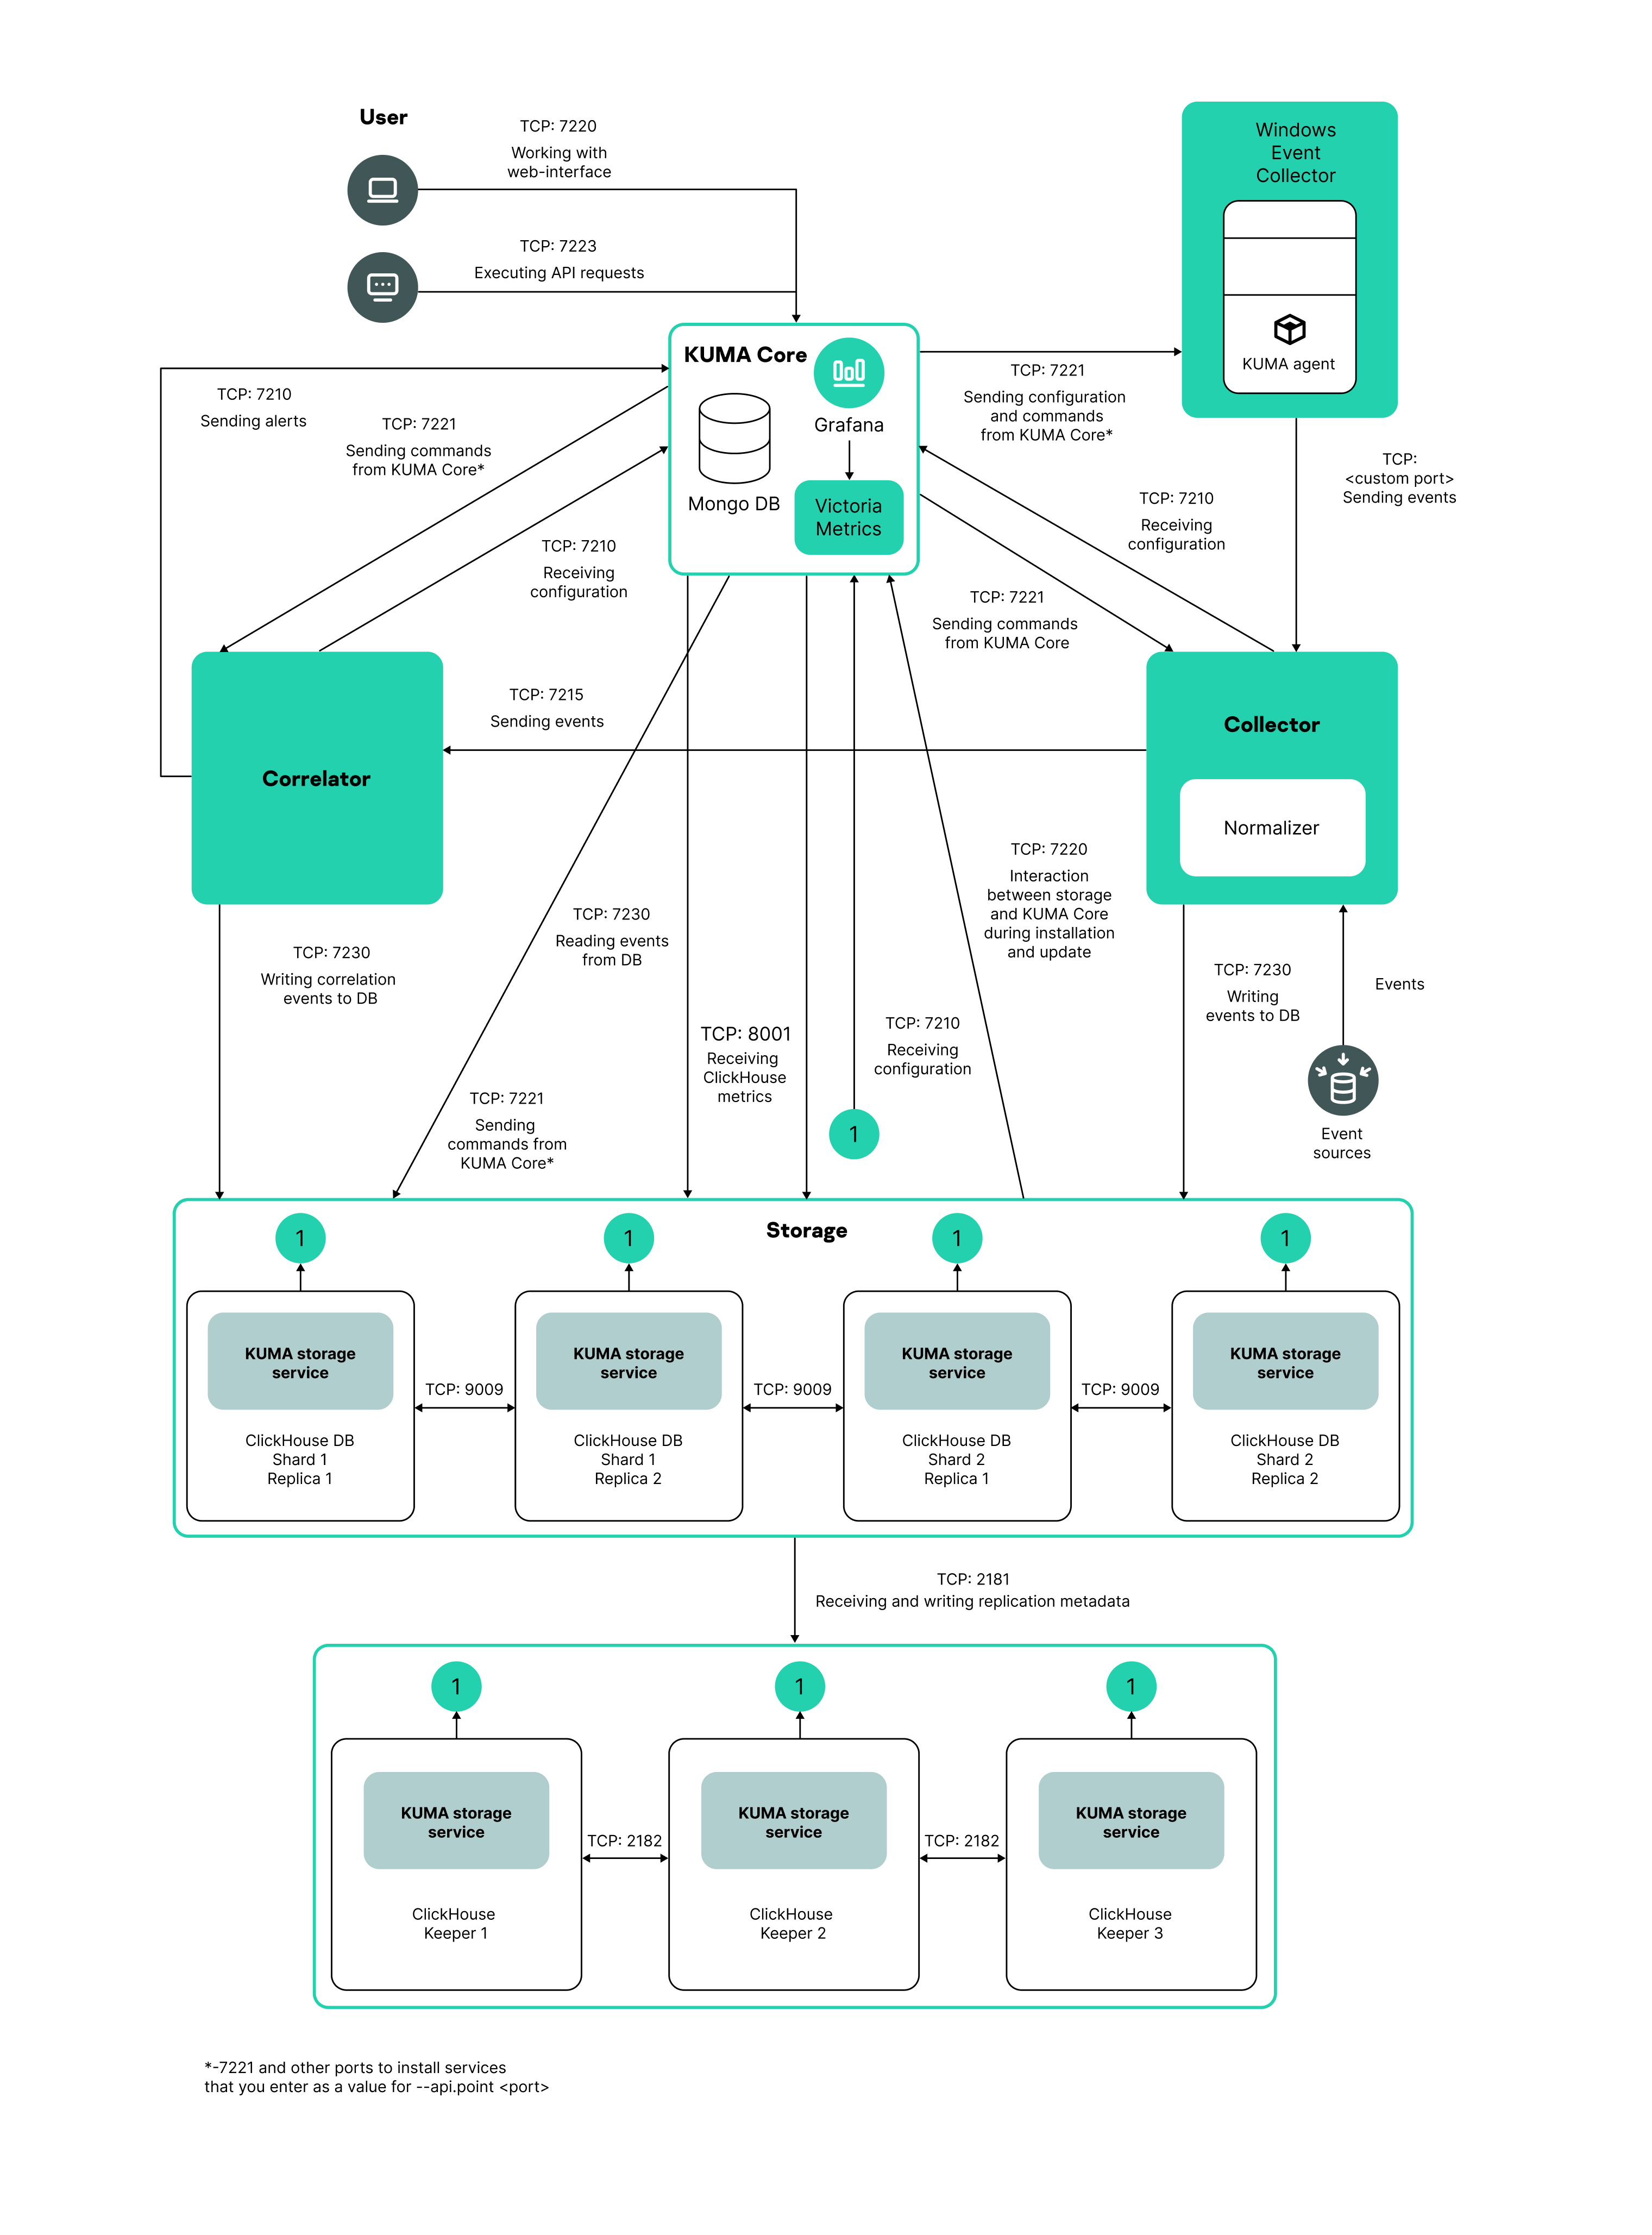
Distributed Installation diagram
Example:
ClickHouse cluster nodes
FQDN: kuma-storage-cluster1-server1.example.com
Shard ID: 0
Replica ID: 0
Keeper ID: 1
FQDN: kuma-storage-cluster1server2.example.com
Shard ID: 0
Replica ID: 0
Keeper ID: 2
FQDN: kuma-storage-cluster1server3.example.com
Shard ID: 0
Replica ID: 0
Keeper ID: 3
FQDN: kuma-storage-cluster1server4.example.com
Shard ID: 1
Replica ID: 1
Keeper ID: 0
FQDN: kuma-storage-cluster1server5.example.com
Shard ID: 1
Replica ID: 2
Keeper ID: 0
FQDN: kuma-storage-cluster1server6.example.com
Shard ID: 2
Replica ID: 1
Keeper ID: 0
FQDN: kuma-storage-cluster1server7.example.com
Shard ID: 2
Replica ID: 2
Keeper ID: 0
- In the FQDN field, enter the fully qualified domain name of the node that you want to add. For example,
- If necessary, in the Spaces section, add spaces to the storage to distribute the stored events.
There can be multiple spaces. You can add spaces by clicking the Add space button or remove nodes by clicking the X icon of the relevant space.
Available settings:
- In the Name field, specify a name for the space containing 1 to 128 Unicode characters.
- In the Storage condition options field, select an event storage condition in the ClickHouse cluster for the space, which, when satisfied, will cause events to be transferred to cold storage disks or deleted if cold storage is not configured or is configured incorrectly. KUMA applies the 365 days storage condition when a space is added.
To set the storage condition for a space, do one of the following:
- If you want to limit the storage period for events, select Days from the drop-down list, and in the field, specify the maximum event storage period (in days) in the ClickHouse hot storage cluster.
After the specified period, events are automatically transferred to cold storage disks or deleted from the ClickHouse cluster, starting with the partitions with the oldest date. The minimum value is 1. The default value is 365.
- If you want to limit the maximum storage space size, select GB from the drop-down list, and in the field, specify the maximum space size in gigabytes.
When the space reaches the specified size, events are automatically transferred to cold storage disks or deleted from the ClickHouse cluster, starting with the partitions with the oldest date. The minimum value and default value is 1.
- If you want to limit the space size to a percentage of disk space that is available to the storage (according to VictoriaMetrics), select Percentage from the drop-down list, and in the field, specify the maximum space size as a percentage of the size of the disk available to the storage. In this case, the condition can also be triggered when the disk space available to the storage is decreased.
When the space reaches the specified percentage of disk space available to the storage, events are automatically transferred to cold storage disks or deleted from the ClickHouse cluster, starting with the partitions with the oldest date. Possible values: 1 to 95. The default value is 80. If you want to use percentages for all storage spaces, the sum total of percentages in the conditions of all spaces may not exceed 95, but we recommend specifying a limit of at most 90% for the entire storage or for individual spaces.
We do not recommend specifying small percentage values because this increases the probability of data loss in the storage.
When using size as the storage condition, you must ensure that the total size of all spaces specified in the storage conditions does not exceed the physical size of the storage, otherwise an error will be displayed when starting the service.
In storage conditions with a size limitation, use the same units of measure for all spaces of a storage (only gigabytes or only percentage values). Otherwise, if the condition is specified as a percentage for one space, and in gigabytes for another space, the storage may overflow due to mismatch of values, leading to data loss.
- If you want to limit the storage period for events, select Days from the drop-down list, and in the field, specify the maximum event storage period (in days) in the ClickHouse hot storage cluster.
- If you want to make a space inactive if it is outdated and no longer relevant, select the Read only check box.
This prevents events from going into that space. To make the space active again, clear the Read only check box. This check box is cleared by default.
- If necessary, in the Event retention time field, specify the total KUMA event storage duration in days, counting from the moment when the event is received. When the specified period expires, events are automatically deleted from the cold storage disk. The default value is 0.
The event retention time is calculated as the sum of the event retention time in the ClickHouse hot storage cluster until the condition specified in the Storage condition options setting is triggered, and the event retention time on the cold storage disk. After one of storage conditions is triggered, the data partition for the earliest date is moved to the cold storage disk, and there it remains until the event retention time in KUMA expires.
Depending on the specified storage condition, the resulting retention time is as follows:
- If you specified a storage condition in days, the Event retention time must be strictly greater than the number of days specified in the storage condition. The cold storage duration for events is calculated as the Event retention time minus the number of days specified in the Storage condition options setting.
If you do not want to store events from this space on the cold storage disk, you can specify the same number of days in the Event retention time field as in the storage condition.
- If you specified the storage condition in terms of disk size (absolute or percentage), the minimum value of the Event retention time is 1. The cold storage duration for events is calculated as Event retention time minus the number of days from the receipt of the event to triggering of the condition and the disk partition filling up, but until the condition is triggered, calculating an exact duration is impossible. In this case, we recommend specifying a relatively large value for Event retention time to avoid events being deleted.
If you do not want to store events from this space on the cold storage disk, you can set Event retention time to 0.
The Event retention time setting becomes available only after adding at least one cold storage disk.
- If you specified a storage condition in days, the Event retention time must be strictly greater than the number of days specified in the storage condition. The cold storage duration for events is calculated as the Event retention time minus the number of days specified in the Storage condition options setting.
- In the Filter settings section, you can specify conditions to identify events that will be put into this space. To create a new filter, in the Filter drop-down list, select an existing filter or Create new.
Creating a filter in resources
To create a filter:
- In the Filter drop-down list, select Create new.
- If you want to keep the filter as a separate resource, select the Save filter check box. In this case, you will be able to use the created filter in various services. This check box is cleared by default.
- If you selected the Save filter check box, enter a name for the created filter resource in the Name field. Maximum length of the name: 128 Unicode characters.
- Under Conditions, specify the conditions that the events must meet:
- Click the Add condition button.
- In the Left operand and Right operand drop-down lists, specify the search parameters. Depending on the data source selected in the Right operand field, fields of additional parameters for identifying the value to be passed to the filter may be displayed. For example, when you select active list, you must specify the name of the active list, the entry key, and the entry key field.
- In the operator drop-down list, select an operator.
- If you want the operator to be case-insensitive, select the do not match case check box. The selection of this check box does not apply to the InSubnet, InActiveList, InCategory or InActiveDirectoryGroup operators. This check box is cleared by default.
- If you want to add a negative condition, select If not from the If drop-down list.
You can add multiple conditions or a group of conditions.
- If you have added multiple conditions or groups of conditions, choose a selection condition (and, or, not) by clicking the AND button.
- If you want to add existing filters that are selected from the Select filter drop-down list, click the Add filter button. You can view the nested filter settings by clicking the
 button.
After the service is created, you can view and delete spaces in the storage resource settings.
There is no need to create a separate space for audit events. Events of this type (Type=4) are automatically placed in a separate Audit space with a storage term of at least 365 days. This space cannot be edited or deleted from the KUMA web interface.
- If necessary, in the Disks for cold storage section, add to the storage the disks where you want to transfer events from the ClickHouse cluster for long-term storage.
There can be multiple disks. You can add disks by clicking the Add disk button and remove them by clicking the Delete disk button.
Available settings:
- In the FQDN drop-down list, select the type of domain name of the disk you are connecting:
- Local—for the disks mounted in the operating system as directories.
- HDFS—for the disks of the Hadoop Distributed File System.
- In the Name field, specify the disk name. The name must contain 1 to 128 Unicode characters.
- If you select the Local domain name type for the disk, specify the absolute directory path of the mounted local disk in the Path field. The path must begin and end with a "/" character.
- If you select HDFS domain name type for the disk, specify the path to HDFS in the Host field. For example,
hdfs://hdfs1:9000/clickhouse/.
- In the FQDN drop-down list, select the type of domain name of the disk you are connecting:
- Go to the Advanced settings tab and fill in the following fields:
- In the Buffer size field, enter the buffer size in bytes at which events must be sent to the database. The default value is 128 MB. No maximum value is configured. If the virtual machine has less free RAM than the specified Buffer size, KUMA sets the limit to 128 MB.
If the expected traffic to the storage service is greater than 1 Gbps, we recommend changing the Buffer size setting (in bytes) to the expected value and setting the Buffer flush interval to 2.
The value of the Buffer size setting can be determined empirically. KUMAIf the Insert QPS metric of the storage is greater than 1 and you see that a queue of requests building up, follow the recommendations for calculating and adjusting the Buffer size setting in the Insert QPS section provided in the Viewing KUMA metrics article.
- In the Maximum buffer size field, specify the maximum buffer size in bytes. The default value is 256 MB.
By default, events are written to the database once per second. If the EPS rises and events are registered more often than once per second, the buffer size is automatically increased. The buffer is increased up to three times the Buffer size value, but cannot exceed the Maximum buffer size value. When the load goes back to normal, the buffer size stays the same; there is no automatic reduction of buffer size. If the Maximum buffer size is less than or equal to the Buffer size, the buffer size does not change.
Restarting the storage service resets the increased buffer size to the value in the Buffer size field.
- In the Buffer flush interval field, enter the time in seconds for which KUMA waits for the buffer to fill up. If the buffer is not full, but the specified time has passed, KUMA sends events to the database. The default value is 1 second.
- In the Required memory size field, specify the minimum amount of free RAM in bytes. The default value is 128 MB.
If the node on which the storage is installed has less free RAM than this setting, database insert request returns an error, and the events are recorded later. Limiting the memory size allows avoiding the situation when the memory fills up if, for any reason, the recording of events in the database is blocked and data begins to accumulate in memory.
- In the Disk buffer size limit field, enter a value in bytes. The disk buffer is used to temporarily store events that could not be sent for further processing or storage. If the disk space allocated for the disk buffer is exhausted, events are rotated as follows: new events replace the oldest events written to the buffer. The default value is 10 GB.
- Use the Disk buffer toggle switch to enable or disable the disk buffer. By default, the disk buffer is enabled.
- Use the Write to local database table toggle switch to enable or disable writing to the local database table. Writing is disabled by default.
If enabled, data is written only on the host on which the storage is located. We recommend using this functionality only if you have configured balancing on the collector and/or correlator — at step 6. Routing, in the Advanced settings section, the URL selection policy field is set to Round robin.
If you disable writing, the data is distributed across the shards of the cluster.
- If necessary, use the Debug toggle switch to enable logging of service operations.
- You can use the Create dump periodically toggle switch at the request of Technical Support to generate resource (CPU, RAM, etc.) utilization reports in the form of dumps.
- In the Dump settings field, you can specify the settings to be used when creating dumps. For instructions on filling out this field, please contact Technical Support.
- In the Buffer size field, enter the buffer size in bytes at which events must be sent to the database. The default value is 128 MB. No maximum value is configured. If the virtual machine has less free RAM than the specified Buffer size, KUMA sets the limit to 128 MB.
The set of resources for the storage is created and is displayed under Resources → Storages. Now you can create a storage service.
Page topCreating a storage service in the KUMA web interface
When a resource set is created for a storage, you can proceed to create a storage service in KUMA.
To create a storage service in the KUMA web interface:
- In the KUMA web interface, under Resources → Active services, click Add service.
- In the opened Choose a service window, select the resource set that you just created for the storage and click Create service.
The storage service is created in the KUMA web interface and is displayed under Resources → Active services. Now storage services must be installed to each node of the ClickHouse cluster by using the service ID.
Page topInstalling a storage in the KUMA network infrastructure
To create a storage:
- Log in to the server where you want to install the service.
- Execute the following command:
sudo /opt/kaspersky/kuma/kuma storage --core https://<KUMA Core server FQDN>:<port used by KUMA Core for internal communication (port 7210 by default)> --id <service ID copied from the KUMA web interface> --installExample:
sudo /opt/kaspersky/kuma/kuma storage --core https://kuma.example.com:7210 --id XXXXX --installWhen deploying several KUMA services on the same host, during the installation process you must specify unique ports for each component using the
--api.port <port>parameter. The following setting values are used by default:--api.port 7221. - Repeat steps 1–2 for each storage node.
Only one storage service can be installed on a host.
The storage is installed.
Page topCreating a correlator
A correlator consists of two parts: one part is created inside the KUMA web interface, and the other part is installed on the network infrastructure server intended for processing events.
Actions in the KUMA web interface
A correlator is created in the KUMA web interface by using the Installation Wizard, which combines the necessary resources into a resource set for the correlator. Upon completion of the Wizard, the service is automatically created based on this resource set.
To create a correlator in the KUMA web interface:
Start the Correlator Installation Wizard:
- In the KUMA web interface, under Resources, click Create correlator.
- In the KUMA web interface, under Resources → Correlators, click Add correlator.
As a result of completing the steps of the Wizard, a correlator service is created in the KUMA web interface.
A resource set for a correlator includes the following resources:
- Correlation rules
- Enrichment rules (if required)
- Response rules (if required)
- Destinations (normally one for sending events to a storage)
These resources can be prepared in advance, or you can create them while the Installation Wizard is running.
Actions on the KUMA correlator server
If you are installing the correlator on a server that you intend to use for event processing, you need to run the command displayed at the last step of the Installation Wizard on the server. When installing, you must specify the identifier automatically assigned to the service in the KUMA web interface, as well as the port used for communication.
Testing the installation
After creating a correlator, it is recommended to make sure that it is working correctly.
Starting the Correlator Installation Wizard
To start the Correlator Installation Wizard:
- In the KUMA web interface, under Resources, click Add correlator.
- In the KUMA web interface, under Resources → Correlators, click Add correlator.
Follow the instructions of the Wizard.
Aside from the first and last steps of the Wizard, the steps of the Wizard can be performed in any order. You can switch between steps by using the Next and Previous buttons, as well as by clicking the names of the steps in the left side of the window.
After the Wizard completes, a resource set for the correlator is created in the KUMA web interface under Resources → Correlators, and a correlator service is added under Resources → Active services.
Step 1. General correlator settings
This is a required step of the Installation Wizard. At this step, you specify the main settings of the correlator: the correlator name and the tenant that will own it.
To specify the general settings of the correlator:
- On the Basic settings tab, fill in the following fields:
- In the Name field, enter a unique name for the service you are creating. The name must contain 1 to 128 Unicode characters.
- In the Tenant drop-down list, select the tenant that will own the correlator. The tenant selection determines what resources will be available when the collector is created.
- If you return to this window from another subsequent step of the Installation Wizard and select another tenant, you will have to manually edit all the resources that you have added to the service. Only resources from the selected tenant and shared tenant can be added to the service.
- If required, specify the number of processes that the service can run concurrently in the Workers field. By default, the number of worker processes is the same as the number of vCPUs on the server where the service is installed.
- You can optionally add up to 256 Unicode characters describing the service in the Description field.
- On the Advanced settings tab, fill in the following fields:
- If necessary, use the Debug toggle switch to enable logging of service operations.
- You can use the Create dump periodically toggle switch at the request of Technical Support to generate resource (CPU, RAM, etc.) utilization reports in the form of dumps.
- In the Dump settings field, you can specify the settings to be used when creating dumps. The specifics of filling in this field must be provided by Technical Support.
General settings of the correlator are specified. Proceed to the next step of the Installation Wizard.
Page topStep 2. Global variables
If tracking values in event fields, active lists, or dictionaries is not enough to cover some specific security scenarios, you can use global and local variables. You can use them to take various actions on the values received by the correlators by implementing complex logic for threat detection. Variables can be assigned a specific function and then queried from correlation rules as if they were ordinary event fields, with the triggered function result received in response.
To add a global variable in the correlator,
click the Add variable button and specify the following parameters:
- In the Variable window, enter the name of the variable.
- In the Value window, enter the variable function.
When entering functions, you can use autocomplete as a list of hints with possible function names, their brief description and usage examples. You can select a function from the list and insert it together with its list of arguments into the input field.
To display the list of all hints in the field, press Ctrl+Space. Press Enter to select a function from the list. Press Tab to go to the next argument in the list of arguments of the selected function.
The global variable is added. It can be queried from correlation rules by adding the $ character in front of the variable name. There can be multiple variables. Added variables can be edited or deleted by using the  icon.
icon.
Proceed to the next step of the Installation Wizard.
Page topStep 3. Correlation
This is an optional but recommended step of the Installation Wizard. On the Correlation tab of the Installation Wizard, select or create correlation rules. These resources define the sequences of events that indicate security-related incidents. When these sequences are detected, the correlator creates a correlation event and an alert.
If you have added global variables to the correlator, all added correlation rules can query them.
Correlation rules that are added to the resource set for the correlator are displayed in the table with the following columns:
- Correlation rules—name of the correlation rule resource.
- Type—type of correlation rule: standard, simple, operational. The table can be filtered based on the values of this column by clicking the column header and selecting the relevant values.
- Actions—list of actions that will be performed by the correlator when the correlation rule is triggered. These actions are indicated in the correlation rule settings. The table can be filtered based on the values of this column by clicking the column header and selecting the relevant values.
Available values:
- Output—correlation events created by this correlation rule are transmitted to other correlator resources: enrichment, response rule, and then to other KUMA services.
- Edit active list—the correlation rule changes the active lists.
- Loop to correlator—the correlation event is sent to the same correlation rule for reprocessing.
- Categorization—the correlation rule changes asset categories.
- Event enrichment—the correlation rule is configured to enrich correlation events.
- Do not create alert—when a correlation event is created as a result of a correlation rule triggering, no alert is created for that. If you do not want to create an alert when a correlation rule is triggered, but you still want to send a correlation event to the storage, select the Output and No alert check boxes. If you select only the No alert check box, a correlation event is not saved in the storage.
- Shared resource—the correlation rule or the resources used in the correlation rule are located in a shared tenant.
You can use the Search field to search for a correlation rule. Added correlation rules can be removed from the resource set by selecting the relevant rules and clicking Delete.
Selecting a correlation rule opens a window with its settings, which can be edited and then saved by clicking Save. If you click Delete in this window, the correlation rule is unlinked from the resource set.
Use the Move up and Move down buttons to change the position of the selected correlation rules in the table. It affects their execution sequence when events are processed. Using the Move operational to top button, you can move correlation rules of the operational type to the beginning of the correlation rules list.
To link the existing correlation rules to the resource set for the correlator:
- Click Link.
The resource selection window opens.
- Select the relevant correlation rules and click OK.
The correlation rules will be linked to the resource set for the correlator and will be displayed in the rules table.
To create a new correlation rule in a resource set for a correlator:
- Click Add.
The correlation rule creation window opens.
- Specify the correlation rule settings and click Save.
The correlation rule will be created and linked to the resource set for the correlator. It is displayed in the correlation rules table and in the list of resources under Resources → Correlation rules.
Proceed to the next step of the Installation Wizard.
Page topStep 4. Enrichment
This is an optional step of the Installation Wizard. On the Enrichment tab of the Installation Wizard, you can select or create enrichment rules and indicate which data from which sources you want to add to correlation events that the correlator creates. There can be more than one enrichment rule. You can add them by clicking the Add button and can remove them by clicking the button.
To add an existing enrichment rule to a resource set:
- Click Add.
This opens the enrichment rule settings block.
- In the Enrichment rule drop-down list, select the relevant resource.
The enrichment rule is added to the resource set for the correlator.
To create a new enrichment rule in a resource set:
- Click Add.
This opens the enrichment rule settings block.
- In the Enrichment rule drop-down list, select Create new.
- In the Source kind drop-down list, select the source of data for enrichment and define its corresponding settings:
- constant
- dictionary
- event
- template
- dns
- cybertrace
For systems with a high load on the collector or correlator, we recommend using the cybertrace-http enrichment type.
This type of enrichment is used to add information from CyberTrace data streams to event fields.
Available settings:
- URL (required)—in this field, you can specify the URL of a CyberTrace server to which you want to send requests. The default CyberTrace port is 9999.
- Number of connections—maximum number of connections to the CyberTrace server that can be simultaneously established by KUMA. By default, this value is equal to the number of vCPUs of the KUMA Core server.
- RPS—maximum number of requests sent to the server per second. The default value is
1,000. - Timeout—amount of time to wait for a response from the CyberTrace server, in seconds. The default value is
30. - Maximum number of events in the enrichment queue—maximum number of events stored in the enrichment queue for re-sending. The default value is 1,000,000,000.
- Mapping (required)—this settings block contains the mapping table for mapping KUMA event fields to CyberTrace indicator types. The KUMA field column shows the names of KUMA event fields, and the CyberTrace indicator column shows the types of CyberTrace indicators.
Available types of CyberTrace indicators:
- ip
- url
- hash
In the mapping table, you must provide at least one string. You can use the Add row button to add a string, and can use the
button to remove a string.
- cybertrace-http
- timezone
- Use the Debug toggle switch to indicate whether or not to enable logging of service operations. Logging is disabled by default.
- In the Filter section, you can specify conditions to identify events that will be processed using the enrichment rule. You can select an existing filter from the drop-down list or create a new filter.
Creating a filter in resources
To create a filter:
- In the Filter drop-down list, select Create new.
- If you want to keep the filter as a separate resource, select the Save filter check box. In this case, you will be able to use the created filter in various services. This check box is cleared by default.
- If you selected the Save filter check box, enter a name for the created filter resource in the Name field. Maximum length of the name: 128 Unicode characters.
- Under Conditions, specify the conditions that the events must meet:
- Click the Add condition button.
- In the Left operand and Right operand drop-down lists, specify the search parameters. Depending on the data source selected in the Right operand field, fields of additional parameters for identifying the value to be passed to the filter may be displayed. For example, when you select active list, you must specify the name of the active list, the entry key, and the entry key field.
- In the operator drop-down list, select an operator.
- If you want the operator to be case-insensitive, select the do not match case check box. The selection of this check box does not apply to the InSubnet, InActiveList, InCategory or InActiveDirectoryGroup operators. This check box is cleared by default.
- If you want to add a negative condition, select If not from the If drop-down list.
You can add multiple conditions or a group of conditions.
- If you have added multiple conditions or groups of conditions, choose a selection condition (and, or, not) by clicking the AND button.
- If you want to add existing filters that are selected from the Select filter drop-down list, click the Add filter button. You can view the nested filter settings by clicking the button.
The new enrichment rule was added to the resource set for the correlator.
Proceed to the next step of the Installation Wizard.
Page topStep 5. Response
This is an optional step of the Installation Wizard. On the Response tab of the Installation Wizard, you can select or create response rules and indicate which actions must be performed when the correlation rules are triggered. There can be multiple response rules. You can add them by clicking the Add button and can remove them by clicking the button.
To add an existing response rule to a resource set:
- Click Add.
The response rule settings window opens.
- In the Response rule drop-down list, select the relevant resource.
The response rule is added to the resource set for the correlator.
To create a new response rule in a resource set:
- Click Add.
The response rule settings window opens.
- In the Response rule drop-down list, select Create new.
- In the Type drop-down list, select the type of response rule and define its corresponding settings:
- KSC response—response rules for automatically launching the tasks on Kaspersky Security Center assets. For example, you can configure automatic startup of a virus scan or database update.
Tasks are automatically started when KUMA is integrated with Kaspersky Security Center. Tasks are run only on assets that were imported from Kaspersky Security Center.
- Run script—response rules for automatically running a script. For example, you can create a script containing commands to be executed on the KUMA server when selected events are detected.
The script file is stored on the server where the correlator service using the response resource is installed: /opt/kaspersky/kuma/correlator/<Correlator ID>/scripts.
The
kumauser of this server requires the permissions to run the script. - KEDR response—response rules for automatically creating prevention rules, starting network isolation, or starting the application on Kaspersky Endpoint Detection and Response and Kaspersky Security Center assets.
Automatic response actions are carried out when KUMA is integrated with Kaspersky Endpoint Detection and Response.
- Response via KICS/KATA—response rules for automatically starting tasks on KICS for Networks assets. For example, you can change the asset status in KICS for Networks.
Tasks are automatically started when KUMA is integrated with KICS for Networks.
- Response via Active Directory—response rules for changing the permissions of Active Directory users. For example, block a user.
Tasks are started if integration with Active Directory is configured.
- KSC response—response rules for automatically launching the tasks on Kaspersky Security Center assets. For example, you can configure automatic startup of a virus scan or database update.
- In the Workers field, specify the number of processes that the service can run simultaneously.
By default, the number of workers is the same as the number of virtual processors on the server where the service is installed.
This field is optional.
- In the Filter section, you can specify conditions to identify events that will be processed using the response rule. You can select an existing filter from the drop-down list or create a new filter.
Creating a filter in resources
To create a filter:
- In the Filter drop-down list, select Create new.
- If you want to keep the filter as a separate resource, select the Save filter check box. In this case, you will be able to use the created filter in various services. This check box is cleared by default.
- If you selected the Save filter check box, enter a name for the created filter resource in the Name field. Maximum length of the name: 128 Unicode characters.
- Under Conditions, specify the conditions that the events must meet:
- Click the Add condition button.
- In the Left operand and Right operand drop-down lists, specify the search parameters. Depending on the data source selected in the Right operand field, fields of additional parameters for identifying the value to be passed to the filter may be displayed. For example, when you select active list, you must specify the name of the active list, the entry key, and the entry key field.
- In the operator drop-down list, select an operator.
- If you want the operator to be case-insensitive, select the do not match case check box. The selection of this check box does not apply to the InSubnet, InActiveList, InCategory or InActiveDirectoryGroup operators. This check box is cleared by default.
- If you want to add a negative condition, select If not from the If drop-down list.
You can add multiple conditions or a group of conditions.
- If you have added multiple conditions or groups of conditions, choose a selection condition (and, or, not) by clicking the AND button.
- If you want to add existing filters that are selected from the Select filter drop-down list, click the Add filter button. You can view the nested filter settings by clicking the button.
The new response rule was added to the resource set for the correlator.
Proceed to the next step of the Installation Wizard.
Page topStep 6. Routing
This is an optional step of the Installation Wizard. On the Routing tab of the Installation Wizard, you can select or create destinations with settings indicating the forwarding destination of events created by the correlator. Events from a correlator are usually redirected to storage so that they can be saved and later viewed if necessary. Events can be sent to other locations as needed. There can be more than one destination point.
To add an existing destination to a resource set for a correlator:
- In the Add destination drop-down list, select the type of destination resource you want to add:
- Select Storage if you want to configure forwarding of processed events to the storage.
- Select Correlator if you want to configure forwarding of processed events to a correlator.
- Select Other if you want to send events to other locations.
This type of resource includes correlator and storage services that were created in previous versions of the application.
The Add destination window opens where you can specify parameters for events forwarding.
- In the Destination drop-down list, select the necessary destination.
The window name changes to Edit destination, and it displays the settings of the selected resource. The resource can be opened for editing in a new browser tab using the
button. - Click Save.
The selected destination is displayed on the Installation Wizard tab. A destination resource can be removed from the resource set by selecting it and clicking Delete in the opened window.
To add a new destination to a resource set for a correlator:
- In the Add destination drop-down list, select the type of destination resource you want to add:
- Select Storage if you want to configure forwarding of processed events to the storage.
- Select Correlator if you want to configure forwarding of processed events to a correlator.
- Select Other if you want to send events to other locations.
This type of resource includes correlator and storage services that were created in previous versions of the application.
The Add destination window opens where you can specify parameters for events forwarding.
- Specify the settings on the Basic settings tab:
- In the Destination drop-down list, select Create new.
- In the Name field, enter a unique name for the destination resource. The name must contain 1 to 128 Unicode characters.
- Use the Disabled toggle button to specify whether events will be sent to this destination. By default, sending events is enabled.
- Select the Type for the destination resource:
- Select storage if you want to configure forwarding of processed events to the storage.
- Select correlator if you want to configure forwarding of processed events to a correlator.
- Select nats-jetstream, tcp, http, kafka, or file if you want to configure sending events to other locations.
- Specify the URL to which events should be sent in the hostname:<API port> format.
You can specify multiple destination addresses using the URL button for all types except nats-jetstream and file.
- For the nats-jetstream and kafka types, use the Topic field to specify which topic the data should be written to. The topic must contain Unicode characters. The Kafka topic is limited to 255 characters.
- If necessary, specify the settings on the Advanced settings tab. The available settings vary based on the selected destination resource type:
- Compression is a drop-down list where you can enable Snappy compression. By default, compression is disabled.
- Proxy is a drop-down list for proxy server selection.
- The Buffer size field is used to set buffer size (in bytes) for the destination. The default value is 1 MB, and the maximum value is 64 MB.
- Timeout field is used to set the timeout (in seconds) for another service or component response. The default value is
30. - Disk buffer size limit field is used to specify the size of the disk buffer in bytes. The default size is 10 GB.
- Cluster ID is the ID of the NATS cluster.
- TLS mode is a drop-down list where you can specify the conditions for using TLS encryption:
- Disabled (default)—do not use TLS encryption.
- Enabled—encryption is enabled, but without verification.
- With verification—use encryption with verification that the certificate was signed with the KUMA root certificate. The root certificate and key of KUMA are created automatically during application installation and are stored on the KUMA Core server in /opt/kaspersky/kuma/core/certificates/.
When using TLS, it is impossible to specify an IP address as a URL.
- URL selection policy is a drop-down list in which you can select a method for determining which URL to send events to if several URLs have been specified:
- Any. Events are sent to one of the available URLs as long as this URL receives events. If the connection is broken (for example, the receiving node is disconnected) a different URL will be selected as the events destination.
- Prefer first. Events are sent to the first URL in the list of added addresses. If it becomes unavailable, events are sent to the next available node in sequence. When the first URL becomes available again, events start to be sent to it again.
- Balanced means that packages with events are evenly distributed among the available URLs from the list. Because packets are sent either on a destination buffer overflow or on the flush timer, this URL selection policy does not guarantee an equal distribution of events to destinations.
- Delimiter is used to specify the character delimiting the events. By default,
\nis used. - Path—the file path if the file destination type is selected.
- Buffer flush interval—this field is used to set the time interval (in seconds) at which the data is sent to the destination. The default value is
100. - Workers—this field is used to set the number of services processing the queue. By default, this value is equal to the number of vCPUs of the KUMA Core server.
- You can set health checks using the Health check path and Health check timeout fields. You can also disable health checks by selecting the Health Check Disabled check box.
- Debug—a toggle switch that lets you specify whether resource logging must be enabled. By default, this toggle switch is in the Disabled position.
- The Disk buffer disabled drop-down list is used to enable or disable the use of a disk buffer. By default, the disk buffer is disabled.
- In the Filter section, you can specify the conditions to define events that will be processed by this resource. You can select an existing filter from the drop-down list or create a new filter.
Creating a filter in resources
To create a filter:
- In the Filter drop-down list, select Create new.
- If you want to keep the filter as a separate resource, select the Save filter check box. In this case, you will be able to use the created filter in various services. This check box is cleared by default.
- If you selected the Save filter check box, enter a name for the created filter resource in the Name field. Maximum length of the name: 128 Unicode characters.
- Under Conditions, specify the conditions that the events must meet:
- Click the Add condition button.
- In the Left operand and Right operand drop-down lists, specify the search parameters. Depending on the data source selected in the Right operand field, fields of additional parameters for identifying the value to be passed to the filter may be displayed. For example, when you select active list, you must specify the name of the active list, the entry key, and the entry key field.
- In the operator drop-down list, select an operator.
- If you want the operator to be case-insensitive, select the do not match case check box. The selection of this check box does not apply to the InSubnet, InActiveList, InCategory or InActiveDirectoryGroup operators. This check box is cleared by default.
- If you want to add a negative condition, select If not from the If drop-down list.
You can add multiple conditions or a group of conditions.
- If you have added multiple conditions or groups of conditions, choose a selection condition (and, or, not) by clicking the AND button.
- If you want to add existing filters that are selected from the Select filter drop-down list, click the Add filter button. You can view the nested filter settings by clicking the button.
- Click Save.
The created destination is displayed on the Installation Wizard tab. A destination resource can be removed from the resource set by selecting it and clicking Delete in the opened window.
Proceed to the next step of the Installation Wizard.
Page topStep 7. Setup validation
This is the required, final step of the Installation Wizard. At this step, KUMA creates a service resource set, and the Services are created automatically based on this set:
- The resource set for the correlator is displayed under Resources → Correlators. It can be used to create new correlator services. When this resource set changes, all services that operate based on this resource set will start using the new parameters after the services restart. To do so, you can use the Save and restart services and Save and update service configurations buttons.
A resource set can be modified, copied, moved from one folder to another, deleted, imported, and exported, like other resources.
- Services are displayed in Resources → Active services. The services created using the Installation Wizard perform functions inside the KUMA application. To communicate with external parts of the network infrastructure, you need to install similar external services on the servers and assets intended for them. For example, an external correlator service should be installed on a server intended to process events, external storage services should be installed on servers with a deployed ClickHouse service, and external agent services should be installed on Windows assets that must both receive and forward Windows events.
To finish the Installation Wizard:
- Click Create and save service.
The Setup validation tab of the Installation Wizard displays a table of services created based on the resource set selected in the Installation Wizard. The lower part of the window shows examples of commands that you must use to install external equivalents of these services on their intended servers and assets.
For example:
/opt/kaspersky/kuma/kuma correlator --core https://kuma-example:<port used for communication with the KUMA Core> --id <service ID> --api.port <port used for communication with the service> --install
The "kuma" file can be found inside the installer in the /kuma-ansible-installer/roles/kuma/files/ directory.
The port for communication with the KUMA Core, the service ID, and the port for communication with the service are added to the command automatically. You should also ensure the network connectivity of the KUMA system and open the ports used by its components if necessary.
- Close the Wizard by clicking Save.
The correlator service is created in KUMA. Now the service must be installed on the server intended for processing events.
Page topInstalling a correlator in a KUMA network infrastructure
A correlator consists of two parts: one part is created inside the KUMA web interface, and the other part is installed on the network infrastructure server intended for processing events. The second part of the correlator is installed in the network infrastructure.
To install a correlator:
- Log in to the server where you want to install the service.
- Execute the following command:
sudo /opt/kaspersky/kuma/kuma correlator --core https://<KUMA Core server FQDN>:<port used by KUMA Core server for internal communication (port 7210 by default)> --id <service ID copied from the KUMA web interface> --api.port <port used for communication with the installed component> --installExample:
sudo /opt/kaspersky/kuma/kuma correlator --core https://kuma.example.com:7210 --id XXXX --api.port YYYY --installYou can copy the correlator installation command at the last step of the Installation Wizard. It automatically specifies the address and port of the KUMA Core server, the identifier of the correlator to be installed, and the port that the correlator uses for communication. Before installation, ensure the network connectivity of KUMA components.
When deploying several KUMA services on the same host, during the installation process you must specify unique ports for each component using the
--api.port <port>parameter. The following setting values are used by default:--api.port 7221.
The correlator is installed. You can use it to analyze events for threats.
Page topValidating correlator installation
To verify that the correlator is ready to receive events:
- In the KUMA web interface, open Resources → Active services.
- Make sure that the correlator you installed has the green status.
If the events that are fed into the correlator contain events that meet the correlation rule filter conditions, the events tab will show events with the DeviceVendor=Kaspersky and DeviceProduct=KUMA parameters. The name of the triggered correlation rule will be displayed as the name of these correlation events.
If no correlation events are found
You can create a simpler version of your correlation rule to find possible errors. Use a simple correlation rule and a single Output action. It is recommended to create a filter to find events that are regularly received by KUMA.
When updating, adding, or removing a correlation rule, you must update configuration of the correlator.
When you finish testing your correlation rules, you must remove all testing and temporary correlation rules from KUMA and update configuration of the correlator.
Page topCreating an event router
An event router is a service that allows you to receive streams of events from collectors and correlators and then distribute the events to specified destinations in accordance with the configured filters.
To have events from the collector sent to the event router, you must create an 'eventRouter' destination resource with the address of the event router and link the resource to the collectors that you want to send events to the event router.
The event router receives events on the API port, just like 'storage' and 'correlator' destinations.
You can create a router in the Resources section.
Using an event router lets you reduce the utilization of links, which is important for low-bandwidth and busy links.
Possible use cases:
Collector — Router in the data center
The collector sends events to an event router in the data center, and the event router sends the events to the specified destinations: correlator and storage.
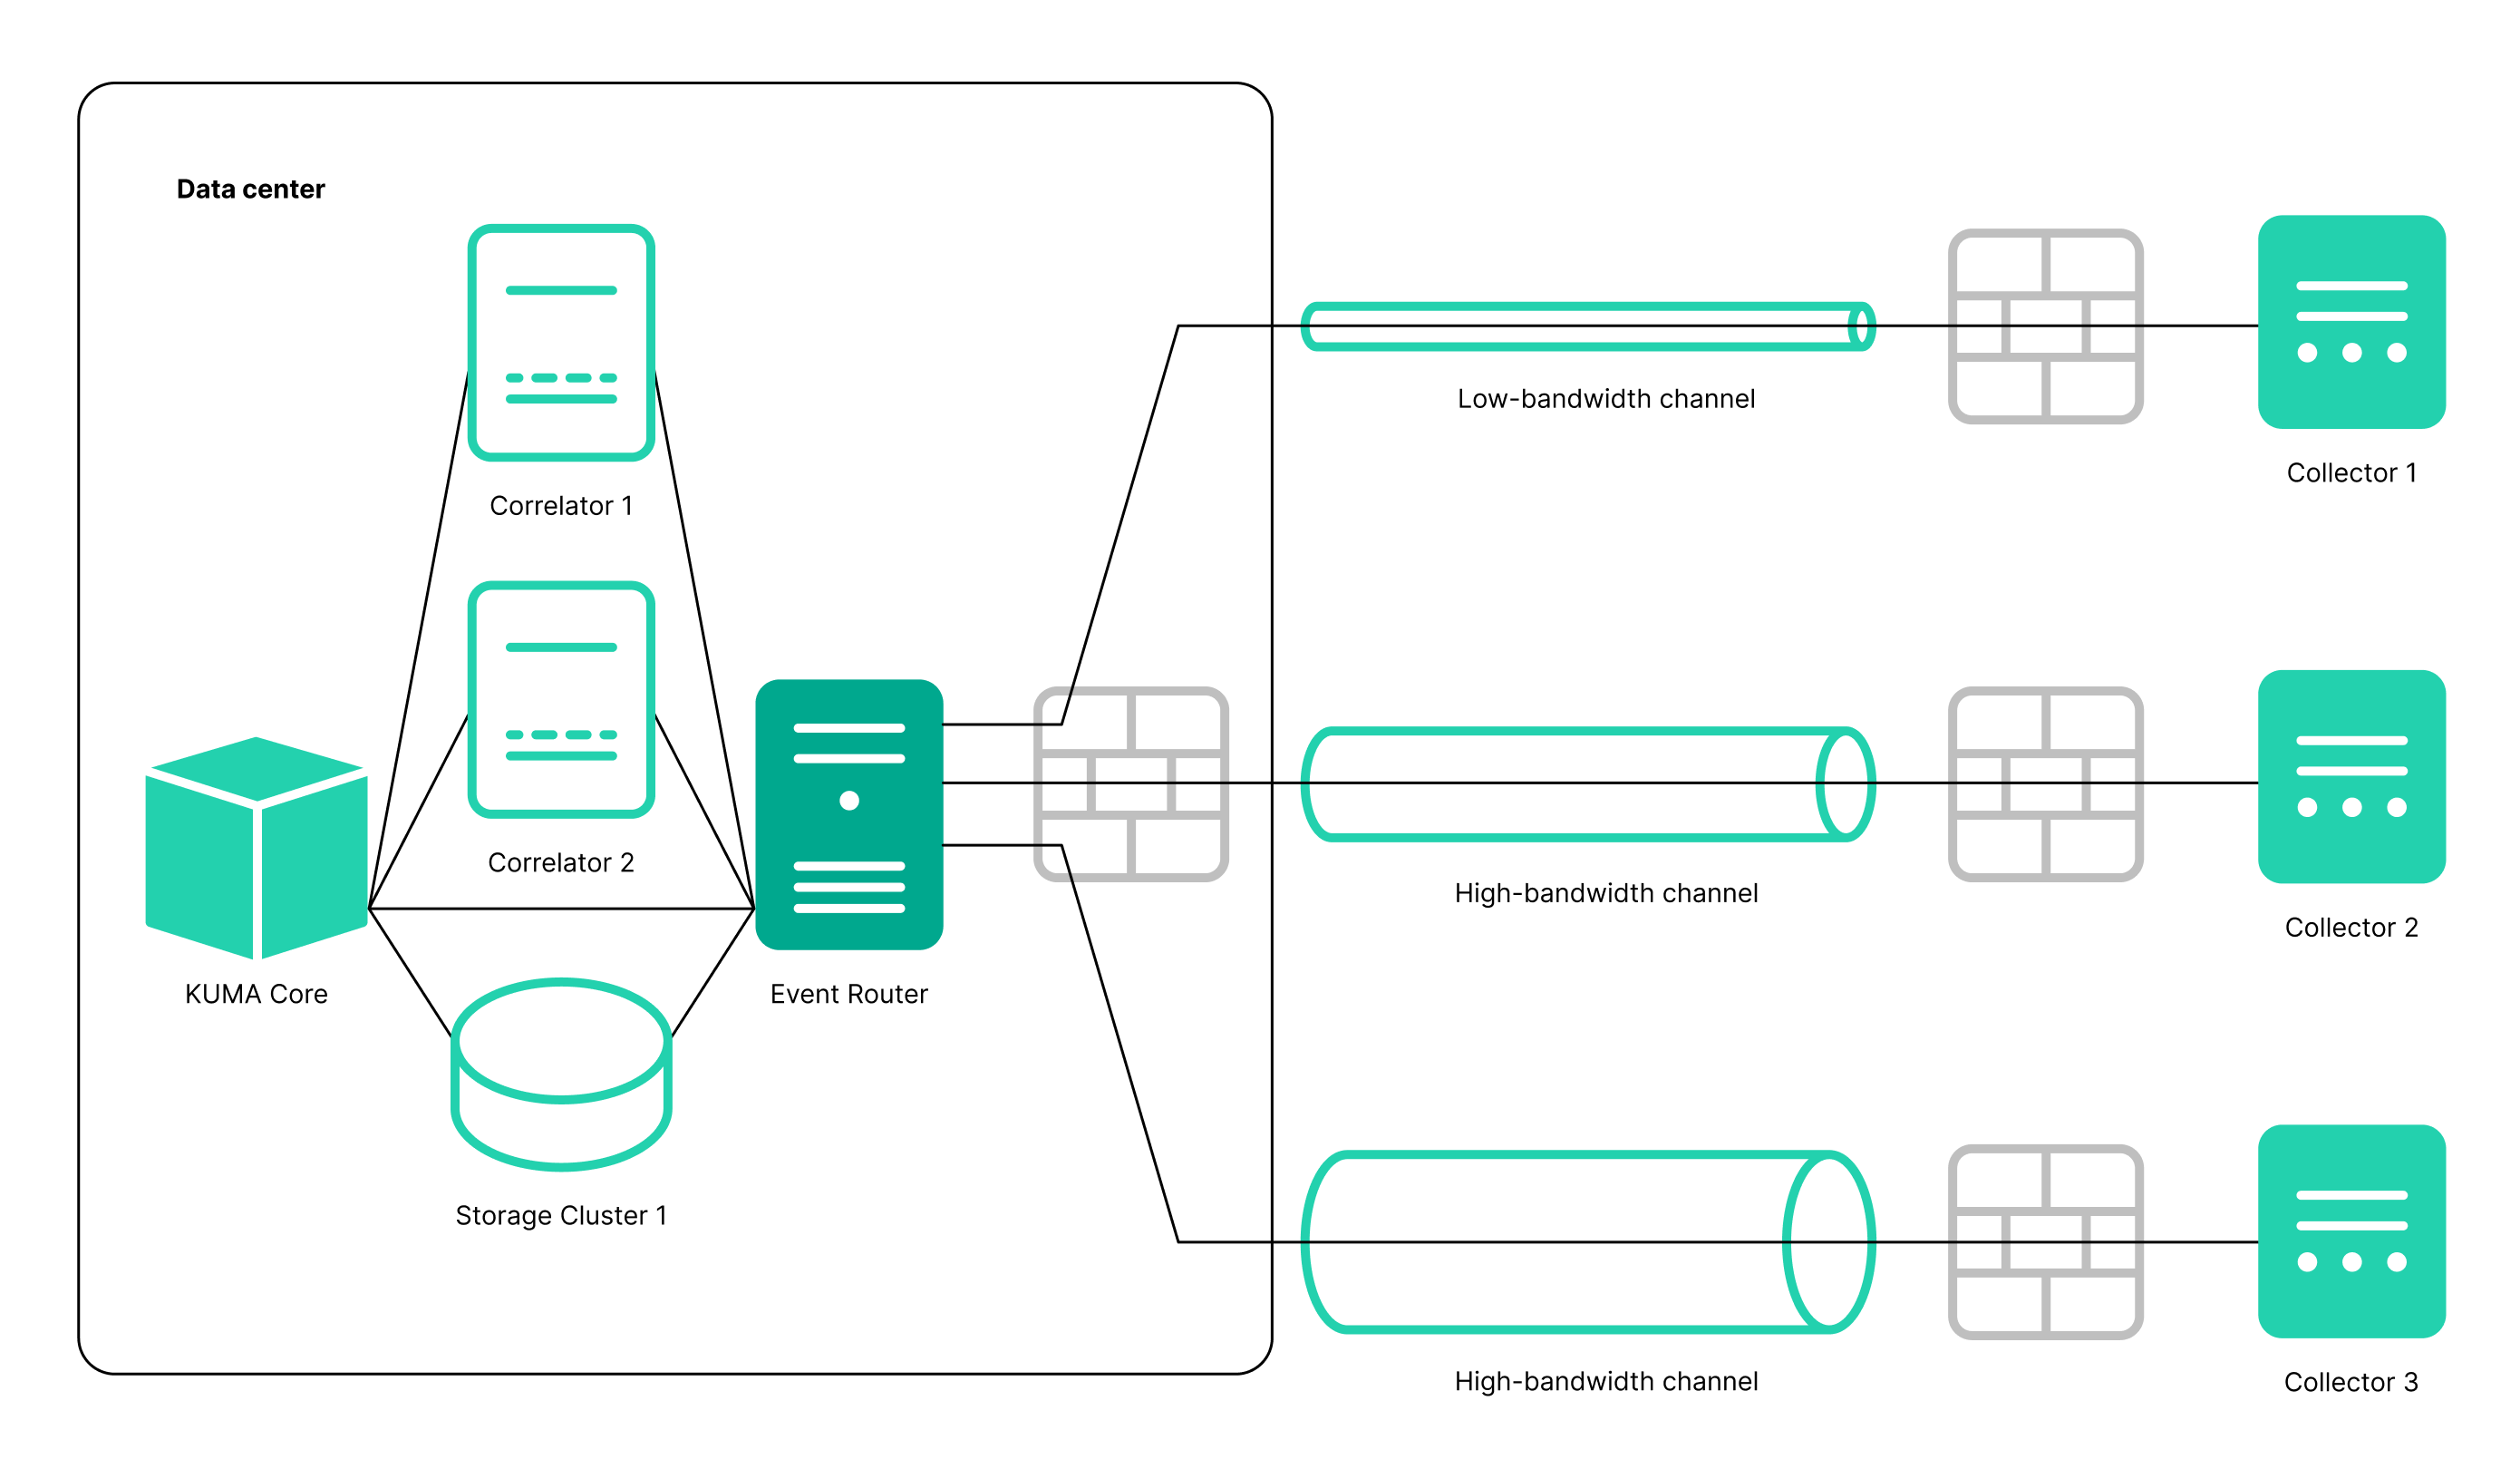
Preconditions:
- KUMA 3.2 collectors are configured at the branch offices.
- The data center has the capacity to install an event router.
- KUMA 3.2 is installed in the data center.
Steps:
- In the data center:
- Create the Event router service.
- Create storage and correlator destination points and specify them in the Event router.
- In the Event router on the Advanced settings tab, configure a filter to send events to storage and/or correlator. For example, "DeviceCustomString = correlator" or "DeviceCustomString = storage".
- Configure enrichment.
- In the collectors at branch offices:
- Create a destination of the eventRouter type.
- Specify the URL of the event router in the data center of the branch office.
- If eventRouter replaces previously configured destinations, you can delete them.
Postcondition:
- Collectors at the branch offices are configured.
- The event router in the data center is configured.
Connections of branch offices to the data center have been optimized: for each collector, you no longer need to configure events to be sent both to storage and to the correlator in the data center. This halves the load on the link.
Routing to the storage and the correlator is performed within the data center.
Multiple collectors send events to the event router at the branch office, and the event router at the branch office sends events to the router in the data center, where events are then sent to the specified destinations, that is, correlators and storage.
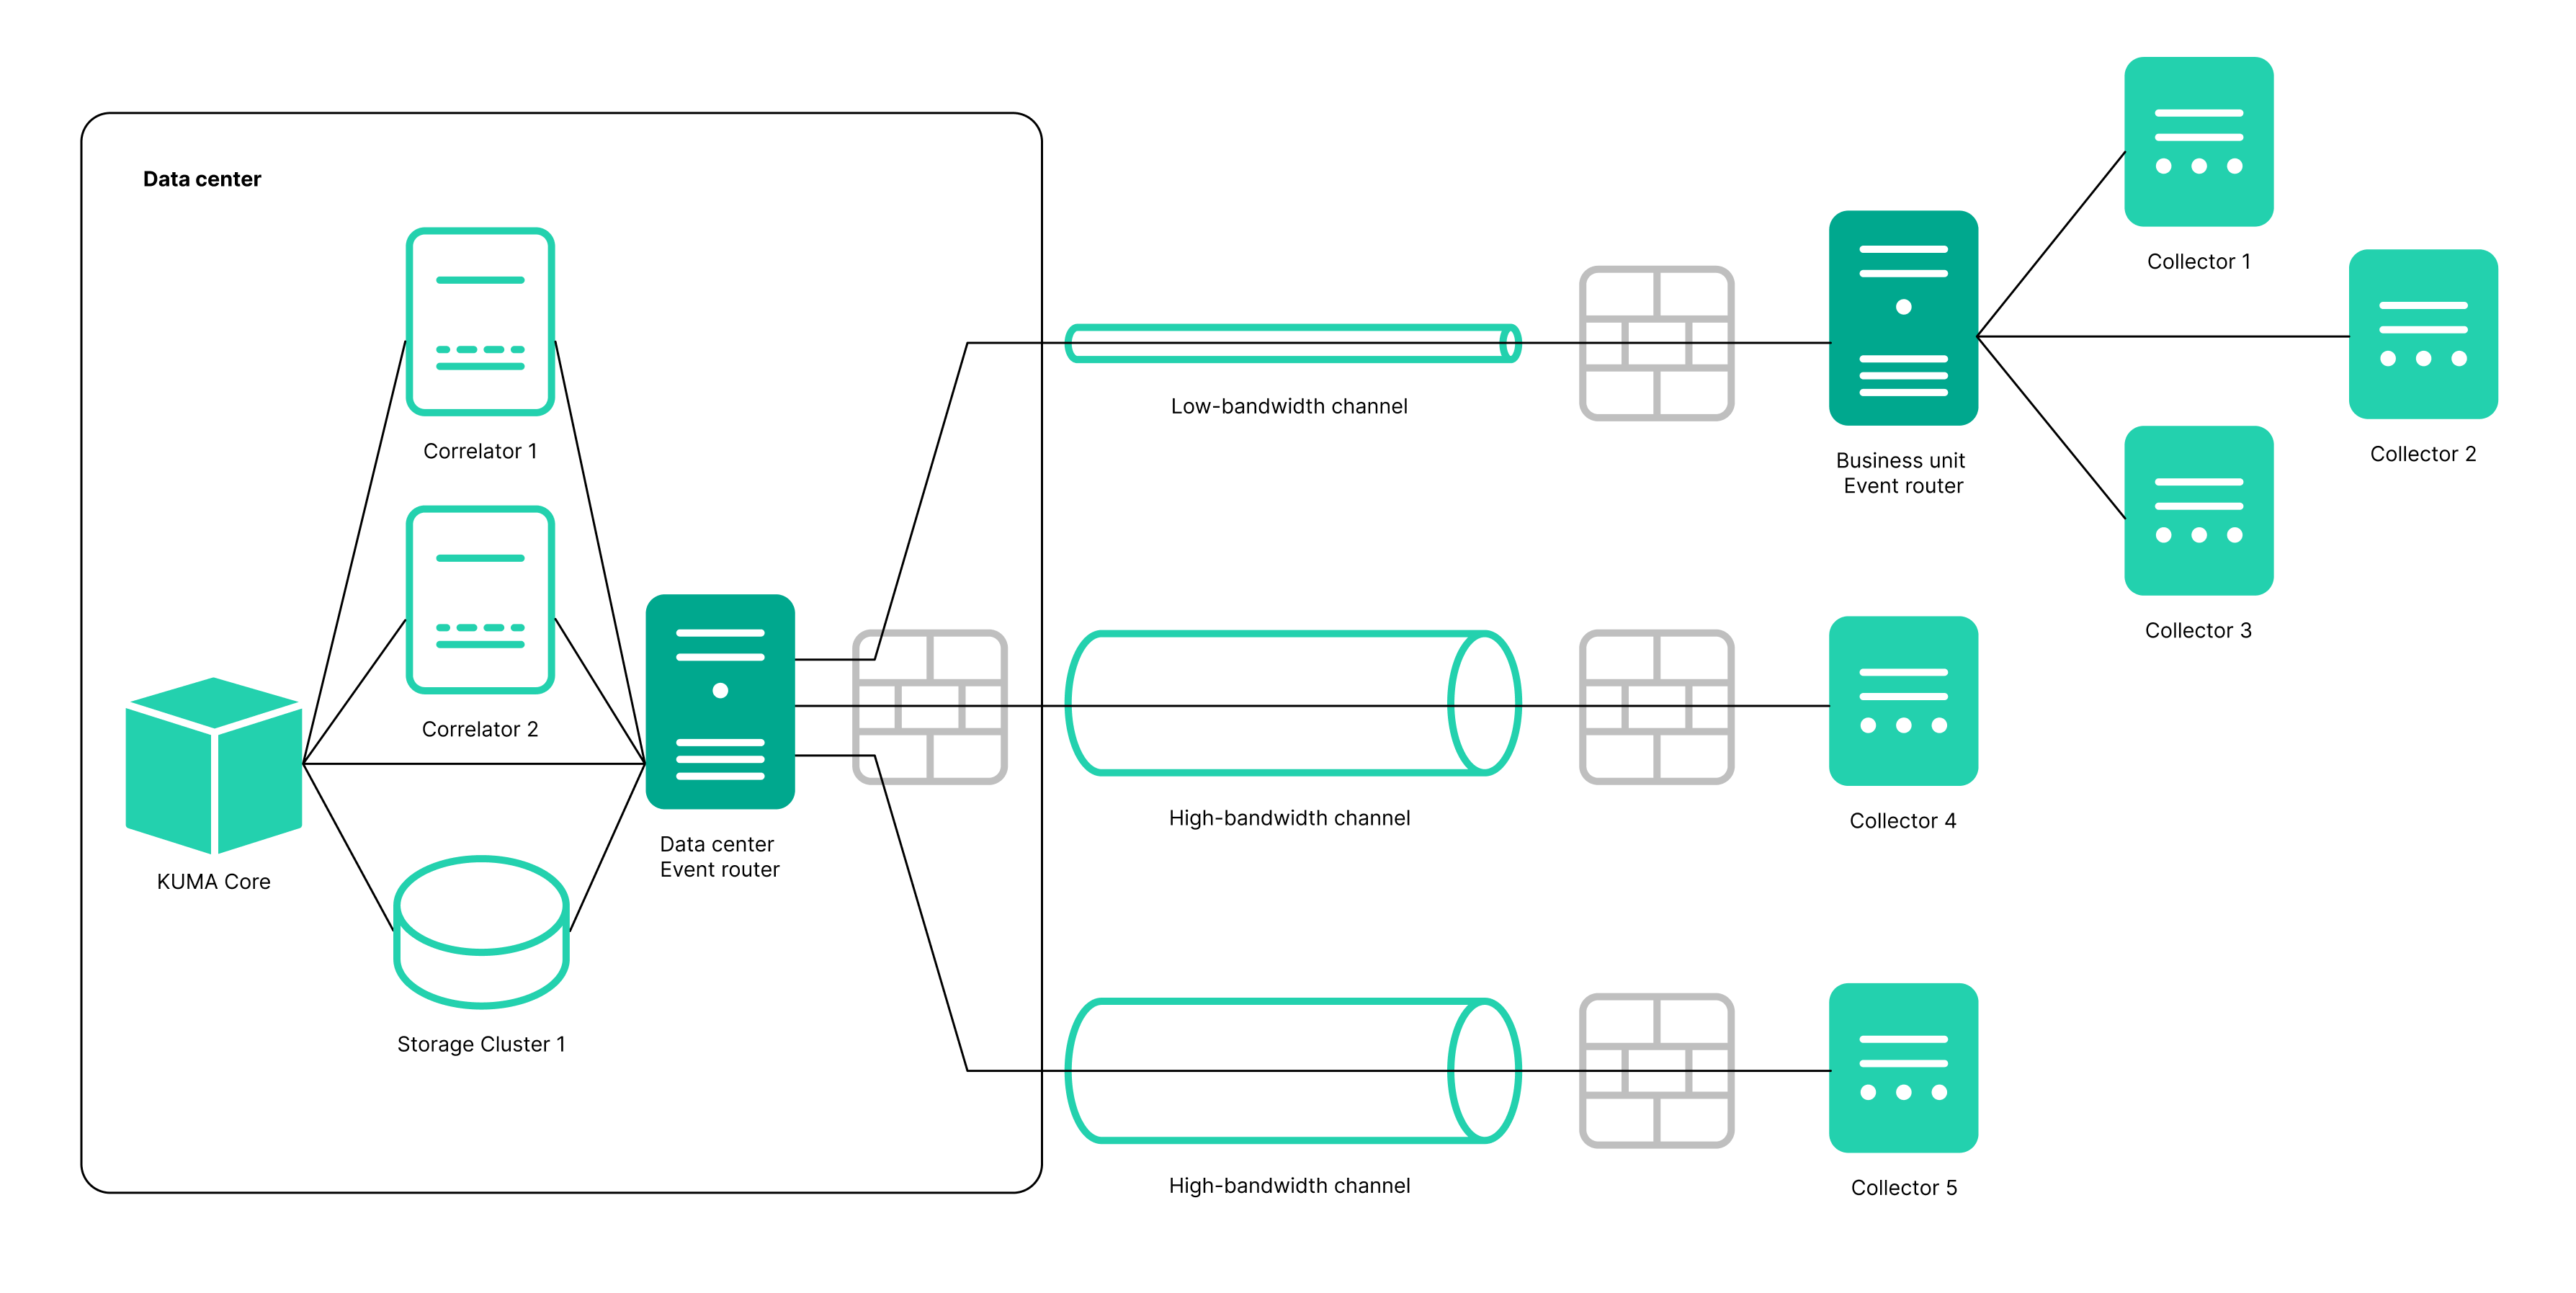
Preconditions:
- KUMA 3.2 collectors are configured at the branch offices.
- The data center has the capacity to install an event router.
- KUMA 3.2 is installed in the data center.
Steps:
- In the data center:
- Create the Event router service.
- Create storage and correlator destination points and specify them in the Event router.
- In the Event router on the Advanced settings tab, configure a filter to send events to storage and/or correlator. For example, "DeviceCustomString = correlator" or "DeviceCustomString = storage".
- At the branch office:
- Create the Event router service.
- Create a destination of the eventRouter type and specify the URL of the Event router in the data center.
- In the collectors at branch offices:
- Create a destination of the eventRouter type and specify the URL of the Event router at the branch office.
- If eventRouter replaces previously configured destinations, you can delete them.
Postcondition:
- Collectors at the branch offices are configured.
- The event router in the data center and the event router at the branch office are configured.
The connections of branch offices with the data center are optimized: in each collector, you no longer need to configure events to be sent to the data center; it is enough to collect all events on the router and send it to the data center as one stream.
The event router must be installed on a Linux device. Only a user with the General Administrator role can create the service. You can create a service in any tenant; the tenant relation does not impose any restrictions.
You can use the following metrics to get information about the service performance:
- IO
- Process
- OS
As with other resources, the following audit events are generated for the event router in KUMA:
- Resource was successfully added
- Resource was successfully updated
- Resource was successfully deleted
Installing an event router involves two steps:
- Create the event router service in the KUMA web interface using the Installation Wizard.
- Install the event router service on the server.
Starting the event router installation wizard
To start the event router installation wizard:
- In the KUMA web interface, in the Resources section, click Event routers.
- This opens the Event routers window; in that window, click Add.
Follow the instructions of the installation wizard.
Step 1. General settings of the event router
This is a required step of the Installation Wizard. At this step, you specify the main settings of the event router: its name and the tenant that will own it.
To specify the general settings of the event router:
- On the Basic settings tab, fill in the following fields:
- In the Name field, enter a unique name for the service you are creating. The name must contain 1 to 128 Unicode characters.
- In the Tenant drop-down list, select the tenant that will own the event router. An event router belonging to a tenant is organizational in nature and does not impose any restrictions.
- If necessary, specify the number of processes that the service can run concurrently in the Handlers field. By default, the number of handlers is the same as the number of vCPUs on the server where the service is installed.
- You can optionally add up to 4000 Unicode characters describing the service in the Description field.
- On the Advanced settings tab, fill in the following fields:
- If necessary, use the Debug toggle switch to enable logging of service operations.
- You can use the Create dump periodically toggle switch at the request of Technical Support to generate resource (CPU, RAM, etc.) utilization reports in the form of dumps.
- In the Dump settings field, you can specify the settings to be used when creating dumps. For instructions on filling out this field, please contact Technical Support.
General settings of the event router are specified. Proceed to the next step of the Installation Wizard.
Page topStep 2. Routing
This is a required step of the Installation Wizard. We recommend sending events to at least two destinations: to the correlator for analysis and to the storage for storage. You can also select another event router as the destination.
To specify the settings of the destination to which you want the event router to send events received from collectors:
- In the Routing step of the installation wizard, click Add.
- This opens the Create destination window; in that window, specify the following settings:
- On the Basic settings tab, in the Name field, enter a unique name for the destination. The name must contain 1 to 128 Unicode characters.
- You can use the State toggle switch to enable or disable the service as needed.
- In the Type drop-down list, select the type of the destination. The following values are available:
- On the Advanced settings tab, specify the values of parameters. The set of parameters that can be configured depends on the type of the destination selected on the Basic settings tab. For detailed information about parameters and their values, click the link for each type of destination in paragraph "c." of these instructions.
The created destination is displayed on the Installation Wizard tab. A destination resource can be removed from the resource set by selecting it and clicking Delete in the opened window.
Routing is configured. You can proceed to the next step of the installation wizard.
Page topStep 3. Setup validation
This is the required, final step of the Installation Wizard.
To create an event router in the installation wizard:
- Click Create and save service.
The lower part of the window displays the command that you must use to install the router on the server.
Example command:
/opt/kaspersky/kuma/kuma eventrouter --core https://kuma-example:<
port used for communication with the KUMA Core> --id <event router service ID> --api.port <port used for communication with the service> --installThe port for communication with the KUMA Core, the service ID, and the port for communication with the service are added to the command automatically. You must also ensure the network connectivity of KUMA and open the ports used by its components, if necessary.
- Close the Wizard by clicking Save.
The service is installed in the KUMA web interface. You can now proceed with installing the service in the KUMA network infrastructure.
Page topInstalling the event router on the server
To install the event router on the server:
- Log in to the server where you want to install the event router service.
If you want to install the event router service on a separate server, use one of the hosts specified in the
kuma_correlatorparameter. - Create the /opt/kaspersky/kuma/ directory.
- Copy the "kuma" file to the "/opt/kaspersky/kuma/" directory. The file is located inside the installer in the "/kuma-ansible-installer/roles/kuma/files/" directory.
- Make sure the kuma file has sufficient rights to run. If the file is not executable, make it executable:
sudo chmod +x /opt/kaspersky/kuma/kuma - Place the LICENSE file from the /kuma-ansible-installer/roles/kuma/files/ directory in the /opt/kaspersky/kuma/ directory and accept the license by running the following command:
sudo /opt/kaspersky/kuma/kuma license - Create the 'kuma' user:
sudo useradd --system kuma && usermod -s /usr/bin/false kuma - Make the 'kuma' user the owner of the /opt/kaspersky/kuma directory and all files inside the directory:
sudo chown -R kuma:kuma /opt/kaspersky/kuma/ - Add the KUMA event router port to firewall exclusions.
For the application to run correctly, ensure that the KUMA components are able to interact with other components and applications over the network via the protocols and ports specified during the installation of the KUMA components.
- Execute the following command:
sudo /opt/kaspersky/kuma/kuma eventrouter --core https://<FQDN of the KUMA Core server>:<port used by KUMA Core server for internal communication (port 7210 by default)> --id <service ID copied from the KUMA web interface> --api.port <port used for communication with the installed component> --installExample:
sudo /opt/kaspersky/kuma/kuma eventrouter --core https://kuma.example.com:7210 --id XXXX --api.port YYYY --install
The event router is installed on the server. You can use it to receive events from collectors and relay the events to specified destinations.
Page topCreating a collector
A collector receives raw events from event sources, performs normalization, and sends processed events to their destinations. The maximum size of an event that can be processed by the KUMA collector is 4 MB.
If you are using the SMB license, and both the hourly average EPS and the daily average EPS allowed by the license is exceeded for a collector, the collector stops receiving events and is displayed with a red status and a notification about the EPS limit being exceeded. The user with the General Administrator role gets a notification about the EPS limit being exceeded and the collector being stopped. Every hour, the hourly average EPS value is recalculated and compared with the EPS limit in the license. If the hourly average is under the limit, the restrictions on the collector are lifted, and the collector resumes receiving and processing events.
Installing a collector involves two steps:
- Create the collector in the KUMA web interface using the Installation Wizard. In this step, you specify the general collector settings to be applied when installing the collector on the server.
- Install the collector on the network infrastructure server on which you want to receive events.
Actions in the KUMA web interface
The creation of a collector in the KUMA web interface is carried out by using the Installation Wizard. This Wizard combines the required resources into a resource set for a collector. Upon completion of the Wizard, the service itself is automatically created based on this resource set.
To create a collector in the KUMA web interface,
Start the Collector Installation Wizard:
- In the KUMA web interface, in the Resources section, click Add event source button.
- In the KUMA web interface in the Resources → Collectors section click Add collector button.
As a result of completing the steps of the Wizard, a collector service is created in the KUMA web interface.
A resource set for a collector includes the following resources:
- Connector
- Normalizer (at least one)
- Filters (if required)
- Aggregation rules (if required)
- Enrichment rules (if required)
- Destinations (normally two are defined for sending events to the correlator and storage)
These resources can be prepared in advance, or you can create them while the Installation Wizard is running.
Actions on the KUMA Collector Server
When installing the collector on the server that you intend to use for receiving events, run the command displayed at the last step of the Installation Wizard. When installing, you must specify the identifier automatically assigned to the service in the KUMA web interface, as well as the port used for communication.
Testing the installation
After creating a collector, you are advised to make sure that it is working correctly.
Starting the Collector Installation Wizard
A collector consists of two parts: one part is created inside the KUMA web interface, and the other part is installed on the network infrastructure server intended for receiving events. The Installation Wizard creates the first part of the collector.
To start the Collector Installation Wizard:
- In the KUMA web interface, in the Resources section, click Add event source.
- In the KUMA web interface in the Resources → Collectors section click Add collector.
Follow the instructions of the Wizard.
Aside from the first and last steps of the Wizard, the steps of the Wizard can be performed in any order. You can switch between steps by using the Next and Previous buttons, as well as by clicking the names of the steps in the left side of the window.
After the Wizard completes, a resource set for a collector is created in the KUMA web interface under Resources → Collectors, and a collector service is added under Resources → Active services.
Step 1. Connect event sources
This is a required step of the Installation Wizard. At this step, you specify the main settings of the collector: its name and the tenant that will own it.
To specify the general settings of the collector:
- On the Basic settings tab, fill in the following fields:
- In the Collector name field, enter a unique name for the service you are creating. The name must contain 1 to 128 Unicode characters.
When certain types of collectors are created, agents named
agent: <Collector name>, auto createdare also automatically created together with the collectors. If this type of agent was previously created and has not been deleted, you cannot create a collector named<Collector name>. If this is the case, you will have to either specify a different name for the collector or delete the previously created agent. - In the Tenant drop-down list, select the tenant that will own the collector. The tenant selection determines what resources will be available when the collector is created.
If you return to this window from another subsequent step of the Installation Wizard and select another tenant, you will have to manually edit all the resources that you have added to the service. Only resources from the selected tenant and shared tenant can be added to the service.
- If required, specify the number of processes that the service can run concurrently in the Workers field. By default, the number of worker processes is the same as the number of vCPUs on the server where the service is installed.
- You can optionally add up to 256 Unicode characters describing the service in the Description field.
- In the Collector name field, enter a unique name for the service you are creating. The name must contain 1 to 128 Unicode characters.
- On the Advanced settings tab, fill in the following fields:
- If necessary, use the Debug toggle switch to enable logging of service operations. Error messages of the collector service are logged even when debug mode is disabled. The log can be viewed on the machine where the collector is installed, in the /opt/kaspersky/kuma/collector/<collector ID>/log/collector directory.
- You can use the Create dump periodically toggle switch at the request of Technical Support to generate resource (CPU, RAM, etc.) utilization reports in the form of dumps.
- In the Dump settings field, you can specify the settings to be used when creating dumps. For instructions on filling out this field, please contact Technical Support.
General settings of the collector are specified. Proceed to the next step of the Installation Wizard.
Page topStep 2. Transport
This is a required step of the Installation Wizard. On the Transport tab of the Installation Wizard, select or create a connector and in its settings, specify the source of events for the collector service.
To add an existing connector to a resource set,
select the name of the required connector from the Connector drop-down list.
The Transport tab of the Installation Wizard displays the settings of the selected connector. You can open the selected connector for editing in a new browser tab using the button.
To create a new connector:
- Select Create new from the Connector drop-down list.
- In the Type drop-down list, select the connector type and specify its settings on the Basic settings and Advanced settings tabs. The available settings depend on the selected type of connector:
- tcp
- udp
- netflow
- sflow
- nats-jetstream
- kafka
- http
- sql
- file
- 1c-log
- 1c-xml
- diode
- ftp
- nfs
- wmi
- wec
- etw
- snmp
- snmp-trap
- kata\edr
- vmware
- elastic
When using the tcp or udp connector type at the normalization stage, IP addresses of the assets from which the events were received will be written in the DeviceAddress event field if it is empty.
When using a wmi, wec, or etw connector, agents are automatically created for receiving Windows events.
It is recommended to use the default encoding (UTF-8), and to apply other settings only if bit characters are received in the fields of events.
Making KUMA collectors to listen on ports up to 1,000 requires running the service of the relevant collector with root privileges. To do this, after installing the collector, add the line
AmbientCapabilities = CAP_NET_BIND_SERVICEto its systemd configuration file in the [Service] section.
The systemd file is located in the /usr/lib/systemd/system/kuma-collector-<collector ID>.service directory.
The connector is added to the resource set of the collector. The created connector is only available in this resource set and is not displayed in the web interface Resources → Connectors section.
Proceed to the next step of the Installation Wizard.
Page topStep 3. Event parsing
This is a required step of the Installation Wizard. On the Event parsing tab of the Installation Wizard, click the + Add event parsing button to open the Basic event parsing window, and in that window, in the Normalizer drop-down list, select or create a normalizer. In normalizer settings, define the rules for converting raw events into normalized events. You can add multiple event parsing rules to the normalizer to implement complex event processing logic. You can test the normalizer using test events.
When you create a new normalizer in the Installation Wizard, the default normalizer is saved in the resource set for the collector. You cannot use the created normalizer in other collectors. You can select the Save normalizer check box to create the normalizer as a separate resource. This will make the normalizer available for selection in other collectors of the tenant.
If, when editing the settings of a resource set of a collector, you edit or delete conversions in a normalizer connected to the resource set of the collector, the edits will not be saved, and the normalizer itself may be corrupted. If you need to modify conversions in a normalizer that is already part of a service, the changes must be made directly in the normalizer under Resources → Normalizers in the web interface.
Adding a normalizer to a resource set
To add a normalizer to a resource set:
- Click the + Add event parsing button.
This opens the Basic event parsing window with the normalizer settings. By default, the Normalization scheme tab is selected.
- In the Normalizer drop-down list, select a normalizer. You can select a normalizer that belongs to the tenant of the collector or to the common tenant.
The normalizer settings are displayed.
If you want to edit the settings of the normalizer, in the Normalizer drop-down list, click the pencil
 icon next to the name of the normalizer to open the Edit normalizer window, and in that window, click the dark circle. This opens the Basic event parsing window with the normalizer settings. If you want to edit additional parsing settings, in the Edit normalizer window, hover over the dark circle and click the plus symbol that appears. This opens the Additional event parsing with settings of the additional parsing. For more details on configuring the additional parsing of events, see the Creating the structure of event normalization rules section below.
 - Click OK.
The normalizer is added and displayed as a dark circle on the Event parsing tab of the Installation Wizard. You can click the dark circle to view the settings of the normalizer.
To create a new normalizer in the collector:
- Click the + Add event parsing button.
This opens the Basic event parsing window with the normalizer settings. By default, the Normalization scheme tab is selected.
- If you want to create the normalizer as a separate resource, select the Save normalizer check box. If the check box is selected, the normalizer becomes available for selection in other collectors of the tenant. This check box is cleared by default.
- In the Name field, enter a unique name for the normalizer. Maximum length of the name: 128 Unicode characters.
- In the Parsing method drop-down list, select the type of events to receive. Depending on the selected value, you can use the predefined event field matching rules or define rules manually. When you select some parsing methods, additional settings may become available that you must specify.
Available parsing methods:
- json
- cef
- regexp
This parsing method is used to create custom rules for processing data in a format using regular expressions.
You must add a regular expression (RE2 syntax) with named capturing groups to the field under Normalization. The name of the capturing group and its value are considered the field and value of the raw event that can be converted to an event field in KUMA format.
To add event handling rules:
- If necessary, copy an example of the data you want to process to the Event examples field. We recommend completing this step.
- In the field under Normalization, add a RE2 regular expression with named capturing groups, for example,
"(?P<name>regexp)". The regular expression added to the field under Normalization must exactly match the event. When designing the regular expression, we recommend using special characters that match the starting and ending positions of the text:^,$.You can add multiple regular expressions or remove regular expressions. To add a regular expression, click Add regular expression. To remove a regular expression, click the delete icon
next to it. - Click the Copy field names to the mapping table button.
Capture group names are displayed in the KUMA field column of the Mapping table. You can select the corresponding KUMA field in the column opposite each capturing group. If you followed the CEF format when naming the capturing groups, you can use automatic CEF mapping by selecting the Use CEF syntax for normalization check box.
Event handling rules are added.
- syslog
- csv
- kv
- xml
This parsing method is used to process XML data in which each object, including nested objects, occupies a single line in a file. Files are processed line by line.
If you want to send the raw event for advanced normalization, at each nesting level in the Advanced event parsing window, select Yes in the Keep raw event drop-down list.
If you select this parsing method, under XML attributes, you can specify the key XML attributes to be extracted from tags. If an XML structure has multiple XML attributes with different values in the same tag, you can identify the necessary value by specifying the key of the value in the Source column of the Mapping table.
To add key XML attributes:
- Click + Add field.
- This opens a window; in that window, specify the path to the XML attribute.
You can add multiple XML attributes or remove XML attributes. To remove an individual XML attribute, click the delete icon
next to it. To remove all XML attributes, click Reset.If XML key attributes are not specified, then in the course of field mapping the unique path to the XML value will be represented by a sequence of tags.
Tag numbering
Starting with KUMA 2.1.3, you can use automatic tag numbering in XML events. This lets you parse an event with the identical tags or unnamed tags, such as
<Data>.As an example, we will number the tags of the
EventDataattribute of the Microsoft Windows PowerShell event ID 800.To parse events with identical tags or unnamed tags, you need to configure tag numbering and data mapping for numbered tags with KUMA event fields.
KUMA 3.0.x supports using XML attributes and tag numbering at the same time in the same extra normalizer. If an XML attribute contains unnamed tags or identical tags, we recommend using tag numbering. If the XML attribute contains only named tags, we recommend using XML attributes.
To use XML attributes and tag numbering in extra normalizers, you must sequentially enable the Keep raw event setting in each extra normalizer along the path that the event follows to the target extra normalizer, and in the target extra normalizer itself.
For an example of how tag numbering works, you can refer to the MicrosoftProducts normalizer. The Keep raw event setting is enabled sequentially in both AD FS and 424 extra normalizers.
To set up the parsing of events with unnamed or identical tags:
- Open an existing normalizer or create a new normalizer.
- In the Basic event parsing window of the normalizer, in the Parsing method drop-down list, select xml.
- In the Tag numbering field, click + Add field.
- In the displayed field, enter the full path to the tag to whose elements you want to assign a number, for example,
Event.EventData.Data. The first tag gets number 0. If the tag is empty, for example,<Data />, it is also assigned a number. - To configure data mapping, under Mapping, click + Add row and do the following:
- In the displayed row, in the Source field, enter the full path to the tag and the index of the tag. For example, for the Microsoft Windows PowerShell event ID 800 from the example above, the full paths to tags and tag indices are as follows:
Event.EventData.Data.0Event.EventData.Data.1Event.EventData.Data.2and so on.
- In the KUMA field drop-down list, select the field in the KUMA event that will receive the value from the numbered tag after parsing.
- In the displayed row, in the Source field, enter the full path to the tag and the index of the tag. For example, for the Microsoft Windows PowerShell event ID 800 from the example above, the full paths to tags and tag indices are as follows:
- Save changes in one of the following ways:
- If you created a new normalizer, click Save.
- If you edited an existing normalizer, in the collector to which the normalizer is linked, click Update configuration.
Parsing is configured.
- netflow
- netflow5
- netflow9
- sflow5
- ipfix
- sql. This parsing method becomes available only if at the Transport step of the Installation Wizard you specified a connector of the sql type.
- In the Keep raw event drop-down list, specify whether you want to store the original raw event in the re-created normalized event.
- Don't save—do not save the raw event. This value is selected by default.
- Only errors—save the raw event in the
Rawfield of the normalized event if errors occurred when parsing it. You can use this value to debug the service. In this case, an event having a non-emptyRawfield will indicate problems. - Always—always save the raw event in the
Rawfield of the normalized event.
- In the Keep extra fields drop-down list, choose whether you want to store the raw event fields in the normalized event if no mapping is configured for them (see step 8 of these instructions):
- No. This value is selected by default.
- Yes. The original event fields are saved in the
Extrafield of the normalized event.
- If necessary, provide an example of the data you want to process to the Event examples field. We recommend completing this step.
- In the Mapping table, configure the mapping of raw event fields to KUMA event fields:
- Click + Add row.
You can add multiple table rows or delete table rows. To delete a table row, select the check box next to it and click the Delete button.
- In the Source column, specify the name of the raw event field that you want to map to the KUMA event field.
For details about the field name format, refer to the Normalized event data model article. For a description of the mapping, refer to the Mapping fields of predefined normalizers article.
If you want to create rules for modifying the fields of the original event before writing to the KUMA event fields, click the settings
 icon next to the field name to open the Conversion window, and in that window, click + Add conversion. You can reorder the rules or delete the rules. To reorder rules, use the reorder
  icons. To delete a rule, click the delete
  icon next to it.
If at the Transport step of the Installation Wizard, you specified a connector of the file type, you can pass the name or path of the file being processed by the collector to the KUMA event field. To do this, in the Source column, specify one of the following values:
$kuma_fileSourceNameto pass the name of the file being processed by the collector in the KUMA event field.$kuma_fileSourcePathto pass the path to the file being processed by the collector in the KUMA event field.
When you use a file connector, the new variables in the normalizer will only work with destinations of the internal type.
- In the KUMA field column, select a KUMA event field from the drop-down list. You can find the KUMA event field by typing its name. If the name of the KUMA event field begins with
DeviceCustom*orFlex*, enter a unique custom label in the Label field, if necessary.
If you want KUMA to enrich events with asset information, and the asset information to be available in the alert card when a correlation rule is triggered, in the Mapping table, configure a mapping of host address and host name fields depending on the purpose of the asset. For example, you can configure a mapping for SourceAddress and SourceHostName, or DestinationAddress and DestinationHostName KUMA event fields. As a result of enrichment, the event card includes a SourceAssetID or DestinationAssetID KUMA event field, and a link to the asset card. As a result of enrichment, asset information is also available in the alert card.
If you have loaded data into the Event examples field, the table will have an Examples column containing examples of values carried over from the raw event field to the KUMA event field.
- Click + Add row.
- Click OK.
The normalizer is created and displayed as a dark circle on the Event parsing tab of the Installation Wizard. You can click the dark circle to view the settings of the normalizer. If you want to edit additional parsing settings, hover over the dark circle and click the plus symbol that appears. This opens the Additional event parsing with settings of the additional parsing. For more details on configuring the additional parsing of events, see the Creating the structure of event normalization rules section below.
Enriching normalized events with additional data
You can create enrichment rules in the normalizer to add extra data to created normalized events. Enrichment rules are stored in the normalizer in which they were created.
To add enrichment rules to the normalizer:
- Select the main or additional normalization rule to open a window, and in that window, select the Enrichment tab.
- Click the + Add enrichment button.
The enrichment rule settings section is displayed. You can add multiple enrichment rules or delete enrichment rules. To delete an enrichment rule, click the delete
icon next to it. - In the Source kind drop-down list, select the type of the enrichment source. When you select some enrichment source types, additional settings may become available that you must specify.
Available Enrichment rule source types:
- constant
- dictionary
- table
This type of enrichment is used if you need to add a value from the dictionary of the Table type. Available enrichment type settings are listed in the table below.
Available enrichment type settings
Setting
Description
Dictionary name
The dictionary from which the values are to be taken.
Key fields
Event fields whose values are to be used for selecting a dictionary entry. To add an event field, click Add field. You can add multiple event fields.
Mapping
Event fields for data transfer:
- Dictionary field specifies dictionary fields from which data is to be transmitted. The available fields depend on the selected dictionary resource.
- KUMA field specifies event fields to which data is to be transmitted. For some of the selected fields (
*custom*and*flex*), in the Label column, you can specify a name for the data written there.
The first field in the table (Dictionary field) is taken as the key with which the fields selected from the event as key fields are matched (KUMA field). As the key in the Dictionary field, you must select an indicator of compromise by which the enrichment is to be performed, for example, IP address, URL, or hash. In the rule, you must select the event field that corresponds to the selected indicator of compromise in the dictionary field.
If you want to select multiple key fields, you can specify them using
|as a separator (when specifying in the web interface or importing as a CSV file), for example,<IP address>|<user name>.You can add new table rows or delete table rows. To add a new table row, click Add new element. To delete a row in the table, click the
button. - event
This type of enrichment is used when you need to write a value from another event field to the current event field. Available enrichment type settings are listed in the table below.
Available enrichment type settings
Setting
Description
Target field
The KUMA event field that you want to populate with the data.
Source field
The event field whose value is written to the target field.
Clicking
 opens the Conversion window, in which you can click Add conversion to create rules for modifying the source data before writing them to the KUMA event fields. You can reorder and delete created rules. To change the position of a rule, click next to it. To delete a rule, click next to it.
When using enrichment of events that have event selected as the Source kind and the extended event schema fields are used as arguments, the following special considerations apply:
- If the source extended event schema field has the
Array of stringstype, and the target extended event schema field has theStringtype, the values are written to the target extended event schema field in TSV format.Example: The
SA.StringArrayextended event schema field contains values:"string1","string2","string3". An event enrichment operation is performed. The result of the event enrichment operation is written to theDeviceCustomString1extended event schema field. TheDeviceCustomString1extended event schema field contains values:["string1", "string2", "string3"]. - If the source and target extended event schema fields have the
Array of stringstype, values of the source extended event schema field are added to the values of the target extended event schema field, and the "," character is used as the delimiter.Example: The
SA.StringArrayOnefield of the extended event scheme contains the["string1","string2","string3"]values, and theSA.StringArrayTwofield of the extended event scheme contains the["string4", "string5", "string6"]values. An event enrichment operation is performed. The result of the event enrichment operation is written to theSA.StringArrayTwofield of the extended event scheme. TheSA.StringArrayTwoextended event schema field contains values:["string4", "string5", "string6", "string1", "string2", "string3"].
- If the source extended event schema field has the
- template
- In the Target field drop-down list, select the KUMA event field to which you want to write the data. You cannot select a value if in the Source kind drop-down list, you selected table.
- If you want to enable details in the normalizer log, enable the Debug toggle switch. The toggle switch is turned off by default.
- Click OK.
The event enrichment rules with additional data are added to the normalizer into the selected parsing rule.
Configuring parsing linked to IPv4 addresses
If at the Transport step of the Installation Wizard, you specified a connector of the udp, tcp, or http type, you can forward events from multiple IPv4 addresses from sources of different types to the same collector, and have the collector apply the specified normalizers. To do this, you need to specify several IPv4 addresses and select the normalizer that you want to apply to events coming from the specified IPv4 addresses. The following types of normalizers are available: json, cef, regexp, syslog, csv, kv, and xml.
If you select a connector type other than udp, tcp, or http in a collector with configured normalizers and linking to IPv4 addresses, the Parsing settings tab is no longer displayed, and only the first of the previously specified normalizers is specified on the Event parsing tab of the Installation Wizard. The Parsing settings tab is hidden immediately, and the changes are applied after the resource is saved. If you want to restore the previous settings, exit the Installation Wizard without saving.
For normalizers of the Syslog and regexp types, you can use of a chain of normalizers. In this case, you can specify additional normalization conditions depending on the value of the DeviceProcessName field. The difference from extra normalization is that you can specify shared normalizers.
To configure parsing with linking to IPv4 addresses:
- Select the Parsing settings tab and click the + Event source button.
A group of parsing settings is displayed. You can add multiple parsings or delete parsings. To remove a parsing, click the delete
icon next to it. - In the IP address(es) field, enter the IPv4 address from which events will be sent. You can specify multiple IP addresses separated by commas. The length of the IPv4 address list is unlimited; however, we recommend limiting the number of IPv4 addresses to keep the load on the collector balanced. You must specify a value in this field if you want to apply multiple normalizers in one collector.
The IPv4 address must be unique for each normalizer. KUMA checks the uniqueness of IPv4 addresses, and if you specify the same IPv4 address for different normalizers, the
Field must be uniquemessage is displayed.If you want to send all events to the same normalizer without specifying IPv4 addresses, we recommend creating a separate collector. To improve performance, we recommend creating a separate collector with one normalizer if you want to apply the same normalizer to events from a large number of IPv4 addresses.
- In the Normalizer drop-down list, create or select a normalizer. You can click the arrow icon next to the drop-down list to select the Parsing schemas tab.
Normalization will be triggered if at the Transport step of the Installation Wizard, you specified a connector of the udp, tcp, or http type. For a http connector, you must specify the header of the event source. Taking into account the available connectors, the following normalizer types are available for automatic source recognition: json, cef, regexp, syslog, csv, kv, and xml.
- If you selected a normalizer of the Syslog or regexp type, and you want to add a conditional normalization, click the + Add conditional normalization button. Conditional normalization is available if in the Mapping table of the main normalizer, you configured the mapping of the source event field to the DeviceProcessName KUMA event field. Under Condition, in the DeviceProcessName field, specify a process name, and in the drop-down list, create or select a normalizer. You can specify multiple combinations of the DeviceProcessName KUMA event field and a normalizer. Normalization is performed until the first match.
Parsing with linking to IPv4 addresses is configured.
Creating a structure of event normalization rules
To implement complex event processing logic, you can add multiple event parsing rules to the normalizer. Events are switched between the parsing rules depending on the specified conditions. Events are processed sequentially in accordance with the creation order of the parsing rules. The event processing path is displayed as arrows.
To create an additional parsing rule:
- Create a normalizer. For more information on creating normalizers, see the Adding a normalizer to a resource set section earlier in this article.
The created normalizer is displayed as a dark circle on the Event parsing tab of the Installation Wizard.
- Hover over the dark circle and click the plus sign that appears.
- In the Additional event parsing window that opens, configure the additional event parsing rule:
- Extra normalization conditions tab:
If you want to send a raw event for extra normalization, select Yes in the Keep raw event drop-down list. The default value is No. We recommend passing a raw event to normalizers of json and xml types. If you want to send a raw event for extra normalization to the second, third, etc nesting levels, at each nesting level, select Yes in the Keep raw event drop-down list.
To send only the events with a specific field to the additional normalizer, specify the field in the Field to pass into normalizer field.
On this tab, you can define other conditions that must be satisfied for the event to be sent for additional parsing.
- Normalization scheme tab:
On this tab, you can configure event processing rules, similar to the main normalizer settings. The Keep raw event setting is not available. The Event examples field displays the values specified when the normalizer was created.
- Enrichment tab:
On this tab, you can configure enrichment rules for events. For more details on configuring enrichment rules, see the Enriching normalized events with additional data section earlier in this article.
- Extra normalization conditions tab:
- Click OK.
An additional parsing rule is added to the normalizer and displayed as a dark box. The dark box specifies the conditions that trigger the additional parsing rule.
You can do the following:
- You can chick the additional parsing rule to edit its settings.
- You can find an additional parsing rule by entering its name in the field in the upper part of the window.
- Create a new additional parsing rule. To do this, hover over the additional parsing rule and click on the plus icon that appears.
- Delete an additional parsing rule. To do this, hover over the additional parsing rule and click on the trash can icon.
Proceed to the next step of the Installation Wizard.
Page topStep 4. Filtering events
This is an optional step of the Installation Wizard. The Event filtering tab of the Installation Wizard allows you to select or create a filter whose settings specify the conditions for selecting events. You can add multiple filters to the collector. You can swap the filters by dragging them by the icon as well as delete them. Filters are combined by the AND operator.
When configuring filters, we recommend to adhere to the chosen normalization scheme. In filters, use only KUMA service fields and the fields that you specified in the normalizer in the Mapping and Enrichment sections. For example, if the DeviceAddress field is not used in normalization, avoid using the DeviceAddress field in a filter because such filtering will not work.
To add an existing filter to a collector resource set,
Click the Add filter button and select the required filter from the Filter drop-down menu.
To add a new filter to the collector resource set:
- Click the Add filter button and select Create new from the Filter drop-down menu.
- If you want to keep the filter as a separate resource, select the Save filter check box. This can be useful if you decide to reuse the same filter across different services. This check box is cleared by default.
- If you selected the Save filter check box, enter a name for the created filter in the Name field. The name must contain 1 to 128 Unicode characters.
- In the Conditions section, specify the conditions that must be met by the filtered events:
- The Add condition button is used to add filtering conditions. You can select two values (two operands, left and right) and assign the operation you want to perform with the selected values. The result of the operation is either True or False.
- In the operator drop-down list, select the function to be performed by the filter.
In this drop-down list, you can select the do not match case check box if the operator should ignore the case of values. This check box is ignored if the InSubnet, InActiveList, InCategory, and InActiveDirectoryGroup operators are selected. This check box is cleared by default.
- In the Left operand and Right operand drop-down lists, select where the data to be filtered will come from. As a result of the selection, Advanced settings will appear. Use them to determine the exact value that will be passed to the filter. For example, when choosing active list you will need to specify the name of the active list, the entry key, and the entry key field.
- You can use the If drop-down list to choose whether you need to create a negative filter condition.
Conditions can be deleted using the
button. - In the operator drop-down list, select the function to be performed by the filter.
- The Add group button is used to add groups of conditions. Operator AND can be switched between AND, OR, and NOT values.
A condition group can be deleted using the
button. - By clicking Add filter, you can add existing filters selected in the Select filter drop-down list to the conditions. You can click to navigate to a nested filter.
A nested filter can be deleted using the
button.
- The Add condition button is used to add filtering conditions. You can select two values (two operands, left and right) and assign the operation you want to perform with the selected values. The result of the operation is either True or False.
The filter has been added.
Proceed to the next step of the Installation Wizard.
Page topStep 5. Event aggregation
This is an optional step of the Installation Wizard. The Event aggregation tab of the Installation Wizard allows you to select or create aggregation rules whose settings specify the conditions for aggregating events of the same type. You can add multiple aggregation rules to the collector.
To add an existing aggregation rule to a set of collector resources,
click Add aggregation rule and select Aggregation rule in the drop-down list.
To add a new aggregation rule to a set of collector resources:
- Click the Add aggregation rule button and select Create new from the Aggregation rule drop-down menu.
- Enter the name of the newly created aggregation rule in the Name field. The name must contain 1 to 128 Unicode characters.
- In the Threshold field, specify how many events must be accumulated before the aggregation rule triggers and the events are aggregated. The default value is
100. - In the Triggered rule lifetime field, specify how long (in seconds) the collector must accumulate events to be aggregated. When this time expires, the aggregation rule is triggered and a new aggregation event is created. The default value is
60. - In the Identical fields section, use the Add field button to select the fields that will be used to identify the same types of events. You can select the following service fields: SourceAssetID, DestinationAssetID, DeviceAssetID, SourceAccountID, DestinationAccountID. Asset IDs are added after event normalization, which means you can use them to aggregate events. The rest of the service fields are not used in aggregation. Selected events can be deleted using the buttons with a cross icon.
- In the Unique fields section, you can click Add field to select the fields that will disqualify events from aggregation even if the events contain fields listed in the Identical fields section. Selected events can be deleted using the buttons with a cross icon.
- In the Sum fields section, you can use the Add field button to select the fields whose values will be summed during the aggregation process. Selected events can be deleted using the buttons with a cross icon.
- In the Filter section, you can specify the conditions to define events that will be processed by this resource. You can select an existing filter from the drop-down list or create a new filter.
Creating a filter in resources
To create a filter:
- In the Filter drop-down list, select Create new.
- If you want to keep the filter as a separate resource, select the Save filter check box. In this case, you will be able to use the created filter in various services. This check box is cleared by default.
- If you selected the Save filter check box, enter a name for the created filter resource in the Name field. Maximum length of the name: 128 Unicode characters.
- Under Conditions, specify the conditions that the events must meet:
- Click the Add condition button.
- In the Left operand and Right operand drop-down lists, specify the search parameters. Depending on the data source selected in the Right operand field, fields of additional parameters for identifying the value to be passed to the filter may be displayed. For example, when you select active list, you must specify the name of the active list, the entry key, and the entry key field.
- In the operator drop-down list, select an operator.
- If you want the operator to be case-insensitive, select the do not match case check box. The selection of this check box does not apply to the InSubnet, InActiveList, InCategory or InActiveDirectoryGroup operators. This check box is cleared by default.
- If you want to add a negative condition, select If not from the If drop-down list.
You can add multiple conditions or a group of conditions.
- If you have added multiple conditions or groups of conditions, choose a selection condition (and, or, not) by clicking the AND button.
- If you want to add existing filters that are selected from the Select filter drop-down list, click the Add filter button. You can view the nested filter settings by clicking the button.
Aggregation rule added. You can delete it using the button.
Proceed to the next step of the Installation Wizard.
Page topStep 6. Event enrichment
This is an optional step of the Installation Wizard. On the Event enrichment tab of the Installation Wizard, you can specify which data from which sources should be added to events processed by the collector. Events can be enriched with data obtained using enrichment rules or LDAP.
Incoming events are first enriched with data from the sources that you select at this step of the wizard, and then the events are automatically enriched with asset information. For example, if you have dns enrichment configured, which leads to the IP address in the event being enriched with the corresponding DNS name of an asset, the event is enriched with this asset.
Rule-based enrichment
There can be more than one enrichment rule. You can add them by clicking the Add enrichment button and can remove them by clicking the button. You can use existing enrichment rules or create rules directly in the Installation Wizard.
To add an existing enrichment rule to a set of resources:
- Click Add enrichment.
This opens the enrichment rules settings block.
- In the Enrichment rule drop-down list, select the relevant resource.
The enrichment rule is added to the resource set for the collector.
To create a new enrichment rule in a set of resources:
- Click Add enrichment.
This opens the enrichment rules settings block.
- In the Enrichment rule drop-down list, select Create new.
- In the Source kind drop-down list, select the source of data for enrichment and define its corresponding settings:
- constant
- dictionary
- event
- template
- dns
- cybertrace
For systems with a high load on the collector or correlator, we recommend using the cybertrace-http enrichment type.
This type of enrichment is used to add information from CyberTrace data streams to event fields.
Available settings:
- URL (required)—in this field, you can specify the URL of a CyberTrace server to which you want to send requests. The default CyberTrace port is 9999.
- Number of connections—maximum number of connections to the CyberTrace server that can be simultaneously established by KUMA. By default, this value is equal to the number of vCPUs of the KUMA Core server.
- RPS—maximum number of requests sent to the server per second. The default value is
1,000. - Timeout—amount of time to wait for a response from the CyberTrace server, in seconds. The default value is
30. - Maximum number of events in the enrichment queue—maximum number of events stored in the enrichment queue for re-sending. The default value is 1,000,000,000.
- Mapping (required)—this settings block contains the mapping table for mapping KUMA event fields to CyberTrace indicator types. The KUMA field column shows the names of KUMA event fields, and the CyberTrace indicator column shows the types of CyberTrace indicators.
Available types of CyberTrace indicators:
- ip
- url
- hash
In the mapping table, you must provide at least one string. You can use the Add row button to add a string, and can use the
button to remove a string.
- cybertrace-http
- timezone
- geographic data
This type of enrichment is used to add IP address geographic data to event fields. Learn more about linking IP addresses to geographic data.
When this type is selected, under Mapping geographic data to event fields, you must specify from which event field the IP address will be read, select the required attributes of geographic data, and define the event fields in which geographic data will be written:
- In the Event field with IP address drop-down list, select the event field from which the IP address is read. Geographic data uploaded to KUMA is matched against this IP address.
You can use the Add event field with IP address button to specify multiple event fields with IP addresses that require geographic data enrichment. You can delete event fields added in this way by clicking the Delete event field with IP address button.
When the
SourceAddress,DestinationAddress, andDeviceAddressevent fields are selected, the Apply default mapping button becomes available. You can use this button to add preconfigured mapping pairs of geographic data attributes and event fields. - For each event field you need to read the IP address from, select the type of geographic data and the event field to which the geographic data should be written.
You can use the Add geodata attribute button to add field pairs for Geodata attribute – Event field to write to. You can also configure different types of geographic data for one IP address to be written to different event fields. To delete a field pair, click
 .
.- In the Geodata attribute field, select which geographic data corresponding to the read IP address should be written to the event. Available geographic data attributes: Country, Region, City, Longitude, Latitude.
- In the Event field to write to, select the event field which the selected geographic data attribute must be written to.
You can write identical geographic data attributes to different event fields. If you configure multiple geographic data attributes to be written to the same event field, the event will be enriched with the last mapping in the sequence.
- In the Event field with IP address drop-down list, select the event field from which the IP address is read. Geographic data uploaded to KUMA is matched against this IP address.
- Use the Debug toggle switch to indicate whether or not to enable logging of service operations. Logging is disabled by default.
- In the Filter section, you can specify conditions to identify events that will be processed by the enrichment rule resource. You can select an existing filter from the drop-down list or create a new filter.
Creating a filter in resources
To create a filter:
- In the Filter drop-down list, select Create new.
- If you want to keep the filter as a separate resource, select the Save filter check box. In this case, you will be able to use the created filter in various services. This check box is cleared by default.
- If you selected the Save filter check box, enter a name for the created filter resource in the Name field. Maximum length of the name: 128 Unicode characters.
- Under Conditions, specify the conditions that the events must meet:
- Click the Add condition button.
- In the Left operand and Right operand drop-down lists, specify the search parameters. Depending on the data source selected in the Right operand field, fields of additional parameters for identifying the value to be passed to the filter may be displayed. For example, when you select active list, you must specify the name of the active list, the entry key, and the entry key field.
- In the operator drop-down list, select an operator.
- If you want the operator to be case-insensitive, select the do not match case check box. The selection of this check box does not apply to the InSubnet, InActiveList, InCategory or InActiveDirectoryGroup operators. This check box is cleared by default.
- If you want to add a negative condition, select If not from the If drop-down list.
You can add multiple conditions or a group of conditions.
- If you have added multiple conditions or groups of conditions, choose a selection condition (and, or, not) by clicking the AND button.
- If you want to add existing filters that are selected from the Select filter drop-down list, click the Add filter button. You can view the nested filter settings by clicking the button.
The new enrichment rule was added to the resource set for the collector.
LDAP enrichment
To enable enrichment using LDAP:
- Click Add enrichment with LDAP data.
This opens the settings block for LDAP enrichment.
- Under LDAP accounts mapping, use the New domain button to specify the domain of the user accounts. You can specify multiple domains.
- In the LDAP mapping table, define the rules for mapping KUMA fields to LDAP attributes:
- In the KUMA field column, indicate the KUMA event field which data should be compared to LDAP attribute.
- In the LDAP attribute column, specify the attribute that must be compared with the KUMA event field. The drop-down list contains standard attributes and can be augmented with custom attributes.
- In the KUMA event field to write to column, specify in which field of the KUMA event the ID of the user account imported from LDAP should be placed if the mapping was successful.
You can use the Add row button to add a string to the table, and can use the
button to remove a string. You can use the Apply default mapping button to fill the mapping table with standard values.
Event enrichment rules for data received from LDAP were added to the group of resources for the collector.
If you add an enrichment to an existing collector using LDAP or change the enrichment settings, you must stop and restart the service.
Proceed to the next step of the Installation Wizard.
Page topStep 7. Routing
This is an optional step of the Installation Wizard. On the Routing tab of the Installation Wizard, you can select or create destinations with settings indicating the forwarding destination of events processed by the collector. Typically, events from the collector are routed to two points: to the correlator to analyze and search for threats; and to the storage, both for storage and so that processed events can be viewed later. If necessary, events can be sent elsewhere, for example, to the event router. In that case, select the 'internal' connector at the Transport step. There can be more than one destination point.
To add an existing destination to a collector resource set:
- In the Routing step of the installation wizard, click Add.
- This opens the Create destination window; in that window, select the type of destination you want to add.
- In the Destination drop-down list, select the necessary destination.
The window name changes to Edit destination, and it displays the settings of the selected resource. To open the settings of a destination for editing in a new browser tab, click
. - Click Save.
The selected destination is displayed on the Installation Wizard tab. A destination resource can be removed from the resource set by selecting it and clicking Delete in the opened window.
To add a new destination resource to a collector resource set:
- In the Routing step of the installation wizard, click Add.
- This opens the Create destination window; in that window, specify the following settings:
- On the Basic settings tab, in the Name field, enter a unique name for the destination. The name must contain 1 to 128 Unicode characters.
- You can use the State toggle switch to enable or disable the service as needed.
- In the Type drop-down list, select the type of the destination. The following values are available:
- On the Advanced settings tab, specify the values of parameters. The set of parameters that can be configured depends on the type of the destination selected on the Basic settings tab. For detailed information about parameters and their values, click the link for each type of destination in paragraph "c." of these instructions.
The created destination is displayed on the Installation Wizard tab. A destination resource can be removed from the resource set by selecting it and clicking Delete in the opened window.
Proceed to the next step of the Installation Wizard.
Page topStep 8. Setup validation
This is the required, final step of the Installation Wizard. At this step, KUMA creates a service resource set, and the Services are created automatically based on this set:
- The resource set for the collector is displayed under Resources → Collectors. It can be used to create new collector services. When this set of resources changes, all services that operate based on this set of resources will start using the new parameters after the services restart. To do so, you can use the Save and restart services and Save and update service configurations buttons.
A resource set can be modified, copied, moved from one folder to another, deleted, imported, and exported, like other resources.
- Services are displayed in Resources → Active services. The services created using the Installation Wizard perform functions inside the KUMA program. To communicate with external parts of the network infrastructure, you need to install similar external services on the servers and assets intended for them. For example, an external collector service should be installed on a server intended as an events recipient, external storage services should be installed on servers that have a deployed ClickHouse service, and external agent services should be installed on the Windows assets that must both receive and forward Windows events.
To finish the Installation Wizard:
- Click Create and save service.
The Setup validation tab of the Installation Wizard displays a table of services created based on the resource set selected in the Installation Wizard. The lower part of the window shows examples of commands that you must use to install external equivalents of these services on their intended servers and assets.
For example:
/opt/kaspersky/kuma/kuma collector --core https://kuma-example:<port used for communication with the KUMA Core> --id <service ID> --api.port <port used for communication with the service> --install
The "kuma" file can be found inside the installer in the /kuma-ansible-installer/roles/kuma/files/ directory.
The port for communication with the KUMA Core, the service ID, and the port for communication with the service are added to the command automatically. You should also ensure the network connectivity of the KUMA system and open the ports used by its components if necessary.
- Close the Wizard by clicking Save collector.
The collector service is created in KUMA. Now the service must be installed on the server intended for receiving events.
If a wmi, wec, or etw connector was selected for collectors, you must also install the automatically created KUMA agents.
Page topInstalling a collector in a KUMA network infrastructure
A collector consists of two parts: one part is created in the KUMA web interface, and the other part is installed on the network infrastructure server intended for receiving events. The second part of the collector is installed in the network infrastructure.
To install a collector:
- Log in to the server where you want to install the service.
- Execute the following command:
sudo /opt/kaspersky/kuma/kuma collector --core https://<FQDN of the KUMA Core server>:<port used by KUMA Core for internal communication (port 7210 is used by default)> --id <service ID copied from the KUMA web interface> --api.port <port used for communication with the installed component>Example:
sudo /opt/kaspersky/kuma/kuma collector --core https://test.kuma.com:7210 --id XXXX --api.port YYYYIf errors are detected as a result of the command execution, make sure that the settings are correct. For example, the availability of the required access level, network availability between the collector service and the Core, and the uniqueness of the selected API port. After fixing errors, continue installing the collector.
If no errors were found, and the collector status in the KUMA web interface is changed to green, stop the command execution and proceed to the next step.
The command can be copied at the last step of the installer wizard. The address and port of the KUMA Core server, the identifier of the collector to be installed, and the port that the collector uses for communication are automatically specified in the command.
When deploying several KUMA services on the same host, during the installation process you must specify unique ports for each component using the
--api.port <port>parameter. The following setting values are used by default:--api.port 7221.Before installation, ensure the network connectivity of KUMA components.
- Run the command again by adding the
--installkey:sudo /opt/kaspersky/kuma/kuma collector --core https://<FQDN of the KUMA Core server>:<port used by KUMA Core server for internal communication (port 7210 by default)> --id <service ID copied from the KUMA web interface> --api.port <port used for communication with the installed component> --installExample:
sudo /opt/kaspersky/kuma/kuma collector --core https://kuma.example.com:7210 --id XXXX --api.port YYYY --install - Add KUMA collector port to firewall exclusions.
For the program to run correctly, ensure that the KUMA components are able to interact with other components and programs over the network via the protocols and ports specified during the installation of the KUMA components.
The collector is installed. You can use it to receive data from an event source and forward it for processing.
Page topValidating collector installation
To verify that the collector is ready to receive events:
- In the KUMA web interface, open Resources → Active services.
- Make sure that the collector you installed has the green status.
If the status of the collector is not green, view the log of this service on the machine where it is installed, in the /opt/kaspersky/kuma/collector/<collector ID>/log/collector directory. Errors are logged regardless of whether debug mode is enabled or disabled.
If the collector is installed correctly and you are sure that data is coming from the event source, the table should display events when you search for events associated with the collector.
To check for normalization errors using the Events section of the KUMA web interface:
- Make sure that the Collector service is running.
- Make sure that the event source is providing events to the KUMA.
- Make sure that you selected Only errors in the Keep raw event drop-down list of the Normalizer resource in the Resources section of the KUMA web interface.
- In the Events section of KUMA, search for events with the following parameters:
ServiceID = <ID of the collector to be checked>Raw != ""
If any events are found with this search, it means that there are normalization errors and they should be investigated.
To check for normalization errors using the Grafana Dashboard:
- Make sure that the Collector service is running.
- Make sure that the event source is providing events to the KUMA.
- Open the Metrics section and follow the KUMA Collectors link.
- See if the Errors section of the Normalization widget displays any errors.
If there are any errors, it means that there are normalization errors and they should be investigated.
For collectors that use WEC, WMI, or ETW connectors as the transport, make sure that a unique port is used for connecting to the agent. This port is specified in the Transport section of Collector Installation Wizard.
Page topEnsuring uninterrupted collector operation
An uninterrupted event stream from the event source to KUMA is important for protecting the network infrastructure. Continuity can be ensured though automatic forwarding of the event stream to a larger number of collectors:
- On the KUMA side, two or more identical collectors must be installed.
- On the event source side, you must configure control of event streams between collectors using third-party server load management tools, such as rsyslog or nginx.
With this configuration of the collectors in place, no incoming events will be lost if the collector server is unavailable for any reason.
Please keep in mind that when the event stream switches between collectors, each collector will aggregate events separately.
If the KUMA collector fails to start, and its log includes the "panic: runtime error: slice bounds out of range [8:0]" error:
- Stop the collector.
sudo systemctl stop kuma-collector-<collector ID> - Delete the DNS enrichment cache files.
sudo rm -rf /opt/kaspersky/kuma/collector/<collector ID>/cache/enrichment/DNS-* - Delete the event cache files (disk buffer). Run the command only if you can afford to jettison the events in the disk buffers of the collector.
sudo rm -rf /opt/kaspersky/kuma/collector/<collector ID>/buffers/* - Start the collector service.
sudo systemctl start kuma-collector-<collector ID>
Event stream control using rsyslog
To enable rsyslog event stream control on the event source server:
- Create two or more identical collectors that you want to use to ensure uninterrupted reception of events.
- Install rsyslog on the event source server (refer to the rsyslog documentation).
- Add rules for forwarding the event stream between collectors to the configuration file /etc/rsyslog.conf:
*. * @@ <main collector server FQDN>: <port for incoming events>$ActionExecOnlyWhenPreviousIsSuspended on*. * @@ <backup collector server FQDN>: <port for incoming events>$ActionExecOnlyWhenPreviousIsSuspended off - Restart rsyslog by running the following command:
systemctl restart rsyslog.
Event stream control is now enabled on the event source server.
Page topEvent stream control using nginx
To control the event stream using nginx, you need to create and configure an nginx server to receive events from the event source and then forward these to collectors.
To enable nginx event stream control on the event source server:
- Create two or more identical collectors that you want to use to ensure uninterrupted reception of events.
- Install nginx on the server intended for event stream control.
- Installation command in Oracle Linux 8.6:
$sudo dnf install nginx - Installation command in Ubuntu 20.4:
$sudo apt-get install nginxWhen installing from sources, you must compile with the parameter
-with-streamoption:
$ sudo ./configure -with-stream -without-http_rewrite_module -without-http_gzip_module
- Installation command in Oracle Linux 8.6:
- On the nginx server, add the stream module to the nginx.conf configuration file that contains the rules for forwarding the stream of events between collectors.
With a large number of active services and users, you may need to increase the limit of open files in the nginx.conf settings. For example:
worker_rlimit_nofile 1000000;events {worker_connections 20000;}# worker_rlimit_nofile is the limit on the number of open files (RLIMIT_NOFILE) for workers. This is used to raise the limit without restarting the main process.# worker_connections is the maximum number of connections that a worker can open simultaneously. - Restart nginx by running the following command:
systemctl restart nginx - On the event source server, forward events to the nginx server.
Event stream control is now enabled on the event source server.
Nginx Plus may be required to fine-tune balancing, but certain balancing methods, such as Round Robin and Least Connections, are available in the base version of ngnix.
For more details on configuring nginx, please refer to the nginx documentation.
Page topPredefined collectors
The predefined collectors listed in the table below are included in the KUMA distribution kit.
Predefined collectors
Name |
Description |
|---|---|
[OOTB] CEF |
Collects CEF events received over the TCP protocol. |
[OOTB] KSC |
Collects events from Kaspersky Security Center over the Syslog TCP protocol. |
[OOTB] KSC SQL |
Collects events from Kaspersky Security Center using an MS SQL database query. |
[OOTB] Syslog |
Collects events via the Syslog protocol. |
[OOTB] Syslog-CEF |
Collects CEF events that arrive over the UDP protocol and have a Syslog header. |
Creating an agent
A KUMA agent consists of two parts: one part is created inside the KUMA web interface, and the second part is installed on a server or on an asset in the network infrastructure.
An agent is created in several steps:
- Creating a resource set for the agent in the KUMA web interface
- Creating an agent service in the KUMA web interface
- Installing the server portion of the agent to the asset that will send events
KUMA agents for Windows devices can be created as follows:
- Manually by creating a set of agent resources and creating an agent service in the KUMA web interface.
- Automatically when creating a collector of the wmi, wec, or etw transport type. Although the set of resources and service of these agents are created in the Collector Installation Wizard, they must still be installed to the asset that will be used to forward an event. In a manually created agent, a connector of the etw type can be used in only one connection. If you configure multiple connections in a manually created etw agent, the status of the etw agent status is green, but events are not transmitted and an error is logged in the etw agent log.
Multiple agents can be installed on a device; the version of all such agents must be the same.
If an older version of the agent is already installed on the device where you want to create an agent, you must first stop the installed agent (remove the agent from a Windows device or restart the agent service on a Linux device), and then you can proceed to create a new agent. However, if the version of the installed agents is the same as the version of the agent that you want to create, stopping the agents is not necessary.
When creating and running an agent whose version is 3.0.1 or later, you must accept the terms and conditions of the End User License Agreement.
Creating a set of resources for an agent
In the KUMA web interface, an agent service is created based on the resource set for an agent that unites connectors and destinations. The agent type is determined by the connector that is used in the agent. The only exception is for agents with a destination of the diode type. These agents are considered to be diode agents.
To create a resource set for an agent in the KUMA web interface:
- In the KUMA web interface, under Resources → Agents, click Add agent.
This opens the agent creation window. The left part of the window displays tabs with base settings of the agent and connections. The Base settings tab is active.
- On the Base settings tab:
- In the Agent name field, enter a unique name for the created service. The name must contain 1 to 128 Unicode characters.
- In the Tenant drop-down list, select the tenant that will own the storage.
- If you want to enable logging of service operations, enable the Debug toggle switch.
- If you want to view the names of services or addresses of hosts from which the event came, enable the Trace event route toggle switch.
The Trace event route toggle switch is available if at least one internal destination is specified in the connections. By default, the toggle switch is Disabled.
When using the tcp, udp, http, wec, wmi, or etw connector type at the normalization stage, IP addresses of the assets from which the events were received are written to the DeviceAddress event field if it is empty.
- You can optionally add up to 256 Unicode characters describing the service in the Description field.
- Go to the tab of an existing connection or create a connection by clicking the Add button in the lower part of the left pane, then go to the tab of the newly created connection to edit its settings.
By default, a connection named Config #1 is created for a new agent. The name of the connection follows the Config #<number> pattern.
You can create multiple connections for an agent. If necessary, you can manage connections:
- Rename connections
- Duplicate connections
- Delete connections
- If necessary, in the Name of connection field, rename the connection for your convenience when managing it, for example, to be able to figure out from which connection and from which agent events arrived. If you leave the field blank, a name is assigned following the Config #<number> pattern.
The name can contain from 1 to 128 characters. The name can contain only letters and numerals and cannot contain special characters. Leading and trailing spaces are removed. When pasting a name into the field from the clipboard, if the text contains a newline, paragraph, or indentation, these characters are replaced with a space. You can reuse a name for multiple connections within the same agent.
If you have enabled event route tracing, then when viewing event information, the Events section displays the name of the connection from which the event was received.
- In the Connector group of settings, add a connector:
- If you want to select an existing connector, select it from the drop-down list.
- If you want to create a new connector, select Create new in the drop-down list and specify the following settings:
- Specify the connector name in the Name field. The name must contain 1 to 128 Unicode characters.
- In the Type drop-down list, select the connector type and specify its settings on the Basic settings and Advanced settings tabs. The available settings depend on the selected type of connector:
When using the tcp or udp connector type at the normalization stage, IP addresses of the assets from which the events were received will be written in the DeviceAddress event field if it is empty.
The ability to edit previously created wec, wmi, or etw connections in agents, collectors, and connectors is limited. You can change the connection type from wec to wmi or etw and back, but you cannot change the wec, wmi, or etw connection to any other connection type. When editing other connection types, you cannot select the wec, wmi, or etw types. You can create connections without any restrictions on the types of connectors.
When adding an (existing or new) wmi, wec, or etw connector for an agent, the TLS mode and Compression settings are not displayed on the agent, but the values of these settings are stored in the agent's configuration. For a new connector, these settings are disabled by default.
If TLS mode is enabled for an existing connector that is selected in the list, you cannot download the agent configuration file. In this case, to download the configuration file, you must go to the connector resource that is being used on the agent and disable TLS mode.
The connector is added to the selected connection of the agent's resource set. The created connector is only available in this resource set and is not displayed in the web interface Resources → Connectors section.
- In the Destinations group of settings, add a destination.
- If you want to select an existing destination, select it from the drop-down list.
- If you want to create a new destination, select Create new in the drop-down list and specify the following settings:
- Specify the destination name in the Name field. The name must contain 1 to 128 Unicode characters.
- In the Type drop-down list, select the destination type and specify its settings on the Basic settings and Advanced settings tabs. The available settings depend on the selected type of destination:
- nats-jetstream—used for NATS communications.
- tcp—used for communications over TCP.
- http—used for HTTP communications.
- diode—used to transmit events using a data diode.
- kafka—used for Kafka communications.
- file—used for writing to a file.
- Enable or disable the State toggle switch to enable or disable the sending of events to the destination. This toggle switch is turned on by default.
The advanced settings for an agent destination (such as TLS mode and compression) must match the advanced destination settings for the collector that you want to link to the agent.
There can be more than one destination point. You can add them by clicking the Add destination button and can remove them by clicking the
button. - Repeat steps 3–5 for each agent connection that you want to create.
- Click Save.
The resource set for the agent is created and displayed under Resources → Agents. Now you can create an agent service in KUMA.
Page topManaging connections for an agent
You can manage the connections created for the agent by renaming, duplicating, or deleting them.
Renaming a connection
By default, the name of a new connection created in a resource set for an agent follows the Connection <number> pattern. For your convenience when managing connections, you can rename them, for example, to make it clear at a glance from which connection and from which agent an event was received.
To rename a connection:
- In the KUMA web interface, in the Resources → Agents section, create a new agent or click an existing agent in the table.
- If necessary, create a connection for the agent by clicking the Add button in the lower part of the left pane.
- Go to the tab of the connection that you want to rename.
- In the Connection name field, edit the name of the connection.
The name can contain from 1 to 128 characters. The name can contain only letters and numerals and cannot contain special characters. Leading and trailing spaces are removed. When pasting a name into the field from the clipboard, if the text contains a newline, paragraph, or indentation, these characters are replaced with a space. You can reuse a name for multiple connections within the same agent.
- Click Save.
The connection is renamed. If you have enabled event route tracing, then when viewing event information, the Events section displays the name of the connection from which the event was received.
Duplicating a connection
If you want to create a connection for an agent based on an existing connection, you can create a copy of the connection with identical settings.
To duplicate a connection:
- In the KUMA web interface, in the Resources → Agents section, create a new agent or click an existing agent in the table.
- If necessary, create a connection for the agent by clicking the Add button in the lower part of the left pane.
- Go to the tab of the connection that you want to duplicate and click the Duplicate button.
A connection is created for the agent with the same settings as the original connection. The new connection is created with one of the following names:
- If the original connection name followed the Connection <number> template, the duplicated connection name also follows this template. The connection is named "Connection <number+1>", where <number> is the number of the last created connection whose name followed the same template.
- If the original connection had been renamed, the new connection gets the same name. You can reuse a name for multiple connections within the same agent.
You can edit the name of the new connection in the Name of connection field on the tab of the connection.
Removing a connection
If the agent has more than one connection, you can delete a connection.
To delete a connection:
- In the KUMA web interface, in the Resources → Agents section, create a new agent or click an existing agent in the table.
- If necessary, create a connection for the agent by clicking the Add button in the lower part of the left pane.
- Go to the tab of the connection that you want to delete and click the Delete button.
You cannot restore a deleted connection, but you can recover the version of the agent in which this connection was previously saved through the change history.
Page topCreating an agent service in the KUMA web interface
When a resource set is created for an agent, you can proceed to create an agent service in KUMA.
To create an agent service in the KUMA web interface:
- In the KUMA web interface, under Resources → Active services, click Add service.
- In the opened Choose a service window, select the resource set that was just created for the agent and click Create service.
The agent service is created in the KUMA web interface and is displayed under Resources → Active services. Now agent services must be installed to each asset from which you want to forward data to the collector. A service ID is used during installation.
Page topInstalling an agent in a KUMA network infrastructure
When an agent service is created in KUMA, you can proceed to installation of the agent to the network infrastructure assets that will be used to forward data to a collector.
Multiple agents can be installed on a device; the version of all such agents must be the same.
Prior to installation, verify the network connectivity of the system and open the ports used by its components.
Installing a KUMA agent on Linux assets
KUMA agent installed on Linux devices stops when you close the terminal or restart the server. If you do not want to start KUMA agents manually, we recommend installing agents using an application that automatically starts applications whenever the server is restarted, for example, the Supervisor application. If you want to start KUMA agents automatically, specify the automatic start and restart settings in the KUMA configuration file. For more information on configuring automatic starting and restarting, see the official documentation of applications for automatically starting applications.
Example configuration in Supervisor
To install a KUMA agent to a Linux asset:
- On the Linux device on which you want to install the KUMA agent, create directories for the KUMA configuration file and agents, for example:
- /opt/kaspersky/kuma
- /opt/kaspersky/agent
- Place the KUMA configuration file in the directory created for it. The KUMA configuration file can be found inside the installer in the /kuma-ansible-installer/roles/kuma/files directory.
Make sure the kuma file has sufficient rights to run.
- Create the KUMA user:
sudo useradd --system kuma && usermod -s /usr/bin/false kuma - Grant the KUMA user access to the directory with the KUMA configuration file and to all files within the directory:
sudo chown -R kuma:kuma <path to the directory with the KUMA configuration file> - Install the KUMA agent:
sudo /opt/kaspersky/kuma/kuma agent --core https://<KUMA Core server FQDN>:<port used by KUMA Core for internal communication (port 7210 by default)> --id <service ID copied from the KUMA web interface> --wd <path to the directory that will contain the files of the installed KUMA agent.If this option is not specified, the files will be stored in the directory where the KUMA file is located> [--accept-eula]You can install two KUMA agents on the same Linux device. In this case, KUMA agents will work in parallel. When installing the second KUMA agent, you need to specify a separate directory for it using the
--wdoption.To run the agent, you need to accept the End User License Agreement. You can add the
--accept-eulaoption to the command to automatically accept the End User License Agreement during KUMA agent installation. This lets you perform the installation non-interactively. If you do not specify this option, you will need to accept or reject the License Agreement manually during the installation of the KUMA agent.Examples of installing the KUMA agent:
- Installing the KUMA agent without automatically accepting the End User License Agreement:
sudo /opt/kaspersky/kuma/kuma agent --core https://kuma.example.com:7210 --id XXXX --wd /opt/kaspersky/kuma/agent/XXXX - Installing the KUMA agent with automatic acceptance of the End User License Agreement:
sudo /opt/kaspersky/kuma/kuma agent --core https://kuma.example.com:7210 --id XXXX --wd /opt/kaspersky/kuma/agent/XXXX --accept-eula
By using the
--accept-eulaoption during the installation of the KUMA agent, you confirm that you agree with and accept the terms and conditions of the End User License Agreement. - Installing the KUMA agent without automatically accepting the End User License Agreement:
- If you chose KUMA installation with the automatic acceptance of the End User License Agreement and want to read the text of the End User License Agreement, or if the text of the End User License Agreement was not automatically provided to you during the installation process, run the following command:
./kuma license --show
The KUMA agent is installed on the Linux device.
You can configure the collector to receive data that the KUMA agent sends to KUMA.
Page topInstalling a KUMA agent on Windows assets
Prior to installing a KUMA agent to a Windows asset, the server administrator must create a user account with the EventLogReaders and Log on as a service permissions on the Windows asset. This user account must be used to start the agent.
If you want to run the agent under a local account, you need administrator rights and Log on as a service. If you want to perform the collection remotely and only read logs under a domain account, EventLogReaders rights are sufficient.
To install a KUMA agent to a Windows asset:
- Copy the kuma.exe file to a folder on the Windows asset.
C:\Users\<User name>\Desktop\KUMAfolder is recommended for installation.The kuma.exe file is located inside the installer in the /kuma-ansible-installer/roles/kuma/files/ directory.
- Start the Command Prompt on the Windows asset with Administrator privileges and locate the folder containing the kuma.exe file.
- Execute the following command:
kuma agent --core https://<fully qualified domain name of the KUMA Core server>:<port used by the KUMA Core server for internal communications (port 7210 by default)> --id <ID of the agent service that was created in KUMA> --user <name of the user account used to run the agent, including the domain> --install [--accept-eula]To run the agent, you need to accept the End User License Agreement. You can add the
--accept-eulaoption to the command to automatically accept the End User License Agreement during agent installation. This lets you perform the installation non-interactively. If you do not specify this option, you will need to accept or reject the License Agreement manually during the installation of the KUMA agent.Examples:
- Installing the KUMA agent without automatically accepting the End User License Agreement:
kuma agent --core https://kuma.example.com:7210 --id XXXXX --user domain\username --install - Installing the KUMA agent with automatic acceptance of the End User License Agreement:
kuma agent --core https://kuma.example.com:7210 --id XXXXX --user domain\username --install --accept-eula
By using the
--accept-eulaoption during the installation of the KUMA agent, you confirm that you agree with and accept the terms and conditions of the End User License Agreement.You can get help information by executing the
kuma help agentcommand. - Installing the KUMA agent without automatically accepting the End User License Agreement:
- If you started the installation of the agent without automatically accepting the End User License Agreement, during the installation process, you will be prompted to read the text of the End User License Agreement and you will have the opportunity to accept or reject the agreement.
- If you chose installation with the automatic acceptance of the End User License Agreement and want to read the text of the End User License Agreement, or if the text of the End User License Agreement was not automatically provided to you during the installation process, run the following command:
kuma.exe license --showIf you want to accept the End User License Agreement, run the following command and press
y:kuma.exe license - Specify the password for the agent's user in one the following ways:
- Manually.
- From a file when installing the agent.
To avoid entering the password manually, you can add the password to a .TXT file and place the file in the same directory as the executable file of the agent.
In the command, specify the file containing the password as follows:
<name of the password file>.txt. For example,password.txt.kuma agent --core https://kuma.example.com:7210 --id XXXXX --user domain\username --install < password.txtAll data from the password.txt file is redirected to the command as the password, excluding end-of-line characters (\n\r, \n).
Path for storing the agent folder after installation: C:\ProgramData\Kaspersky Lab\KUMA\agent\${agent_id}.
If you did not accept the End User License Agreement (EULA) before installing the agent with the
< password.txtflag, an error message is displayed saying that the agreement was not accepted.You can accept the EULA in the following ways:
- In the password file, you can specify the EULA acceptance flag. To achieve this, the file with the password must contain two lines: the first line containing "y", which serves to assert EULA acceptance, and the second line containing the password. For example:
y<password>The agent installation command looks like this:
kuma agent --core https://kuma.example.com:7210 --id XXXXX --user domain\username --install < password.txtIn this case, you will not need to additionally accept the EULA when installing the agent.
If the EULA has been accepted before running the command with the password file, the first line in the file is interpreted as the password and the installation is aborted with an
Access deniederror. - You can accept the EULA and perform a silent installation at the same time by using the --accept-eula flag.
The agent installation command looks like this:
kuma agent --core https://kuma.example.com:7210 --id XXXXX --user domain\username --accept-eula --install < password.txtMake sure that only the password is specified in the file, on the first line, otherwise an error will occur.
The C:\ProgramData\Kaspersky Lab\KUMA\agent\<agent ID> folder is created and the KUMA agent service is installed in it. The agent forwards Windows events to KUMA, and you can set up a collector to receive them.
When the agent service is installed, it starts automatically. The service is also configured to restart in case of any failures. The agent can be restarted from the KUMA web interface, but only when the service is active. Otherwise, the service needs to be manually restarted on the Windows asset.
Removing a KUMA agent from Windows assets
When configuring services, you can check the configuration for errors before installation by running the agent with the following command:
kuma agent --core https://<fullly qualified domain name of the KUMA Core server>:<port used by the KUMA Core server for internal communications (port 7210 by default)> --id <ID of the agent service that was created in KUMA> --user <name of the user account used to run the agent, including the domain>
Automatically created agents
When creating a collector with wec, wmi, or etw connectors, agents are automatically created for receiving Windows events.
Automatically created agents have the following special conditions:
- Automatically created agents can have only one connection.
- Automatically created agents are displayed under Resources → Agents, and
auto createdis indicated at the end of their name. Agents can be reviewed or deleted. - The settings of automatically created agents are defined automatically based on the collector settings from the Connect event sources and Transport sections. You can change the settings only for a collector that has a created agent.
- The description of an automatically created agent is taken from the collector description in the Connect event sources section.
- Debugging of an automatically created agent is enabled and disabled in the Connect event sources section of the collector.
- When deleting a collector with an automatically created agent, you will be prompted to choose whether to delete the collector together with the agent or to just delete the collector. When deleting only the collector, the agent will become available for editing.
- When deleting automatically created agents, the type of collector changes to http, and the connection address is deleted from the URL field of the collector.
- If at least one Windows log name in wec or wmi connector is specified incorrectly, the agent will not receive events from any Windows log listed in the connector. At the same time the agent status will be green. Attempts to receive events will be repeated every 60 seconds, and error messages will be added to the service log.
- If in a connector of the etw type, the session name is specified incorrectly, the wrong provider is specified in the session, or an incorrect method is specified for sending events (to send events correctly, on the Windows Server side, you must specify "Real time" or "File and Real time" mode), events will not arrive from the agent, an error will be recorded in the agent log on Windows, and the status of the agent will be green. At the same time, no attempt will be made to get events every 60 seconds. If you modify session settings on the Windows side, you must restart the etw agent and/or the session for the changes to take effect.
In the KUMA interface, automatically created agents appear at the same time when the collector is created. However, they must still be installed on the asset that will be used to forward a message.
Page topUpdate agents
When updating KUMA versions, the WMI, WEC, and ETW agents installed on remote machines must also be updated.
To update the agent, use an administrator account and follow these steps:
- In the KUMA web interface, in the Resources → Active services - Agents section, select the agent that you want to update and copy its ID.
You need the ID to install the new agent with the same ID after removing the old agent.
- In Windows, in the Services section, open the agent and click Stop.
- On the command line, go to the folder where the agent is installed and run the command to remove the agent from the server.
kuma.exe agent --id <
ID of agent service that was created in KUMA> --uninstall - Place the new agent in the same folder.
- On the command line, go to the folder with the new agent and from that folder, run the installation command using the agent ID from step 1.
kuma agent --core https://<
fullly qualified domain name of the KUMA Core server>:<port used by the KUMA Core server for internal communications (port 7210 by default)> --id <ID of the agent service that was created in KUMA> --user <name of the user account used to run the agent, including the domain> --install - When when installing the updated agent on a device for the first time, you must confirm the license. During the installation process, you are prompted to read the text of the license and then accept or reject the agreement. If this did not happen automatically, you can use the following command to view the text of the license:
kuma.exe license --showIf you want to accept the license agreement, run the command and press
y:kuma.exe license
The agent is updated.
Page topTransferring events from isolated network segments to KUMA
Data transfer scenario
Data diodes can be used to transfer events from isolated network segments to KUMA. Data transfer is organized as follows:
- KUMA agent that is Installed on a standalone server, with a diode destination receives events and moves them to a directory from which the data diode will pick up the events.
The agent accumulates events in a buffer until it overflows or for a user-defined period after the last write to disk. The events are then written to a file in the temporary directory of the agent. The file is moved to the directory processed by the data diode; its name is a combination of the file contents hash (SHA-256) and the file creation time.
- The data diode moves files from the isolated server directory to the external server directory.
- A KUMA collector with a diode connector installed on an external server reads and processes events from the files of the directory where the data diode places files.
After all events are read from a file, it is automatically deleted. Before reading events, the contents of files are verified based on the hash in the file name. If the contents fail verification, the file is deleted.
In the described scenario, the KUMA components are responsible for moving events to a specific directory within the isolated segment and for receiving events from a specific directory in the external network segment. The data diode transfers files containing events from the directory of the isolated network segment to the directory of the external network segment.
For each data source within an isolated network segment, you must create its own KUMA collector and agent, and configure the data diode to work with separate directories.
Configuring KUMA components
Configuring KUMA components for transferring data from isolated network segments consists of the following steps:
- Creating a collector service in the external network segment.
At this step, you must create and install a collector to receive and process the files that the data diode will transfer from the isolated network segment. You can use the Collector Installation Wizard to create the collector and all the resources it requires.
At the Transport step, you must select or create a connector of the diode type. In the connector, you must specify the directory to which the data diode will move files from the isolated network segment.
The user "kuma" that runs the collector must have read/write/delete permissions in the directory to which the data diode moves data from the isolated network segment.
- Creating a resource set for a KUMA agent.
At this step, you must create a resource set for the KUMA agent that will receive events in an isolated network segment and prepare them for transferring to the data diode. The diode agent resource set has the following requirements:
- The destination in the agent must have the diode type. In this resource, you must specify the directory from which the data diode will move files to the external network segment.
- You cannot select connectors of the sql or netflow types for the diode agent.
- TLS mode must be disabled in the connector of the diode agent.
- Downloading the agent configuration file as JSON file.
- The set of agent resources from a diode-type destination must be downloaded as a JSON file.
- If secret resources were used in the agent resource set, you must manually add the secret data to the configuration file.
- Installing the KUMA agent service in the isolated network segment.
At this step, you must install the agent in an isolated network segment based on the agent configuration file that was created at the previous step. It can be installed to Linux and Windows devices.
Configuring a data diode
The data diode must be configured as follows:
- Data must be transferred atomically from the directory of the isolated server (where the KUMA agent places the data) to the directory of the external server (where the KUMA collector reads the data).
- The transferred files must be deleted from the isolated server.
For information on configuring the data diode, please refer to the documentation for the data diode used in your organization.
Special considerations
When working with isolated network segments, operations with SQL and NetFlow are not supported.
When using the scenario described above, the agent cannot be administered through the KUMA web interface because it resides in an isolated network segment. Such agents are not displayed in the list of active KUMA services.
Diode agent configuration file
A created set of agent resources with a diode-type destination can be downloaded as a configuration file. This file is used when installing the agent in an isolated network segment.
To download the configuration file:
In the KUMA web interface, under Resources → Agents, select the required set of agent resources with a diode destination and click Download config.
The agent settings configuration is downloaded as a JSON file based on the settings of your browser. Secrets used in the agent resource set are downloaded empty. Their IDs are specified in the file in the secrets section. To use a configuration file to install an agent in an isolated network segment, you must manually add secrets to the configuration file (for example, specify the URL and passwords used in the agent connector to receive events).
You must use an access control list (ACL) to configure permissions to access the file on the server where the agent will be installed. File read access must be available to the user account that will run the diode agent.
Below is an example of a diode agent configuration file with a kafka connector.
{ "config": { "id": "<ID of the set of agent resources>", "name": "<name of the set of agent resources>", "proxyConfigs": [ { "connector": { "id": "<ID of the connector. This example shows a kafka-type connector, but other types of connectors can also be used in a diode agent. If a connector is created directly in the set of agent resources, the ID is not defined.>", "name": "<name of the connector>", "kind": "kafka", "connections": [ { "kind": "kafka", "urls": [ "localhost:9093" ], "host": "", "port": "", "secretID": "<ID of the secret>", "clusterID": "", "tlsMode": "", "proxy": null, "rps": 0, "maxConns": 0, "urlPolicy": "", "version": "", "identityColumn": "", "identitySeed": "", "pollInterval": 0, "query": "", "stateID": "", "certificateSecretID": "", "authMode": "pfx", "secretTemplateKind": "", "certSecretTemplateKind": "" } ], "topic": "<kafka topic name>", "groupID": "<kafka group ID>", "delimiter": "", "bufferSize": 0, "characterEncoding": "", "query": "", "pollInterval": 0, "workers": 0, "compression": "", "debug": false, "logs": [], "defaultSecretID": "", "snmpParameters": [ { "name": "", "oid": "", "key": "" } ], "remoteLogs": null, "defaultSecretTemplateKind": "" }, "destinations": [ { "id": "<ID of the destination. If the destination is created directly in the set of agent resources, the ID is not defined.>", "name": "<destination name>", "kind": "diode", "connection": { "kind": "file", "urls": [ "<path to the directory where the destination should place events that the data diode will transmit from the isolated network segment>", "<path to the temporary directory in which events are placed to prepare for data transmission by the diode>" ], "host": "", "port": "", "secretID": "", "clusterID": "", "tlsMode": "", "proxy": null, "rps": 0, "maxConns": 0, "urlPolicy": "", "version": "", "identityColumn": "", "identitySeed": "", "pollInterval": 0, "query": "", "stateID": "", "certificateSecretID": "", "authMode": "", "secretTemplateKind": "", "certSecretTemplateKind": "" }, "topic": "", "bufferSize": 0, "flushInterval": 0, "diskBufferDisabled": false, "diskBufferSizeLimit": 0, "healthCheckPath": "", "healthCheckTimeout": 0, "healthCheckDisabled": false, "timeout": 0, "workers": 0, "delimiter": "", "debug": false, "disabled": false, "compression": "", "filter": null, "path": "" } ] } ], "workers": 0, "debug": false }, "secrets": { "<secret ID>": { "pfx": "<encrypted pfx key>", "pfxPassword": "<password to the encrypted pfx key. The changeit value is exported from KUMA instead of the actual password. In the configuration file, you must manually specify the contents of secrets>" } }, "tenantID": "<ID of the tenant>" } |
Description of secret fields
Secret fields
Field name |
Type |
Description |
|
string |
User name |
|
string |
Password |
|
string |
Token |
|
array of strings |
URL list |
|
string |
Public key (used in PKI) |
|
string |
Private key (used in PKI) |
|
string containing the base64-encoded pfx file |
Base64-encoded contents of the PFX file. In Linux, you can get the base64 encoding of a file by running the following command:
|
|
string |
Password of the PFX |
|
string |
Used in snmp3. Possible values: |
|
string |
Used in snmp1 |
|
string |
Used in snmp3. Possible values: |
|
string |
Used in snmp3. Possible values: |
|
string |
Used in snmp3 |
|
string containing the base64-encoded pem file |
Base64-encoded contents of the PEM file. In Linux, you can get the base64 encoding of a file by running the following command:
|
Installing Linux Agent in an isolated network segment
To install a KUMA agent to a Linux device in an isolated network segment:
- Place the following files on the Linux server in an isolated network segment that will be used by the agent to receive events and from which the data diode will move files to the external network segment:
- Agent configuration file.
You must use an access control list (ACL) to configure access permissions for the configuration file so that only the KUMA user will have file read access.
- Executive file /opt/kaspersky/kuma/kuma (the "kuma" file can located in the installer in the /kuma-ansible-installer/roles/kuma/files/ directory).
- Agent configuration file.
- Execute the following command:
sudo ./kuma agent --cfg <path to the agent configuration file> --wd <path to the directory where the files of the agent being installed will reside. If this flag is not specified, the files will be stored in the directory where the kuma file is located>
The agent service is installed and running on the server in an isolated network segment. It receives events and relays them to the data diode so that they can be sent to an external network segment.
Page topInstalling Windows Agent in an isolated network segment
Prior to installing a KUMA agent to a Windows asset, the server administrator must create a user account with the EventLogReaders and Log on as a service permissions on the Windows asset. This user account must be used to start the agent.
To install a KUMA agent to a Windows device in an isolated network segment:
- Place the following files on the Window server in an isolated network segment that will be used by the agent to receive events and from which the data diode will move files to the external network segment:
- Agent configuration file.
You must use an access control list (ACL) to configure access permissions for the configuration file so that the file can only be read by the user account that will run the agent.
- Kuma.exe executable file. This file can be found inside the installer in the /kuma-ansible-installer/roles/kuma/files/ directory.
We recommend using the
C:\Users\<user name>\Desktop\KUMAfolder. - Agent configuration file.
- Start the Command Prompt on the Windows asset with Administrator privileges and locate the folder containing the kuma.exe file.
- Execute the following command:
kuma.exe agent --cfg <path to the agent configuration file> --user <user name that will run the agent, including the domain> --installYou can get installer Help information by running the following command:
kuma.exe help agent - Enter the password of the user account used to run the agent.
The C:\Program Files\Kaspersky Lab\KUMA\agent\<Agent ID> folder is created in which the KUMA agent service is installed. The agent moves events to the folder so that they can be processed by the data diode.
When installing the agent, the agent configuration file is moved to the directory C:\Program Files\Kaspersky Lab\KUMA\agent\<agent ID specified in the configuration file>. The kuma.exe file is moved to the C:\Program Files\Kaspersky Lab\KUMA directory.
When installing an agent, its configuration file must not be located in the directory where the agent is installed.
When the agent service is installed, it starts automatically. The service is also configured to restart in case of any failures.
Removing a KUMA agent from Windows assets
When configuring services, you can check the configuration for errors before installation by running the agent with the following command:
kuma.exe agent --cfg <path to agent configuration file>
Transferring events from Windows machines to KUMA
To transfer events from Windows machines to KUMA, a combination of a KUMA agent and a KUMA collector is used. Data transfer is organized as follows:
- The KUMA agent installed on the machine receives Windows events:
- Using the WEC connector: the agent receives events arriving at the host under a subscription, as well as the server logs.
- Using the WMI connector: the agent connects to remote servers specified in the configuration and receives events.
- Using the ETW connector: the agent connect to the DNS server using the session name and provider specified in the connector settings, and receives events.
- The agent sends events (without preprocessing) to the KUMA collector specified in the destination.
You can configure the agent so that different logs are sent to different collectors.
- The collector receives events from the agent, performs a full event processing cycle, and sends the processed events to the destination.
Receiving events from the WEC agent is recommended when using centralized gathering of events from Windows hosts using Windows Event Forwarding (WEF). The agent must be installed on the server that collects events; it acts as the Windows Event Collector (WEC). We do not recommend installing KUMA agents on every endpoint host from which you want to receive events.
The process of configuring the receipt of events using the WEC Agent is described in detail in the appendix: Configuring receipt of events from Windows devices using KUMA Agent (WEC).
For details about the Windows Event Forwarding technology, please refer to the official Microsoft documentation.
We recommend receiving events using the WMI agent in the following cases:
- If it is not possible to use the WEF technology to implement centralized gathering of events, and at the same time, installation of third-party software (for example, the KUMA agent) on the event source server is prohibited.
- If you need to obtain events from a small number of hosts — no more than 500 hosts per one KUMA agent.
The ETW agent is used only to retrieve events from Windows logs of DNS servers.
For connecting Windows logs as an event source, we recommend using the Add event source wizard. When using a wizard to create a collector with WEC or WMI connectors, agents are automatically created for receiving Windows events. You can also manually create the resources necessary for collecting Windows events.
An agent and a collector for receiving Windows events are created and installed in several stages:
- Creating a resource set for an agent.
Agent connector:
When creating an agent, on the Connection tab, you must create or select a connector of the WEC, WMI, or ETW type.
If at least one Windows log name in a WEC or WMI connector is specified incorrectly, the agent will receive events from all Windows logs listed in the connector, except the problematic log. At the same time the agent status will be green. Attempts to receive events will be repeated every 60 seconds, and error messages will be added to the service log.
Agent destination:
The type of agent destination depends on the data transfer method you use: nats-jetstream, tcp, http, diode, kafka, file.
You must use the
\0value as the destination separator.The advanced settings for the agent destination (such as separator, compression and TLS mode) must match the advanced destination settings for the collector connector that you want to link to the agent.
- Create an agent service in the KUMA web interface.
- Installing the KUMA agent on the Windows machine from which you want to receive Windows events.
Before installation, make sure that the system components have access to the network and open the necessary network ports:
- Port 7210, TCP: from server with collectors to the Core.
- Port 7210, TCP: from agent server to the Core.
- The port configured in the URL field when the connector was created: from the agent server to the server with the collector.
- Creating and installing KUMA collector.
When creating a set of collectors, at the Transport step, you must create or select a connector that the collector will use to receive events from the agent. Connector type must match the type of the agent destination.
The advanced settings of the connector (such as delimiter, compression, and TLS mode) must match the advanced settings of the agent destination that you want to link to the agent.
AI score and asset status
The AI score and asset status service can be installed if your license covers the AI module.
The AI service helps with precisely assessing the severity of correlation events generated by triggered correlation rules.
The AI service gets correlation events with a non-empty Affected assets field from the available storage clusters, constructs the expected sequence of events, and trains the AI model. Based on the chain of triggered correlation rules, the AI service calculates whether such a sequence of events is typical for this infrastructure. Non-typical patterns increase the score of the asset.
The AI service calculates the AI score and the Status, which are displayed in the asset card. If you remove the license, the AI score and Status fields are hidden from the asset card. If you add the license again, the values of the AI score and Status fields are shown again.
The score is a number that quantifies how non-typical the activity on the asset is, and whether it is worth paying attention to. Possible values of the Status field: Low, Medium, High, Critical. The score is a number in the range from 0 to 1.
There are four ranges that correspond to statuses:
Low: 0 ≤ score < 0.25
Medium: 0.25 ≤ score < 0.5
High: 0.5 ≤ score < 0.75
Critical: 0.75 ≤ score ≤ 1
You can apply a filter by the Score AI and Status fields when searching for assets. You can also set up proactive categorization of assets by the AI score and Status fields, which moves the asset to the category corresponding to the risk level as soon as the AI service assigns a score to the asset.
You can create a structure of multiple categories and automatically populate these with assets in accordance with the calculated risk values.
In the Settings → Asset audit section, you can configure audit events to be generated when an asset is added to a category. Audit events can be taken into account in correlation rules, and you can monitor them on the dashboard and in reports.
To monitor asset category changes on the dashboard, create an Events widget with a query similar to the following:
SELECT count(ID) AS `metric`, formatDateTime(toTimeZone(fromUnixTimestamp64Milli(Timestamp), 'Europe/Moscow'), '%d.%m.%Y %H:%m:%S') AS `value` FROM `events`
where DeviceVendor = 'Kaspersky' and DeviceProduct = 'KUMA' and
DeviceEventCategory = 'Audit assets' and DeviceAction= 'asset added to category'
and DeviceCustomString1 = 'Main/Categorized assets/ML/score>0.5'
GROUP BY Timestamp ORDER BY value LIMIT 250
To monitor the distribution of assets by status on the dashboard, create an Assets by severity widget. The Assets by severity widget is available if the license includes the AI module. The pie chart indicates the numbers of assets grouped by status.
Every time the AI service is restarted, the AI service trains the model from scratch and reassesses the score of the assets mentioned in events of the current day.
The directory specified in the configuration file stores events that the AI service got from KUMA storage clusters for the specified number of days. For example, if the configuration file specifies 12 days, the AI service gets events for the past 12 days. The oldest events are deleted from the directory. The trained model is stored in the same directory.
The model is retrained at midnight UTC. The asset score is reassessed once an hour for all assets that were mentioned in events of the current day (UTC).
Service logs are stored in /var/log/syslog.
Installing and removing the AI score and asset status service
Installing the AI score and asset status service
To install the service:
- Extract the mlservice-installer-0.1.54.XX.tgz archive that is included in the distribution kit.
The mlservice-installer-0.1.54.XX.tgz archive contains scripts for installing and removing the service, as well as the config.yaml configuration file.
- In the config.yaml configuration file, in the
kuma_addresssetting, specify the FQDN of the host on which KUMA Core is installed and the port on which the KUMA Core is to listen for AI service connections.In a high availability configuration, you must specify port 7226. You can keep default values for the rest of the settings. After installation, the service starts with the settings specified in the config.yaml file.
- If you want to install the service on a remote host, specify the address of the remote host in the inventory.yaml file and make sure you have network access. By default, the service is installed on the local host as specified in inventory.yaml.
- Get the Core certificate in the KUMA web interface: in the Administrator menu, click REST API CA certificate. The certificate is downloaded to your default download directory.
- Save the KUMA Core certificate file in the roles/mlservice/files directory under the installer directory.
- Change to the directory with the service files and from that directory, run the following command:
./install <path to inventory.yaml> - If you accept the terms and conditions of the EULA, press
Y. If you do not accept the terms and conditions of the EULA, you cannot proceed with the installation of the service. You can find the file with the text of the EULA in the mlservice-installer/eula directory. - The installer generates a certificate and a key during the installation process and places these in the directories specified in the config.yaml configuration file. You must upload the certificate to KUMA.
In the KUMA web interface, in the Settings → AI service section, in the AI score and asset status window, fill in the following fields:
- In the URL field, specify the FQDN of the host on which the KUMA Core is installed and port on which the KUMA Core is to listen for the AI service. For example, <FQDN of the host on which KUMA Core is installed>:7226 The port number must match the port number specified in the configuration file. Make sure the port is not being used by other applications.
For a KUMA installation in high availability configuration, the URL field is not displayed in the interface, the port value is taken from the KUMA_APPRAISER_AI_API_PORT environment variable and the port is opened for all IP addresses of the KUMA Core host.
- In the Certificate drop-down list, select Create new to open the Create secret window; in that window, specify Certificate as the secret type and upload the certificate from the directory specified in the config.yaml configuration file.
- Move the Disabled toggle switch to the inactive position. By default, the toggle switch is on.
- Click Save.
Immediately after installation, the service will make attempts to connect to KUMA for 15 minutes with 1-minute intervals. If no certificate is added in the KUMA web interface, the connection will fail and the service will stop. In this case, you can add a certificate and restart the AI service; the service will make new attempts to connect.
After saving the settings, get the log of the Core server and make sure it does not contain the "<port number>: bind: address already in use" error
- In the URL field, specify the FQDN of the host on which the KUMA Core is installed and port on which the KUMA Core is to listen for the AI service. For example, <FQDN of the host on which KUMA Core is installed>:7226 The port number must match the port number specified in the configuration file. Make sure the port is not being used by other applications.
The AI service is installed.
Removing the AI score and asset status service
To remove the AI service, change to the directory with the AI service files, and from that directory, run the following:
./uninstall <path to inventory.yaml>
Settings of the AI score and asset status service
Available AI service settings
Setting |
Description |
|---|---|
|
Path to the directory that contains the certificate generated by the installer. Default path: /opt/kaspersky/mlservice/service.crt You can specify a different path. In this case, make sure that the user that starts the service has access to the specified directory. |
|
Path to the directory that contains the key generated by the installer. Default path: /opt/kaspersky/mlservice/service.key You can specify a different path. In this case, make sure that the user that starts the service has access to the specified directory. |
|
FQDN of the host on which the KUMA Core is installed and port on which the KUMA Core is to listen for the AI service. To install in a high availability configuration, you must specify port 7226. Example: <FQDN of the host on which KUMA Core is installed>:7226
|
|
Path to the directory where the KUMA Core certificate is located. Default path: /opt/kaspersky/mlservice/core-external-ca.cert |
|
Path to the directory where the service is to place received correlation events. Default path: /var/mlservice/events |
|
Path to the directory where the service is to place the trained model. Default path: /var/mlservice/models |
|
The number of days for which you want to get correlation events that involve your assets from the available storage clusters in order to train the model. The default setting is 12 days. This means that the directory will contain events for the past <N> days. The oldest events are deleted. |
|
Overlap time. When events for assessing the scores of assets are downloaded on a schedule, they are retrieved from the time of the last downloaded event for the current day minus the value of the events_overlap_in_seconds setting. The default value is 60 seconds. Example: the time when the last event was received is 8:58. The starting time for the next batch of events to be downloaded is 8:57. |
Analyze using KIRA
In KUMA, you can use Kaspersky Investigation & Response Assistant (KIRA) to analyze the command that triggered the correlation rule. The command is written to the event field if normalization is configured to write the command to the event field. You can view the command in the event card or the correlation event card and click Analyze with KIRA in the upper part of the event card to send a query to KIRA. KIRA performs deobfuscation and displays the cached result of the previous request for the command if such a request was performed earlier. This helps investigate alerts and incidents. The analysis results are kept in cache for 14 days and are available for review. Each time a request is sent, an audit event is generated.
This functionality is available in the RU region if the following conditions are satisfied:
- An active license covering the AI module is available.
If the license has expired, the analysis results remain available through tasks during the lifetime of the cache, that is, for 14 days from the moment the result is cached.
- A certificate was uploaded when configuring the KIRA integration. You can get the certificate file in PFX format, packed in the <customer name>.ZIP archive, and the password for the certificate from Technical Support.
- The user has one of the following roles with corresponding access rights: General administrator, Administrator, Tier 2 analyst, Tier 1 analyst, and Junior analyst. Only a user with the General administrator role can configure the integration.
Configuring integration with KIRA
To configure integration with KIRA:
- Get a license with the AI module and activate in KUMA.
- In the KUMA web console, go to the Settings → AI services section and in the AI services window, go to the KIRA tab.
- On the KIRA tab, in the Certificate drop-down list, click Select file and upload the certificate file in PFX format, packed into the <customer name>.ZIP archive.
- In the Certificate password, enter the password.
- If necessary, in the Proxy server drop-down list, select a previously created resource or create a new resource.
- Click Save.
After clicking Save, you are prompted to accept the terms of use of the service. If you do not accept the terms of use, you cannot proceed to save settings and use the functionality.
After saving the settings, the available number of tokens is displayed. The allowance is reset every day.
If you want to disable this functionality, turn on the Disable toggle switch.
Integration is configured, you can proceed to the analysis. Analysis is available for all events: new and previously received.
Page topAnalyzing using KIRA
After configuring the integration, you can analyze commands using KIRA.
To perform an analysis:
- Go to the card of the event or correlation event and on the toolbar in the event card, in the Analyze with KIRA drop-down list, select the field whose value you want to analyze.
This opens the Analyze with KIRA window.
- This opens the Analyze with KIRA window, displaying the command to be analysed. You can do the following:
- If the command is obfuscated, it is de-obfuscated automatically without spending tokens. If you want to analyze the command in obfuscated form, in the Actions drop-down list, select Revert to original string. If necessary, you can de-obfuscate the string again.
- If you want to know in advance how many tokens will be spent on analysis, in the Actions drop-down list, select Calculate size in tokens. Number of tokens for analysis = number of tokens to send a request + number of tokens to produce a response.
- To analyze the command, click the Analyze button.
If you have enough tokens, the analysis and the Query in KIRA task are started.
Processing the request may take 30 seconds or longer.
Tokens are expended even if the request returns an error saying that the requested topic is in the deny list; the information about remaining tokens is also updated.
The command is analyzed.
The result of the analysis is available in the same Analyze with KIRA window: the output, a brief summary, and a detailed analysis. You can also view the result in a separate window by clicking View result in the pop-up notification. This opens a separate KIRA result window, from which you can also click the link to Go to event. After the analysis is completed, the Result is displayed on the KIRA analysis tab in the event card and is available for viewing by all users with access to the Analyze with KIRA functionality.
You can also view the result of the analysis in the Task manager section in the properties of the Query in KIRA task. You can click the name of the task to select one of the following commands in the context menu:
- View result shows the results of the task from the cache to any user with access to KIRA tasks; no tokens are expended.
- Restart performs the analysis disregarding the data of the previous analysis stored in the cache; the analysis expends tokens.
Possible errors of the Analyze using KIRA task
Possible errors
HTTP code |
Description |
400 |
Invalid client certificate. |
404 |
Error in request. |
401 |
Missing certificate information. Please contact Technical Support. |
403 |
Daily limit of tokens exhausted. |
413 |
Maximum number of tokens for request reached. Make the request smaller. |
500 |
Unknown error of the service. |
502 |
KIRA service unavailable. |
503 |
Error getting access token in service. |
Other |
Unknown error. |
No code |
Error while processing the request. |