Contents
- Analytics
- Working with events
- Filtering and searching events
- Selecting Storage
- Generating an SQL query using a builder
- Manually creating an SQL query
- Saving query history
- Managing saved search queries
- Filtering events by period
- Grouping events
- Displaying names instead of IDs
- Presets
- Limiting the complexity of queries in alert investigation mode
- Saving and selecting events filter configuration
- Deleting event filter configurations
- Supported ClickHouse functions
- Viewing event detail areas
- Exporting events
- Configuring the table of events
- Refreshing events table
- Getting events table statistics
- Viewing correlation event details
- Generating an SQL query using KUMA SQL functions
- Event route tracing
- Categorization of events
- Granular access to events
- Filtering and searching events
- Dashboard
- Reports
- Widgets
- Working with alerts
- Working with incidents
- About the incidents table
- Saving and selecting incident filter configuration
- Deleting incident filter configurations
- Viewing information about an incident
- Incident creation
- Incident processing
- Changing incidents
- Automatic linking of alerts to incidents
- Categories and types of incidents
- Interaction with NCIRCC
- Retroscan
- Working with events
Analytics
KUMA provides extensive analytics on the data available to the application from the following sources:
- Events in storage
- Alerts
- Assets
- Accounts imported from Active Directory
- Data from collectors on the number of processed events
- Metrics
You can configure and receive analytics in the Dashboard, Reports, and Source status sections of the KUMA web interface. Analytics are built by using only the data from tenants that the user can access.
The date format depends on the localization language selected in the application settings. Possible date format options:
- English localization: YYYY-MM-DD.
- Russian localization: DD.MM.YYYY.
Working with events
In the Events section of the KUMA web interface, you can inspect events received by the application to investigate security threats or create correlation rules. The events table displays the data received after the SQL query is executed.
Events can be sent to the correlator for a retroscan.
The event date format depends on the localization language selected in the application settings. Possible date format options:
- English localization: YYYY-MM-DD.
- Russian localization: DD.MM.YYYY.
Filtering and searching events
The Events section of the KUMA web interface does not show any data by default. To view events, you need to define an SQL query in the search field and click the Run query button. The SQL query can be entered manually or it can be generated using a query builder.
Data aggregation and grouping is supported in SQL queries.
You can search for events across multiple storages. For example, you can find events to determine where a user account is being blocked or which IP addresses were used to log in to which URLs. Example query for finding a blocked user account:
SELECT * FROM `events` WHERE DestinationUserName = 'username' AND DeviceEventClassID = '4625' LIMIT 250
To search for events in multiple storages, in the drop-down list in the upper-right part of the Events section, select check boxes next to the storages you want to search.
The list displays the following storages:
- Storages of the Main tenant.
- Available storages of tenants that satisfy one of the following conditions:
- The tenant that owns the storage is enabled in the tenant filter and the user has permissions to read events in this tenant.
- The user has access to the tenant of one of the partitions of the storage and has permissions to read events in this tenant.
For example, if you have access to the collector tenant, but do not have access to the storage tenant, by default, the inaccessible tenant's storage is not displayed in the list of available storages. If a destination in the storage of a tenant that is not available to you is added to the collector of an available tenant, after an event arrives in the partition of the tenant of the collector, the storage of the unavailable tenant appears in the list of storages in the Events section.
The drop-down list of storages in the upper-right part of the Events section displays the name of the first of the selected storages and the number of selected storages, if there are several. You can hover over the drop-down list to display all of the selected storages. If a space in a storage is deleted, the storage drop-down list shows "deleted<ID of deleted space>", and the events remain searchable for the duration of the TTL.
The tenants selected in the tenant filter affect which storages are displayed in the drop-down list of storages. If you disable tenants whose storages are available to you in the tenant filter, these storages are no longer displayed in the drop-down list of storages. If these storages had been selected in the drop-down list of storages, their check boxes are cleared and events from these storages are not displayed. If only one storage is selected in the drop-down list of storages that is not from the Main tenant, and if in tenant selection you disabled the tenant that owns the selected storage, this storage is not displayed in the list of storages and KUMA automatically changes the selection to one of the storages of the Main tenant.
A simple query to all selected storages is allowed, as in the example above. If at least one of the selected storages is not available for the query, KUMA returns an error.
Limitations for searching events across multiple storages:
- When querying multiple storages, export to TSV, retroscan, or REST API requests are not available.
- A SELECT can contain only * and/or names of event fields. Aliases, functions, expressions are not allowed.
- An ORDER BY clause must also contain only event fields (no functions, constants, expressions, and so on). If a field is not present in the list of fields for the SELECT, such a field is automatically added when sending to a specific cluster. You cannot set an ORDER BY ClusterID.
- GROUP BY is not available.
Complex queries with grouping and aggregation are allowed for a single selected storage.
You can add filter conditions to an already generated SQL query in the window for viewing statistics, the events table, and the event details area:
- Changing a query from the Statistics window
To change the filtering settings in the Statistics window:
- Open Statistics details area by using one of the following methods:
- In the
 drop-down list in the top right corner of the events table select Statistics.
 - In the events table click any value and in the opened context menu select Statistics.
The Statistics details area appears in the right part of the web interface window.
- In the
- Open the drop-down list of the relevant parameter and hover your mouse cursor over the necessary value.
- Use the plus and minus signs to change the filter settings by doing one of the following:
- If you want the events selection to include only events with the selected value, click the
 icon.
icon. - If you want the events selection to exclude all events with the selected value, click the
 icon.
icon.
- If you want the events selection to include only events with the selected value, click the
As a result, the filter settings and the events table will be updated, and the new search query will be displayed in the upper part of the screen.
- Open Statistics details area by using one of the following methods:
- Changing a query from the events table
- Changing a query from the Event details area
To change the filter settings in the event details area:
- In the Events section of the KUMA web interface, click the relevant event.
The Event details area appears in the right part of the window.
- Change the filter settings by using the plus or minus icons next to the relevant settings:
- If you want the events selection to include only events with the selected value, click the icon.
- If you want the events selection to exclude all events with the selected value, click the icon.
- If you want the events selection to include only events with the selected value, click the
As a result, the filter settings and the events table will be updated, and the new search query will be displayed in the upper part of the screen.
- In the Events section of the KUMA web interface, click the relevant event.
After modifying a query, all query parameters, including the added filter conditions, are transferred to the query builder and the search field.
When you switch to the query builder, the parameters of a query entered manually in the search field are not transferred to the builder, so you will need to create your query again. Also, the query created in the builder does not overwrite the query that was entered into the search string until you click the Apply query button in the builder window.
In the SQL query input field, you can enable the display of control characters.
You can also filter events by time period. Search results can be automatically updated.
The filter configuration can be saved. Existing filter configurations can be deleted.
Filter functions are available for users regardless of their roles.
When accessing certain event fields with IDs, KUMA returns the corresponding names.
For more details on SQL, refer to the ClickHouse documentation. For SQL operators and functions supported in KUMA, see also the KUMA operator usage and supported functions.
Selecting Storage
Events that are displayed in the Events section of the KUMA web interface are retrieved from storage (from the ClickHouse cluster). Depending on the demands of your company, you may have more than one Storage. However, you can only receive events from one Storage at a time, so you must specify which one you want to use.
To select the Storage you want to receive events from,
In the Events section of the KUMA web interface, open the drop-down list of storages in the upper-right part of the section and select one or more spaces of one or more storages. You can select all available storage spaces by selecting the check box next to the storage name.
Now events from the selected storage are displayed in the events table. The name of the selected storage is displayed in the drop-down list of storages.
The drop-down list of storages displays only the clusters of tenants available to the user, and the cluster of the main tenant.
Generating an SQL query using a builder
In KUMA, you can use a query builder to generate an SQL query for filtering events.
To generate an SQL query using a builder:
- In the Events section of the KUMA web interface, click the
 button.
The filter constructor window opens.
- Generate a search query by providing data in the following parameter blocks:
SELECT—event fields that should be returned. The * value is selected by default, which means that all available event fields must be returned. To make viewing the search results easier, select the necessary fields in the drop-down list. In this case, the data only for the selected fields is displayed in the table. Note that Select * increases the duration of the request execution, but eliminates the need to manually indicate the fields in the request.
When selecting an event field, you can use the field on the right of the drop-down list to specify an alias for the column of displayed data, and you can use the right-most drop-down list to select the operation to perform on the data: count, max, min, avg, sum.
If you use aggregation functions in an SQL query, you can customize the display of columns in the event table. After executing the query without *, the columns will match the query. Sorting of events in ascending and descending order, getting statistics is also not possible.
If the query uses grouping or aggregation functions, instead of one number that was received as a response to the
SELECT max(BytesOut) FROM `events` LIMIT 250query, the radar shows a distribution of events from which this number is obtained.When filtering by alert-related events in alert investigation mode, you cannot perform operations on the data of event fields or assign names to the columns of displayed data.
- FROM—data source. Select the events value.
- WHERE—conditions for filtering events.
Conditions and groups of conditions can be added by using the Add condition and Add group buttons. The AND operator value is selected by default in the group of conditions, but you can change the operator by clicking it. Available values: AND, OR, NOT. The structure of conditions and condition groups can be changed by using the
 icon to drag and drop expressions.
Adding filter conditions:
- In the drop-down list on the left, select the event field that you want to use for filtering.
- Select the necessary operator from the middle drop-down list. The available operators depend on the type of value of the selected event field.
- Enter the value of the condition. Depending on the selected type of field, you may have to manually enter the value, select it from the drop-down list, or select it on the calendar.
You can delete filter conditions and filter condition groups by clicking
 .
. - GROUP BY—event fields or aliases to be used for grouping the returned data.
If you use data grouping in an SQL query, custom fields specified in the query are displayed in the list of events. Table columns in a group cannot be customized. In group events, you can customize the display of columns. Sorting of events in ascending and descending order, getting statistics is also not possible.
When filtering by alert-related events in alert investigation mode, you cannot group the returned data.
- ORDER BY—columns used as the basis for sorting the returned data. In the drop-down list on the right, you can select the necessary order: DESC—descending, ASC—ascending.
- LIMIT—number of strings displayed in the table.
The default value is 250.
If you are filtering events by user-defined period and the number of strings in the search results exceeds the defined value, you can click the Show next button to display additional strings in the table. This button is not displayed when filtering events by the standard period.
- Click Apply query.
The current SQL query will be overwritten. The generated SQL query is displayed in the search field.
If you want to reset the builder settings, click the Default query button.
If you want to close the builder without overwriting the existing query, click the
 button in the upper-right part of the query creation window.
 - Click the Run query button to display the data in the table.
The table will display the search results based on the generated SQL query.
When switching to another section of the web interface, the query generated in the builder is not preserved. If you return to the Events section from another section, the builder will display the default query.
For more details on SQL, refer to the ClickHouse documentation. See also KUMA operator usage and supported functions.
Manually creating an SQL query
You can use the search field manually to create SQL queries of any complexity to filter events.
To manually generate an SQL query:
- Go to the Events section of the KUMA web interface.
An input form opens.
- Enter your SQL query into the input field. You must use single quotes in your queries.
- Click Run query to run the query.
A table of events that satisfy the criteria of your query will be displayed. If necessary, you can filter events by period.
Supported functions and operators
Function |
Description |
|---|---|
|
Event fields that you want to be returned. The following functions and operators are supported:
You can combine functions and operators in an SQL query. If you use aggregation functions in an SQL query, you can customize the display of columns in the event table. After executing the query without *, the columns will match the query. Sorting of events in ascending and descending order, getting statistics is also not possible. If the query uses grouping or aggregation functions, instead of one number that was received as a response to the |
|
Data source. When creating an SQL query, you need to specify the events value as the data source. |
|
Conditions for filtering events:
|
|
Event fields or aliases to be used for grouping the returned data. If you use data grouping in an SQL query, custom fields specified in the query are displayed in the list of events. Table columns in a group cannot be customized. In group events, you can customize the display of columns. Sorting of events in ascending and descending order, getting statistics is also not possible. |
|
Columns by which you want to sort the returned data. Possible values:
|
|
The number of rows to skip before displaying the results of the SQL query. |
|
The number of rows that can be displayed in the table. The default value is If you are filtering events by user-defined period and the number of rows in the search results exceeds the defined value, you can click the Show next button to display additional rows in the table. This button is not displayed when filtering events by the standard period. |
Examples of SQL queries
|
If you want to use a special character in a query, you need to escape this character by placing a backslash (\) character in front of it.
Example:
In the events table, all events whose Message field contains text corresponding to the |
When creating a normalizer for events, you can choose whether to retain the field values of the raw event. The data is stored in the Extra event field. This field is searched for events by using the LIKE operator.
Example:
In the events table, all events for hosts with the IP address 00.00.00.000 where the example process is running are sorted by the Timestamp column in descending order. The number of strings that can be displayed in the table is 250. |
If you created an SQL query manually in the search field and then switched to the builder, the SQL query parameters are not transferred to the builder. In this case, you will need to re-create the SQL query in the builder. The SQL query created in the builder does not overwrite the SQL query that was entered into the search string until you click the Apply query button in the builder window. If you created an SQL query in the query builder and then switched to the search field, the query parameters are transferred automatically.
Aliases must not contain spaces.
For more details on SQL, refer to the ClickHouse documentation. See also the supported ClickHouse functions.
Saving query history
In the KUMA web interface, the Events section keeps a personal history of SQL search queries. You can refer to the history of queries and quickly find a query you have used in the past.
The queries are saved in the browser. Changing your browser resets the query history. The history stores the last 32 of your queries. Queries are displayed with formatting. The date and time when the query was executed is displayed.
Only queries with correct syntax are saved in the query history.
To find a search query in history:
- In the Events section, place the cursor in the query bar.
- Click the
 (SQL query history) button in the toolbar of the query window or press Ctrl+] or Ctrl+[.
This opens the query history window. The last query you ran is displayed at the top of the list of queries.
- Select a search query. To navigate the list of saved queries, press Ctrl+] or Ctrl+[.
The selected query is pasted to the search bar.
- If necessary, run the search query. To do so, press Ctrll+Enter.
When you run a query, the query history window is closed.
You can also close the query history window by pressing the Esc key; this moves the cursor to the query editing window.
You can copy the query to the clipboard by pressing Ctrl+C. This copies the part of the query that is highlighted with the mouse, or the entire query string, limited by the box, if there was no selection.
You can save the query by pressing Ctrl+S, or by clicking the ![]() button (Save query) in the row. This closes the history window and opens the sidebar for saving the query with populated fields.
button (Save query) in the row. This closes the history window and opens the sidebar for saving the query with populated fields.
You can insert a query into the query window without running it by clicking the ![]() (Insert query) button, or by pressing Enter.
(Insert query) button, or by pressing Enter.
Managing saved search queries
In KUMA, in the Events section, you can organize saved SQL queries in a tree of folders for structured storage and quick search of SQL queries. You can edit previously saved queries, rename them, arrange queries in groups (folders) of accessible tenants, and search for previously saved queries in the search bar.
Saved queries follow the tenant access model and are visible to all users that have access to the corresponding tenants.
Saved queries are placed in the Saved queries pane. You can open or close the Saved queries pane using the  (bookmark) button on the toolbar of the query window.
The Saved queries navigation pane on the left contains the following:
- The query search window where you can search by folder name and query name.
- Tree of folders and queries, the Favorites folder.
- The query filter that displays the queries you have created (on the My tab) and all queries (on the All tab)
Displaying a query in the query window
To display a query in the query window:
- In the Events section, click the (bookmark) button.
This opens the Saved queries navigation pane.
- In the tree of folders in the Saved queries pane, click to select the relevant query.
The text of the selected query is displayed in the query window.
Saving a query to a folder or a tenant
In the Events section, after entering a query in the query window and clicking the Save current query button (floppy disk icon), you can save the SQL query to one of the folders or tenants that you can select.
To save a query to a folder:
- In the New query window, in the Filter name field, enter a name for the filter.
Consider the following when naming the filter:
- The name can contain Unicode characters.
- The minimum length of a name is 1 character, and the maximum length is 128 characters.
- Names must be unique within a tenant.
- Tab characters, new line characters, and paragraph characters are replaced with space characters.
When saving the name:
- Leading and trailing spaces are removed.
- Multiple spaces between characters are replaced with a single space character.
- In the Query field, enter the text of the SQL query.
- Select a tenant, a folder from the list of folders created in the tenant that is available to you, or create a new folder by clicking the Add folder button.
You can also add a folder in the Saved queries window: click the
 button next to the tenant to open the New folder window and add the folder in that window.
 - Click the Save button.
The query is saved in the selected folder or tenant.
Viewing the text of a query
To view the text of a query:
- In the Events section, click the (bookmark) button.
This opens the Saved queries navigation pane.
- In the tree of folders in the Saved queries pane, click the
 button next to the relevant query.
This opens a window with the text of the query.
Setting the default query
You can set your default query that the Events section displays when opened.
To set the default query:
- In the Events section, click the (bookmark) button.
This opens the Saved queries navigation pane.
- In the tree of folders in the Saved queries pane, select the relevant query.
- Click the
 button and in the displayed menu, select Use by default.
The selected query becomes the default query.
Adding folders and queries to favorites
To add a folder or individual query to favorites:
- In the Events section, click the (bookmark) button.
This opens the Saved queries navigation pane.
- In the tree of folders in the Saved queries pane, select the relevant folder or query.
- Click the button and in the displayed menu, select Add to favorites.
The selected folder or resource is added to the Favorites folder.
Editing a query
To edit a query:
- In the Events section, click the (bookmark) button.
This opens the Saved queries navigation pane.
- In the tree of folders in the Saved queries pane, select the relevant query.
- Click the button and in the displayed menu, select Edit.
This opens the window for editing the saved query.
- In the window, edit the query name or text, or the folder in which you want to save the query.
- Click the Save button.
The query is updated and saved in the selected folder.
Deleting a query
To delete a query from a folder (if you have sufficient rights):
- In the Events section, click the bookmark () icon.
This opens the Saved queries navigation pane.
- In the tree of folders in the Saved queries pane, select the relevant query.
- Click the three-dot icon () and in the menu that appears, select Delete.
- Confirm deletion in the displayed window.
The query is deleted.
Page topFiltering events by period
In KUMA, you can specify the time period to display events from.
To filter events by period:
- In the Events section of the KUMA web interface in the upper part of the window, open the time period drop-down list in the top right part of the section.
- Select a period in one of the following ways:
- If you want to specify an exact date, in the calendar on the left, select the start and end date of the period and click Apply.
You can select a date up to and including the current date. The date and time format depends on your browser settings. If the Date from or Date to field has a value and you have not edited the time value manually, when you select a date in the calendar, the Date from field is automatically populated with 00:00:00.000, and the Date to field with 23:59:59.999. If you have manually deleted the value in the Date from or Date to field, when you select a date in the calendar, the field is automatically populated with the current time. After you select a value in one of the fields, the focus switches to the other field. If your Date to is earlier than your Date from, this earlier value is automatically inserted into the Date from field.
- If you want to specify a relative period, select one of the available periods in the Relative period list on the right.
The period is calculated relative to the current time.
- If you want to specify a custom period, edit the value of the Date from and Date to fields.
You can enter an exact date and time in the DD.MM.YYYY HH:mm:ss.SSS format for the Russian localization and YYYY-MM-DD HH:mm:ss.SSS for the English localization or a period relative to the current time as a formula. You can also combine these methods if necessary. If you do not specify milliseconds when entering the exact date, 000 is substituted automatically. If you have edited the time in the Date from or Date to fields, picking a date in the calendar does not change the time component.
In the relative period formulas, you can use the now parameter for the current date and time and the interval parameterization language: + (only in the Date to field), -, / (rounding to the nearest), as well as time units: y (year), M (month), w (week), d (day), h (hour), m (minute), s (second). For example, you can specify the period now-5d to get data for the last five days, or now/w to get data from the beginning of the first day of the current week (00:00:00:000 UTC) to the current time (now).
The Date from field is required, and its value cannot exceed the value of the Date from field, and also cannot be earlier than 1970-01-01 (if specifying an exact date or a relative period). The Date to cannot be earlier than the Date from. If you do not specify a value in the Date from field, now is specified automatically.
The default setting is 5 minutes (now-5m). The bounds of the period are inclusive: for example, for the Today time range, events are displayed from the beginning (00:00:00:000 UTC) of the current day to the current time (now) inclusive, and for the Yesterday period, events are displayed from the beginning (00:00:00:000 UTC) of the previous day to 00:00:00:000 UTC of the current day.
KUMA stores time values in UTC, but in the user interface time is converted to the time zone of your browser. This is relevant to the relative periods: Today, Yesterday, This week, and This month. For example, if the time zone in your browser is UTC+3, and you select the Today period, events are displayed for the period from 03:00:00.000 until now, not from 00:00:00.000 until now.
If, when selecting a relative period, such as Today, Yesterday, This week, or This month, you want to take your time zone into account when displaying events, you need to manually add a time offset in the Date from and Date to fields (if a value other than now is specified) by adding or subtracting the correct number of hours. For example, if your browser's time zone is UTC+3 and you want to display data for Yesterday, you need to change Date from to now-1d/d-3h and Date to to now/d-3h. If you want to display data for the Today period, you only need to change the value in the Date from field to now/d-3h.
If you need results up to 23:59:59:999 of yesterday, you can use an SQL query with a filter by Timestamp or specify an exact date and time.
- If you want to specify an exact date, in the calendar on the left, select the start and end date of the period and click Apply.
- If you want to capture the last relative period for which a query was executed as an exact date and time, click the
 button.
The relative period is then converted to an exact date and time. Hovering over this button displays the date and time that will be captured. Relative periods (Today, Yesterday, This week, This month) are converted to an exact UTC date and time, other periods are converted to a date and time that takes into account the time zone of the browser.
If you have executed an SQL query with event grouping, when switching between groups in the query results, the relative time range is automatically converted to an exact date and time.
- Click Run query to run the query.
Only events registered during the specified time period are displayed. The period will be displayed in the upper part of the window.
You can also configure the display of events by using the events histogram that is displayed when you click the  button in the upper part of the Events section. Events are displayed if you click the relevant data column or select the relevant time period and click the Show events button.
Grouping events
After getting a list of events, you often need to split the events into groups to localize an information security event. KUMA can group events in a list by one or more fields.
To group events, you no longer need to manually edit the text of the query; instead, you can click a column heading in the Events section and select Add GROUP BY to the query in the context menu. You can select a sequence of multiple fields to group by, and the fields will be automatically added to the query string. Having selected your fields, click Run query. As a result, events are grouped by the specified fields. Found groups are displayed in the Groups section. They can be displayed as a table and as cards. You can toggle between the display modes.
You can exclude a group from the query:
- In Cards mode, click the - button.
- In Tables mode, right-click the group and in the context menu, select Exclude group from filter.
As a result, the query is automatically modified and the group is excluded from the query.
If you want to go back to the original query, click Revert to original query.
You can navigate through the groups and view the contents of each group.
You can do a global search in all groups or a local search in events within a selected group.
You can use more complex grouping by adding one or more fields.
You can remove a group from the grouping and in this way, go back one step.
If the grouping query returns many events, only the first 1000 events are displayed. If the query contains SELECT Count(ID), you can click the link with the total number of events in the query result to view all events. If the request does not contain Count(ID), the number of events in the group is not indicated, but you still can click the link and view the total number of events in the group.
Statistics, retrospective check by group, and export to TSV are available.
If you want the grouping result to be independent of time (because events arrive continuously), you can set a fixed relative interval and apply it as an absolute interval so that the events of interest do not drop out of the selection. To fix a relative interval, in the Events section, in the time interval drop-down list, select Apply current range. You can now manage groups within this query.
If you want to arrange the selected events by months, days, minutes, and seconds, you can group events by the Timestamp field. To group events, select a grouping option in the context menu of the Timestamp field in the event table.
If you want to normalize the value of the Timestamp field and display the time values from different sources in the same UTC time scale, select Convert to UTC in the context menu of the Timestamp field in the events table.
Page topDisplaying names instead of IDs
When accessing certain event fields with IDs, KUMA returns the corresponding names rather than IDs. This helps make the information more readable. For example, if you access the TenantID event field (which stores the tenant ID), you get the value of the TenantName event field (which stores the tenant name).
When exporting events, values of both fields are written to the file, the ID as well as the name.
The table below lists the fields that are substituted when accessed:
Requested field |
Returned field |
|
|
|
|
|
|
|
|
|
|
|
|
|
|
Substitution does not occur if an alias is assigned to the field in the SQL query. Examples:
SELECT TenantID FROM `events` LIMIT 250— in the search result, the name of the tenant is displayed in the TenantID field.SELECT TenantID AS Tenant_name FROM `events` LIMIT 250— in the search result, the tenant ID will be displayed in the Tenant_name field.
Presets
You can use
to simplify work with queries if you regularly view data for a specific set of event fields. In the line with the SQL query, you can type
Select * and select a saved preset; in that case, the output is limited only to the fields specified in the preset. This method slows down performance but eliminates the need to write a query manually every time. Presets are saved on the KUMA Core server and are available to all KUMA users of the specified tenant.
To create a preset:
- In the Events section, click the icon.
- In the window that opens, on the Event field columns tab, select the required fields.
To simplify your search, you can start typing the field name in the Search area.
- To save the selected fields, click Save current preset.
The New preset window opens.
- In that window, specify the Name of the preset, and in the drop-down list, select the Tenant.
- Click Save.
The preset is created and saved.
To apply a preset:
- In the query entry field, enter Select *.
- In the Events section of the KUMA web interface, click the icon.
- In the opened window, use the Presets tab to select the relevant preset and click the
 button.
The fields from the selected preset are added to the SQL query field, and the columns are added to the table. No changes are made in Builder.
- Click Run query to run the query.
After the query execution completes, the columns are filled in.
Limiting the complexity of queries in alert investigation mode
When investigating an alert, the complexity of SQL queries for event filtering is limited if Related to alert is selected in the drop-down list of event sources. If this is the case, only the functions and operators listed below are available for event filtering.
If All events is selected from the drop-down list of event sources, these limitations do not apply.
SELECT- The
*character is used as a wildcard to represent any number of characters.
- The
WHEREAND,OR,NOT,=,!=,>,>=,<,<=INBETWEENLIKEinSubnet
Examples:
WHERE Type IN ('Base', 'Correlated')WHERE BytesIn BETWEEN 1000 AND 2000WHERE Message LIKE '%ssh:%'WHERE inSubnet(DeviceAddress, '10.0.0.1/24')
ORDER BYSorting can be done by column.
OFFSETSkip the indicated number of lines before printing the query results output.
LIMITThe default value is 250.
If you are filtering events by user-defined period and the number of strings in the search results exceeds the defined value, you can click the Show next button to display additional strings in the table. This button is not displayed when filtering events by the standard period.
When filtering by alert-related events in alert investigation mode, you cannot perform operations on the data of event fields or assign names to the columns of displayed data.
Page topSaving and selecting events filter configuration
In KUMA, you can save a filter configuration and use it in the future. Other users can also use the saved filters if they have the appropriate access rights. When saving a filter, you are saving the configured settings of all the active filters at the same time, including the time-based filter, query builder, and the events table settings. Search queries are saved on the KUMA Core server and are available to all KUMA users of the selected tenant.
To save the current settings of the filter, query, and period:
- In the Events section of the KUMA web interface, click the
 icon next to the filter expression.
This opens the New filter window.
- In the window that opens, enter the name of the filter configuration in the Name field. The name can contain up to 128 Unicode characters.
- Under Select folder, select the tenant to which you want the created filter to belong and the folder inside the tenant, if necessary.
To simplify your search, you can start typing the name in the Search area.
- If necessary, click Add folder to create a new folder inside the selected tenant.
- Click Save.
The filter configuration is now saved.
To select a previously saved filter configuration:
In the Events section of the KUMA web interface, click the  icon next to the filter expression and select the relevant filter.
The selected configuration is active, which means that the search field is displaying the search query, and the upper part of the window is showing the configured settings for the period and frequency of updating the search results. Click the Run query button to submit the search query.
To add the filter configuration to favorites, you can hover over the name of the filter configuration, click the  icon next to the name of the configuration and click the Add to favorites button.
Deleting event filter configurations
To delete a previously saved filter configuration:
- In the Events section of the KUMA web interface, click the icon next to the filter search query.
This opens the Saved queries window.
- Hover over the configuration that you want to delete and click the icon next to its name.
- This opens a menu; in the menu, click the
 icon.
icon.
The filter configuration is now deleted for all KUMA users.
Page topSupported ClickHouse functions
The following ClickHouse functions are supported in KUMA:
- Arithmetic functions.
- Arrays.
- Comparison functions.
- Logical functions.
- Type conversion functions.
- Date and time functions.
- String functions.
- String search functions.
- Conditional functions: only the regular 'if' operator; the ternary operator is not supported.
- Mathematical functions.
- Rounding functions.
- Functions for splitting and merging strings and arrays.
- Bit functions.
- Functions for working with UUIDs.
- Functions for working with URLs.
- Functions for working with IP addresses.
- Functions for working with Nullable arguments.
- Functions for working with geographic coordinates.
Functions from other sections are not supported.
For more details on SQL, refer to the ClickHouse documentation.
Page topViewing event detail areas
To view information about an event:
- In the application web interface window, select the Events section.
- Search for events by using the query builder or by entering a query in the search field.
The event table is displayed.
- Select the event whose information you want to view.
The event details window opens.
The Event details area appears in the right part of the web interface window and contains a list of the event's parameters with values. In this area you can:
- Include the selected field in the search or exclude it from the search by clicking or next to the setting value.
- Clicking a file hash in the FileHash field opens a list in which you can select one of the following actions:
- Show info from Threat Lookup.
This is available when integrated with Kaspersky Threat Intelligence Portal.
- Add to Internal TI of CyberTrace.
- This is available when integrated with Kaspersky CyberTrace.
- Show info from Threat Lookup.
- Open a window containing information about the asset if it is mentioned in the event fields and registered in the application.
- You can click the link containing the collector name in the Service field to view the settings of the service that registered the event.
You can also link an event to an alert if the application is in alert investigation mode and open the Correlation event details window if the selected event is a correlation event.
In the Event details area, the name of the described object is shown instead of its ID in the values of the following settings. At the same time, if you change the filtering of events by this setting (for example, by clicking to exclude events with a certain setting-value combination from search results), the object's ID, and not its name, is added to the SQL query:
- TenantID
- SeriviceID
- DeviceAssetID
- SourceAssetID
- DestinationAssetID
- SourceAccountID
- DestinationAccountID
Exporting events
In KUMA, you can export information about events to a TSV file. The selection of events that will be exported to a TSV file depends on filter settings. The information is exported from the columns that are currently displayed in the events table. The columns in the exported file are populated with the available data even if they did not display in the events table in the KUMA web interface due to the special features of the SQL query.
To export information about events:
- In the Events section of the KUMA web interface, click the TSV button in the upper part of the table of events.
The new export TSV file task is created in the Task manager section.
- Find the task you created in the Task manager section.
When the file is ready to be downloaded, the Status column of the task displays the Completed status and the
 icon.
icon. - Click the task type name and select Upload from the drop-down list.
The TSV file will be downloaded using your browser's settings. By default, the file name is event-export-<date>_<time>.tsv.
The file is saved based on your web browser's settings.
Page topConfiguring the table of events
Responses to user SQL queries are presented as a table in the Events section. The fields selected in the custom query appear at the end of the table, after the default columns. This table can be updated.
The following columns are displayed in the events table by default:
- TenantID.
- Timestamp.
- Name.
- DeviceProduct.
- DeviceVendor.
- DestinationAddress.
- DestinationUserName.
In KUMA, you can customize the displayed set of event fields and their display order. The selected configuration can be saved.
When using SQL queries with data grouping and aggregation for filtering events, statistics are not available and the order of displayed columns depends on the specific SQL query.
In the events table, in the event details area, in the alert window, and in the widgets, the names of assets, accounts, and services are displayed instead of the IDs as the values of the SourceAssetID, DestinationAssetID, DeviceAssetID, SourceAccountID, DestinationAccountID, and ServiceID fields. When exporting events to a file, the IDs are saved, but columns with names are added to the file. The IDs are also displayed when you point the mouse over the names of assets, accounts, or services.
Searching for fields with IDs is only possible using IDs.
To configure the fields displayed in the events table:
- Click the icon in the upper-right corner of the events table.
A window for selecting the event fields that should be displayed in the events table will be displayed.
- Select the check boxes opposite the fields that you want to view in the table. You can search for relevant fields by using the Search field.
You can configure the table to display any event field from the KUMA event data model and the extended event schema. The Timestamp and Name parameters are always displayed in the table. Click the Default button to display only default event parameters in the events table.
When you select a check box, the events table is updated and a new column is added. When a check box is cleared, the column disappears.
You can also remove columns from the events table by clicking the column title and selecting Hide column from the drop-down list.
- If necessary, change the display order of the columns by dragging the column headers in the event tables.
- If you want to sort the events by a specific column, click its title and in the drop-down list select one of the available options: Ascending or Descending.
The selected event fields will be displayed as columns in the table of the Events section in the order you specified.
Page topRefreshing events table
You can update the displayed event selection with the most recent entries by refreshing the web browser page. You can also refresh the events table automatically and set the frequency of updates. Automatic refresh is disabled by default.
To enable automatic refresh,
Select a refresh rate from the drop-down list in the upper-right part of the Events section:
- 5 seconds
- 15 seconds
- 30 seconds
- 1 minute
- 5 minutes
- 15 minutes
The events table now refreshes automatically.
To disable automatic refresh:
In the drop-down list of refresh rates in the upper-right part of the Events section, select No refresh.
Page topGetting events table statistics
You can get statistics for the current events selection displayed in the events table. The selected events depend on the filter settings.
To obtain statistics:
Select Statistics from the drop-down list in the upper-right corner of the events table, or click on any value in the events table and select Statistics from the opened context menu.
The Statistics details area appears with the list of parameters from the current event selection. The numbers near each parameter indicate the number of events with that parameter in the selection. If a parameter is expanded, you can also see its five most frequently occurring values. You can find relevant parameters by using the Search fields field.
In a high availability configuration, for all event fields that contain the FQDN of the Core, the Statistics section displays core instead of the FQDN.
The Statistics window allows you to modify the events filter.
When using SQL queries with data grouping and aggregation for filtering events, statistics are not available.
Page topViewing correlation event details
You can view the details of a correlation event in the Correlation event details window.
To view information about a correlation event:
- In the Events section of the KUMA web interface, click a correlation event.
You can use filters to find correlation events by assigning the
correlatedvalue to theTypeparameter.The details area of the selected event will open. If the selected event is a correlation event, the Detailed view button will be displayed at the bottom of the details area.
- Click the Detailed view button.
The correlation event window will open. The event name is displayed in the upper left corner of the window.
The Correlation event details section of the correlation event window contains the following data:
- Correlation event severity—the importance of the correlation event.
- Correlation rule—the name of the correlation rule that triggered the creation of this correlation event. The rule name is represented as a link that can be used to open the settings of this correlation rule.
- Correlation rule severity—the importance of the correlation rule that triggered the correlation event.
- Correlation rule ID—the identifier of the correlation rule that triggered the creation of this correlation event.
- Tenant—the name of the tenant that owns the correlation event.
The Related events section of the correlation event window contains the table of events related to the correlation event. These are base events that actually triggered the creation of the correlation event. When an event is selected, the details area opens in the right part of the web interface window.
The Find in events link to the right of the section header is used for alert investigation.
The Related endpoints section of the correlation event window contains the table of hosts related to the correlation event. This information comes from the base events related to the correlation event. Clicking the name of the asset opens the Asset details window.
The Related users section of the correlation event window contains the table of users related to the correlation event. This information comes from the base events related to the correlation event.
Generating an SQL query using KUMA SQL functions
KUMA's SQL functions allow using the attributes of assets and accounts in search queries to filter events, generate reports and widgets (graph type: Table). You can enrich events with data from dictionaries, tables, assets, and accounts using the following sets of functions:
- The enrich function set. Allows enriching query results with fields of the asset or account, values from a dictionary of the Dictionary type or a dictionary of the Table type. The
enrichfunction set includes the following functions:enrich_assetsenrich_accountsenrich_tableenrich_dictionary
- The lookup function set. Allows adding conditions for assets and accounts to the search query. The
lookupfunction set includes the following functions:lookup_assetslookup_accountslookup_assets_category
The maximum number of events per query is 10,000.
Page topUsing the 'enrich' function set in SQL queries
The enrich function set (see the table below) is used in the SELECT clause of an SQL query to enrich the results.
When using this set of functions, you cannot group events by enriched fields.
Widgets and reports enriched by the functions must be owned by no more than one tenant.
The values of asset fields that are specified in SQL queries are case-sensitive.
Description of the 'enrich' set of functions
Function |
Event field |
Asset field |
Description |
|---|---|---|---|
|
|
|
Enriches the query result with asset fields based on the ID specified passed to the function. For example:
|
|
|
|
Enriches the query result with account fields based on the ID specified passed to the function. For example:
This function is available only for tenants that have LDAP enrichment enabled. |
|
|
|
Enriches the query result with values from a dictionary of the Table type based on event fields in the response from the ClickHouse cluster. For example:
Only one column of the table can be the key, but the record key can be a compound key. For example:
The |
|
|
|
Enriches the query result with values from a dictionary of the Dictionary type based on event fields in the response from the ClickHouse cluster. For example:
You can view the path to the dictionary in the Resources → Dictionaries section. |
Example SQL queries with an enrich function You can specify an
|
Using the 'lookup' function set in SQL queries
The lookup function set (see the table below) is used in the WHERE clause of an SQL query to add conditions for assets and accounts to the search query.
Description of the 'lookup' set of functions
Function type |
Event field |
Asset field |
Operator |
Description |
|---|---|---|---|---|
|
|
|
|
Allows you to add conditions to the query result for assets whose field values match the value specified in the query. For values that are number, you must specify a string with the required number. For example:
|
|
|
Allows you to add conditions for assets with field values that are:
For values that are number, you must specify a string with the required number. For example:
Date values can be specified in the following formats:
|
||
|
|
Allows you to add asset conditions to the query result using a string literal or a regular expression. For example:
Using a case-insensitive regular expression (PCRE2) is allowed. |
||
|
|
Allows you to add to the result asset conditions whose values match the value specified in the query. For example:
|
||
|
|
Allows you to add conditions for assets with IP addresses in the specified subnet. The IP address is specified in CIDR format. For example:
|
||
|
|
Allows you to add conditions for assets with IP addresses in the specified range. The first IP address specified in the query is the start IP address, and the second is the end address. For example:
The query filters assets with IP addresses in the range from 192.168.1.1 to 192.168.1.184. |
||
|
|
|
|
Allows you to add conditions to the query result for accounts whose field values match the value specified in the query. For values that are number, you must specify a string with the required number. For example:
|
|
|
Allows you to add conditions to the query result for accounts whose field values match the 'like' expression specified in the query. For more information about the like operator, please refer to the SQL Language Expressions reference.
|
||
|
|
|
|
Finds all events that have associated assets in the specified folder. For example:
where |
Example SQL queries with a lookup function You can specify a
|
Event route tracing
To find out which connection the events were received from, you can use the Trace event route setting. You may need to trace the route of an event when multiple agents send events to the same collector, for example, in a large infrastructure where agents are installed on dedicated WEC servers and multiple agents send events to the same collector. The event route information can be useful for troubleshooting event routing.
For the Trace event route toggle switch to become available, you must specify at least one internal destination in the agent. Also, to trace event routes, a connector of the internal type must be specified in the collector that is receiving events from the agent. After configuring and saving the agent, information about the agent's route is added to the S.KL_EventRoute field of the extended event schema.
The S.KL_EventRoute field is displayed only for new events that are received by the collector after enabling the Trace event route setting. Other services through which the event passes, including the collector, correlator (only correlation rules of the 'simple' type), and router, parse the S.KL_EventRoute field, and, if the field is not empty, add their own information to the field when they process the event.
If there is a proxy between the sender server and the agent, the proxy address is specified in the S.KL_EventRoute field on the agent, and the collector adds the proxy address to the initial part of the route in the S.KL.EventRoute field.
Connectors of the tcp/udp/http type use the internal protocol to pass the address of the host that sent the event in the S.KL_EventRoute field. If there is a proxy between the sender server and the agent, the proxy is specified indicated in the S.KL_EventRoute field. The WEC, WMI, and ETW agents use the internal protocol to pass the host name of the Windows server on which the agent is installed in the S.KL_EventRoute field.
You can enable event route tracing in one of the following ways:
- Create a new agent, specify the internal destination in it and enable the Trace event route option.
- In an existing agent, add a tab with a new connection and specify the internal destination on this tab. After you specify the internal destination, the Trace event route option becomes available. Enable the Trace event route toggle switch. After you save the agent settings, restart the agent to apply the changes.
- Unlink the automatically created agent from the collector to make the agent available for editing its settings, or duplicate the automatically created agent and proceed to configure the settings in the duplicate agent. After you specify the internal destination in the editable agent, the Trace event route option becomes available. Enable the Trace event route toggle switch. After you save the agent settings, restart the agent to apply the changes.
The Event tracing log section appears in the event card, alert card and correlation event card. This section displays information from the S.KL_EventRoute field in a processed form. Service IDs are converted to service names and displayed as clickable links. Clicking a service name opens a new browser tab with the card of the service. If you rename the service, the name of the service also changes when the event is displayed in the card, both for new events and for events that have already been received and processed. If you delete a service in the Active services section, the Event tracing log section displays Deleted instead of the hyperlink. The rest of the route information is not deleted and continues to be displayed: connector type, FQDN, and the value of the SourceAddress field. To view raw route information, you can add the S.KL_EventRoute column to the event table.
Using route information
You can use the 'Extract from JSON' function or other ClickHouse functions to get the parts of the route that you need for debugging. For more information about functions, please refer to the ClickHouse documentation: https://clickhouse.com/docs/en/sql-reference/functions/json-functions#jsonextractstringjson-indices-or-keys
The following table gives examples of queries.
Query example |
Description |
|
This query displays events for which the version of the collector is displayed in the version column. |
|
This query displays events for which the type of the collector is displayed in the connectorKind column. |
|
This query displays events received from connectors of a type other than 'wec'. |
If want to select by a different value from the S.KL_EventRoute field, you can look up the name of your parameter in the events table in the Raw column and use it in your query.
Page topCategorization of events
Categorization allows you to use special tags (categories) to describe events of the same type coming from different sources. This helps to find events related to, for example, user authentication or command execution, and helps in writing correlation logic or displaying data in a dashboard or in reports. You can use the KUMA resource set to categorize certain types of events for specific types of event sources.
The following types of KUMA resources are used to categorize events:
- A dictionary with categories of events
- Enrichment rules for enriching events with supplemental information.
- A normalizer for creating an extended event schema field used in enrichment rules.
As part of categorization, the following attributes can be added to an event:
- Object
- Action
- Result
- Threat
- Source type
Additional attributes can be assigned to the event, which are saved in the SA.KL_EventCategory extended event schema field.
Descriptions of the possible values of the attributes used for categorizing events are provided in tables: Object attribute, Action attribute, Result attribute, Threat attribute, Source type attribute.
To customize the categorization of events on a collector:
- Import the [OOTB] Event Categorization package from the KUMA repository.
- In the collector, at the Event enrichment step, apply an event enrichment rule.
You can apply the enrichment rule when creating a new collector or for an existing collector. The rule that you need to apply depends on the event source. You can select a rule from the Categorization rules by event source table.
Event categorization works only when using Kaspersky normalizers.
- In the KUMA web interface, select the Resources → Active services section.
- Select the check box next to the modified collector and click the Update configuration button.
The enrichment rule is applied, and the categorization of events is performed.
Categorization rules by event source
System name |
Normalizer name |
Enrichment rule name |
Microsoft, OS event logs |
[OOTB] Microsoft Products for KUMA 3 |
[OOTB] Event categorization. Microsoft Products |
Microsoft Sysmon |
[OOTB] Microsoft Products for KUMA 3 |
[OOTB] Event categorization. Microsoft Products |
Auditd |
[OOTB] Linux auditd syslog for KUMA 3.2 |
[OOTB] Event categorization. Auditd |
Kaspersky Security Center |
[OOTB] KSC from SQL |
[OOTB] Event categorization. Kaspersky Security Center |
Kaspersky Security for Linux Mail Server |
[OOTB] KLMS syslog CEF |
[OOTB] Event categorization. Kaspersky Security for Linux Mail Server |
Kaspersky IoT Secure Gateway |
[OOTB] Kaspersky KISG syslog |
[OOTB] Event categorization. Kaspersky IoT Secure Gateway |
Kaspersky Container Security |
[OOTB] Syslog-CEF |
[OOTB] Event categorization. Kaspersky Container Security |
Kaspersky Industrial CyberSecurity for Networks |
[OOTB] Kaspersky Industrial CyberSecurity for Networks 4.2 syslog |
[OOTB] Event categorization. Kaspersky Industrial CyberSecurity for Networks |
Kaspersky Web Traffic Security |
[OOTB] KWTS syslog CEF |
[OOTB] Event categorization. Kaspersky Web Traffic Security |
Kaspersky Mail Security Gateway |
[OOTB] KSMG syslog CEF |
[OOTB] Event categorization. Kaspersky Mail Security Gateway |
Object attribute
Value of the Object attribute |
Description |
account |
Accounts |
configuration |
Settings |
connection |
Network connection |
container |
Containers |
data |
Data or tables in the database |
dns |
DNS queries |
file |
Files |
group |
Groups |
host |
Host |
http |
WEB requests |
image |
DLLs and drivers |
malware |
Malicious object |
permission |
Rights and privileges |
process |
Process |
registry |
Registry keys |
service |
Services and daemons |
task |
Tasks |
VM |
Virtual machine |
device |
Token, USB device, attached device |
certificate |
Certificate |
Action attribute
Value of the Action attribute |
Description |
access |
Request or grant access to an object |
add |
Create or add |
authentication |
Authenticate |
block |
Block, prevent |
delete |
Delete |
detect |
Detect or quarantine |
end |
End of the process |
info |
Informational event about the object |
load |
Load object |
modify |
Modify settings or state of the object |
read |
Read |
receive |
Receive |
request |
Query |
send |
Send |
start |
Start of the process |
write |
Write |
Result attribute
Value of the Result attribute |
Description |
error |
Error |
failure |
Failure |
success |
Success |
Threat attribute
Value of the Threat attribute |
Description |
malware |
Malicious object in the file system |
vulnerability |
Vulnerability exploits |
attack |
Attack |
ddos |
Indicators of a DDoS attack |
phishing |
Indicators of phishing |
c2 |
Command and Control |
discovery |
Reconnaissance |
policy violation |
Violation of security policies |
tools |
Suspicious tools used |
escalation |
Privilege escalation |
Source type attribute
Value of the Source type attribute |
Description |
application |
Application-level events: logins, configuration changes, errors, and so on. |
AV |
Events received from anti-virus protection systems. |
database |
Events from databases related to data manipulation. |
IDS |
Events from traffic analyzers and network protection tools. |
network |
Events containing information about network connections coming from firewalls; also events from Netflow, Jflow, and so on. |
OS |
Events from the operating system, such as Windows, Linux, Cisco IOS, HP-UX, and so on. Standard operating system tools or EDR can be the event provider. |
vpn |
VPN session events. |
web |
Events coming from WEB applications and Proxy. Application-level HTTP connection events. |
container |
Events providing information about the operation of containers. |
Granular access to events
In KUMA, users with different rights can have granular access to events. Access to events is controlled at the level of storage spaces.
You can assign spaces to users in the Spaces permissions section or directly in a user's card. After upgrading to version 3.4, the 'All spaces' space set is assigned to all existing users, that is, access to all spaces is unrestricted. An event contains a tenant ID and a space ID, therefore the user needs rights to the corresponding tenant and space to have access to the event.
Keep in mind the following special considerations involved in displaying storages:
- If a storage is not listed in the Active services section, the storage and its spaces are not displayed in the list of spaces of the set.
- If the storage service was stopped using the
systemctl stop kuma-<storage ID>command, the storage and its spaces are not displayed in the list of spaces of the set. - If the storage was started and then deleted using the
uninstallcommand, the storage and its spaces remain in the list of spaces of the set.
In the list of events, you can add the SpaceID field to the table, which will display the name of the space. The space of audit events is displayed as KUMA Audit. KUMA Default is the space inside each storage, where all events go if the storage does not have configured spaces or if the event does not match the conditions of the existing spaces.
When you export the list of events to a TSV file, the space ID and name are displayed for spaces.
To differentiate access:
- Assign appropriate roles to users.
- Configure the space sets.
You can create, edit, or delete space sets. These actions result in audit events.
- Configure the access rights of the space set: you can grant or revoke access rights of selected users.
Use cases
Migrating to KUMA 3.4 with differentiated access to events
Restricting access to spaces for all users
Allowing some users to view all events
Permitting some users to view events from a finite set of spaces
Supplementing an explicitly specified space set for a user
Page topDashboard
In the Dashboard section, you can monitor the security status of your organization's network.
The dashboard is a set of widgets that display network security data analytics. You can view data only for those tenants to which you have access.
A selection of widgets used in the dashboard is called a layout. You can create layouts manually or use predefined layouts. You can edit widget settings in predefined layouts as necessary. By default, the dashboard displays the Alerts Overview predefined layout.
Only users with the Main administrator, Tenant administrator, Tier 2 analyst, and Tier 1 analyst roles can create, edit, or delete layouts. Users accounts with all roles can view layouts and set default layouts. If a layout is set as default, that layout is displayed for the account every time the user navigates to the Dashboard section. The selected default layout is saved for the current user account.
The information on the dashboard is updated in accordance with the schedule configured in layout settings. If necessary, you can force the update of the data.
For convenient presentation of information on the dashboard, you can enable TV mode. This mode lets you view the dashboard in full-screen mode in FullHD resolution. In TV mode, you can also configure a slide show display for the selected layouts.
Creating a dashboard layout
To create a layout:
- Open the KUMA web interface and select the Dashboard section.
- Open the drop-down list in the top right corner of the Dashboard window and select Create layout.
The New layout window opens.
- In the Tenants drop-down list, select the tenants that will own the created layout and whose data will be used to fill the widgets of the layout.
The selection of tenants in this drop-down list does not matter if you want to create a universal layout (see below).
- In the Time period drop-down list, select the time period from which you want to get analytics:
- If you want to specify an exact date, in the calendar on the left, select the start and end date of the period and click Apply.
You can select a date up to and including the current date. The date and time format depends on your browser settings. If the Date from or Date to field has a value and you have not edited the time value manually, when you select a date in the calendar, the Date from field is automatically populated with 00:00:00.000, and the Date to field with 23:59:59.999. If you have manually deleted the value in the Date from or Date to field, when you select a date in the calendar, the field is automatically populated with the current time. After you select a value in one of the fields, the focus switches to the other field. If your Date to is earlier than your Date from, this earlier value is automatically inserted into the Date from field.
- If you want to specify a relative period, select one of the available periods in the Relative period list on the right.
The period is calculated relative to the current time.
- If you want to specify a custom period, edit the value of the Date from and Date to fields.
You can enter an exact date and time in the DD.MM.YYYY HH:mm:ss.SSS format for the Russian localization and YYYY-MM-DD HH:mm:ss.SSS for the English localization or a period relative to the current time as a formula. You can also combine these methods if necessary. If you do not specify milliseconds when entering the exact date, 000 is substituted automatically. If you have edited the time in the Date from or Date to fields, picking a date in the calendar does not change the time component.
In the relative period formulas, you can use the now parameter for the current date and time and the interval parameterization language: + (only in the Date to field), -, / (rounding to the nearest), as well as time units: y (year), M (month), w (week), d (day), h (hour), m (minute), s (second). For example, you can specify the period now-5d to get data for the last five days, or now/w to get data from the beginning of the first day of the current week (00:00:00:000 UTC) to the current time (now).
The Date from field is required, and its value cannot exceed the value of the Date from field, and also cannot be earlier than 1970-01-01 (if specifying an exact date or a relative period). The Date to cannot be earlier than the Date from. If you do not specify a value in the Date from field, now is specified automatically.
By default, the 1 day (now-1d) relative period is selected. The bounds of the period are inclusive: for example, for the Today time range, events are displayed from the beginning (00:00:00:000 UTC) of the current day to the current time (now) inclusive, and for the Yesterday period, events are displayed from the beginning (00:00:00:000 UTC) of the previous day to 00:00:00:000 UTC of the current day.
KUMA stores time values in UTC, but in the user interface time is converted to the time zone of your browser. This is relevant to the relative periods: Today, Yesterday, This week, and This month. For example, if the time zone in your browser is UTC+3, and you select Today as the data display period, data will be displayed for the period from 03:00:00.000 until now, not from 00:00:00.000 until now.
If you want to take your time zone into account when selecting a relative data display period, such as Today, Yesterday, This week, or This month, you need to manually add a time offset in the Date from and Date to fields (if a value other than now is specified) by adding or subtracting the correct number of hours. For example, if your browser's time zone is UTC+3 and you want to display data for Yesterday, you need to change Date from to now-1d/d-3h and Date to to now/d-3h. If you want to display data for the Today period, you only need to change the value in the Date from field to now/d-3h.
If you need results up to 23:59:59:999 UTC of yesterday, you can use an SQL query with a filter by Timestamp or specify an exact date and time.
- If you want to specify an exact date, in the calendar on the left, select the start and end date of the period and click Apply.
- In the Refresh every drop-down list, select how often data should be updated in layout widgets:
- never — never refresh data in widgets of the layout
- 1 minute
- 5 minutes
- 15 minutes
- 1 hour (default)
- 3 hours
- 6 hours
- 12 hours
- 24 hours
- In the Add widget drop-down list, select the required widget and configure its settings. You can add multiple widgets. You can drag widgets around the window and resize them using the diagonal (
 ) button that appears when you hover over a widget.
The following limitations apply to widgets with the Pie chart, Bar chart, Line chart, Counter, and Date Histogram chart types:
- In
SELECTqueries, you can use extended event schema fields ofString,Number, andFloattypes. - In
WHEREqueries, you can use all types of extended event schema fields (String,Number,Float,Array of strings,Array of numbers, andArray of floats).
For widgets with the Table chart type, in
SELECTqueries, you can use all types of extended event schema fields (String,Number,Float,Array of strings,Array of numbers, andArray of floats).You can do the following with widgets:
- Add widgets.
- Edit widgets.
To edit widget:
- Hover over the required widget and click the gear (
 ) icon that appears.
 - In the drop-down list select Edit.
The window with widget parameters opens. You can check how the widget will look like by clicking the Preview button.
- Update widget parameters and click the Save button.
- Hover over the required widget and click the gear (
You can edit and delete a widget added to the layout by hovering over the widget, clicking the gear (
) icon that appears, and then selecting Edit or Delete. - In
- In the Layout name field, enter a unique name for this layout. Must contain 1 to 128 Unicode characters.
- If necessary, click the gear () icon on the right of the layout name field and select the check boxes next to the additional layout settings:
- Universal—if you select this check box, layout widgets display data from tenants that you select in the Selected tenants section in the menu on the left. This means that the data in the layout widgets will change based on your selected tenants without having to edit the layout settings. For universal layouts, tenants selected in the Tenants drop-down list are not taken into account.
If this check box is cleared, layout widgets display data from the tenants that are selected in the Tenants drop-down list in the layout settings. If any of the tenants selected in the layout are not available to you, their data will not be displayed in the layout widgets.
You cannot use the Active lists and context tables widget in universal layouts.
Universal layouts can only be created and edited by General administrators. Such layouts can be viewed by all users.
- Show CII-related data—if you select this check box, layout widgets will also show data on assets, alerts, and incidents related to critical information infrastructure (CII). In this case, these layouts will be available for viewing only by users whose settings have the Access to CII facilities check box selected.
If this check box is cleared, layout widgets will not display data on CII-related assets, alerts, and incidents, even if the user has access to CII objects.
- Universal—if you select this check box, layout widgets display data from tenants that you select in the Selected tenants section in the menu on the left. This means that the data in the layout widgets will change based on your selected tenants without having to edit the layout settings. For universal layouts, tenants selected in the Tenants drop-down list are not taken into account.
- Click Save.
The new layout is created and is displayed in the Dashboard section of the KUMA web interface.
Page topSelecting a dashboard layout
To select a dashboard layout:
- Expand the list in the upper right corner of the Dashboard window.
- Select the relevant layout.
The selected layout is displayed in the Dashboard section of the KUMA web interface.
Page topSelecting a dashboard layout as the default
To set a dashboard layout as the default:
- In the KUMA web interface, select the Dashboard section.
- Expand the list in the upper right corner of the Dashboard window.
- Hover the mouse cursor over the relevant layout.
- Click the
 icon.
icon.
The selected layout is displayed on the dashboard by default.
Page topEditing a dashboard layout
To edit a dashboard layout:
- In the KUMA web interface, select the Dashboard section.
- Expand the list in the upper right corner of the window.
- Hover the mouse cursor over the relevant layout.
- Click the
 icon.
icon.The Customizing layout window opens.
- Make the necessary changes. The settings that are available for editing are the same as the settings available when creating a layout.
- Click the Save button.
The dashboard layout is edited and displayed in the Dashboard section of the KUMA web interface.
If the layout is deleted or assigned to a different tenant while are making changes to it, an error is displayed when you click Save. The layout is not saved. Refresh the KUMA web interface page to see the list of available layouts in the drop-down list.
Page topDeleting a dashboard layout
To delete layout:
- In the KUMA web interface, select the Dashboard section.
- Expand the list in the upper right corner of the window.
- Hover the mouse cursor over the relevant layout.
- Click the
 icon and confirm this action.
The layout is deleted.
Page topEnabling and disabling TV mode
It is recommended to create a separate user with the minimum required set of right to display analytics in TV mode.
To enable TV mode:
- In the KUMA web interface, select the Dashboard section.
- Click the
 button in the upper-right corner.
The Settings window opens.
- Move the TV mode toggle switch to the Enabled position.
- To configure the slideshow display of the layouts, do the following:
- Move the Slideshow toggle switch to the Enabled position.
- In the Timeout field, indicate how many seconds to wait before switching layouts.
- In the Queue drop-down list, select the layouts to view. If no layout is selected, the slideshow mode displays all layouts available to the user one after another.
- If necessary, change the order in which the layouts are displayed using the
 button to drag and drop them.
- Click the Save button.
TV mode will be enabled. To return to working with the KUMA web interface, disable TV mode.
To disable TV mode:
- Open the KUMA web interface and select the Dashboard section.
- Click the button in the upper-right corner.
The Settings window opens.
- Move the TV mode toggle switch to the Disabled position.
- Click the Save button.
TV mode will be disabled. The left part of the screen shows a pane containing sections of the KUMA web interface.
When you make changes to the layouts selected for the slideshow, those changes will automatically be applied to the active slideshow sessions.
Page topPredefined dashboard layouts
KUMA comes with a set of predefined layouts: The default refresh period for predefined layouts is Never. You can edit these layouts as needed.
Predefined layouts
Layout name |
Description of widgets in the layout |
|---|---|
Alerts Overview |
|
Incidents Overview |
|
Network Overview |
|
[OOTB] KATA & EDR |
|
[OOTB] KSC |
|
[OOTB] KSMG |
|
[OOTB] KWTS |
|
[OOTB] KSMG files and hashes* |
|
[OOTB] KSMG rules and URLs* |
|
[OOTB] KSMG results* |
|
[OOTB] KSMG e-mail subjects and accounts* |
|
*Dashboards are available starting from KUMA 3.4.1. Widgets will correctly display information when using the "[OOTB] KSMG 2.1+ syslog CEF" normalizer.
Page topReports
You can configure KUMA to regularly generate reports about KUMA processes.
Reports are generated using report templates that are created and stored on the Templates tab of the Reports section.
Generated reports are stored on the Generated reports tab of the Reports section.
To save the generated reports in HTML and PDF formats, install the required packages on the device with the KUMA Core.
When deploying KUMA in a high availability version, the time zone of the Application Core server and the time in the user's browser may differ. This difference is manifested by the discrepancy between the time in reports generated by schedule and the data that the user can export from widgets. To avoid this discrepancy, it is recommended to configure the report generation schedule to take into account the difference between the users' time zone and UTC.
Report template
Report templates are used to specify the analytical data to include in the report, and to configure how often reports must be generated. Users with the General administrator, Tenant administrator, Tier 2 analyst, and Tier 1 analyst roles can create, edit, or delete report templates. Reports that were generated using report templates are displayed in the Generated reports tab.
Report templates are available in the Templates tab of the Reports section, where the table of existing templates is displayed. The table has the following columns:
You can configure a set of table columns and their order, as well as change data sorting:
- You can enable or disable the display of columns in the menu that can be opened by clicking the gear () icon.
- You can change the order of columns by dragging the column headers.
- If a table column header is green, you can click it to sort the table based on that column's data.
- Name—the name of the report template.
You can sort the table by this column by clicking the title and selecting Ascending or Descending.
You can also search report templates by using the Search field that opens when you click the Name column title.
Regular expressions are used when searching for report templates.
- Schedule—the rate at which reports must be generated using the template. If the report schedule was not configured, the
disabledvalue is displayed. - Created by—the name of the user who created the report template.
- Updated—the date when the report template was last updated.
You can sort the table by this column by clicking the title and selecting Ascending or Descending.
- Last report—the date and time when the last report was generated based on the report template.
- Send by email—the check mark is displayed in this column for the report templates that notify users about generated reports via email notifications.
- Tenant—the name of the tenant that owns the report template.
You can click the name of the report template to open the drop-down list with available commands:
- Run report—use this option to generate report immediately. The generated reports are displayed on the Generated reports tab.
- Edit schedule—use this command to configure the schedule for generating reports and to define users that must receive email notifications about generated reports.
- Edit report template—use this command to configure widgets and the time period for extracting analytics.
- Duplicate report template—use this command to create a copy of the existing report template.
- Delete report template—use this command to delete the report template.
Creating report template
To create report template:
- Open the KUMA web interface and select Reports → Templates.
- Click the New template button.
The New report template window opens.
- In the Tenants drop-down list, select one or more tenants that will own the layout being created.
- In the Time period drop-down list, select the time period from which you want to get analytics:
- If you want to specify an exact date, in the calendar on the left, select the start and end date of the period and click Apply.
You can select a date up to and including the current date. The date and time format depends on your browser settings. If the Date from or Date to field has a value and you have not edited the time value manually, when you select a date in the calendar, the Date from field is automatically populated with 00:00:00.000, and the Date to field with 23:59:59.999. If you have manually deleted the value in the Date from or Date to field, when you select a date in the calendar, the field is automatically populated with the current time. After you select a value in one of the fields, the focus switches to the other field. If your Date to is earlier than your Date from, this earlier value is automatically inserted into the Date from field.
- If you want to specify a relative period, select one of the available periods in the Relative period list on the right.
The period is calculated relative to the current time.
- If you want to specify a custom period, edit the value of the Date from and Date to fields.
You can enter an exact date and time in the DD.MM.YYYY HH:mm:ss.SSS format for the Russian localization and YYYY-MM-DD HH:mm:ss.SSS for the English localization or a period relative to the current time as a formula. You can also combine these methods if necessary. If you do not specify milliseconds when entering the exact date, 000 is substituted automatically. If you have edited the time in the Date from or Date to fields, picking a date in the calendar does not change the time component.
In the relative period formulas, you can use the now parameter for the current date and time and the interval parameterization language: + (only in the Date to field), -, / (rounding to the nearest), as well as time units: y (year), M (month), w (week), d (day), h (hour), m (minute), s (second). For example, you can specify the period now-5d to get data for the last five days, or now/w to get data from the beginning of the first day of the current week (00:00:00:000 UTC) to the current time (now).
The Date from field is required, and its value cannot exceed the value of the Date from field, and also cannot be earlier than 1970-01-01 (if specifying an exact date or a relative period). The Date to cannot be earlier than the Date from. If you do not specify a value in the Date from field, now is specified automatically.
By default, the 1 day (now-1d) relative period is selected. The bounds of the period are inclusive: for example, for the Today time range, events are displayed from the beginning (00:00:00:000) of the current day to the current time (now) inclusive, and for the Yesterday period, events are displayed from the beginning (00:00:00:000) of the previous day to 00:00:00:000 of the current day.
KUMA stores time values in UTC, but in the user interface time is converted to the time zone of your browser. This is relevant to the relative periods: Today, Yesterday, This week, and This month. For example, if the time zone in your browser is UTC+3, and you select Today as the data display period, data will be displayed for the period from 03:00:00.000 until now, not from 00:00:00.000 until now.
If you want to take your time zone into account when selecting a relative data display period, such as Today, Yesterday, This week, or This month, you need to manually add a time offset in the Date from and Date to fields (if a value other than now is specified) by adding or subtracting the correct number of hours. For example, if your browser's time zone is UTC+3 and you want to display data for Yesterday, you need to change Date from to now-1d/d-3h and Date to to now/d-3h. If you want to display data for the Today period, you only need to change the value in the Date from field to now/d-3h.
If you need results up to 23:59:59:999 UTC of yesterday, you can use an SQL query with a filter by Timestamp or specify an exact date and time.
- If you want to specify an exact date, in the calendar on the left, select the start and end date of the period and click Apply.
- In the Retention field, specify how long you want to store reports that are generated according to this template.
- In the Template name field, enter a unique name for the report template. Must contain 1 to 128 Unicode characters.
- In the Add widget drop-down list, select the required widget and configure its settings. You can add multiple widgets. You can drag widgets around the window and resize them using the diagonal () button that appears when you hover over a widget.
The following limitations apply to widgets with the Pie chart, Bar chart, Line chart, Counter, and Date Histogram chart types:
- In
SELECTqueries, you can use extended event schema fields ofString,Number, andFloattypes. - In
WHEREqueries, you can use all types of extended event schema fields (String,Number,Float,Array of strings,Array of numbers, andArray of floats).
For widgets with the Table chart type, in
SELECTqueries, you can use all types of extended event schema fields (String,Number,Float,Array of strings,Array of numbers, andArray of floats).You can do the following with widgets:
- Add widgets.
- Edit widgets.
To edit widget:
- Hover over the required widget and click the gear () icon that appears.
- In the drop-down list select Edit.
The window with widget parameters opens. You can check how the widget will look like by clicking the Preview button.
- Update widget parameters and click the Save button.
- Hover over the required widget and click the gear (
You can edit and delete a widget added to the layout by hovering over the widget, clicking the gear (
) icon that appears, and then selecting Edit or Delete. - In
- You can change logo in the report template by clicking the Upload logo button.
When you click the Upload logo button, the Upload window opens and lets you choose the image file for the logo. The image must be a .jpg, .png, or .gif file no larger than 3 MB.
The added logo is displayed in the report instead of KUMA logo.
- If necessary, select the Show CII-related data check box to display data on assets, alerts, and incidents related to critical information infrastructure (CII) in the layout widgets. In this case, these layouts will be available for viewing only by users whose settings have the Access to CII facilities check box selected.
If this check box is cleared, layout widgets will not display data on CII-related assets, alerts, and incidents, even if the user has access to CII objects.
- Click Save.
The new report template is created and is displayed on the Reports → Templates tab of the KUMA web interface. You can run this report manually. If you want to have the reports generated automatically, you must configure the schedule for that.
Page topConfiguring report schedule
To configure the report schedule:
- Open the KUMA web interface and select Reports → Templates.
- In the report templates table, click the name of an existing report template and select Edit schedule in the drop-down list.
The Report settings window opens.
- If you want the report to be generated regularly:
- Turn on the Schedule toggle switch.
In the Recur every group of settings, define how often the report must be generated.
You can specify the frequency of generating reports by days, weeks, months, or years. Depending on the selected period, you should specify the time, day of the week, day of the month or the date of the report generation.
- In the Time field, enter the time when the report must be generated. You can enter the value manually or using the clock icon.
- Turn on the Schedule toggle switch.
- To select the report format and specify the report recipients, configure the following settings:
- In the Send to group of settings, click Add.
- In the Add emails window that opens, in the User group section, click Add group.
- In the field that appears, specify the email address and press Enter or click outside the entry field—the email address will be added. You can add more than one address. Reports are sent to the specified addresses every time you generate a report manually or KUMA generates a report automatically on schedule.
You should configure an SMTP connection so that generated reports can be forwarded by email.
If the recipients who received the report by email are KUMA users, they can download or view the report by clicking the links in the email. If the recipients are not KUMA users, they can follow the links but cannot log in to KUMA, so only attachments are available to them.
We recommend viewing HTML reports by clicking links in the web interface, because at some screen resolutions, the HTML report from the attachment may not be displayed correctly.
If you send an email without attachments, the recipients will have access to reports only by links and only with authorization in KUMA, without restrictions on roles or tenants.
- In the drop-down list, select the report format to send. Available formats: PDF, HTML, , Excel.
- Click Save.
Report schedule is configured.
Page topEditing report template
To edit report template:
- Open the KUMA web interface and select Reports → Templates.
- In the report templates table click the name of the report template and select Edit report template in the drop-down list.
The Edit report template window opens.
You can also open this window on the Reports → Generated reports tab by clicking the name of a generated report and selecting in the drop-down list Edit report template.
- Make the necessary changes:
- Change the list of tenants that own the report template.
- Update the time period from which you require analytics.
- Add widgets
- Change widgets positions by dragging them.
- Resize widgets using the diagonal () button that appears when you hover over a widget.
- Edit widgets
To edit widget:
- Hover over the required widget and click the gear () icon that appears.
- In the drop-down list select Edit.
The window with widget parameters opens. You can check how the widget will look like by clicking the Preview button.
- Update widget parameters and click the Save button.
- Hover over the required widget and click the gear (
- Delete widgets by hovering over them, clicking the gear () icon that appears, and selecting Delete.
- In the field to the right from the Add widget drop-down list enter a new name of the report template. Must contain 1 to 128 Unicode characters.
- Change the report logo by uploading it using the Upload logo button. If the template already contains a logo, you must first delete it.
- Change how long reports generated using this template must be stored.
- If necessary, select or clear the Show CII-related data check box.
- Click Save.
The report template is updated and is displayed on the Reports → Templates tab of the KUMA web interface.
Page topCopying report template
To create a copy of a report template:
- Open the KUMA web interface and select Reports → Templates.
- In the report templates table, click the name of an existing report template, and select Duplicate report template in the drop-down list.
The New report template window opens. The name of the widget is changed to
<Report template> - copy. - Make the necessary changes:
- Change the list of tenants that own the report template.
- Update the time period from which you require analytics.
- Add widgets
- Change widgets positions by dragging them.
- Resize widgets using the diagonal () button that appears when you hover over a widget.
- Edit widgets
To edit widget:
- Hover over the required widget and click the gear () icon that appears.
- In the drop-down list select Edit.
The window with widget parameters opens. You can check how the widget will look like by clicking the Preview button.
- Update widget parameters and click the Save button.
- Hover over the required widget and click the gear (
- Delete widgets by hovering over them, clicking the gear () icon that appears, and selecting Delete.
- In the field to the right from the Add widget drop-down list enter a new name of the report template. Must contain 1 to 128 Unicode characters.
- Change the report logo by uploading it using the Upload logo button. If the template already contains a logo, you must first delete it.
- Click Save.
The report template is updated and is displayed on the Reports → Templates tab of the KUMA web interface.
Page topDeleting report template
To delete report template:
- Open the KUMA web interface and select Reports → Templates.
- In the report templates table, click the name of the report template, and select Delete report template in the drop-down list.
A confirmation window opens.
- If you want to delete only the report template, click the Delete button.
- If you want to delete a report template and all the reports that were generated using that template, click the Delete with reports button.
The report template is deleted.
Page topGenerated reports
All reports are generated using report templates. Generated reports are available on the Generated reports tab of the Reports section and are displayed in the table with the following columns:
You can configure a set of table columns and their order, as well as change data sorting:
- You can enable or disable the display of columns in the menu that can be opened by clicking the gear () icon.
- You can change the order of columns by dragging the column headers.
- If a table column header is green, you can click it to sort the table based on that column's data.
- Name—the name of the report template.
You can sort the table by this column by clicking the title and selecting Ascending or Descending.
- Time period—the time period for which the report analytics were extracted.
- Last report—date and time when the report was generated.
You can sort the table by this column by clicking the title and selecting Ascending or Descending.
- Tenant—name of the tenant that owns the report.
- User—name of the user who generated the report manually. If the report was generated by schedule, the value is blank. If the report was generated in KUMA lower than 2.1, the value is blank.
You can click the name of a report to open the drop-down list with available commands:
- Open report—use this command to open the report data window.
- Save as—use this command to save the generated report in the desired format. Available formats: HTML, PDF, CSV, split CSV, Excel. By default, 250 rows are displayed in all formats. At most 500 values can be displayed in tables in PDF and HTML formats. If you want to output more than 500 rows in a report, set your value for the LIMIT parameter in the SQL query and save the report in CSV format.
- Run report—use this option to generate report immediately. Refresh the browser window to see the newly generated report in the table.
- Edit report template—use this command to configure widgets and the time period for extracting analytics.
- Delete report—use this command to delete the report.
Viewing reports
To open report:
- Open the KUMA web interface and select Reports → Generated reports.
- In the report table, click the name of the generated report, and select Open report in the drop-down list.
The new browser window opens with the widgets displaying report analytics. If a widget displays data on events, alerts, incidents, active lists, or context tables, you can click its header to open the corresponding section of the KUMA web interface with an active filter and/or search query that is used to display data from the widget. Widgets are subject to default restrictions.
To download the data displayed on each widget in CSV format with UTF-8 encoding, press the CSV button. The downloaded file name has the format <widget name>_<download date (YYYYMMDD)>_<download time (HHMMSS)>.CSV.
To view the full data, download the report in the CSV format with the specified settings from the request.
- You can save the report in the desired format by using the Save as button.
Generating reports
You can generate report manually or configure a schedule to have it generated automatically.
To generate report manually:
- Open the KUMA web interface and select Reports → Templates.
- In the report templates table, click a report template name and select Run report in the drop-down list.
You can also generate report from the Reports → Generated reports tab by clicking the name of an existing report and in the drop-down list selecting Run report.
The report is generated and is displayed on the Reports → Generated reports tab.
To generate reports automatically, configure the report schedule.
Page topSaving reports
To save the report in the desired format:
- Open the KUMA web interface and select Reports → Generated reports.
- In the report table, click the name of the generated report, and in the drop-down list select Save as. Then select the desired format: HTML, PDF, CSV, split CSV, Excel.
The report is saved to the download folder configured in your browser.
You can also save the report in the desired format when you view it.
Page topDeleting reports
To delete report:
- Open the KUMA web interface and select Reports → Generated reports.
- In the report table, click the name of the generated report, and in the drop-down list select Delete report.
A confirmation window opens.
- Click OK.
Widgets
Widgets let you monitor the operation of the application. Widgets are organized into widget groups, each one related to the analytics type they provide. The following widget groups and widgets are available in KUMA:
- Events—widget for creating analytics based on events.
- Active lists—widget for creating analytics based on active lists of correlators.
- Alerts—group for alert analytics.
The group includes the following widgets:
- Active alerts—number of alerts that have not been closed.
- Active alerts by tenant—number of unclosed alerts for each tenant.
- Alerts by tenant—number of alerts of all statuses for each tenant.
- Unassigned alerts—number of alerts that have the New status.
- Alerts by assignee—number of alerts with the Assigned status, grouped by account name.
- Alerts by status—number of alerts that have the New, Opened, Assigned, or Escalated status, grouped by status.
- Alerts by severity—number of unclosed alerts grouped by their severity.
- Alerts by rule—number of unclosed alerts grouped by correlation rule.
- Latest alerts—table with information about the last 10 unclosed alerts belonging to the tenants selected in the layout.
- Alerts distribution—number of alerts created during the period configured for the widget.
- Assets—group for analytics for assets from processed events. This group includes the following widgets:
- Affected assets—table with information about the level of importance of assets and the number of unclosed alerts they are associated with.
- Affected asset categories—categories of assets linked to unclosed alerts.
- Number of assets—number of assets that were added to KUMA.
- Assets in incidents by tenant—number of assets associated with unclosed incidents. The grouping is by tenant.
- Assets in alerts by tenant—number of assets associated with unclosed alerts, grouped by tenant.
- Incidents—group for incident analytics.
The group includes the following widgets:
- Active incidents—number of incidents that have not been closed.
- Unassigned incidents—number of incidents that have the Opened status.
- Incidents distribution—number of incidents created during the period configured for the widget.
- Incidents by assignee—number of incidents with the Assigned status, grouped by user account name.
- Incidents by status—number of incidents grouped by status.
- Incidents by severity—number of unclosed incidents grouped by their severity.
- Active incidents by tenant—number of unclosed incidents grouped by tenant available to the user account.
- All incidents—number of incidents of all statuses.
- All incidents by tenant—number of incidents of all statuses, grouped by tenant.
- Affected assets in incidents—number of assets associated with unclosed incidents.
- Affected assets categories in incidents—asset categories associated with unclosed incidents.
- Affected users in Incidents—users associated with incidents.
- Latest incidents—table with information about the last 10 unclosed incidents belonging to the tenants selected in the layout.
- Event sources—group for event source analytics. The group includes the following widgets:
- Top event sources by alerts number—number of unclosed alerts grouped by event source.
- Top event sources by convention rate—number of events associated with unclosed alerts. The grouping is by event source.
In some cases, the number of alerts generated by sources may be inaccurate. To obtain accurate statistics, it is recommended to specify the Device Product event field as unique in the correlation rule, and enable storage of all base events in a correlation event. However, correlation rules with these settings consume more resources.
- Users—group for analytics related to users from processed events. The group includes the following widgets:
- Affected users in alerts—number of accounts related to unclosed alerts.
- Number of AD users—number of Active Directory accounts received via LDAP during the period configured for the widget.
In the events table, in the event details area, in the alert window, and in the widgets, the names of assets, accounts, and services are displayed instead of the IDs as the values of the SourceAssetID, DestinationAssetID, DeviceAssetID, SourceAccountID, DestinationAccountID, and ServiceID fields. When exporting events to a file, the IDs are saved, but columns with names are added to the file. The IDs are also displayed when you point the mouse over the names of assets, accounts, or services.
Searching for fields with IDs is only possible using IDs.
Basics of managing widgets
The principle of data display in the widget depends on the type of the graph. The following graph types are available in KUMA:
- Pie chart (
 ).
). - Counter (
 ).
). - Table (
 ).
). - Bar chart (
 ).
). - Date Histogram (
 ).
). - Line chart
- Stacked Bar chart
Basics of general widget management
The name of the widget is displayed in the upper left corner of the widgets. By clicking the link with the name of the widget about events, alerts, incidents, or active lists, you can go to the corresponding section of the KUMA web interface.
A list of tenants for which data is displayed is located under the widget name.
In the upper right corner of the widget, the period for which data is displayed on the widget is indicated (for example, 30 days  ). Keep in mind that the data displayed in the dashboard may lag behind real time because of caching. You can view the date and time of the last update by hovering over the period icon.
If the Show data for previous period setting is enabled for the widget, and the widget is displaying data for a relative period, the tooltip also displays the previous period. The previous period is calculated relative to the current period as start and end values of the current period minus the duration of the current period. For example, if data is updated daily and displayed for a month, but only the first 10 days of the month have passed, the previous period is taken to be the last 10 days of the previous month.
You can change the data display period for the widget by clicking the period icon and selecting an exact date or a relative period in the window that is displayed. If you want the widget to display data for the period selected for the layout, click the Reset button. Changing the displayed period on the layout also changes the period displayed in the widget.
The time in the widget is displayed in the local time zone set in the browser.
The CSV button is located to the left of the period icon. You can download the data displayed on the widget in CSV format (UTF-8 encoding). The downloaded file name has the format <widget name>_<download date (YYYYMMDD)>_<download time (HHMMSS)>.CSV.
The widget displays data for the period selected in widget or layout settings only for the tenants that are selected in widget or layout settings.
Basics of managing Pie chart graphs
A pie chart is displayed under the list of tenants. You can left-click the selected segment of the diagram to go to the relevant section of the KUMA web interface. The data in that section is sorted in accordance with the filters and/or search query specified in the widget.
Under the period icon, the number of events, active lists, assets, alerts, or incidents grouped by the selected criteria for the data display period will be displayed.
Examples:
|
Basics of managing Counter graphs
Graphs of this type display the sum total of selected data.
Example: The Number of assets widget displays the total number of assets added to KUMA. |
Basics of managing Table graphs
Graphs of this type display data in a table format.
Example: In the Events widget, for which the SQL query |
Basics of managing Bar chart graphs
A bar chart is displayed below the list of tenants. You can left-click the selected diagram section to go to the Events section of the KUMA web interface. The data in that section is sorted in accordance with the filters and/or search query specified in the widget. To the right of the chart, the same data is represented as a table.
Example: In the a Netflow top internal IPs widget for which the SQL query |
Basics of managing Date Histogram graphs
A date histogram is displayed below the list of tenants. You can left-click the selected section of the chart to go to the Events section of the KUMA web interface with the relevant data. The data in that section is sorted in accordance with the filters and/or search query specified in the widget. To the right of the chart, the same data is represented as a table.
Example: In the Events widget, for which the SQL query |
Basics of managing Line chart graphs
A line chart is displayed below the list of tenants. You can left-click the selected section of the chart to go to the Events section of the KUMA web interface with the relevant data. The data in that section is sorted in accordance with the filters and/or search query specified in the widget. To the right of the chart, the same data is represented as a table.
Example: In the Events widget, for which the SQL query |
Basics of managing graphs of the Stacked bar chart type
A stacked bar chart with a legend is displayed below the list of tenants. The legend displays the names of categories by which the bars are sliced. To the left of each category is a check box that lets you hide or show the category. The number of bars in the chart corresponds to the number of values in the selected grouping. The bars have captions. The color of the corresponding category in the bar is assigned automatically. When you hover over the zones of the bars, a tooltip is displayed with the value and a description of the value. You can left-click the selected diagram section to go to the Events section of the KUMA web interface.
The meaning of bar height depends on the Format setting:
- If the Absolute values format is configured, the height of the bars corresponds to the sum of the values of the measured figure.
- If the Relative values, % format is configured, all bars have the same height of 100%, and the relative heights of colored zones on the bars correspond to the ratios of the values.
If, when creating a custom widget based on the stacked bar chart, you selected the Show data for previous period option, and the standard value, category, metric aliases are used in the query, the chart displays previous-period data as separate bars. However, if instead of the standard metric, the query uses a custom metric calculation with non-standard aliases, the Show data for previous period is not taken into account when displaying the chart (see example queries below).
Examples: When creating a custom widget of the Stacked Bar chart type based on an SQL query of an Events widget, the following rules apply:
However, you can manage the count by using standard aggregation functions ( Example 1: For the Events widget, the following SQL query is specified with standard aliases, and the Show data for previous period option was selected when creating the widget:
The X-axis stands for tenants (the field specified as the Next to each bar, an additional bar is displayed with historical data, if such data was received in the query response. Example 2: For the Events widget, the following SQL query is specified with custom metrics specified as the
The X-axis stands for tenants (the field specified as The additional bar with historical data is not displayed for a query with custom metrics, even if the Show data for previous period option was selected when creating the widget. Example 3: For the Events widget, the following SQL query is specified with standard aliases:
In contrast to the similar query in example 1, in this case, the X-axis stands for the types of events (the field specified as the Example 4: For the Events widget, the following SQL query is specified with standard aliases:
The chart displays the days of the month on the X axis (the field specified as the To create a similar chart with bars arranged by date and/or time, use a query with grouping and sorting by the following fields of the
We recommend using the Date Histogram to work with data that is arranged by date and/or time. |
Special considerations for displaying data in widgets
Limitations for the displayed data
For improved readability, KUMA has limitations on the data displayed in widgets depending on its type:
- Pie chart displays a maximum of 20 slices.
- Bar chart displays a maximum of 40 bars.
- Table displays a maximum of 500 entries.
- Date histogram displays a maximum of 365 days.
Data that exceeds the specified limitations is displayed in the widget in the Other category.
You can download the full data used for building analytics in the widget in CSV format.
Summing up the data
The format of displaying the total sum of data on date histogram, bar chart and pie chart depends on the locale:
- English locale: decades (every three digits) are separated by commas, the decimal part is separated by a period.
- Russian locale: decades (every three digits) are separated by spaces, the decimal part is separated by a comma.
Creating a widget
You can create a widget in a dashboard layout while creating or editing the layout.
To create a widget:
- Create a layout or switch to editing mode for the selected layout.
- Click Add widget.
- Select a widget type from the drop-down list.
This opens the widget settings window.
- Edit the widget settings.
- If you want to see how the data will be displayed in the widget, click Preview.
- Click Add.
The widget appears in the dashboard layout.
Page topEditing a widget
To edit a widget:
- In the KUMA web interface, select the Dashboard section.
- Expand the list in the upper right corner of the window.
- Hover the mouse cursor over the relevant layout.
- Click the pencil () icon.
The Customizing layout window opens.
- On the widget that you want to edit, click the gear () icon.
- Select Edit.
This opens the widget settings window.
- Edit the widget settings.
- Click Save in the widget settings window.
- Click Save in the Customizing layout window.
The changes are applied to the widget.
Page topDeleting a widget
To delete a widget:
- In the KUMA web interface, select the Dashboard section.
- Expand the list in the upper right corner of the window.
- Hover the mouse cursor over the relevant layout.
- Click the button.
The Customizing layout window opens.
- In the widget you want to delete, click .
- Select Delete.
- This opens a confirmation window; in that window, click OK.
- Click the Save button.
The widget is deleted.
Page topEvents widget
You can use the Events widget to get analytics based on SQL queries.
When creating this widget, you must specify the settings described in the tables below.
The  tab:
tab:
The following table lists the settings on the tab.
Description of parameters
Setting |
Description |
|---|---|
Graph |
Graph type. The following graph types are available:
|
Format |
Data display format: Absolute values or Relative values, %. The setting is available for a Stacked Bar chart. If you select the Absolute values format, the heights of the bars correspond to the sum of the values of the measured indicator. If you select the Relative values, % format, all bars have the same height of 100%, and the relative heights of colored zones on the bars correspond to the ratios of indicator values. By default, Absolute values is selected. |
Tenant |
The tenant for which data is displayed in the widget. You can select multiple tenants. By default, data is displayed for tenants selected in layout settings. |
Time period |
Period for which data is displayed in the widget. The default is As layout, meaning that data is displayed for the period selected for the layout. You can also specify a period for the widget in one of the following ways:
For details, see the Configuring a period subsection below. |
Show data for previous period |
Enable the display of data for two periods at the same time: for the current period and for the previous period. When using a Stacked Bar chart, the Show data for previous period setting is taken into account if the query contains standard aliases: |
Storage |
Storage that is searched for events. The list displays the available spaces. You can select only one storage, but you can select one or more spaces. The values in the Storage field are independent of the selected tenants in the Tenant field. The field displays storages and spaces, like in the Events section. If the user does not have access rights to one or more spaces of the storage, the widget cannot display information; the user cannot edit the widget, but can duplicate the widget using the Duplicate button. Duplication does not depend on access rights to spaces. If a template is duplicated in widgets that have spaces specified that are not accessible to the user, the value in the Storage field is reset. Such widgets display an error: Access denied (Operation returns no results because of allowed and selected event spaces). To save the template, you need to specify spaces in widgets. In widgets that have spaces that are accessible to the user, the value of the Storage field is not reset and is saved when the template is duplicated. If the user's email address is included in the list of recipients of the scheduled report, the user gets the full version of the report, regardless of which spaces are accessible. |
SQL query field ( |
Query for filtering and searching for events manually. You can create a query in Builder by clicking You can use extended event schema fields to create a chart of the table type. For detailed information on creating an SQL query in the query constructor, see below. The following limitations apply:
|
 )
)How to create a query in Builder
To create a query in Builder:
- Specify the values of the following parameters:
- SELECT—event fields that should be returned. The number of available fields depends on the selected graph type.
- In the drop-down list on the left, select the event fields for which you want to display data in the widget.
- The middle field displays what the selected field is used for in the widget: metric or value.
If you selected the Table graph type, in the middle fields, you must specify column names using ANSII-ASCII characters.
- In the drop-down list on the right, you can select an operation to be performed on the data:
- count—event count. This operation is available only for the ID event field. Used by default for line charts, pie charts, bar charts, and counters. This is the only option for date histogram.
- max is the maximum value of the event field from the event selection.
- min is the minimum value of the event field from the event selection.
- avg is the average value of the event field from the event selection.
- sum is the sum of event field values from the event selection.
- SOURCE is the type of the data source. Only the events value is available for selection.
- WHERE—conditions for filtering events.
- In the drop-down list on the left, select the event field that you want to use for filtering.
- Select the necessary operator from the middle drop-down list. The available operators depend on the type of value of the selected event field.
- In the drop-down list on the right, enter the value of the condition. Depending on the selected type of field, you may have to manually enter the value, select it from the drop-down list, or select it on the calendar.
You can add search conditions by clicking Add condition or remove search conditions by clicking
 .
.You can also add groups of conditions by clicking Add group. By default, groups of conditions are added with the AND operator, but you can change the it if necessary. Available values: AND, OR, NOT. Group conditions are deleted using the Delete group button.
- GROUP BY—event fields or aliases to be used for grouping the returned data. This parameter is not available for Counter graph type.
- ORDER BY—columns used as the basis for sorting the returned data. This parameter is not available for the Date Histogram and Counter graph types.
- In the drop-down list to the left, select the value that will be used for sorting.
- Select the sort order from the drop-down list on the right: ASC for ascending, DESC for descending.
- For Table type graphs, you can add sorting conditions by clicking Add column.
- LIMIT is the maximum number of data points for the widget. This parameter is not available for the Date Histogram and Counter graph types.
- SELECT—event fields that should be returned. The number of available fields depends on the selected graph type.
- Click Apply.
Example of search conditions in the query builder
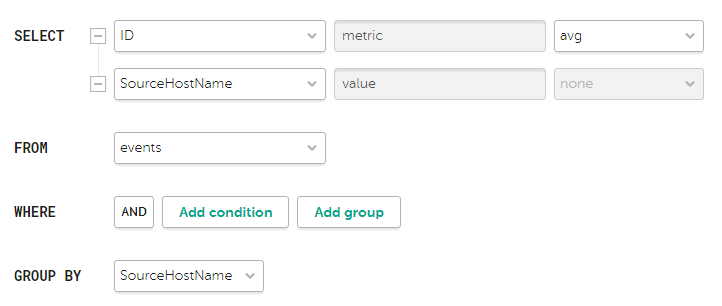
Parameters of search conditions for displaying the average number of bytes per host in the widget
The  tab:
tab:
The following table lists the settings on the tab.
The tab is displayed if on the tab in the Graph field you have selected one of the following values: Bar chart, Line chart, Date Histogram.
Description of parameters
Setting |
Description |
|---|---|
Y-min and Y-max |
Scale of the Y axis. Negative values can be displayed on chart axes. This is due to the scaling of charts on the widget and can be fixed by setting zero as the minimum chart values instead of Auto. |
X-min and X-max |
Scale of the X axis. Negative values can be displayed on chart axes. This is due to the scaling of charts on the widget and can be fixed by setting zero as the minimum chart values instead of Auto. |
Line-width |
Width of the line on the graph. This field is displayed for the Line chart graph type. |
Point size |
Point size on the graph. This field is displayed for the Line chart graph type. |
The  tab:
tab:
The following table lists the settings on the tab.
Description of parameters
Setting |
Description |
|---|---|
Name |
Name of the widget. |
Description |
Description of the widget. |
Color |
The color used for displaying the information:
This setting is available for graphs such as Bar chart, Counter, Line chart, Date Histogram. |
Horizontal |
Makes the histogram horizontal instead of vertical. When this option is enabled, when a widget displays a large amount of data, horizontal scrolling is not available and all available information is fit into the fixed size of the widget. If there is a lot of data to display, it is recommended to increase the widget size. |
Show total |
Shows sums total of the values. |
Show legend |
Displays a legend for the analytics. The toggle switch is turned on by default. |
Show nulls in legend |
Displays parameters with a null value in the legend for analytics. The toggle switch is turned off by default. |
Decimals |
Number of decimals to which the displayed value must be rounded off. |
Period segments length |
Duration of the segments into which you want to divide the period. Available for graphs of the Date Histogram type. |
Scale |
Scale for displaying data. Available for a Stacked Bar chart. The following values are possible:
The default is Linear. |
Active lists widget
You can use the Active lists widget to get analytics based on SQL queries.
When creating this widget, you must specify the settings described in the tables below.
The tab:
The following table lists the settings that must be specified on the tab.
Description of parameters
Setting |
Description |
|---|---|
Graph |
Graph type. The following graph types are available:
|
Tenant |
The tenant for which data is displayed in the widget. You can select multiple tenants. By default, data is displayed for tenants selected in layout settings. |
Correlator |
The name of the correlator that contains the active list for which you want to receive data. |
Active list |
The name of the active list for which you want to receive data. The same active list can be used by different correlators. However, a separate entity of the active list is created for each correlator. Therefore, the contents of the active lists used by different correlators differ even if the active lists have the same names and IDs. |
SQL query field |
This field lets you manually enter a query for filtering and searching active list data. The query structure is similar to that used in event search. When creating a query based on active lists, you must consider the following:
Special considerations apply when using aliases in SQL functions and SELECT, you can use double quotes and backticks: ", `. If you selected Counter as the graph type, aliases can contain Latin and Cyrillic characters, as well as spaces. When using spaces or Cyrillic, the alias must be enclosed in quotation marks: "An alias with a space", `Another alias`. When displaying data for the previous period, sorting by the count(ID) parameter may not work correctly. It is recommended to sort by the metric parameter. For example, SELECT count(ID) AS "metric", Name AS "value" FROM `events` GROUP BY Name ORDER BY metric ASC LIMIT 250. |
You can get the names of the tenants in the widget instead of their IDs.
Examples of SQL queries for receiving analytics based on active lists:
|
The tab:
The following table lists the settings that must be specified on the tab.
This tab is displayed if on the tab, in the Graph field, you have selected Bar chart.
Description of parameters
Settings |
Description |
|---|---|
Y-min and Y-max |
Scale of the Y axis. Negative values can be displayed on chart axes. This is due to the scaling of charts on the widget and can be fixed by setting zero as the minimum chart values instead of Auto. |
X-min and X-max |
Scale of the X axis. Negative values can be displayed on chart axes. This is due to the scaling of charts on the widget and can be fixed by setting zero as the minimum chart values instead of Auto. |
The tab:
The following table lists the settings that must be specified on the tab.
Description of parameters
Setting |
Description |
|---|---|
Name |
Name of the widget. |
Description |
Description of the widget. |
Color |
The color used for displaying the information:
|
Horizontal |
Makes the histogram horizontal instead of vertical. When this setting is enabled, all available information is fitted into the configured widget size. If the amount of data is great, you can increase the size of the widget to display it optimally. |
Show total |
Shows sums total of the values. |
Show legend |
Displays a legend for the analytics. The toggle switch is turned on by default. |
Show nulls in legend |
Displays parameters with a null value in the legend for analytics. The toggle switch is turned off by default. |
Context tables widget
You can use the Context tables widget to get analytics based on SQL queries.
When creating this widget, you must specify the settings described in the tables below.
The tab:
The following table lists the settings that must be specified on the tab.
Description of parameters
Setting |
Description |
|---|---|
Graph |
Graph type. The following graph types are available:
|
Tenant |
The tenant for which data is displayed in the widget. You can select multiple tenants. By default, data is displayed for tenants selected in layout settings. |
Correlator |
Name of the correlator that contains the context table for which you want to receive information. |
Context table |
Name of the context table for which you want to receive information. The same context table can be used in multiple correlators. However, a separate entity of the context table is created for each correlator. Therefore, the contents of the context tables used by different correlators are different even if the context tables have the same name and ID. |
SQL query field |
This field lets you manually enter a query for filtering and searching context table data. By default, for each widget type, the field contains a query that obtains the context table schema and the key by key fields. The query structure is similar to that used in event search. When creating a query based on context tables, you must consider the following:
Special considerations when using aliases in SQL functions and |
You can get the names of the tenants in the widget instead of their IDs.
Examples of SQL queries for receiving analytics based on active lists:
|
The tab:
The following table lists the settings that must be specified on the tab.
This tab is displayed if on the tab, in the Graph field, you have selected Bar chart.
Description of parameters
Setting |
Description |
|---|---|
Y-min and Y-max |
Scale of the Y axis. Negative values can be displayed on chart axes. This is due to the scaling of charts on the widget and can be fixed by setting zero as the minimum chart values instead of Auto. |
X-min and X-max |
Scale of the X axis. Negative values can be displayed on chart axes. This is due to the scaling of charts on the widget and can be fixed by setting zero as the minimum chart values instead of Auto. |
The tab:
The following table lists the settings that must be specified on the tab.
Description of parameters
Settings |
Description |
|---|---|
Name |
Name of the widget. |
Description |
Description of the widget. |
Color |
The color used for displaying the information:
|
Horizontal |
Makes the histogram horizontal instead of vertical. When this setting is enabled, all available information is fitted into the configured widget size. If the amount of data is great, you can increase the size of the widget to display it optimally. |
Show total |
Shows sums total of the values. |
Show legend |
Displays a legend for the analytics. The toggle switch is turned on by default. |
Show nulls in legend |
Displays parameters with a null value in the legend for analytics. The toggle switch is turned off by default. |
Assets custom widget
You can use the Assets → Customized widget to get advanced asset analytics from processed events using the query builder. In the query, you must specify the asset field and the corresponding condition or set of conditions by which you want the assets to be counted (Y-axis). You can also specify one or more additional conditions (categories) to be used for comparing the number of assets for each field.
When creating the custom widget for assets, you must specify the settings described in the tables below.
The tab:
The following table describes the settings on the tab.
Description of parameters
Setting |
Description |
|---|---|
Graph |
Graph type. The following graph types are available:
|
Format |
This setting is available for charts of the Stacked bar chart type. Data display format: Absolute values or Relative values, %. If you select the Absolute values format, the heights of the bars correspond to the sum of the values of the measured indicator. If you select the Relative values, % format, all bars have the same height of 100%, and the relative heights of colored zones on the bars correspond to the ratios of indicator values. By default, Absolute values is selected. |
Tenant |
The tenant for which data is displayed in the widget. You can select multiple tenants. By default, data is displayed for tenants selected in layout settings. |
Asset category |
The asset category for which the widget is displaying data. |
Search in uncategorized assets |
This setting lets you display assets that do not have a category. This check box is cleared by default. |
Select axes group of settings |
|
Y-axis |
Required setting. Asset field and the condition or set of conditions specified for this field, that define how assets are to be counted. |
Y-axis category |
Category for the selected field. Not used for a graph of the Counter type. This setting is optional for Y-axis fields whose values are enumerations (can be selected from a finite list of values). For all other fields, this parameter is required. |
Group by tenant |
This setting is available for charts of the Stacked bar chart type. Enables additional grouping of assets by tenant. If the check box is selected, assets on the chart are broken up along the X-axis into bars corresponding to individual tenants. If the check box is cleared, all assets are displayed on the same bar. This check box is cleared by default. |
The tab:
The following table describes the settings on the tab.
Description of parameters
Setting |
Description |
|---|---|
Name |
Name of the widget. |
Description |
Description of the widget. |
Show total |
This setting is available for charts of the Pie chart type. Enables the display of totals in the chart, in addition to the selected categories. If this check box is enabled, the sum of the values of all specified categories is displayed in the center of the pie chart and in the legend in a separate Total column. The toggle switch is turned off by default. |
Color |
This setting is available for charts of the Counter type. The color used for displaying the information:
|
Horizontal |
Makes the histogram horizontal instead of vertical. When this option is enabled, when a widget displays a large amount of data, horizontal scrolling is not available and all available information is fit into the fixed size of the widget. If there is a lot of data to display, it is recommended to increase the widget size. |
Show legend |
Displays a legend for the analytics. The toggle switch is turned on by default. |
Show nulls in legend |
Displays parameters with a null value in the legend for analytics. The toggle switch is turned off by default. |
Decimals |
Number of decimals to which the displayed value must be rounded off. |
Scale |
Available for a Stacked bar chart. Scale for displaying data. The following values are possible:
The default is Linear. |
Other widgets
This section describes the settings of all widgets except the Events and Active lists widgets.
The set of parameters available for a widget depends on the type of graph that is displayed on the widget. The following graph types are available in KUMA:
- Pie chart ().
- Counter ().
- Table ().
- Bar chart ().
- Date Histogram ().
- Line chart
- Stacked bar chart
Settings for pie charts
The following table below lists the settings of a Pie chart.
Description of parameters
Setting |
Description |
|---|---|
Name |
Name of the widget. |
Description |
Description of the widget. |
Tenant |
The tenant for which data is displayed in the widget. You can select multiple tenants. By default, data is displayed for tenants selected in layout settings. |
Time period |
Period for which data is displayed in the widget. The default is As layout, meaning that data is displayed for the period selected for the layout. You can also specify a period for the widget in one of the following ways:
For details, see the Configuring a period subsection below. |
Show total |
Shows sums total of the values. |
Show legend |
Displays a legend for the analytics. The toggle switch is turned on by default. |
Show nulls in legend |
Displays parameters with a null value in the legend for analytics. The toggle switch is turned off by default. |
Decimals |
Number of decimals to which the displayed value must be rounded off. |
Settings for counters
The following table below lists the settings of a Counter.
Description of parameters
Setting |
Description |
|---|---|
Name |
Name of the widget. |
Description |
Description of the widget. |
Tenant |
The tenant for which data is displayed in the widget. You can select multiple tenants. By default, data is displayed for tenants selected in layout settings. |
Time period |
Period for which data is displayed in the widget. The default is As layout, meaning that data is displayed for the period selected for the layout. You can also specify a period for the widget in one of the following ways:
For details, see the Configuring a period subsection below. |
Settings for tables
The following table below lists the settings of a Table.
Description of parameters
Setting |
Description |
|---|---|
Name |
Name of the widget. |
Description |
Description of the widget. |
Tenant |
The tenant for which data is displayed in the widget. You can select multiple tenants. By default, data is displayed for tenants selected in layout settings. |
Time period |
Period for which data is displayed in the widget. The default is As layout, meaning that data is displayed for the period selected for the layout. You can also specify a period for the widget in one of the following ways:
For details, see the Configuring a period subsection below. |
Show data for previous period |
Enabling the display of data for the current and previous periods simultaneously. |
Color |
The color used for displaying the information:
|
Decimals |
Number of decimals to which the displayed value must be rounded off. |
Settings for Bar charts, Stacked bar charts, and Date Histograms
The table below lists the settings for the Bar chart and Date Histogram type graphs located on the tab.
Description of parameters
Setting |
Description |
|---|---|
Y-min and Y-max |
Scale of the Y axis. Negative values can be displayed on chart axes. This is due to the scaling of charts on the widget and can be fixed by setting zero as the minimum chart values instead of Auto. |
X-min and X-max |
Scale of the X axis. Negative values can be displayed on chart axes. This is due to the scaling of charts on the widget and can be fixed by setting zero as the minimum chart values instead of Auto. |
Decimals |
Number of decimals to which the displayed value must be rounded off. |
The table below lists the settings for the Bar chart, Stacked bar chart, and Date Histogram type graphs located on the tab.
Description of parameters
Setting |
Description |
|---|---|
Name |
Name of the widget. |
Description |
Description of the widget. |
Tenant |
The tenant for which data is displayed in the widget. You can select multiple tenants. By default, data is displayed for tenants selected in layout settings. |
Time period |
Period for which data is displayed in the widget. The default is As layout, meaning that data is displayed for the period selected for the layout. You can also specify a period for the widget in one of the following ways:
For details, see the Configuring a period subsection below. |
Show data for previous period |
Enables the display of data simultaneously for the current and previous periods. |
Color |
The color used for displaying the information:
|
Horizontal |
Makes the histogram horizontal instead of vertical. When this setting is enabled, all available information is fitted into the configured widget size. If the amount of data is great, you can enlarge the widget to better fit the data. |
Show total |
Shows sums total of the values. |
Show legend |
Displays a legend for the analytics. The toggle switch is turned on by default. |
Show nulls in legend |
Displays parameters with a null value in the legend for analytics. The toggle switch is turned off by default. |
Period segments length |
Duration of the segments into which you want to divide the period. Available for graphs of the Date Histogram type. |
Configuring a period
For graphs such as Pie chart, Counter, Table, Bar chart, Stacked bar chart, Date Histogram, you can configure the period for displaying data in the widget using the Period setting. By default, the data display period of the widget is the same as the data display period of the dashboard.
To configure the data display period, do one of the following:
- If necessary, change the date and time in the Time period setting in one of the following ways:
- If you want to specify an exact date, in the calendar on the left, select the start and end date of the period and click Apply.
You can select a date up to and including the current date. The date and time format depends on your browser settings. If the Date from or Date to field has a value and you have not edited the time value manually, when you select a date in the calendar, the Date from field is automatically populated with 00:00:00.000, and the Date to field with 23:59:59.999. If you have manually deleted the value in the Date from or Date to field, when you select a date in the calendar, the field is automatically populated with the current time. After you select a value in one of the fields, the focus switches to the other field. If your Date to is earlier than your Date from, this earlier value is automatically inserted into the Date from field.
- If you want to specify a relative period, select one of the available periods in the Relative period list on the right.
The period is calculated relative to the current time.
- If you want to specify a custom period, edit the value of the Date from and Date to fields.
You can enter an exact date and time in the DD.MM.YYYY HH:mm:ss.SSS format for the Russian localization and YYYY-MM-DD HH:mm:ss.SSS for the English localization or a period relative to the current time as a formula. You can also combine these methods if necessary. If you do not specify milliseconds when entering the exact date, 000 is substituted automatically. If you have edited the time in the Date from or Date to fields, picking a date in the calendar does not change the time component.
In the relative period formulas, you can use the now parameter for the current date and time and the interval parameterization language: + (only in the Date to field), -, / (rounding to the nearest), as well as time units: y (year), M (month), w (week), d (day), h (hour), m (minute), s (second). For example, you can specify the period now-5d to get data for the last five days, or now/w to get data from the beginning of the first day of the current week (00:00:00:000 UTC) to the current time (now).
The Date from field is required, and its value cannot exceed the value of the Date from field, and also cannot be earlier than 1970-01-01 (if specifying an exact date or a relative period). The Date to cannot be earlier than the Date from. If you do not specify a value in the Date from field, now is specified automatically.
KUMA stores time values in UTC, but in the user interface time is converted to the time zone of your browser. This is relevant to the relative periods: Today, Yesterday, This week, and This month. For example, if the time zone in your browser is UTC+3, and you select Today as the data display period, data will be displayed for the period from 03:00:00.000 until now, not from 00:00:00.000 until now.
If you want to take your time zone into account when selecting a relative data display period, such as Today, Yesterday, This week, or This month, you need to manually add a time offset in the Date from and Date to fields (if a value other than now is specified) by adding or subtracting the correct number of hours. For example, if your browser's time zone is UTC+3 and you want to display data for Yesterday, you need to change Date from to now-1d/d-3h and Date to to now/d-3h. If you want to display data for the Today period, you only need to change the value in the Date from field to now/d-3h.
If you need results up to 23:59:59:999 UTC of yesterday, you can use an SQL query with a filter by Timestamp or specify an exact date and time.
The bounds of the period are inclusive: for example, for the Today time range, events are displayed from the beginning (00:00:00:000 UTC) of the current day to the current time (now) inclusive, and for the Yesterday period, events are displayed from the beginning (00:00:00:000 UTC) of the previous day to 00:00:00:000 UTC of the current day. You can view the date and time of the last data update and the exact period for which the data is displayed by hovering over the period icon in the widget.
If the Show data for previous period setting is enabled for the widget, and the widget is displaying data for a relative period, the tooltip also displays the previous period. The previous period is calculated relative to the current period as start and end values of the current period minus the duration of the current period. For example, if data is updated daily and displayed for a month, but only the first 10 days of the month have passed, the previous period is taken to be the last 10 days of the previous month.
- If you want to specify an exact date, in the calendar on the left, select the start and end date of the period and click Apply.
- If you want the widget to display data for the period selected for the layout, click the Reset button. Changing the displayed period on the layout also changes the period displayed in the widget.
Displaying tenant names in widgets of the "Active list" type
If you want the names of tenants to be displayed in Active list widgets instead of tenant IDs, in correlation rules of the correlator, configure the function for populating the active list with information about the corresponding tenant.
The configuration process involves the following steps:
- Export the list of tenants.
- Create a dictionary of the Table type.
- Import the list of tenants obtained at step 1 into the dictionary created at step 2 of these instructions.
- Add a local variable with the dict function for mapping the tenant name to tenant ID to the correlation rule.
Example:
- Variable:
TenantName - Value:
dict ('<Name of the previously created dictionary with tenants>', TenantID)
- Variable:
- Add a Set action to the correlation rule, which writes the value of the previously created variable to the active list in the <key>-<value> format. As the key, specify the field of the active list (for example,
Tenant), and in the value field, specify the variable (for example,$TenantName).
When this rule triggers, the name of the tenant mapped by the dict function to the ID in the tenant dictionary is placed in the active list. When creating widgets based on active lists, the widget displays the name of the tenant instead of the tenant ID.
Page topWorking with alerts
Alerts are created when a sequence of events is received that triggers a correlation rule. You can find more information about alerts in this section.
In the Alerts section of the KUMA web interface, you can view and process the alerts registered by the application. Alerts can be filtered. When you click the alert name, a window with its details opens.
The alert date format depends on the localization language selected in the application settings. Possible date format options:
- English localization: YYYY-MM-DD.
- Russian localization: DD.MM.YYYY.
Alert life cycle
Below is the life cycle of an alert:
- KUMA creates an alert when a correlation rule is triggered. The alert is named after the correlation rule that generated it. Alert is assigned the New status.
Alerts with the New status continue to be updated with data when correlation rules are triggered. If the alert status changes, the alert is no longer updated with new events, and if the correlation rule is triggered again, a new alert is created.
- A security officer assigns the alert to an operator for investigation. The alert status changes to assigned.
- The operator performs one of the following actions:
- Close the alert as false a positive (alert status changes to closed).
- Respond to the threat and close the alert (alert status changes to closed).
- Creates an incident based on the alert (the alert status changes to In incident).
Alert overflow
Each alert and its related events cannot exceed the size of 16 MB. When this limit is reached:
- New events can no longer be linked to the alert.
- The alert has an Overflowed tag displayed in the Detected column. The same tag is displayed in the Details on alert section of the alert details window.
Overflowed alerts should be handled as soon as possible because new events are not added to overflowed alerts. You can filter out all events that could be linked to an alert after the overflow by clicking the All possible related events link.
Alert segmentation
Using the segmentation rules, the stream of correlation events of the same type can be divided to create more than one alert.
Configuring alerts table
The main part of the Alerts section shows a table containing information about registered alerts.
The following columns are displayed in the alerts table:
- Severity (
 )—shows the importance of a possible security threat: Critical
  , High
  , Medium
  , or Low
  .
. - Name—alert name.
If Overflowed tag is displayed next to the alert name, it means the alert size has reached or is about to reach the limit and should be processed as soon as possible.
- Status—current status of an alert:
- New—a new alert that hasn't been processed yet.
- Assigned—the alert has been processed and assigned to a security officer for investigation or response.
- Closed—the alert was closed. Either it was a false alert, or the security threat was eliminated.
- Escalated—an incident was generated based on this alert.
- Assigned to—the name of the security officer the alert was assigned to for investigation or response.
- Incident—name of the incident to which this alert is linked.
- First seen—the date and time when the first correlation event of the event sequence was created, triggering creation of the alert.
- Last seen—the date and time when the last correlation event of the event sequence was created, triggering creation of the alert.
- Categories—categories of alert-related assets with the highest severity. No more than three categories are displayed.
- Tenant—the name of the tenant that owns the alert.
- CII—an indication whether the related to the alert assets are the CII objects. The column is hidden from the users who do not have access to CII objects.
You can view the alert filtering tools by clicking the column headers. When filtering alerts based on a specific parameter, the corresponding header of the alerts table is highlighted in yellow.
Click the  button to configure the displayed columns of the alerts table.
In the Search field, you can enter a regular expression for searching alerts based on their related assets, users, tenants, and correlation rules. Parameters that can be used for a search:
- Assets: name, FQDN, IP address.
- Active Directory accounts: attributes displayName, SAMAccountName, and UserPrincipalName.
- Correlation rules: name.
- KUMA users who were assigned alerts: name, login, email address.
- Tenants: name.
Filtering alerts
In KUMA, you can perform alert selection by using the filtering and sorting tools in the Alerts section.
The filter settings can be saved. Existing filters can be deleted.
Page topSaving and selecting an alert filter
In KUMA, you can save changes to the alert table settings as filters. Filters are saved on the KUMA Core server and are available to all KUMA users of the tenant for which they were created.
To save the current filter settings:
- In the Alerts section of KUMA open the Filters drop-down list.
- Select Save current filter.
A field will appear for entering the name of the new filter and selecting the tenant that will own it.
- Enter a name for the filter. The name must be unique for alert filters, incident filters, and event filters.
- In the Tenant drop-down list, select the tenant that will own the filter and click Save.
The filter is saved.
To select a previously saved filter:
- In the Alerts section of KUMA open the Filters drop-down list.
- Select the relevant filter.
To select the default filter, put an asterisk to the left of the relevant filter name in the Filters drop-down list.
The filter is selected.
To reset the current filter settings,
Open the Filters drop-down list and select Clear filters.
Page topDeleting an alert filter
To delete a previously saved filter:
- In the Alerts section of KUMA open the Filters drop-down list.
- Click next to the configuration that you want to delete.
- Click OK.
The filter is deleted for all KUMA users.
Page topViewing details on an alert
To view details on an alert:
- In the application web interface window, select the Alerts section.
The alerts table is displayed.
- Click the name of the alert whose details you want to view.
This opens a window containing information about the alert.
The upper part of the alert details window contains a toolbar and shows the alert severity and the user name to which the alert is assigned. In this window, you can process the alert: change its severity, assign it to a user, and close and create an incident based on the alert.
Details on alert section
This section lets you view basic information about an alert. It contains the following data:
- Correlation rule severity is the severity of the correlation rule that triggered the creation of the alert.
- Max asset category severity—the highest severity of an asset category assigned to assets related to this alert. If multiple assets are related to the alert, the largest value is displayed.
- Linked to incident—if the alert is linked to an incident, the name and status of the alert are displayed. If the alert is not linked to an incident, the field is blank.
- First seen—the date and time when the first correlation event of the event sequence was created, triggering creation of the alert.
- Last seen—the date and time when the last correlation event of the event sequence was created, triggering creation of the alert.
- Alert ID—the unique identifier of an alert in KUMA.
- Tenant—the name of the tenant that owns the alert.
- Correlation rule—the name of the correlation rule that triggered the creation of the alert. The rule name is represented as a link that can be used to open the settings of this correlation rule.
- Overflowed is a tag meaning that the alert size has reached or will soon reach the limit of 16 MB and the alert must be handled. New events are not added to the overflowed alerts, but you can click the All possible related events link to filter all events that could be related to the alert if there were no overflow.
A quick alert overflow may mean that the corresponding correlation rule is configured incorrectly, and this leads to frequent triggers. Overflowed alerts should be handled as soon as possible to correct the correlation rule if necessary.
Related events section
This section contains a table of events related to the alert. If you click the arrow (![]() ) icon near a correlation rule, the base events from this correlation rule will be displayed. Events can be sorted by severity and time.
) icon near a correlation rule, the base events from this correlation rule will be displayed. Events can be sorted by severity and time.
Selecting an event in the table opens the details area containing information about the selected event. The details area also displays the Detailed view button, which opens a window containing information about the correlation event.
The Find in events links below correlation events and the Find in events button to the right of the section heading are used to go to alert investigation.
You can use the Download events button to download information about related events into a CSV file (in UTF-8 encoding). The file contains columns that are populated in at least one related event.
Some CSV file editors interpret the separator value (for example, \n) in the CSV file exported from KUMA as a line break, not as a separator. This may disrupt the line division of the file. If you encounter a similar issue, you may need to additionally edit the CSV file received from KUMA.
In the events table, in the event details area, in the alert window, and in the widgets, the names of assets, accounts, and services are displayed instead of the IDs as the values of the SourceAssetID, DestinationAssetID, DeviceAssetID, SourceAccountID, DestinationAccountID, and ServiceID fields. When exporting events to a file, the IDs are saved, but columns with names are added to the file. The IDs are also displayed when you point the mouse over the names of assets, accounts, or services.
Searching for fields with IDs is only possible using IDs.
Related endpoints section
This section contains a table of assets related to the alert. Asset information comes from events that are related to the alert. You can search for assets by using the Search for IP addresses or FQDN field. Assets can be sorted using the Count and Endpoint columns.
This section also displays the assets related to the alert. Clicking the name of the asset opens the Asset details window.
You can use the Download assets button to download information about related assets into a CSV file (in UTF-8 encoding). The following columns are available in the file: Count, Name, IP address, FQDN, Categories.
Related users section
This section contains a table of users related to the alert. User information comes from events that are related to the alert. You can search for users using the Search for users field. Users can be sorted by the Count, User, User principal name and Email columns.
You can use the Download users button to download information about related users into a CSV file (in UTF-8 encoding). The following columns are available in the file: Count, User, User principal name, Email, Domain, Tenant.
Change log section
This section contains entries about changes made to the alert by users. Changes are automatically logged, but it is also possible to add comments manually. Comments can be sorted by using the Time column.
If necessary, you can enter a comment for the alert in the Comment field and click Add to save it.
Changing alert names
To change the alert name:
- In the KUMA web interface window, select the Alerts section.
The alerts table is displayed.
- Click the name of the alert whose details you want to view.
This opens a window containing information about the alert.
- In the upper part of the window, click
 and in the field that opens, enter the new name of the alert. To confirm the name, press ENTER or click outside the entry field.
Alert name is changed.
Processing alerts
You can change the alert severity, assign an alert to a user, close the alert, or create an incident based on the alert.
To process an alert:
- Select required alerts using one of the methods below:
- In the Alerts section of the KUMA web interface, click the alert whose information you want to view.
The Alert window opens and provides an alert processing toolbar at the top.
- In the Alerts section of the KUMA web interface, select the check box next to the required alert. It is possible to select more than one alert.
Alerts with the closed status cannot be selected for processing.
A toolbar will appear at the bottom of the window.
- In the Alerts section of the KUMA web interface, click the alert whose information you want to view.
- If you want to change the severity of an alert, select the required value in the Severity drop-down list:
- Low
- Medium
- High
- Critical
The severity of the alert changes to the selected value.
- If you want to assign an alert to a user, select the relevant user from the Assign to drop-down list.
You can assign the alert to yourself by selecting Me.
The status of the alert will change to Assigned and the name of the selected user will be displayed in the Assign to drop-down list.
- In the Related users section, select a user and configure Active Directory response settings.
- After the related user is selected, in the Account details window that opens, click Response via Active Directory.
- In the AD command drop-down list, select one of the following values:
- Add account to group
- Remove account from group
- Reset account password
- Block account
- Click Apply.
- If required, create an incident based on the alert:
- Click Create incident.
The window for creating an incident will open. The alert name is used as the incident name.
- Update the desired incident parameters and click the Save button.
The incident is created, and the alert status is changed to Escalated. An alert can be unlinked from an incident by selecting it and clicking Unlink.
- Click Create incident.
- If you want to close the alert:
- Click Close alert.
A confirmation window opens.
- Select the reason for closing the alert:
- Responded. This means the appropriate measures were taken to eliminate the security threat.
- Incorrect data. This means the alert was a false positive and the received events do not indicate a security threat.
- Incorrect correlation rule. This means the alert was a false positive and the received events do not indicate a security threat. The correlation rule may need to be updated.
- Click OK.
The status of the alert is changed to Closed. Alerts with this status are no longer updated with new correlation events and aren't displayed in the alerts table unless the Closed check box is selected in the Status drop-down list in the alerts table. You cannot change the status of a closed alert or assign it to another user.
- Click Close alert.
Alert investigation
Alert investigation is used when you need to find more information about the threat that triggered the alert — is the threat real, what is its origin, what elements of the network environment are affected by it, how should the threat be dealt with. Studying the events related to the correlation events that triggered an alert can help you determine the course of action.
For convenience of investigating alerts, make sure that time is synchronized on all devices involved in the event life cycle (event sources, KUMA servers, client hosts) with the help of Network Time Protocol (NTP) servers.
The alert investigation mode is enabled in KUMA when you click the Find in events link in the alert window or the correlation event window. When the alert investigation mode is enabled, the events table is shown with filters automatically set to match the events from the alert or correlation event. The filters also match the time period of the alert duration or the time when the correlation event was registered. You can change these filters to find other events and learn more about the processes related to the threat.
An additional  drop-down list becomes available in alert investigation mode:
- All events—view all events.
- Related to alert (selected by default)—view only events related to the alert.
When filtering events related to an alert, there are limitations on the complexity of SQL search queries.
You can manually assign an event of any type except the correlation event to an alert. Only events that are not related to the alert can be linked to it.
You can create and save event filters in alert investigation mode. When using this filter in normal mode, all events that match the filter criteria are selected regardless of whether or not they are related to the alert that was selected for alert investigation.
To link an event to an alert:
- In the Alerts section of the KUMA web interface, click the alert that you want to link to the event.
The Alert window opens.
- In the Related events section, click the Find in events button.
The events table is opened and displayed with active date and time filters matching the date and time of events linked to the alert. The columns show the settings used by the correlation rule to generate the alert. The Link to alert column is also added to the events table showing the events linked to the alert.
- In the drop-down list select All events.
- If necessary, modify the filters to find the event that you need to link to the alert.
- Select the relevant event and click the Link to alert button in the lower part of the event details area.
The event will be linked to the alert. You can unlink this event from the alert by clicking in the Unlink from alert detailed view.
When an event is linked to or unlinked from an alert, a corresponding entry is added to the Change log section in the Alert window. You can click the link in this entry to open the details area and unlink or link the event to the alert by clicking the corresponding button.
Page topRetention period for alerts and incidents
Alerts and incidents are stored in KUMA for a year by default. This period can be changed by editing the application startup parameters in the file /usr/lib/systemd/system/kuma-core.service on the KUMA Core server.
To change the retention period for alerts and incidents:
- Log in to the OS of the server where the KUMA Core is installed.
- In the /usr/lib/systemd/system/kuma-core.service file, edit the following string by inserting the necessary number of days:
ExecStart=/opt/kaspersky/kuma/kuma core --alerts.retention <number of days to store alerts and incidents> --external :7220 --internal :7210 --mongo mongodb://localhost:27017 - Restart KUMA by running the following commands in sequence:
systemctl daemon-reloadsystemctl restart kuma-core
The retention period for alerts and incidents will be changed.
Page topAlert notifications
Standard KUMA notifications are sent by email when alerts are generated and assigned. You can configure delivery of alert generation notifications based on a custom email template.
To configure delivery of alert generation notifications based on a custom template:
- In the KUMA web interface, open Settings → Alerts → Notification rules.
- Select the tenant for which you want to create a notification rule:
- If the tenant already has notification rules, select it in the table.
- If the tenant has no notification rules, click Add tenant and select the relevant tenant from the Tenant drop-down list.
- Under Notification rules, click Add and specify the notification rule settings:
- Name (required)—specify the notification rule name in this field.
- Recipient emails (required)—in this settings block, you can use the Email button to add the email addresses to which you need to send notifications about alert generation. Addresses are added one at a time.
Cyrillic domains are not supported. For example, a notification cannot be sent to
login@domain.us. - Correlation rules (required)—in this settings block, you must select one or more correlation rules that, when triggered, will cause notification sending.
The window displays a tree structure representing the correlation rules from the shared tenant and the user-selected tenant. To select a rule, select the check box next to it. You can select the check box next to a folder to select all correlation rules in that folder and its subfolders.
- Template (required)—in this settings block, you must select an email template that will be used to create the notifications. To select a template, click the
 icon, select the required template in the opened window, and click Save.
You can create a template by clicking the plus icon or edit the selected template by clicking the pencil icon.
- Disabled—by selecting this check box, you can disable the notification rule.
- Click Save.
The notification rule is created. When an alert is created based on the selected correlation rules, notifications created based on custom email templates will be sent to the specified email addresses. Standard KUMA notifications about the same event will not be sent to the specified addresses.
To disable notification rules for a tenant:
- In the KUMA web interface, open Settings → Alerts → Notification rules and select the tenant whose notification rules you want to disable.
- Select the Disabled check box.
- Click Save.
The notification rules of the selected tenant are disabled.
For disabled notification rules, the correctness of the specified parameters is not checked; at the same time, notifications cannot be enabled for a tenant if incorrect rules exist. If you create or edit individual notification rules with tenant notification rules disabled, before enabling tenant notification rules, it is recommended to: 1) disable all individual notification rules, 2) enable tenant notification rules, 3) enable individual notification rules one by one.
Page topWorking with incidents
In the Incidents section of the KUMA web interface, you can create, view and process incidents. You can also filter incidents if needed. Clicking the name of an incident opens a window containing information about the incident.
Incidents can be exported to NCIRCC.
The retention period for incidents is one year, but this setting can be changed.
The date format of the incident depends on the localization language selected in the application settings. Possible date format options:
- English localization: YYYY-MM-DD.
- Russian localization: DD.MM.YYYY.
About the incidents table
The main part of the Incidents section shows a table containing information about registered incidents. If required, you can change the set of columns and the order in which they are displayed in the table.
How to customize the incidents table
- Click the gear () icon in the upper-right corner of the incidents table.
The table customization window opens.
- Select the check boxes opposite the settings that you want to view in the table.
When you select a check box, the events table is updated and a new column is added. When a check box is cleared, the column disappears.
You can search for table parameters using the Search field.
By pressing the Default button, the following columns are selected for display:
- Name.
- Threat duration.
- Assigned.
- Created.
- Tenant.
- Status.
- Hits count.
- Severity.
- Affected asset categories.
- Change the display order of the columns as needed by dragging the column headings.
- If you want to sort the incidents by a specific column, click its title and select one of the available options in the drop-down list: Ascending or Descending.
- To filter incidents by a specific parameter, click on the column header and select the required filters from the drop-down list. The set of filters available in the drop-down list depends on the selected column.
- To remove filters, click the relevant column heading and select Clear filter.
Available columns of the incidents table:
- Name—the name of the incident. Names of incidents received from NCIRCC have the ALRT* prefix.
- Threat duration—the time span during which the incident occurred (the time between the first and the last event related to the incident).
- Assigned to—the name of the security officer to whom the incident was assigned for investigation or response.
- Created—the date and time when the incident was created. This column allows you to filter incidents by the time they were created.
- The following preset periods are available: Today, Yesterday, This week, Previous week.
- If required, you can set an arbitrary period by using the calendar that opens when you select Before date, After date, or In period.
- Tenant—the name of the tenant that owns the incident.
- Status—current status of the incident:
- Opened—new incident that has not been processed yet.
- Assigned—the incident has been processed and assigned to a security officer for investigation or response.
- Closed—the incident is closed; the security threat has been resolved.
- Alerts number—the number of alerts included in the incident. Only the alerts of those tenants to which you have access are taken into account.
- Severity shows how important a possible security threat is: Critical , High , Medium , Low .
- Affected asset categories—categories of alert-related assets with the highest severity. No more than three categories are displayed.
- Updated—the date and time of the last change made in the incident.
- First event and Last event—dates and times of the first and last events in the incident.
- Incident category and Incident type—category and type of threat assigned to the incident.
- Export to NCIRCC—the status of incident data export to NCIRCC:
- Not exported—the data was not forwarded to NCIRCC.
- Export failed—an attempt to forward data to NCIRCC ended with an error, and the data was not transmitted.
- Exported—data on the incident has been successfully transmitted to NCIRCC.
- Branch—data on the specific node where the incident was created. Incidents of your node are displayed by default. This column is displayed only when hierarchy mode is enabled.
- CII—an indication of whether the incident involves assets that are CII objects. The column is hidden from the users who do not have access to CII objects.
In the Search field, you can enter a regular expression for searching incidents based on their related assets, users, tenants, and correlation rules. Parameters that can be used for a search:
- Assets: name, FQDN, IP address.
- Active Directory accounts: attributes displayName, SAMAccountName, and UserPrincipalName.
- Correlation rules: name.
- KUMA users who were assigned alerts: name, login, email address.
- Tenants: name.
When filtering incidents based on a specific parameter, the corresponding column in the incidents table is highlighted in yellow.
Page topSaving and selecting incident filter configuration
In KUMA, you can save changes to incident table settings as filters. Filter configurations are saved on the KUMA Core server and are available to all KUMA users of the tenant for which they were created.
To save the current filter configuration settings:
- In the Incidents section of KUMA, open the Select filter drop-down list.
- Select Save current filter.
A window will open for entering the name of the new filter and selecting the tenant that will own the filter.
- Enter a name for the filter configuration. The name must be unique for alert filters, incident filters, and event filters.
- In the Tenant drop-down list, select the tenant that will own the filter and click Save.
The filter configuration is now saved.
To select a previously saved filter configuration:
- In the Incidents section of KUMA, open the Select filter drop-down list.
- Select the configuration you want.
The filter configuration is now active.
You can select the default filter by putting an asterisk to the left of the required filter configuration name in the Filters drop-down list.
To reset the current filter settings,
open the Filters drop-down and select Clear filter.
Page topDeleting incident filter configurations
To delete a previously saved filter configuration:
- In the Incidents section of KUMA, open the Filters drop-down list.
- Click the button next to the configuration you want to delete.
- Click OK.
The filter configuration is now deleted for all KUMA users.
Page topViewing information about an incident
To view information about an incident:
- In the application web interface window, select the Incidents section.
- Select the incident whose information you want to view.
This opens a window containing information about the incident.
Some incident parameters are editable. Incidents automatically created in KUMA based on a notification from NCIRCC have the ALRT* prefix.
In the upper part of the Incident details window, there is a toolbar and the name of the user to whom the incident is assigned. The window sections are displayed as tabs. You can click a tab to move to the relevant section. In this window, you can process the incident: assign it to a user, combine it with another incident, or close it.
The Description section contains the following data:
- Created—the date and time when the incident was created.
- Name—the name of the incident.
You can change the name of an incident by entering a new name in the field and clicking Save The name must contain 1 to 128 Unicode characters.
- Tenant—the name of the tenant that owns the incident.
The tenant can be changed by selecting the required tenant from the drop-down list and clicking Save
- Status—current status of the incident:
- Opened—new incident that has not been processed yet.
- Assigned—the incident has been processed and assigned to a security officer for investigation or response.
- Closed—the incident is closed; the security threat has been resolved.
- Severity—the severity of the threat posed by the incident. Possible values:
- Critical
- High
- Medium
- Low
Severity can be changed by selecting the required value from the drop-down list and clicking Save.
- Affected asset categories—the assigned categories of assets associated with the incident.
- First event time and Last event time—dates and times of the first and last events in the incident.
- Type and Category—type and category of the threat assigned to the incident. You can change these values by selecting the relevant value from the drop-down list and clicking Save.
- Export to NCIRCC—information on whether or not this incident was exported to NCIRCC.
- Description—description of the incident.
To change the description, edit the text in the field and click Save. The description can contain no more than 256 Unicode characters.
- Related tenants—tenants associated with incident-related alerts, assets, and users.
- Available tenants—tenants whose alerts can be linked to the incident automatically.
The list of available tenants can be changed by checking the boxes next to the required tenants in the drop-down list and clicking Save.
The Related alerts section contains a table of alerts related to the incident. When you click on the alert name, a window opens with detailed information about this alert.
The Related endpoints and Related users sections contain tables with data on assets and users related to the incident. This information comes from alerts that are related to the incident.
You can add data to the tables in the Related alerts, Related endpoints and Related users sections by clicking the Link button in the appropriate section and selecting the object to be linked to the incident in the opened window. If required, you can unlink objects from the incident. To do this, select the objects as required, click Unlink in the section to which they belong, and save the changes. If objects were automatically added to the incident, they cannot be unlinked until the alert mentioning those objects is unlinked. The set of the fields in the tables can be changed by clicking the gear (![]() ) button in the relevant section. You can search the data in the tables of these sections using the Search fields.
) button in the relevant section. You can search the data in the tables of these sections using the Search fields.
The Change log section contains a record of the changes you and your users made to the incident. Changes are automatically logged, but it is also possible to add comments manually.
In the NCIRCC integration section, you can monitor the incident status in NCIRCC. In this section, you can also export incident data to NCIRCC, send files to NCIRCC, and exchange messages with NCIRCC experts.
If incident settings have been modified on the NCIRCC side, a corresponding notification is displayed in the incident window in KUMA. In this case, for the settings whose values were modified, the window displays the values from KUMA and the values from NCIRCC.
Page topIncident creation
To create an incident:
- Open the KUMA web interface and select the Incidents section.
- Click Create incident.
The window for creating an incident will open.
- Fill in the mandatory parameters of the incident:
- In the Name field enter the name of the incident. The name must contain 1 to 128 Unicode characters.
- In the Tenant drop-down list, select the tenant that owns the created incident.
- If necessary, provide other parameters for the incident:
- In the Severity drop-down list, select the severity of the incident. Available options: Low, Medium, High, Critical.
- In the First event time and Last event time fields, specify the time range in which events related to the incident were received.
- In the Category and Type drop-down lists, select the category and type of the incident. The available incident types depend on the selected category.
- Add the incident Description. The description can contain no more than 256 Unicode characters.
- In the Available tenants drop-down list, select the tenants whose alerts can be linked to the incident automatically.
- In the Related alerts section, add alerts related to the incident.
- In the Related endpoints section, add assets related to the incident.
- In the Related users section, add users related to the incident.
- Add a Comment to the incident.
- Click Save.
The incident has been created.
Page topIncident processing
For convenience of processing incidents, make sure that time is synchronized on all devices involved in the event life cycle (event sources, KUMA servers, client hosts) with the help of Network Time Protocol (NTP) servers.
You can assign an incident to a user, aggregate it with other incidents, or close it.
To process an incident:
- Select required incidents using one of the methods below:
- In the Incidents section of the KUMA web interface, click on the incident to be processed.
The incident window will open, displaying a toolbar on the top.
- In the Incidents section of the KUMA web console, select the check box next to the required incidents.
A toolbar will appear at the bottom of the window.
- In the Incidents section of the KUMA web interface, click on the incident to be processed.
- In the Assign to drop-down list, select the user to whom you want to assign the incident.
You can assign the incident to yourself by selecting Me.
The status of the incident changes to assigned and the name of the selected user is displayed in the Assign to drop-down list.
- In the Related users section, select a user and configure Active Directory response settings.
- After the related user is selected, in the Account details window that opens, click Response via Active Directory.
- In the AD command drop-down list, select one of the following values:
- Add account to group
- Remove account from group
- Reset account password
- Block account
- Click Apply.
- If required, edit the incident parameters.
- After investigating, close the incident:
- Click Close.
A confirmation window opens.
- Select the reason for closing the incident:
- confirmed. This means the incident was valid and appropriate measures were taken to eliminate the security threat.
- not confirmed. This means the incident was a false positive and the received events do not indicate a security threat.
- Click Close.
The Closed status will be assigned to the incident. Incidents with this status cannot be edited, and they are displayed in the incidents table only if you selected the Closed check box in the Status drop-down list when filtering the table. You cannot change the status of a closed incident or assign it to another user, but you can aggregate it with another incident.
- Click Close.
- If requited, aggregate the selected incidents with another incident:
- Click Merge. In the opened window, select the incident in which all data from the selected incidents should be placed.
- Confirm your selection by clicking Merge.
The incidents will be aggregated.
The incident has been processed.
Page topChanging incidents
To change the parameters of an incident:
- In the Incidents section of the KUMA web interface, click on the incident you want to modify.
The Incident window opens.
- Make the necessary changes to the parameters. All incident parameters that can be set when creating it are available for editing.
- Click Save.
The incident will be modified.
Page topAutomatic linking of alerts to incidents
In KUMA, you can configure automatic linking of generated alerts to existing incidents if alerts and incidents have related assets or users in common. If this setting is enabled, when creating an alert the application searches for incidents falling into a specified time interval that includes assets or users from the alert. In addition, the application checks whether the generated alert pertains to the tenants specified in the incidents' Available tenants parameter. If a matching incident is found, the application links the generated alert to the incident it found.
To set up automatic linking of alerts to incidents:
- In the KUMA web interface, open Settings → Incidents → Automatic linking of alerts to incidents.
- Select the Enable check box in the Link by assets and/or Link by accounts parameter blocks depending on the types of connections between incidents and alerts that you are looking for.
- Define the Incidents must not be older than value for the parameters that you want to use when searching links. The generated alerts will be compared with incidents no older than the specified interval.
Automatic linking of alerts to incidents is configured.
To disable automatic linking of alerts to incidents,
In the KUMA web interface, under Settings → Incidents → Automatic linking of alerts to incidents, select the Disabled check box.
Page topCategories and types of incidents
For your convenience, you can assign categories and types. If an incident has been assigned a NCIRCC category, it can be exported to NCIRCC.
Categories and types of incidents that can be exported to NCIRCC
The categories of incidents can be viewed or changed under Settings → Incidents → Incident types, in which they are displayed as a table. By clicking on the column headers, you can change the table sorting options. The resource table contains the following columns:
- Category—a common characteristic of an incident or cyberattack. The table can be filtered by the values in this column.
- Type—the class of the incident or cyberattack.
- NCIRCC category—incident type according to NCIRCC nomenclature. Incidents that have been assigned custom types and categories cannot be exported to NCIRCC. The table can be filtered by the values in this column.
- Vulnerability—specifies whether the incident type indicates a vulnerability.
- Created—the date the incident type was created.
- Updated—the date the incident type was modified.
To add an incident type:
- In the KUMA web interface, under Settings → Incidents → Incident types, click Add.
The incident type creation window will open.
- Fill in the Type and Category fields.
- If the created incident type matches the NCIRCC nomenclature, select the NCIRCC category check box.
- If the incident type indicates a vulnerability, check Vulnerability.
- Click Save.
The incident type has been created.
Page topInteraction with NCIRCC
In KUMA, you can interact with the National Computer Incident Response & Coordination Center (hereinafter NCIRCC) in the following ways:
- Export incidents to NCIRCC.
- Supplement the exported incident with data when requested by NCIRCC.
- Send files to NCIRCC.
- Exchange messages with NCIRCC experts.
- View the changes made by NCIRCC to the parameters of exported incidents.
- Process incidents with the ALRT* prefix that are automatically created in KUMA based on a notification from NCIRCC.
Data in KUMA and NCIRCC is synchronized every 5-10 minutes.
Conditions for NCIRCC interaction
To interact with NCIRCC, the following conditions must be met:
- The application license includes the GosSOPKA module.
- NCIRCC integration is configured.
- The Can interact with NCIRCC check box is selected in the settings of the users whose responsibilities include interaction with NCIRCC.
NCIRCC interaction workflow
In KUMA, the process of sending incidents to NCIRCC to be processed consists of the following stages:
- Creating an incident and checking it for compliance with NCIRCC requirements
You can create an incident or get it from a child KUMA node. Before sending data to the NCIRCC, make sure that the incident category meets NCIRCC requirements.
- Exporting the incident to NCIRCC
If the incident is successfully exported to NCIRCC, its Export to NCIRCC setting is set to Exported. In the lower part of the incident window, a chat with NCIRCC experts becomes available.
At NCIRCC, the incident received from you is assigned a registration number and status. This information is displayed in the incident window in the NCIRCC integration section and in automatic chat messages.
If all the necessary data is provided to NCIRCC, the incident is assigned the Under examination status. The settings of the incident having this status can be edited, but the updated information cannot be sent from KUMA to NCIRCC. You can view the difference between the incident data in KUMA and in NCIRCC.
- Supplementing incident data
If NCIRCC experts do not have enough information to process an incident, they can assign it the More information required status. In KUMA, this status is displayed in the incident window in the NCIRCC integration section. Users are notified about the status change.
If necessary, you can attach a file to the incident.
When the data is supplemented, the incident is re-exported to NCIRCC with earlier information updated. The incidents in the child nodes cannot be modified from the parent KUMA node. It must be done by employees of the child KUMA nodes.
If the incident is successfully supplemented with data, it is assigned the Under examination status.
- Completing incident processing
After the NCIRCC experts process the incident, the NCIRCC status is changed to Decision made. In KUMA, this status is displayed in the incident window in the NCIRCC integration section.
Upon receiving this status, the incident is automatically closed in KUMA. Interaction with NCIRCC on this incident by means of KUMA becomes impossible.
Exporting data to NCIRCC
To export an incident to NCIRCC:
- In the Incidents section of the KUMA web interface, open the incident you want to export.
- Click the Export to NCIRCC button in the lower part of the window.
- If you have not specified the category and type of incident, specify this information in the window that opens and click the Export to NCIRCC button.
This opens the export settings window.
If you specified the category and type of the incident in the incident card, you need to save the incident before exporting it to NCIRCC. - Specify the settings on the Basic tab of the Export to NCIRCC window:
- On the Basic settings tab, fill in the required fields:
Company name, Asset owner, Incident category, Incident type, Description, value of the TLP protocol, Incident creation date, Status, Affected system name, Affected system category, Affected system function, Location.
- If you want to submit information about a personal data leak, select the Information about PD leakage check box, which enables the Information about PD leakage tab. This check box is cleared by default.
The Operator name, INN, and Operator address fields are populated automatically with the values specified when setting up the NCIRCC integration. However, the field values can be edited when preparing the data export to NCIRCC.
Personal data leak fields are available for the Notification about a computer incident category for the following notification types:
- Malware infection
- Compromised user account
- Unauthorized disclosure of information
- Successful exploitation of a vulnerability
- Event is not related to a computer attack
- Product info (required)—this table becomes available if you selected Notification about a detected vulnerability as the incident category.
You can use the Add new element button to add a string to the table. In the Name column, you must indicate the name of the application (for example,
MS Office). Specify the application version in the Version column (for example,2.4). - Vulnerability ID—if necessary, specify the identifier of the detected vulnerability. For example,
CVE-2020-1231.This field becomes available if you selected Notification about a detected vulnerability as the incident category.
- Product category—if necessary, specify the name and version of the vulnerable product. For example,
Microsoft operating systems and their components.This field becomes available if you selected Notification about a detected vulnerability as the incident category.
- If you want to submit information about a personal data leak, select the Information about PD leakage check box, which enables the Information about PD leakage tab. This check box is cleared by default.
- If required, define the settings on the Advanced tab of the Export to NCIRCC window.
The available settings on the tab depend on the selected category and type of incident:
- Detection tool—specify the name of the product that was used to register the incident. For example,
KUMA 1.5. - Assistance required—select this check box if you need help from GosSOPKA employees.
- Incident end time—specify the date and time when the critical information infrastructure (CII object) was restored to normal operation after a computer incident, computer attack was ended, or a vulnerability was fixed.
- Availability impact—assess the degree of impact that the incident had on system availability:
- High
- Low
- None
- Integrity impact—assess the degree of impact that the incident had on system integrity:
- High
- Low
- None
- Confidentiality impact—assess the degree of impact that the incident had on data confidentiality:
- High
- Low
- None
- Custom impact—specify other significant impacts from the incident.
- City—indicate the city where your organization is located.
- Detection tool—specify the name of the product that was used to register the incident. For example,
- If assets are attached to the incident, you can specify their settings on the Technical details tab.
This tab becomes active only if you select the Affected system has Internet connection check box.
If you need to edit or supplement the information previously specified on the Technical details tab, you should do this in your GosSOPKA account, even if NCIRCC experts requested additional information from you, and you can edit the exported incident.
The categories of the listed assets must match the category of the affected CII in your system.
- Click Export.
- Confirm the export.
Information about the incident is submitted to NCIRCC, and the Export to NCIRCC incident setting is changed to Exported. At NCIRCC, the incident received from you is assigned a registration number and status. This information is displayed in the incident window in the NCIRCC integration section.
It is possible to change the data in the exported incident only if the NCIRCC experts requested additional information from you. If no additional information was requested, but you need to update the exported incident, you should do it in your GosSOPKA dashboard.
After the incident is successfully exported, the Compare KUMA incident to NCIRCC data button is displayed at the bottom of the screen. When you click this button, a window opens, where the differences in the incident data between KUMA and NCIRCC are highlighted.
Page topGetting incidents from NCIRCC
After upgrading to version 3.4.1, at each startup, KUMA Core sends a request to get new incident cards to the address specified in the URL field in KUMA's NCIRCC integration settings, and then continues sending requests every 10 minutes. If a new incident appears in the NCIRCC user account dashboard, KUMA registers the incident with the ALRT* prefix and further interaction with NCIRCC is carried out in context of the created incident.
Interaction with NCIRCC is available even if the incident in KUMA has the Closed status: you can edit the value of the NCIRCC status field and chat with NCIRCC.
Notifications about messages from NCIRCC are sent to the email addresses of users with the General administrator role.
Fields of a new incident are populated as shown in the following table.
Field values of an incident received from NCIRCC.
Field name |
Value |
|---|---|
Created by |
When an incident is created in KUMA, creation date and time are automatically specified. Example: 2024-10-08 05:32:39 |
Name |
ID or registration number of the incident (message) in GosSOPKA. Example: ALRT-xx-xx-xxx |
Tenant |
The tenant in which incidents received from NCIRCC must be created. By default, all incidents are created in the Main tenant. You can change the incident creation tenant in the NCIRCC integration settings. Example: Main. |
Status |
Initial status of the KUMA incident. Example: Open. |
Severity |
Degree of significance of the potential security threat. Default: Critical. Possible values: Critical, High, Medium, Low. |
Affected asset categories |
Empty. This value can be filled in manually. |
First event time |
Empty. This value can be filled in manually. |
Last event time |
Empty. This value can be filled in manually. |
Description |
The value from the event_description field of the message sent by NCIRCC. Can be edited. Example: message from NCIRCC. |
Related tenants |
Same as the Tenant field. Example: Main. |
Available tenants |
Same as the Tenant field. Example: Main. |
Related alerts |
Empty. This value can be filled in manually. |
Related endpoints |
Empty. This value can be filled in manually. |
Related users |
Empty. This value can be filled in manually. |
Change log |
Empty. This value can be filled in manually. |
NCIRCC integration section |
|
Category |
Category of the message card. Dictionary value. Possible values: Message from NCIRCC. This field is not editable. |
Type |
Type of the information security event. Value from the dictionary. Possible values: Infected resource, Source of malware email messages, Source of malware modules, Malware C&C center, Element of malware infrastrucure, Resource slowdown, Source of exploit, Source of user account compromise, Participant of network traffic capture, Source of unauthorized access, Source of unauthorized modification of information, Source of spam, Publication of information illegal in the Russian Federation, Hosting of a phishing resource, Unauthorized content, Participant of DDoS attack, Compromised user account, Network Scan Source, Participant of fraud, Source of social engineering threat, Vulnerable resource, Suspected phishing resource, Threat of personal data compromise, Threat of computer attack. This field is not editable.
|
Status of export to NCIRCC |
Imported from NCIRCC. This field is not editable. |
NCIRCC message processing progress section |
|
NCIRCC status |
NCIRCC message processing status. Value from the dictionary. This field is editable. Possible values: New, In progress, Decision made, Interaction completed, Archived. |
Result |
Result of the decision made. Value from the dictionary. This field is editable. Possible values: Measures taken, Information taken into account, Information not confirmed. |
Chat with NCIRCC section |
|
UUID |
Unique ID of the NCIRCC message. |
Company |
Short name of the GosSOPKA subject organization. |
Category |
Category of the message card. Dictionary value. Example: message from NCIRCC. |
Type |
Type of the information security event. Value from the dictionary. Example: infected resource. |
Creation time |
Date and time when the NCIRCC message was registered. Follows the ISO 8601 standard. UTC time is used. |
Time of detection |
Date and time when the incident was detected. Follows the ISO 8601 standard. UTC time is used. |
Incident end time |
Date and time when the incident ended. Follows the ISO 8601 standard. UTC time is used. |
Updated |
Date and time when the message card was last updated. Follows the ISO 8601 standard. UTC time is used. |
Event description |
Brief description of the information security event. Up to 5000 Unicode characters. |
Owner name |
Owner of the information resource. Up to 5000 Unicode characters. |
Incident ID in NCIRCC |
Registration number of the message. Example: ALRT-20-12-2914. |
TLP |
TLP limitation marker. Dictionary value. Possible values: TLP:WHITE, TLP:GREEN, TLP:AMBER, TLP:RED. |
Technical details section |
|
The Technical details group of fields is displayed with the field values obtained from the message. Which NCIRCC message fields are present in the Technical details group depends on the Information security event type, and the set of fields may differ depending on the incident. Pay close attention to the field values in your NCIRCC account. Values are not editable. |
|
Supplementing incident data on request
If NCIRCC experts need additional information about the incident, they may request it from you. In this case, the incident status changes to More information required in the NCIRCC integration section of the incident window. The following KUMA users receive email notifications about the status change: the user to whom the incident is assigned and the user who exported the incident to NCIRCC.
If an incident is assigned the More information required status in NCIRCC, the following actions are also available for this incident in KUMA:
- Upload files to NCIRCC.
- Re-export the incident data to NCIRCC with updates or additions to the previously provided information. This action completes supplementing the incident data.
Sending files to NCIRCC
You can attach a file to an incident if the incident has one of the following NCIRCC statuses: New, In progress, More information required, Decision made. The file will be available both in NCIRCC and in the KUMA web interface.
For a hierarchical deployment of KUMA, files can only be uploaded to NCIRCC from the parent KUMA node. At the same time, log entries about the file download are visible in the child nodes of KUMA.
In the incident change log, messages about the files uploaded to NCIRCC by KUMA users are added. Messages about adding files by NCIRCC are not added to the log.
To attach a file to an incident:
- In the Incidents section of the KUMA web interface, open the incident you want to attach a file to.
- In the NCIRCC integration section of the incident window, select the File tab and click the Send file to NCIRCC button.
The file selection window opens.
- Select the required file no larger than 50 MB and confirm your selection.
The file is attached to the incident and available for both NCIRCC experts and KUMA users.
Data in KUMA and NCIRCC is synchronized every 5-10 minutes.
Page topCommunication with NCIRCC experts
After the incident is successfully exported to NCIRCC, a chat with NCIRCC experts becomes available at the bottom of the screen. You can exchange messages since successful incident export to NCIRCC until it is closed in NCIRCC.
The chat window with the message history and the field for entering new messages is available on the Chat tab in the NCIRCC integration section of the incident window.
Data in KUMA and NCIRCC is synchronized every 5-10 minutes.
Supported categories and types of NCIRCC incidents
The table below lists the categories and types of incidents that can be exported to NCIRCC:
Incident category |
Incident type |
Computer incident notification
|
Slowed operation of the resource due to a DDoS attack |
Malware infection |
|
Network traffic interception |
|
Compromised user account |
|
Unauthorized data modification |
|
Unauthorized disclosure of information |
|
Publication of illegal information on the resource |
|
Successful exploitation of a vulnerability |
|
Event is not related to a computer attack |
|
Use of a controlled resource for attacks |
|
Notification about a computer attack |
DDoS attack |
Unsuccessful authorization attempts |
|
Malware injection attempts |
|
Attempts to exploit a vulnerability |
|
Publication of fraudulent information |
|
Network scanning |
|
Social engineering |
|
Notification about a detected vulnerability |
Vulnerable resource |
Notifications about the incident status change in NCIRCC
In the event of certain changes in the status or data of an incident at NCIRCC, KUMA users receive the following notifications by email:
- Notification about receiving a message from NCIRCC.
- Additional data request notification.
- Notification about the incident status change in NCIRCC.
- Notification about automatic closure of an incident.
The following users receive notifications:
- The user to whom the incident was assigned.
- The user who exported the incident to NCIRCC.
Retroscan
In normal mode, the correlator handles only events coming from collectors in real time. Retroscan lets you apply correlation rules to historical events if you want to debug correlation rules or analyze historical data.
To test a rule, you do not need to replay the incident in real time, instead you can run the rule in Retroscan mode to process historical events which include the incident of interest.
You can use a search query to define a list of historical events to retrospectively scan, you can also specify a search period and the storage that you want to search for events. You can configure a task to have alerts generated and response rules applied during the retroscan of events.
Retroscanned events are not enriched with data from CyberTrace or the Kaspersky Threat Intelligence Portal.
Active lists are updated during retroscanning.
A retroscan cannot be performed on selections of events obtained using SQL queries that group data and contain arithmetic expressions.
To use Retroscan:
- In the Events section of the KUMA web interface, create the required event selection:
- Select the storage.
- Configure search expression using the constructor or search query.
- Select the required period.
- Open the
 drop-down list and choose Retroscan.
The Retroscan window opens.
- In the Correlator drop-down list, select the Correlator to feed selected events to.
- In the Correlation rules drop-down list, select the Correlation rules that must be used when processing events. If no rules are selected at this step, the scan is performed with all correlation rules applied.
- If you want responses to be executed when processing events, turn on the Execute responses toggle switch.
- If you want alerts to be generated during event processing, turn on the Create alerts toggle switch.
- Click the Create task button.
The retroscan task is created in the Task manager section.
To view scan results, in the Task manager section of the KUMA web interface, click the task you created and select Go to Events from the drop-down list.
This opens a new browser tab containing a table of events that were processed during the retroscan and the aggregation and correlation events that were created during event processing. Correlation events generated by the retroscan have an additional ReplayID field that stores the unique ID of the retrospective scan run. An analyst can restart the retroscan from the context menu of the task. New correlation events will have a different ReplayID.
Depending on your browser settings, you may be prompted for confirmation before your browser can open the new tab containing the retroscan results. For more details, please refer to the documentation for your specific browser.
Page top