Contents
Logging in to the program web interface
To log in to the application web interface:
- Enter the following address in your browser:
https://<IP address or FQDN of KUMA Core server>:7220The web interface authorization page will open and prompt you to enter your login and password.
- Enter the login of your account in the Login field.
- Enter the password for the specified account in the Password field.
- Click the Login button.
The main window of the application web interface opens.
In multitenancy mode, a user who is logging in to the application web interface for the first time will find the data only for those tenants that were selected for the user when their user account was created.
To log out of the application web interface,
open the KUMA web interface, click your user account name in the bottom-left corner of the window, and click the Logout button in the opened menu.
Page topService monitoring
You can use the following functionality to monitor the status of all services except cold storage and agent:
- Viewing Victoria Metrics alerts
Users with the General administrator role can configure thresholds for KUMA services, and if a specified threshold is exceeded, the following changes take place:
- KUMA logs an audit event: VictoriaMetrics alert registered for service.
- KUMA sends a notification email message to the General administrator.
- Services are displayed in the Active services section with a yellow status. If you hover over the status icon, the error message will be displayed.
- View VictoriaMetrics metrics if the user has a role with metrics access rights.
The following examples show how to monitor service status.
- If the collector service has a yellow status in the Active services section and you see the Enrichment errors increasing message, you can:
- Go to Metrics → <service type> → <service name> → Enrichment → Errors section of KUMA for the service with the yellow status, find out which enrichment is causing errors, and view the chart to find out when the problem started and how it evolved.
- The likely cause of the enrichment errors may be DNS server unavailability or CyberTrace enrichment errors, therefore you can check your DNS or CyberTrace connection settings.
- If the collector service has a yellow status in the Active services section and you see the Output Event Loss increasing message, you can:
- Go to the Metrics → <service type> → <service name> → IO → Output Event Loss section of KUMA for the service with the yellow status and view the chart to find out when the problem started and how it evolved.
- The likely cause of the enrichment errors may be a buffer overflow or unavailability of destination, therefore you can check the availability and the connection of the destination or find out why the buffer capacity is exceeded.
Configuring service monitoring
To configure the services:
- In the KUMA web console, go to the Settings → Service monitoring section.
- Specify the values of monitoring parameters for the services.
Service monitoring does not apply to cold storage.
If you specify an invalid value that does not fit the range or format, the value is reset to the previously configured value.
- Click Save.
After saving the parameters, KUMA registers an audit event: Monitoring thresholds changed for the service.
KUMA monitors the status of services in accordance with the specified parameters.
In the Active services section, you can filter services by statuses or enter a word from the error text, for example, "QPS" or "buffer", in the search field and press ENTER. This results in a list of services with errors. Special characters ", },{, are not allowed in the search string and will produce irrelevant results.
Disabling service monitoring
To disable service monitoring:
- In the KUMA web console, go to the Settings → Service monitoring section.
- If you want to disable service monitoring only for collectors, in the Service monitoring. Thresholds setting window, under Collectors, select the Disable connector errors check box.
This disables only the analysis of the Connector errors metric for collectors.
- If you want to disable monitoring for all services, in the Service monitoring. Thresholds setting window, select the Disable check box.
KUMA service monitoring is disabled, and services do not get the yellow status.
Viewing KUMA metrics
To monitor the performance of its components, the event stream, and the correlation context, KUMA collects and stores a large number of parameters. The VictoriaMetrics time series database is used to collect, store and analyze the parameters. The collected metrics are visualized using Grafana. Dashboards that visualize key performance parameters of various KUMA components can be found in the KUMA → Metrics section.
The KUMA Core service configures VictoriaMetrics and Grafana automatically, no user action is required.
The collected metrics are visualized using the Grafana solution. The RPM package of the 'kuma-core' service generates the Grafana configuration and creates a separate dashboard for visualizing the metrics of each service. Graphs in the Metrics section appear with a delay of approximately 1.5 minutes.
For full information about the metrics, you can refer to the Metrics section of the KUMA web interface. Selecting this section opens the Grafana portal that is deployed as part of Core installation and is updated automatically. If the Metrics section shows "core:<port number>", this means that KUMA is deployed in a high availability configuration and the metrics were received from the host on which the KUMA Core was installed. In other configurations, the name of the host from which KUMA receives metrics is displayed.
Collector metrics
Metric name |
Description |
|---|---|
IO—metrics related to the service input and output. |
|
Processing EPS |
The number of events processed per second. |
Output EPS |
The number of events per second sent to the destination. |
Output Latency |
The time in milliseconds that passed while sending an event packet and receiving a response from the destination. The median value is displayed. |
Output Errors |
The number of errors occurring per second while event packets were sent to the destination. Network errors and errors writing to the disk buffer of the destination are displayed separately. |
Output Event Loss |
The number of events lost per second. Events can be lost due to network errors or errors writing the disk buffer of the destination. Events are also lost if the destination responds with an error code, for example, in case of an invalid request. |
Output Disk Buffer SIze |
The size of the disk buffer of the collector associated with the destination, in bytes. If a zero value is displayed, no event packets have been placed in the collector's disk buffer and the service is operating correctly. |
Write Network BPS |
The number of bytes received into the network per second. |
Connector errors |
The number of errors in the connector logs. |
Normalization—metrics related to the normalizers. |
|
Raw & Normalized event size |
The size of the raw event and size of the normalized event. The median value is displayed. |
Errors |
The number of normalization errors per second. |
Filtration—metrics related to filters. |
|
EPS |
The number of events per second matching the filter conditions and sent for processing. The collector only processes events that match the filtering criteria if the user has added the filter to the configuration of the collector service. |
Aggregation—metrics related to the aggregation rules. |
|
EPS |
The number of events received and generated by the aggregation rule per second. This metric helps determine the effectiveness of aggregation rules. |
Buckets |
The number of buckets in the aggregation rule. |
Enrichment—metrics related to enrichment rules. |
|
Cache RPS |
The number of requests per second to the local cache. |
Source RPS |
The number of requests per second to an enrichment source, such as a dictionary. |
Source Latency |
Time in milliseconds passed while sending a request to the enrichment source and receiving a response from it. The median value is displayed. |
Queue |
The size of the enrichment request queue. This metric helps to find bottleneck enrichment rules. |
Errors |
The number of errors per second while sending requests to the enrichment source. |
Correlator metrics
Metric name |
Description |
|---|---|
IO—metrics related to the service input and output. |
|
Processing EPS |
The number of events processed per second. |
Output EPS |
The number of events per second sent to the destination. |
Output Latency |
The time in milliseconds that passed while sending an event packet and receiving a response from the destination. The median value is displayed. |
Output Errors |
The number of errors occurring per second while event packets were sent to the destination. Network errors and errors writing to the disk buffer of the destination are displayed separately. |
Output Event Loss |
The number of events lost per second. Events can be lost due to network errors or errors writing the disk buffer of the destination. Events are also lost if the destination responds with an error code, for example, in case of an invalid request. |
Output Disk Buffer SIze |
The size of the disk buffer of the collector associated with the destination, in bytes. If a zero value is displayed, no event packets have been placed in the collector's disk buffer and the service is operating correctly. |
Correlation—metrics related to correlation rules. |
|
EPS |
The number of correlation events per second generated by the correlation rule. |
Buckets |
The number of buckers in a correlation rule of the standard type. |
Rate Limiter Hits |
The number of times the correlation rule exceeded the rate limit per second. |
Active Lists OPS |
The number of operations requests per second sent to the active list, and the operations themselves. |
Active Lists Records |
The number of records in the active list. |
Active Lists On-Disk Size |
The size of the active list on the disk, in bytes. |
Enrichment—metrics related to enrichment rules. |
|
Cache RPS |
The number of requests per second to the local cache. |
Source RPS |
The number of requests per second to an enrichment source, such as a dictionary. |
Source Latency |
Time in milliseconds passed while sending a request to the enrichment source and receiving a response from it. The median value is displayed. |
Queue |
The size of the enrichment request queue. This metric helps to find bottleneck enrichment rules. |
Errors |
The number of errors per second while sending requests to the enrichment source. |
Response—metrics associated with response rules. |
|
RPS |
The number of times a response rule was activated per second. |
Storage metrics
Metric name |
Description |
|---|---|
Storage / IO — metrics related to the status of ClickHouse cluster nodes. |
|
Output EPS |
Number of events per second that were inserted into the ClickHouse node or into the disk buffer of the node. |
Output Latency |
Latency of inserting a batch either into the ClickHouse node or into the disk buffer of the node. |
Output Errors |
Number of errors per second when inserting a batch into the ClickHouse node or into the disk buffer of the node. |
Output Disk Buffer SIze |
Size of the disk buffer of the ClickHouse node. |
Output Event Loss |
Number of events that were permanently lost on each ClickHouse node. |
Batch size |
The size of the batch of events to be inserted into the ClickHouse node. |
Insert interval 5min Q1 |
Duration of the first quartile of the event insertion interval for the last 5 minutes. |
ClickHouse / General—metrics related to the general settings of the ClickHouse cluster. |
|
Active Queries |
The number of active queries sent to the ClickHouse cluster. This metric is displayed for each ClickHouse instance. |
QPS |
The number of queries per second sent to the ClickHouse cluster. |
Failed QPS |
The number of failed queries per second sent to the ClickHouse cluster. |
Allocated memory |
The amount of RAM, in gigabytes, allocated to the ClickHouse process. |
ClickHouse / Insert—metrics related to inserting events into a ClickHouse instance. |
|
Insert EPS |
The number of events per second inserted into the ClickHouse instance. |
Insert QPS |
The number of ClickHouse instance insert queries per second sent to the ClickHouse cluster. If the Insert QPS metric demonstrates a growing queue of queries and the metric is greater than 1, we recommend also looking at the Batch size metric value to adjust the storage buffering settings in the settings of the storage service configuration. Example: The Insert QPS metric is greater than 1 and equals 8. The Batch size metric is 1.2 GB (in bytes). In this case, you can find the buffer size by multiplying Insert QPS by Batch size: 8 * 1.2 = 9.6 GB. Round the resulting value of 9.6 and specify it in bytes (for example, 10000000000 bytes) as the Buffer size setting on the Advanced settings tab of the storage service configuration. Also specify a Buffer flush interval of 2 seconds. |
Failed Insert QPS |
The number of failed ClickHouse instance insert queries per second sent to the ClickHouse cluster. |
Delayed Insert QPS |
The number of delayed ClickHouse instance insert queries per second sent to the ClickHouse cluster. Queries were delayed by the ClickHouse node due to exceeding the soft limit on active merges. |
Rejected Insert QPS |
The number of rejected ClickHouse instance insert queries per second sent to the ClickHouse cluster. Queries were rejected by the ClickHouse node due to exceeding the hard limit on active merges. |
Active Merges |
The number of active merges. |
Distribution Queue |
The number of temporary files with events that could not be inserted into the ClickHouse instance because it was unavailable. These events cannot be found using search. |
ClickHouse / Select—metrics related to event selections in the ClickHouse instance. |
|
Select QPS |
The number of ClickHouse instance event select queries per second sent to the ClickHouse cluster. |
Failed Select QPS |
The number of failed ClickHouse instance event select queries per second sent to the ClickHouse cluster. |
ClickHouse / Replication—metrics related to replicas of ClickHouse nodes. |
|
Active Zookeeper Connections |
The number of active connections to the Zookeeper cluster nodes. In normal operation, this number should be equal to the number of nodes in the Zookeeper cluster. |
Read-only Replicas |
The number of read-only replicas of ClickHouse nodes. In normal operation, no such replicas of ClickHouse nodes must exist. |
Active Replication Fetches |
The number of active processes of downloading data from the ClickHouse node during data replication. |
Active Replication Sends |
The number of active processes of sending data to the ClickHouse node during data replication. |
Active Replication Consistency Checks |
The number of active data consistency checks on replicas of ClickHouse nodes during data replication. |
ClickHouse / Networking—metrics related to the network of the ClickHouse cluster. |
|
Active HTTP Connections |
The number of active connections to the HTTP server of the ClickHouse cluster. |
Active TCP Connections |
The number of active connections to the TCP server of the ClickHouse cluster. |
Active Interserver Connections |
The number of active service connections between ClickHouse nodes. |
KUMA Core metrics
Metric name |
Description |
|---|---|
Raft—metrics related to reading and updating the state of the KUMA Core. |
|
Lookup RPS |
Number of lookup procedure requests per second sent to the KUMA Core, and the procedures themselves. |
Lookup Latency |
Time in milliseconds spent running the lookup procedures, and the procedures themselves. The time is displayed for the 99th percentile of lookup procedures. One percent of lookup procedures may take longer to run. |
Propose RPS |
Number of Raft (SQLite) propose procedure requests per second sent to the KUMA, and the procedures themselves. |
Propose Latency |
Time in milliseconds spent running the Raft (SQLite) propose procedures, and the procedures themselves. The time is displayed for the 99th percentile of propose procedures. One percent of propose procedures may take longer to run. |
Data mining—metrics related to data collection and analysis |
|
Executing Rules |
Number of running schedulers for executing data collection and analysis requests. |
Queued Rules |
Number of schedulers for executing queued data collection and analysis requests. |
Execution Errors |
Number of errors that occurred when running the data collection and analysis scheduler. |
Execution Latency |
How long takes a scheduler to execute requests. |
Tasks—metrics related to monitoring the running of tasks on the KUMA Core |
|
Active tasks |
Number of tasks run per unit time. |
Task Execution latency |
Duration of running tasks in seconds. |
Errors |
Number of errors when running tasks. |
API—metrics related to API requests. |
|
RPS |
Number of API requests made to the KUMA Core per second. |
Latency |
Time in milliseconds spent processing a single API request to the KUMA Core. The median value is displayed. |
Errors |
Number of errors per second while sending API requests to the KUMA Core. |
Notification Feed—metrics related to user activity. |
|
Subscriptions |
Number of clients connected to the KUMA Core via SSE to receive server messages in real time. This number is normally equal to the number of clients that are using the KUMA web interface. |
Errors |
The number of errors per second while sending notifications to users. |
Schedulers—metrics related to KUMA Core tasks. |
|
Active |
The number of repeating active system tasks. The tasks created by the user are ignored. |
Latency |
The time in milliseconds spent running the task. The median value is displayed. |
Errors |
The number of errors that occurred per second while performing tasks. |
Alerts Queue |
Number of alerts in the queue for insertion into the database. |
KUMA agent metrics
Metric name |
Description |
|---|---|
IO—metrics related to the service input and output. |
|
Processing EPS |
The number of events processed per second. |
Output EPS |
The number of events per second sent to the destination. |
Output Latency |
The time in milliseconds that passed while sending an event packet and receiving a response from the destination. The median value is displayed. |
Output Errors |
The number of errors occurring per second while event packets were sent to the destination. Network errors and errors writing to the disk buffer of the destination are displayed separately. |
Output Event Loss |
The number of events lost per second. Events can be lost due to network errors or errors writing the disk buffer of the destination. Events are also lost if the destination responds with an error code, for example, in case of an invalid request. |
Output Disk Buffer SIze |
The size of the disk buffer of the collector associated with the destination, in bytes. If a zero value is displayed, no event packets have been placed in the collector's disk buffer and the service is operating correctly. |
Write Network BPS |
The number of bytes received into the network per second. |
Event routers metrics
Metric name |
Description |
|---|---|
IO—metrics related to the service input and output. |
|
Processing EPS |
The number of events processed per second. |
Output EPS |
The number of events per second sent to the destination. |
Output Latency |
The time in milliseconds that passed while sending an event packet and receiving a response from the destination. The median value is displayed. |
Output Errors |
The number of errors occurring per second while event packets were sent to the destination. Network errors and errors writing to the disk buffer of the destination are displayed separately. |
Output Event Loss |
The number of events lost per second. Events can be lost due to network errors or errors writing the disk buffer of the destination. Events are also lost if the destination responds with an error code, for example, in case of an invalid request. |
Output Disk Buffer SIze |
The size of the disk buffer of the collector associated with the destination, in bytes. If a zero value is displayed, no event packets have been placed in the collector's disk buffer and the service is operating correctly. |
Write Network BPS |
The number of bytes received into the network per second. |
Connector Errors |
The number of errors in the connector log. |
General metrics common for all services
Metric name |
Description |
|---|---|
Process—General process metrics. |
|
Memory |
RAM usage (RSS) in megabytes. |
DISK BPS |
The number of bytes read from or written to the disk per second. |
Network BPS |
The number of bytes received/transmitted over the network per second. |
Network Packet Loss |
The number of network packets lost per second. |
GC Latency |
The time, in milliseconds, spent executing a GO garbage collection cycle The median value is displayed. |
Goroutines |
The number of active goroutines. This number is different from the operating system's thread count. |
OS—metrics related to the operating system. |
|
Load |
Average load. |
CPU |
CPU load as a percentage. |
Memory |
RAM usage (RSS) as a percentage. |
Disk |
Disk space usage as a percentage. |
Metrics storage period
KUMA operation data is saved for 3 months by default. This storage period can be changed.
To change the storage period for KUMA metrics:
- Log in to the OS of the server where the KUMA Core is installed.
- In the file /etc/systemd/system/multi-user.target.wants/kuma-victoria-metrics.service, in the ExecStart parameter, edit the
--retentionPeriod=<metrics storage period, in months>flag by inserting the necessary period. For example,--retentionPeriod=4means that the metrics will be stored for 4 months. - Restart KUMA by running the following commands in sequence:
systemctl daemon-reloadsystemctl restart kuma-victoria-metrics
The storage period for metrics has been changed.
Page topKUMA metric alert triggering conditions
If the value of a KUMA metric for a service exceeds the threshold of the corresponding parameter configured in the Service monitoring section of KUMA, VictoriaMetrics sends an alert, and an error message is displayed in the status of that service.
Alerts are received from VictoriaMetrics at the following intervals:
- VictoriaMetrics collects information from KUMA services every 15 seconds.
- VictoriaMetrics updates alerts for KUMA services every minute.
- The KUMA Core service collects information from VictoriaMetrics every 15 seconds.
Thus, the total delay before a service status is updated is less than 2–3 minutes.
If you disabled the receipt of alerts from VictoriaMetrics, some KUMA services may still be displayed with a yellow status. This can happen in the following cases:
- For a storage service:
- If an alert was received in response to an API request in the /status parameter from ClickHouse
- If cold storage of the Storage service is not being monitored
- For a collector service: If an alert was received in response to an API request in the /status parameter.
- For a correlator service: If a response rule exists that requires the Advanced Responses module, but this module is not covered by the current license, or the license that covers this module has expired.
The table below provides information on which error messages may appear in the service status when an alert is received from VictoriaMetrics, and which metrics and parameters they are based on and in what way. For details on KUMA metrics that can trigger VictoriaMetrics alerts, see Viewing KUMA metrics.
For example, if the Active services table for a service displays a yellow status and the High distribution queue error message (the "Error message" column in the table below), you can view the information in the Enrichment widget, the Distribution Queue metric (the "KUMA metrics" column in the table below).
Description of error messages for KUMA services
Error message |
Configurable alert parameters |
KUMA metric |
Description |
|---|---|---|---|
|
QPS interval/window, minutes QPS Threshold |
Clickhouse / General → Failed QPS |
An error message is displayed if the Failed QPS metric exceeds the specified QPS Threshold value for the duration specified by the QPS interval/window, minutes parameter. For example, if 25 out of 100 requests from VictoriaMetrics to the service were unsuccessful, and the QPS Threshold is 0.2, the alert is calculated as follows: (25 / 100) * 100 > 0.2 * 100 25% > 20% Because the percentage of unsuccessful requests is greater than the specified threshold, an error message is displayed for the service. |
|
Failed insert QPS calculation interval/window, minutes Insert QPS threshold |
Clickhouse / Insert → Failed Insert QPS |
An error message is displayed if the Failed Insert QPS metric exceeds the specified QPS Insert Threshold value for the duration specified by the Failed Insert QPS calculation interval/window, minutes parameter. For example, if 25 out of 100 requests from VictoriaMetrics to the service were unsuccessful, and the QPS Insert Threshold is 0.2, the alert is calculated as follows: (25 / 100) * 100 > 0.2 * 100 25% > 20% Because the percentage of unsuccessful requests is greater than the specified threshold, an error message is displayed for the service. |
|
Distribution queue threshold Distribution queue calculation interval/window, minutes |
Clickhouse / Insert → Distribution Queue |
An error message is displayed if the Distribution Queue metric exceeds the specified Distribution queue threshold value for the duration specified by the Distribution queue calculation interval/window, minutes parameter. |
|
Free space on disk threshold |
OS → Disk |
An error message is displayed if the amount of free disk space (as a percentage) indicated by the Disk metric value is less than the value specified in the Free disk space threshold parameter. For example, an error message is displayed if the partition on which KUMA is installed takes up all the disk space. |
|
Free space on partition threshold |
OS → Disk |
An error message is displayed if the amount of free space (as a percentage) on the disk partition that KUMA is using is less than the value specified in the Free space on partition threshold parameter. For example, an error message is displayed in the following cases:
|
|
Output Event Loss |
IO → Output Event Loss |
An error message is displayed if the Output Event Loss metric has been increasing for one minute. You can enable or disable the display of this error message using the Output Event Loss parameter. |
|
Disk buffer increase interval/window, minutes |
IO → Output Disk Buffer SIze |
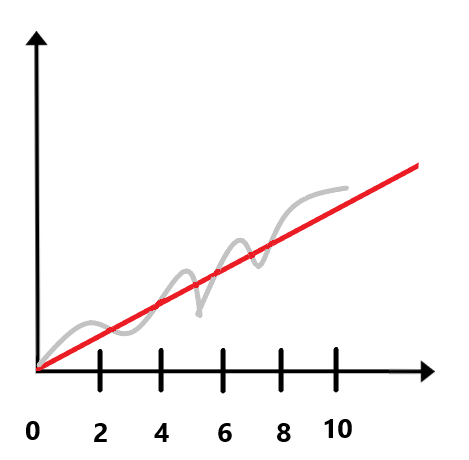
An error message is displayed if the Output Disk Buffer Size metric monotonically increases for 10 minutes with the sampling interval specified by the Disk buffer increase interval/window, minutes parameter. For example, if the Disk buffer increase interval/window, minutes is set to 2 minutes, an error message is displayed if the disk buffer size has monotonically increased for 10 minutes with a sampling interval of 2 minutes (see the figure below).
|
|
Growing enrichment queue interval/window, minutes |
Enrichment → Queue |
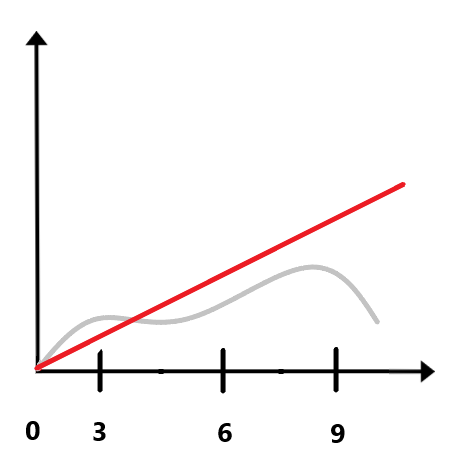
An error message is displayed if the Queue metric monotonically increases for 10 minutes with the sampling interval specified by the Growing enrichment queue interval/window, minutes parameter. For example, if the value of the Growing enrichment queue interval/window, minutes is 3, an error message is displayed if the enrichment queue has monotonically increased every 10 minutes with a sampling interval of 3 minutes. In the case shown in the figure below, the error message is not displayed because at the ninth minute the value of the metric decreased instead of increasing monotonically.
|
|
Enrichment errors |
Enrichment → Errors |
An error message is displayed if the Errors metric has been increasing for one minute. You can enable or disable the display of this error message using the Enrichment errors parameter. |
|
Disable connector errors |
IO → Connector Errors |
An error message is displayed if the Connector Errors metric has been increasing between consecutive polls of the metric by VictoriaMetrics for one minute. You can enable or disable the display of this error message using the Disable connector errors parameter. |
Managing KUMA tasks
When working in the application web interface, you can use tasks to perform various operations. For example, you can import assets or export KUMA event information to a TSV file.
Viewing the tasks table
The tasks table contains a list of created tasks and is located in the Task manager section of the application web interface window.
You can view the tasks that were created by you (current user). A user with the General Administrator role can view the tasks of all users.
By default, the Display only my own filter is applied in the Task manager section. To see tasks, clear the check box from the Display only my own filter.
The tasks table contains the following information:
- State—the state of the task. One of the following statuses can be assigned to a task:
- Green dot blinking—the task is active.
- Completed—the task is complete.
- Cancel—the task was canceled by the user.
- Error—the task was not completed because of an error. The error message is displayed if you hover the mouse over the exclamation mark icon.
- Task—the task type. The application provides the following types of tasks:
- Events export—export KUMA events.
- Threat Lookup—request data from the Kaspersky Threat Intelligence Portal.
- Retroscan—task for replaying events.
- KSC assets import—imports asset data from Kaspersky Security Center servers.
- Accounts import—imports user data from Active Directory.
- KICS/KATA assets import—imports asset data from KICS/KATA.
- Repository update—updates the KUMA repository to receive the resource packages from the source specified in settings.
- Created by—the user who created the task. If the task was created automatically, the column will show Scheduled task.
- Created—task creation time.
- Updated—time when the task was last updated.
- Tenant—the name of the tenant in which the task was started.
The task date format depends on the localization language selected in the application settings. Possible date format options:
- English localization: YYYY-MM-DD.
- Russian localization: DD.MM.YYYY.
Configuring the display of the tasks table
You can customize the display of columns and the order in which they appear in the tasks table.
To customize the display and order of columns in the tasks table:
- In the KUMA web interface, select the Task manager section.
The tasks table is displayed.
- In the table heading, click the gear (
 ) button.
 - In the opened window, do the following:
- If you want to enable display of a column in the table, select the check box next to the name of the parameter that you want to display in the table.
- If you do not want the parameter to be displayed in the table, clear the check box.
At least one check box must be selected.
- If you want to reset the settings, click the Default link.
- If you want to change the order in which the columns are displayed in the table, move the mouse cursor over the name of the column, hold down the left mouse button and drag the column to the necessary position.
The display of columns in the tasks table will be configured.
Page topViewing task run results
To view the results of a task:
- In the KUMA web interface, select the Task manager section.
The tasks table is displayed.
- Click the link containing the task type in the Task column.
A list of the operations available for this task type will be displayed.
- Select Show results.
The task results window opens.
In this section, the Display only my own filter is applied by default in the Created by column of the task table. To view all tasks, disable this filter.
Page topRestarting a task
To restart a task:
- In the KUMA web interface, select the Task manager section.
The tasks table is displayed.
- Click the link containing the task type in the Task column.
A list of the operations available for this task type will be displayed.
- Select Restart.
The task will be restarted.
Page topConnecting to an SMTP server
KUMA can be configured to send email notifications using an SMTP server. Users will receive notifications if the Receive email notifications check box is selected in their profile settings.
Only one SMTP server can be added to process KUMA notifications. An SMTP server connection is managed in the KUMA web interface under Settings → Common → SMTP server settings.
To configure SMTP server connection:
- Open the KUMA web interface and select Settings → Common.
- Under SMTP server settings, change the relevant settings:
- Disabled—select this check box if you want to disable connection to the SMTP server.
- Host (required)—SMTP host in one of the following formats: hostname, IPv4, IPv6.
- Port (required)—SMTP port. The value must be an integer from 1 to 65,535.
- From (required)—email address of the message sender. For example,
kuma@company.com. - Alias for KUMA Core server—name of the KUMA Core server that is used in your network. Must be different from the FQDN.
- If necessary, use the Secret drop-down list to select a secret of the credentials type that contains the account credentials for connecting to the SMTP server.
- Select the necessary frequency of notifications in the Monitoring notifications interval drop-down list.
Notifications from the source about a monitoring policy triggering are repeated after the selected period until the status of the source becomes green again.
If you select Notify once, only one notification about monitoring policy triggering is sent for the entire period when the source status stays red, and every time when the source status changes from red to green.
- Turn on the Disable monitoring notifications toggle button if you do not want to receive notifications about the state of event sources. The toggle switch is turned off by default.
- Click Save.
The SMTP server connection is now configured, and users can receive email messages from KUMA.
Page topWorking with Kaspersky Security Center tasks
You can connect Kaspersky Security Center assets to KUMA and download database and application module updates to these assets, or run an anti-virus scan on them by using Kaspersky Security Center tasks. Tasks are started in the KUMA web interface.
To run Kaspersky Security Center tasks on assets connected to KUMA, it is recommended to use the following script:
- Creating a user account in the Kaspersky Security Center Administration Console
The credentials of this account are used when creating a secret to establish a connection with Kaspersky Security Center, and can be used to create a task.
For more details about creating a user account and assigning permissions to a user, please refer to the Kaspersky Security Center Help Guide.
- Creating KUMA tasks in Kaspersky Security Center
- Configuring KUMA integration with Kaspersky Security Center
- Importing asset information from Kaspersky Security Center into KUMA
- Assigning a category to the imported assets
After import, the assets are automatically placed in the Uncategorized devices group. You can assign one of the existing categories to the imported assets, or create a category and assign it to the assets.
- Running tasks on assets
You can manually start tasks in the asset information or configure tasks to start automatically.
Creating KUMA tasks in Kaspersky Security Center
You can run the anti-virus database and application module update task, and the virus scan task on Kaspersky Security Center assets connected to KUMA. The assets must have Kaspersky Endpoint Security for Windows or Linux installed. The tasks are created in Kaspersky Security Center Web Console.
For more details about creating the Update and Virus scan tasks on the assets with Kaspersky Endpoint Security for Windows, refer to the Kaspersky Endpoint Security for Windows Help Guide.
For more details about creating the Update and Virus scan tasks on the assets with Kaspersky Endpoint Security for Linux, refer to the Kaspersky Endpoint Security for Linux Help Guide.
Task names must begin with "kuma" (not case-sensitive and without quotations). For example, KUMA antivirus check. Otherwise, the task is not displayed in the list of available tasks in the KUMA web interface.
Starting Kaspersky Security Center tasks manually
You can manually run the anti-virus database, application module update task, and the anti-virus scan task on Kaspersky Security Center assets connected to KUMA. The assets must have Kaspersky Endpoint Security for Windows or Linux installed.
First, you need to configure the integration of Kaspersky Security Center with KUMA and create tasks in Kaspersky Security Center.
To manually start a Kaspersky Security Center task:
- In the Assets section of the KUMA web interface, select the asset that was imported from Kaspersky Security Center.
The Asset details window opens.
- Click the KSC response button.
This button is displayed if the connection to the Kaspersky Security Center that owns the selected asset is enabled.
- In the opened Select task window, select the check boxes next to the tasks that you want to start, and click the Start button.
Kaspersky Security Center starts the selected tasks.
Some types of tasks are available only for certain assets.
You can obtain vulnerability and software information only for assets running a Windows operating system.
Page topStarting Kaspersky Security Center tasks automatically
You can configure the automatic start of the anti-virus database and application module update task and the virus scan task for Kaspersky Security Center assets connected to KUMA. The assets must have Kaspersky Endpoint Security for Windows or Linux installed.
First, you need to configure the integration of Kaspersky Security Center with KUMA and create tasks in Kaspersky Security Center.
Configuring automatic start of Kaspersky Security Center tasks includes the following steps:
Step 1. Adding a correlation rule
To add a correlation rule:
- In the KUMA web interface, select the Resources section.
- Select Correlation rules and click the Add correlation rule button.
- On the General tab, specify the following settings:
- In the Name field, define the rule name.
- In the Tenant drop-down list, select the tenant that owns the resource.
- In the Type drop-down list, select simple.
- In the Propagated fields field, add the following fields: DestinationAssetID.
- If required, define the values for the following fields:
- In the Rate limit field, define the maximum number of times per second that the rule will be triggered.
- In the Severity field, define the severity of alerts and correlation events that will be created as a result of the rule being triggered.
- In the Description field, provide any additional information.
- On the Selectors → Settings tab:
- In the Filter drop-down list, select Create new.
- In the Conditions field, click the Add group button.
- In the operator field for the group you added, select AND.
- Add a condition for filtering by the DeviceProduct field value:
- In the Conditions field, click the Add condition button.
- In the condition field, select If.
- In the Left operand field, select event field.
- In the 'Event field' field, select DeviceProduct.
- In the Operator field, select =.
- In the Right operand field, select constant.
- In the value field, enter KSC.
- Add a condition for filtering by the Name field value:
- In the Conditions field, click the Add condition button.
- In the condition field, select If.
- In the Left operand field, select event field.
- In the event field, select Name.
- In the Operator field, select =.
- In the Right operand field, select constant.
- In the value field, enter the name of the event. When this event is detected, the task is started automatically.
For example, if you want the Virus scan task to start when Kaspersky Security Center registers the Malicious object detected event, specify this name in the Value field.
You can view the event name in the Name field of the event details.
- On the Actions tab, specify the following settings:
- In the Actions section, open the On every event drop-down list.
- Select the Output check box.
You do not need to fill in other fields.
- Click the Save button.
The correlation rule will be created.
Step 2. Creating a correlator
You need to launch the correlator installation wizard. At step 3 of the wizard, you are required to select the correlation rule that you added by following this guide.
The DeviceHostName field must display the domain name (FQDN) of the asset. If it is not displayed, create a DNS record for this asset and create a DNS enrichment rule at Step 4 of the wizard.
Step 3. Adding a filter
To add a filter:
- In the KUMA web interface, select the Resources section.
- Select Filters and click the Add filter button.
- In the Name field, specify the filter name.
- In the Tenant drop-down list, select the tenant that owns the resource.
- In the Conditions field, click the Add group button.
- In the operator field for the group you added, select AND.
- Add a condition for filtering by the DeviceProduct field value:
- In the Conditions field, click the Add condition button.
- In the condition field, select If.
- In the Left operand field, select event field.
- In the 'Event field' field, select Type.
- In the Operator field, select =.
- In the Right operand field, select constant.
- In the Value field, enter 3.
- Add a condition for filtering by the Name field value:
- In the Conditions field, click the Add condition button.
- In the condition field, select If.
- In the Left operand field, select event field.
- In the event field, select Name.
- In the Operator field, select =.
- In the Right operand field, select constant.
- In the Value field, enter the name of the correlation rule created at Step 1.
Step 4. Adding a response rule
To add a response rule:
- In the KUMA web interface, select the Resources section.
- Select Response rules and click the Add response rule button.
- In the Name field, define the rule name.
- In the Tenant drop-down list, select the tenant that owns the resource.
- In the Type drop-down list, select Response via KSC.
- In the Kaspersky Security Center task drop-down list, select the Kaspersky Security Center task you want to start.
- In the Event field drop-down list, select the DestinationAssetID.
- In the Workers field, specify the number of processes that the service can run simultaneously.
By default, the number of work processes is the same as the number of virtual processors on the server where the correlator service is installed.
- In the Description field, you can add up to 4,000 Unicode characters.
- In the Filter drop-down list, select the filter added at Step 3 of this instruction.
To send requests to Kaspersky Security Center, you must ensure that Kaspersky Security Center is available over the UDP protocol.
If a response rule is owned by the shared tenant, the displayed Kaspersky Security Center tasks that are available for selection are from the Kaspersky Security Center server that the main tenant is connected to.
If a response rule has a selected task that is absent from the Kaspersky Security Center server that the tenant is connected to, the task is not performed for assets of this tenant. This situation could arise when two tenants are using a common correlator, for example.
Step 5. Adding a response rule to the correlator
To add a response rule to the correlator:
- In the KUMA web interface, select the Resources section.
- Select Correlators.
- In the list of correlators, select the correlator added at Step 2 of this instruction.
- In the steps tree, select Response rules.
- Click Add.
- In the Response rule drop-down list, select the rule added at step 4 of these instructions.
- In the steps tree, select Setup validation.
- Click the Save and restart services button.
- Click the Save button.
The response rule will be added to the correlator.
The automatic start will be configured for the anti-virus database and application module update task and the virus scan task on Kaspersky Security Center assets connected to KUMA. The tasks are started when a threat is detected on the assets and KUMA receives the corresponding events.
Page topChecking the status of Kaspersky Security Center tasks
In the KUMA web interface, you can check whether a Kaspersky Security Center task was started or whether a search for events owned by the collector listening for Kaspersky Security Center events was completed.
To check the status of Kaspersky Security Center tasks:
- In KUMA, select Resources → Active services.
- Select the collector that is configured to receive events from the Kaspersky Security Center server and click the Go to Events button.
A new browser tab will open in the Events section of KUMA. The table displays events from the Kaspersky Security Center server. The status of the tasks can be seen in the Name column.
Kaspersky Security Center event fields:
- Name—status or type of the task.
- Message—message about the task or event.
- FlexString<number>Label—name of the attribute received from Kaspersky Security Center. For example,
FlexString1Label=TaskName. - FlexString<number>—value of the FlexString<number>Label attribute. For example,
FlexString1=Download updates. - DeviceCustomNumber<number>Label—name of the attribute related to the task state. For example,
DeviceCustomNumber1Label=TaskOldState. - DeviceCustomNumber<number>—value related to the task state. For example,
DeviceCustomNumber1=1means the task is executing. - DeviceCustomString<number>Label—name of the attribute related to the detected vulnerability: for example, a virus name, affected application.
- DeviceCustomString<number>—value related to the detected vulnerability. For example, the attribute-value pairs
DeviceCustomString1Label=VirusNameandDeviceCustomString1=EICAR-Test-Filemean that the EICAR test virus was detected.
KUMA notifications
Standard notifications
KUMA can be configured to send email notifications using an SMTP server. To do so, configure a connection to an SMTP server and select the Receive email notifications check box. Only a user with the General administrator role can receive email notifications.
If the Receive email notifications check box is selected for a user with the General administrator role, after enabling the setting, an email notification is sent to the user every 6 hours in accordance with the following rule:
- If at least one server has a non-empty Warning field at the time scheduled for sending the message, the message is sent.
- One message is sent for all services with the yellow status. If no services have the yellow status, no message is sent.
The 6-hour interval is respected unless the KUMA Core is restarted. After each restart of the Core, the 6-hour interval is reset.
KUMA automatically notifies users about the following events:
- A report was created (the users listed in the report template receive a notification).
- An alert was created (all users receive a notification).
- An alert was assigned to a user (the user to whom the alert was assigned receives a notification).
- A task was performed (the users who created the task receive a notification).
- New resource packages are available. They can be obtained by updating the KUMA repository (the users whose email address is specified in the task settings are notified).
- The daily average EPS has exceeded the limit set by the license.
- The hourly average EPS has exceeded the limit set by the SMB license.
Custom notifications
Instead of the standard KUMA notifications about the alert generation, you can send notifications based on custom templates. To configure custom notifications instead of standard notifications, take the following steps:
- Create an email template.
- Create a notification rule that specifies the correlation rules and email addresses.
When an alert is created based on the selected correlation rules, notifications created based on custom email templates will be sent to the specified email addresses. Standard KUMA notifications about the same event will not be sent to the specified addresses.
Page topKUMA logs
KUMA provides the following types of logs:
- Installer logs
- Component logs
You can also generate a report with diagnostic information about your device using the collect.sh utility. For detailed information on using the utility, please refer to the Knowledge Base.
Installer logs
KUMA automatically creates files containing logs of installation, reconfiguration, or removal.
The logs are stored in the ./log/ subdirectory in the installer directory. The name of the log file reflects the date and time when the corresponding script was started.
Names are generated in the following formats:
- Installation log: install-YYYYMMDD-HHMMSS.log. For example: install-20231031-102409.log
- Removal logs: uninstall-YYYYMMDD-HHMMSS.log. For example: uninstall-20231031-134011.log
- Reconfiguration logs: expand-YYYYMMDD-HHMMSS.log. For example: expand-20231031-105805.log
KUMA creates a new log file each time the installation, reconfiguration, or removal script is started. Log rotation or automatic deletion is not performed.
The log incorporates the lines of the inventory file used when the corresponding command was invoked, and the ansible log. For each task, the following information is listed in this order: task start time (Tuesday, October 31, 2023 10:29:14 +0300), run time of the previous task (0:00:02.611), and the total time passed since the installation, reconfiguration, or removal was initiated (0:04:56.906).
Example:
TASK [Add columns to the replicated table] ***************************************
Tuesday, October 31, 2023 10:29:14 +0300 (0:00:02.611) 0:04:56.906 *******
Component logs
By default, only errors are logged for all KUMA components. To receive detailed data in logs, configure Debug mode in the component settings.
The Core logs are stored in the /opt/kaspersky/kuma/core/00000000-0000-0000-0000-000000000000/log/core directory and are archived when they reach the size of 5 GB or the age of 7 days, whichever occurs first. These conditions are checked once daily. Archives are kept in the log folder for 7 days, after 7 days the archive is deleted. A maximum of four archived logs are stored on the server at the same time. Whenever a new log archive is created, if the total number of archives becomes greater than four, the oldest log archive is deleted. If the logs fill up quickly, you must have enough disk space to create a copy of the log file and archive it as part of log rotation.
The component logs are appended until the file reaches 5 GB. When the log reaches 5 GB, it is archived and new events are written to a new log. Archives are kept in the log folder for 7 days, after 7 days the archive is deleted. A maximum of four archived logs are stored on the server at the same time. Whenever a new log archive is created, if the total number of archives becomes greater than four, the oldest log archive is deleted.
Debug mode is available for the following components:
Core |
To enable it: in the KUMA web interface, select Settings → General → Core settings → Debug. Storage location: /opt/kaspersky/kuma/core/00000000-0000-0000-0000-000000000000/log/core You can download the Core logs from the KUMA web interface, in the Resources → Active services section by selecting the Core service and clicking Log. If KUMA is installed in a high availability configuration, refer to the Viewing Core logs in Kubernetes section below. |
Services:
|
To enable it, use the Debug toggle switch in the settings of the service. Storage location: the service installation directory. For example, /opt/kaspersky/kuma/<service name>/<service ID>/log/<service name>. You can download the service logs from the KUMA web interface, in the Resources → Active services section by selecting the desired service and clicking Log. Logs residing on Linux machines can be viewed by running the journalctl and tail command. For example:
|
Resources:
|
To enable it, use the Debug toggle switch in the settings of the service to which the resource is linked. The logs are stored on the machine hosting the installed service that uses the relevant resource. Detailed data for resources can be viewed in the log of the service linked to a resource. |
Viewing Core logs in Kubernetes
When Core log files reach 100 MB, they are archived and a new log is written. No more than five files are stored at a time. If there are more than five files when a new log appears, the oldest file is deleted.
On worker nodes, you can view the logs of containers and pods residing on these nodes in the file system of the node.
For example:
/var/log/pods/kuma_core-deployment-<UID>/core/*.log
/var/log/pods/kuma_core-deployment-<UID>/mongodb/*.log
To view the logs of all containers in the Core pod:
k0s kubectl logs -l app=core --all-containers -n kuma
To view the log of a specific container:
k0s kubectl logs -l app = core -c <container_name> -n kuma
To enable real-time log viewing, add the -f switch:
k0s kubectl logs -f -l app=core --all-containers -n kuma
To view the logs of the previous pod that was overwritten by a new one (for example, when recovering from a critical error or after redeployment), add the --previous switch:
k0s kubectl logs -l app=core -c core -n kuma --previous
To access the logs from other hosts that are not included in the cluster, you need the k0s-kubeconfig.yml file containing the access credentials created during KUMA installation, and the locally installed kubectl cluster management utility.
The cluster controller or traffic balancer specified in the server parameter of the k0s-kubeconfig.yml file must be accessible over the network.
The file path must be exported to a variable: export KUBECONFIG=/<file path>/k0s-kubeconfig.yml
You can use kubeclt to view the logs. For example:
kubectl logs -l app=core -c mongodb -n kuma