Contents
Program architecture
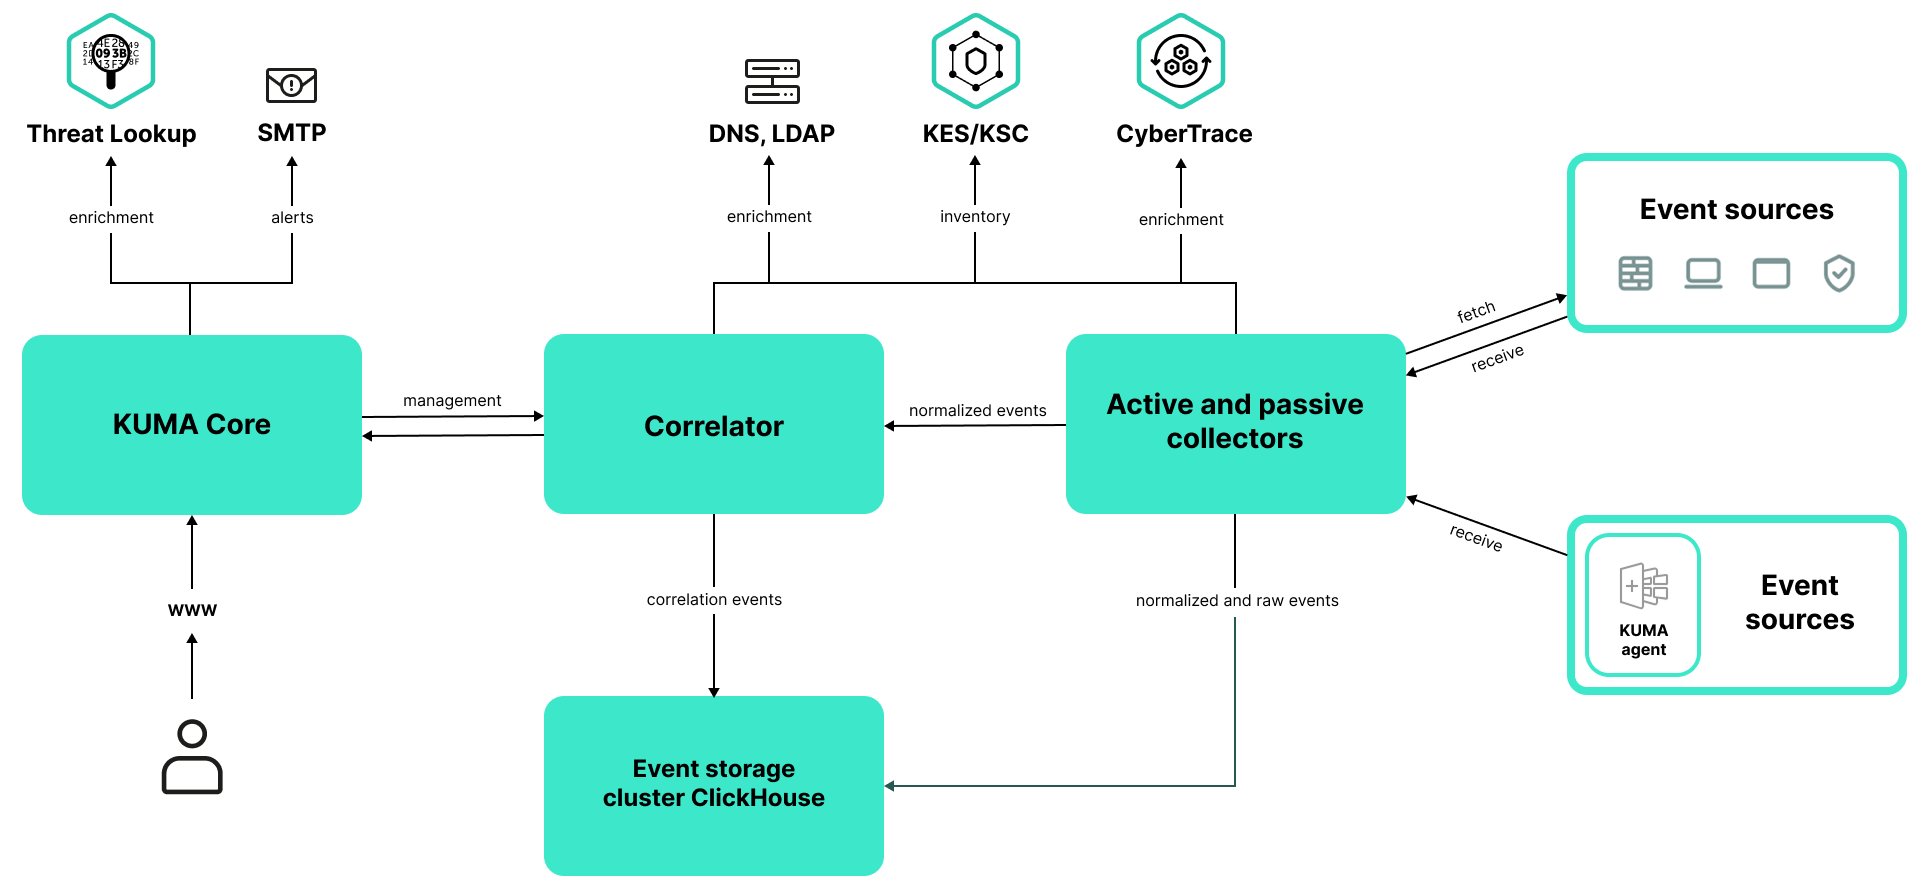
The standard installation of the application includes the following components:
- The Core that includes a graphical user interface for monitoring and managing the settings of system components.
- Agents that are used to forward raw events from servers and workstations to KUMA destinations.
- One or more Collectors that receive messages from event sources and parse, normalize, and, if necessary, filter and/or aggregate them.
- Event routers that receive events from collectors and apply the configured filters to route the events to the configured destinations. In this way, these services balance the load on the network links.
- The Correlator that analyzes normalized events received from Collectors, performs the necessary actions with active lists, and creates alerts in accordance with the correlation rules.
- The Storage, which holds normalized events and registered alerts.
Events are transmitted between components over optionally encrypted, reliable transport protocols. You can configure load balancing to distribute load between service instances, and you can also enable automatic switchover to a backup component if the primary component becomes unavailable. If all components are unavailable, events are saved to the hard disk buffer to be sent later. The size of the buffer in the file system for temporary storage of events can be changed.
KUMA architecture
Core
The Core is the central component of KUMA that serves as the foundation upon which all other services and components are built. The Core provides a graphical user interface that is intended for everyday use as well as for configuring the system as a whole.
The Core allows you to:
- Create and configure services (or components) of the application, as well as integrate the necessary software into the system.
- Manage services and user accounts of the application in a centralized way.
- Visualize application performance statistics.
- Investigate security threats based on the received events.
Collector
A collector is an application component that receives messages from event sources, processes these messages, and sends them to a storage, correlator, and/or third-party services to identify alerts.
For each collector, one connector and one normalizer must be configured. You can also configure any number of additional normalizers, filters, enrichment rules, and aggregation rules. For the collector to send normalized events to other services, you must add destinations. Normally, two destinations are used: a storage and a correlator.
The collector iterates over the following steps:
- Receive messages from event sources
To receive messages, you must configure an active or passive connector. A passive connector only listens for messages from an event source, while an active connector actively polls an event source, such as a database management system.
Connectors can have different types. The choice of connector type depends on the transport protocol used for messaging. For example, if your event source sends messages over TCP, you must install a connector of the TCP type.
The application has the following connector types available:
- tcp
- udp
- netflow
- sflow
- nats-jetstream
- kafka
- kata/edr
- http
- sql
- file
- 1c-xml
- 1c-log
- diode
- ftp
- nfs
- vmware
- wmi
- wec
- snmp-trap
- elastic
- etw
- Parse and normalize events
Events received by the connector are processed using a normalizer and normalization rules set by the user. The choice of normalizer depends on the format of messages coming from the event source. For example, if your event source sends messages in the CEF format, you must select a normalizer of the CEF type.
The following normalizers are available in the application:
- JSON
- CEF
- Regexp
- Syslog (as per RFC3164 and RFC5424)
- CSV
- Key-value
- XML
- NetFlow (the same normalizer for NetFlow v5, NetFlow v9 and IPFIX)
- NetFlow v5
- NetFlow v9
- SQL
- IPFIX (v10)
- Filter normalized events
You can configure filters to identify events that satisfy certain conditions and only send such events for processing.
- Enrich and convert normalized events
Enrichment rules let you add supplementary information from internal and external sources to the events. The application can use the following enrichment sources:
- constants
- cybertrace
- dictionaries
- dns
- events
- ldap
- templates
- timezone data
- geographic data
Conversion rules let you convert the values of event fields in accordance with certain criteria. The application offers the following conversion methods:
- lower: convert all characters to lower case.
- upper: convert all characters to upper case.
- regexp: extract a substring using RE2 regular expressions.
- substring: extract a substring by giving its first and last characters.
- replace: replace some text with a string.
- trim: delete the specified characters.
- append: add characters to the end of the field value.
- prepend: adds characters to the beginning of the field value.
- Aggregate normalized events
You can configure aggregation rules to avoid sending many events of the same kind to the storage and/or correlator. Aggregation rules let you combine multiple events into one event. This can help reduce the load on the services responsible for further event processing, conserve storage space and the events per second (EPS) allowance of your license. For example, if you have many events for network connections between two IP addresses that use the same transport and application layer protocols, you can roll up such events for a certain period into one big event.
- Send out normalized events
Having passed through all processing steps, the event is sent to the configured destinations.
Correlator
The Correlator is an application component that analyzes normalized events. As part of the correlation process, an event can be correlated with information from active lists and/or dictionaries.
The correlation analysis produces information that can be used for the following purposes:
- Generating alerts.
- Notifying about alerts.
- Managing active list content.
- Sending correlation events to configured destinations.
Events are correlated in real time. The operating principle of the correlator is based on signature analysis of events. This means that every event is processed in accordance with the correlation rules set by the user. When the application detects a sequence of events that match the correlation rule, a correlation event is created and sent to the Storage. The correlation event can also be sent to a correlator to be analyzed again, which lets you configure correlation rules that trigger on prior analysis results. Products of one correlation rule can be used by other correlation rules.
You can distribute correlation rules and the active lists they use among correlators, thereby balancing the load on services. In this arrangement, collectors will send normalized events to all available correlators.
A correlator iterates over the following steps:
- Get an event
The correlator receives a normalized event from a collector or another service.
- Apply correlation rules
You can configure correlation rules to trigger on a single event or a sequence of events. If correlation rules do not detect an alert, the event processing ends here.
- Respond to an alert
You can configure what happens when an alert is detected. The application offers the following actions:
- Event enrichment
- Operations with active lists
- Sending notifications
- Saving a correlation event
- Send a correlation event
When a sequence of events matches a correlation rule, a correlation event is created and sent to the storage. At this point, the correlator is done processing the event.
Storage
A KUMA storage is used to store normalized events and ensure that KUMA can quickly and reliably access these events to extract analytical data. Access speed and high availability are made possible by the ClickHouse technology. This means that a storage is a ClickHouse cluster bound to a KUMA storage service. ClickHouse clusters can be supplemented with cold storage disks.
When choosing a ClickHouse cluster configuration, consider the specific event storage requirements of your organization. For more information, please refer to the ClickHouse documentation.
You can create spaces in repositories. Spaces let you structure the data in the cluster and, for example, store events of a certain type together.
Page topAbout tenants
KUMA supports the multitenancy mode in which one instance of KUMA installed in the infrastructure of the main organization (main tenant) allows its branches (tenants) to receive and process their own events in isolation.
The system is managed centrally through the shared web interface, however, the tenants operate independently of each other and have access only to their own resources, services, and settings. Events of tenants are stored separately.
A user can have access to multiple tenants at the same time. You can also select which tenants' data you want to be displayed in sections of the KUMA web interface.
Two tenants are created by default in KUMA:
- The Main tenant contains resources and services that belong to the main tenant. Only the general administrator has access to these resources.
- The shared tenant is where the general administrator can place resources, asset categories, and monitoring policies that are available to users of all tenants. You can restrict the access of individual users to the shared tenant.
About events
Events are information security events registered on the monitored elements of the corporate IT infrastructure. For example, events include login attempts, interactions with a database, and information sent by sensors. Each individual event may appear meaningless, but taken together, they paint a bigger picture of network activity that can help you identify security threats. This is the core functionality of KUMA.
KUMA receives events from logs and restructures them by bringing data from heterogeneous sources to a uniform format (this process is called normalization). The events are then filtered, aggregated, and sent to the correlator service for analysis and to the storage service where they are retained. When KUMA recognizes a specific event or a sequence of events, it creates correlation events, which are also analyzed and retained. If an event or sequence of events indicates a potential security threat, KUMA creates an alert. An alert is a notification about the threat bundled with all related data, which is brought to the attention of a security officer and can be investigated. If the nature of the data received by KUMA or the generated correlation events and alerts indicate a possible attack or vulnerability, the symptoms of such an occurrence can be combined into an incident.
For convenience of investigating alerts and processing incidents, make sure that time is synchronized on all devices involved in the event life cycle (event sources, KUMA servers, client hosts) with the help of Network Time Protocol (NTP) servers.
Throughout their life cycle, events undergo conversions and may be named differently. The following is an outline of the life cycle of a typical event:
The first steps are carried out in a collector.
- Raw event. The original message from an event source received at a KUMA connector is called a raw event. This message is unprocessed, and KUMA cannot use it yet. To make it usable, it must be normalized to fit the KUMA data model. This happens at the next stage.
- Normalized event. A normalizer transforms the data of the raw event to make it fit the KUMA data model. After this transformation, the original message turns into a normalized event, which KUMA can analyze. From this point on, KUMA handles only normalized events. Raw events are no longer used, but they can be kept as a part of normalized events inside the
Rawfield.The application has the following normalizers:
- JSON
- CEF
- Regexp
- Syslog (as per RFC3164 and RFC5424)
- CSV/TSV
- Key-value
- XML
- Netflow v5, v9, IPFIX (v10), sFlow v5
- SQL
At this point, normalized events can already be used for analysis.
- Destination. After the collector has processed the event, the event can be sent to other KUMA services: a correlator and/or storage.
Subsequent steps of the event life cycle take place in the correlator.
The following event types are distinguished:
- Base event. An event that has been normalized.
- Aggregated event. When dealing with a large number of similar events, you can "merge" them into a single event to save processing time and resources. These act as base events and are processed in the same way, but In addition to all of the parameters of the parent events (the events that have been "merged"), an aggregated event has a counter that tells how many parent events it represents. Aggregated events also store the time when the first and last parent events were received.
- Correlation event. When a sequence of events is detected that satisfies the conditions of a correlation rule, the application creates a correlation event. These events can be filtered, enriched, and aggregated. They can also be sent for storage or looped into the correlator pipeline.
- Audit event. Audit events are created when certain security-related actions are performed in KUMA. These events are used to ensure system integrity. These events are automatically placed in a separate storage space and stored for at least 365 days.
- Monitoring event. These events are used to track changes in the amount of data received by KUMA.
About alerts
In KUMA, an alert is created when a received sequence of events triggers a correlation rule. Correlation rules are created by KUMA analysts to check incoming events for possible security threats, so when a correlation rule is triggered, a warning about possible malicious activity is displayed. Security officers responsible for data protection must investigate these alerts and respond if necessary.
KUMA automatically assigns a severity level to each alert. This parameter shows how important or numerous are the processes that triggered the correlation rule. Alerts with higher severity should be dealt with first. The severity value is automatically updated when new correlation events are received, but a security officer can also set it manually. In this case, the alert severity is no longer automatically updated.
Related events are linked to the alerts, which allows enriching alerts with data from these events. KUMA also offers drill down functionality for alert investigation.
You can use alerts to create incidents.
Alert management in KUMA is described in this section.
Page topAbout incidents
If the nature of the data received by KUMA or the generated correlation events and alerts indicate a possible attack or vulnerability, the symptoms of such an occurrence can be combined into an incident. This allows security officers to analyze threat manifestations in a comprehensive manner and facilitates response.
You can assign a category, type, and severity to an incident, and assign incidents to data protection officers for processing.
Incidents can be exported to NCIRCC.
Page topAbout assets
Assets are network devices registered in KUMA. Assets generate network traffic when they send and receive data. KUMA can be configured to track this activity and create base events with a clear indication of where the traffic is coming from and where it is going. The event can contain source and destination IP addresses, as well as DNS names. If you register an asset with certain parameters (for example, a specific IP address), this asset is linked to all events that mention these parameters (IP address in this example).
Assets can be logically grouped. This helps keep your network structure transparent and gives you additional ways to work with correlation rules. When an event linked to an asset is processed, the category of this asset is also taken into consideration. For example, if you assign a high severity value to a certain asset category, base events involving these assets will lead to correlation events with higher severity. This in turn cascades into higher-severity alerts and, therefore, more urgency when responding to such an alert.
We recommend registering network assets in KUMA because using assets allows formulating clear and versatile correlation rules, which makes event analysis more efficient.
Asset management in KUMA is described in this section.
Page topAbout resources
Resources are KUMA components that contain parameters for implementing various functions: for example, establishing a connection with a given web address or converting data in accordance with certain rules. These modular components are assembled into resource sets for services, which in turn are used to create KUMA services.
Page topAbout services
Services are the main components of KUMA that handle events by receiving, processing, analyzing, and storing them. Each service consists of two parts that work together:
- One part of the service is created in the KUMA web interface based on a resource set for services.
- The other part of the service is installed in the network infrastructure where KUMA is deployed, as one of KUMA components. The server part of a service can consist of multiple instances: for example, services of the same agent or storage can be installed on multiple devices at the same time.
The two parts of a service are linked to each other by the service ID.
Page topAbout agents
KUMA agents are services that forward raw events from servers and workstations to KUMA destinations.
The following types of agents are provided:
- wmi agents receive data from remote Windows devices using Windows Management Instrumentation. These are installed on Windows devices.
- wec agents receive Windows logs from the local device using Windows Event Collector. They are installed to Windows assets.
- tcp agents receive data over TCP. These are installed on Linux and Windows devices.
- udp agents receive data over UDP. They are installed to Linux and Windows assets.
- nats-jetstream agents are used for communication through NATS. They are installed to Linux and Windows assets.
- kafka agents are used for kafka communications. They are installed to Linux and Windows assets.
- http agents are used for communication over HTTP. They are installed to Linux and Windows assets.
- file agents get data from a file. They are installed to Linux and Windows assets.
- ftp agents receive data over the File Transfer Protocol. They are installed to Linux and Windows assets.
- nfs agents receive data over the Network File System protocol. They are installed to Linux and Windows assets.
- snmp agents receive data using the Simple Network Management Protocol. They are installed to Linux and Windows assets.
- diode agents are used together with data diodes to receive events from isolated network segments. They are installed to Linux and Windows assets.
- etw agents receive Event Tracing for Windows data. They are installed to Windows assets.
About Severity
Severity reflects the relative importance of security-sensitive activity detected by a KUMA correlator. It suggests the order in which alerts should be processed, and indicates whether senior security officers should be involved.
The correlator automatically assigns a severity value to correlation events and alerts based on correlation rule settings. The severity of an alert also depends on the assets linked to the events being processed because correlation rules take into account the severity of these assets' category. If an alert or correlation event does not have any linked assets with a severity value, or if it does not have any linked assets at all, the alert or correlation event inherits the severity of the correlation rule that generated it. The severity of an alert or correlation event is always equal to or greater than the severity of the correlation rule that generated it.
The severity of an alert can be changed manually. A severity that has been manually modified is no longer automatically updated by correlation rules.
Possible severity values:
- Low
- Medium
- High
- Critical