Events widget
You can use the Events widget to get analytics based on SQL queries.
When creating this widget, you must specify the settings described in the tables below.
General tab
The following table lists the settings on the General tab.
Description of parameters
Setting |
Description |
|---|---|
Graph |
Graph type. The following graph types are available:
|
Format |
Data display format: Absolute values or Relative values, %. The setting is available for a Stacked Bar chart. If you select the Absolute values format, the heights of the bars correspond to the sum of the values of the measured indicator. If you select the Relative values, % format, all bars have the same height of 100%, and the relative heights of colored zones on the bars correspond to the ratios of indicator values. By default, Absolute values is selected. |
Timeline view |
Time data display format: Bar chart or Line chart. This setting is available for charts of the Date Histogram type. When you select the Bar chart format, the data is displayed as vertical bars by default. If the SQL query contains an additional category field (for example, If you select the Line chart format, data is displayed as a polyline connecting points on the time axis. Bar chart is selected by default. |
Tenant |
The tenant for which data is displayed in the widget. You can select multiple tenants. By default, data is displayed for tenants selected in layout settings. |
Time period |
Period for which data is displayed in the widget. The default is As layout, meaning that data is displayed for the period selected for the layout. You can also specify a period for the widget in one of the following ways:
For details, see the Configuring a period subsection below. |
Show data for previous period |
Enable the display of data for two periods at the same time: for the current period and for the previous period. When using a Stacked Bar chart, the Show data for previous period setting is taken into account if the query contains standard aliases: |
Storage |
Storage that is searched for events. The list displays the available spaces. You can select only one storage, but you can select one or more spaces. The values in the Storage field are independent of the selected tenants in the Tenant field. The field displays storages and spaces, like in the Events section. If the user does not have access rights to one or more spaces of the storage, the widget cannot display information; the user cannot edit the widget, but can duplicate the widget using the Duplicate button. Duplication does not depend on access rights to spaces. If a template is duplicated in widgets that have spaces specified that are not accessible to the user, the value in the Storage field is reset. Such widgets display an error: Access denied (Operation returns no results because of allowed and selected event spaces). To save the template, you need to specify spaces in widgets. In widgets that have spaces that are accessible to the user, the value of the Storage field is not reset and is saved when the template is duplicated. If the user's email address is included in the list of recipients of the scheduled report, the user gets the full version of the report, regardless of which spaces are accessible. |
SQL query field |
Query for filtering and searching for events manually. You can create a query in Builder by clicking Use SQL builder. You can use extended event schema fields to create a chart of the table type. For detailed information on creating an SQL query in the query constructor, see below. The following limitations apply:
|
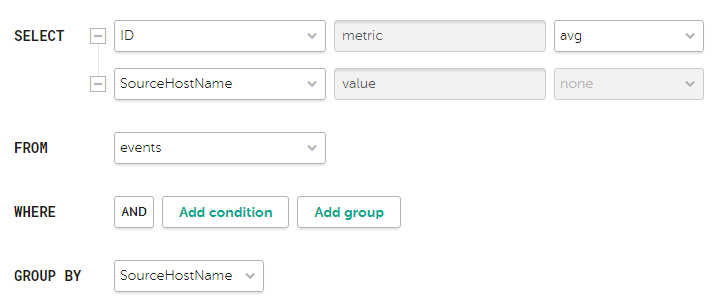
How to create a query in Builder
 .
.Example of search conditions in the query builder
Axes tab
The following table lists the settings on the Axes tab.
The tab is displayed if on the General tab in the Graph field you have selected one of the following values: Bar chart, Line chart, Date Histogram.
Description of parameters
Setting |
Description |
|---|---|
Point size |
Point size on the graph. This field is displayed for the Line chart graph type. |
Line-width |
Width of the line on the graph. This field is displayed for the Line chart graph type. |
Minimum and maximum values for the Y-axis |
Scale of the Y axis. Negative values can be displayed on chart axes. This is due to the scaling of charts on the widget and can be fixed by setting zero as the minimum chart values instead of Auto. |
Minimum and maximum values for the X-axis |
Scale of the X axis. Negative values can be displayed on chart axes. This is due to the scaling of charts on the widget and can be fixed by setting zero as the minimum chart values instead of Auto. |
Decimals |
Number of decimals to which the displayed value must be rounded off. |
Appearance tab
The following table lists the settings on the Appearance tab.
Description of parameters
Setting |
Description |
|---|---|
Name |
Name of the widget. |
Description |
Description of the widget. |
Show legend |
Displays a legend for the analytics. The toggle switch is turned on by default. |
Show nulls in legend |
Displays parameters with a null value in the legend for analytics. The toggle switch is turned off by default. |
Color |
The color used for displaying the information:
This setting is available for graphs such as Bar chart, Counter, Line chart, Date Histogram. |
Gradient |
Gradient fill of the chart:
You can adjust the direction of the fill by clicking the toggle direction icon ( This setting is available for charts such as Bar chart, Date Histogram(with the Bar chart time chart type), Table. |
Field for gradient indicator |
The column of the table in which the cells are to be gradient-filled. This setting is available for charts of the Table type. |
Horizontal |
Makes the histogram horizontal instead of vertical. When this option is enabled, when a widget displays a large amount of data, horizontal scrolling is not available and all available information is fit into the fixed size of the widget. If there is a lot of data to display, it is recommended to increase the widget size. |
Show total |
Shows sums total of the values. |
Period segments length |
Duration of the segments into which you want to divide the period. Available for graphs of the Date Histogram type. |
Scale |
Scale for displaying data. Available for a Stacked Bar chart. The following values are possible:
The default is Linear. |
Regression |
An option for indicating the average value on the chart. The following values are possible:
Available for the Date Histogram and Line chart types. |