Kaspersky Machine Learning for Anomaly Detection
- About Kaspersky Machine Learning for Anomaly Detection
- What's new
- Basic concepts of Kaspersky MLAD
- Kaspersky MLAD architecture
- Common deployment scenarios
- Telemetry and event data flow diagram
- Ports used by Kaspersky MLAD
- Installing and removing the application
- Installing the application
- Updating the application
- Backing up the application
- Rolling back the application to the previous installed version
- Scenario for restoring Kaspersky MLAD from a backup
- Getting started
- Starting and stopping Kaspersky MLAD
- Updating Kaspersky MLAD certificates
- First startup of Kaspersky MLAD
- Removing the application
- Kaspersky MLAD web interface
- Connecting to Kaspersky MLAD and terminating a user session
- Changing a user account password
- Selecting the localization language for the Kaspersky MLAD web interface
- Licensing the application
- Processing and storing data in Kaspersky MLAD
- System administrator tasks
- Managing user accounts
- Manage roles
- Managing incident notifications
- Configuring Kaspersky MLAD
- Configuring the main settings of Kaspersky MLAD
- Configuring the security settings of Kaspersky MLAD
- Configuring the Anomaly Detector service
- Configuring the Keeper service
- Configuring the Mail Notifier service
- Configuring the Similar Anomaly service
- Configuring the Stream Processor service
- Configuring the HTTP Connector
- Configuring the MQTT Connector
- Configuring the AMQP Connector
- Configuring the OPC UA Connector
- Configuring the KICS Connector
- Configuring the CEF Connector
- Configuring the WebSocket Connector
- Configuring the Event Processor service
- Configuring the statuses and causes of incidents
- Configuring logging of Kaspersky MLAD services
- Configuring time intervals for displaying data
- Configuring how the Kaspersky MLAD main menu is displayed
- Export and import of Kaspersky MLAD settings
- Managing assets and tags
- Creating an asset in the asset tree
- Changing the parameters of an asset in the asset tree
- Create tag
- Adding a tag to an asset
- Editing a tag
- Moving assets and tags
- Deleting an asset or tag
- Checking the current structure of tags
- Uploading tag and asset configuration to the system
- Saving tag and asset configuration to a file
- Working with the main menu
- Scenario: working with Kaspersky MLAD
- Viewing summary data in the Dashboard section
- Viewing incoming data in the Monitoring section
- Viewing data in the History section
- Viewing data in the Time slice section
- Viewing data for a specific preset in the Time slice section
- Selecting a specific branch of the ML model in the Time slice section
- Selecting a date and time interval in the Time slice section
- Navigating through time in the Time slice section
- Configuring how graphs are displayed in the Time slice section
- Working with events and patterns
- Working with incidents and groups of incidents
- Scenario: analysis of incidents
- Viewing incidents
- Viewing the technical specifications of a registered incident
- Viewing incident groups
- Studying the behavior of the monitored asset at the moment when an incident was detected
- Adding a status, cause, expert opinion or note to an incident or incident group
- Exporting incidents to a file
- Managing ML models
- Scenario: working with ML models
- Working with markups
- Working with imported ML models
- Working with manually created ML models
- Cloning an ML model
- Working with ML model templates
- Changing the parameters of an ML model
- Training a neural network element of an ML model
- Viewing the training results of an ML model element
- Preparing an ML model for publication
- Publishing an ML model
- Starting and stopping ML model inference
- Viewing the data flow graph of an ML model
- Removing an ML model
- Managing presets
- Managing services
- Troubleshooting
- When connecting to Kaspersky MLAD, the browser displays a certificate warning
- The hard drive has run out of free space
- The operating system restarted unexpectedly
- Cannot connect to the Kaspersky MLAD web interface
- Graphs are not displayed in the History and Monitoring sections
- Events are not transmitted between Kaspersky MLAD and external systems
- Cannot load data to view in the Event Processor section
- Data is incorrectly processed in the Event Processor section
- Events are not displayed in the Event Processor section
- Previously created monitors and the specified attention settings are not displayed in the Event Processor section
- A markup result is not displayed
- A Trainer service stopped message is displayed
- Training of an ML model element completed with an error
- The localization language for Help needs to be changed before connecting to the application
- Contacting Technical Support
- Limitations
- Appendix
- Settings of a .env configuration file
- Settings and example of the Excel file containing tag and asset configuration
- Example JSON file containing a preset configuration
- Example JSON file containing a configuration for the Event Processor service
- Viewing the Kaspersky MLAD log
- Special characters of regular expressions
- Cipher suites for secure TLS connection
- Glossary
- Information about third-party code
- Trademark notices
Working with the main menu > Viewing summary data in the Dashboard section
Viewing summary data in the Dashboard section
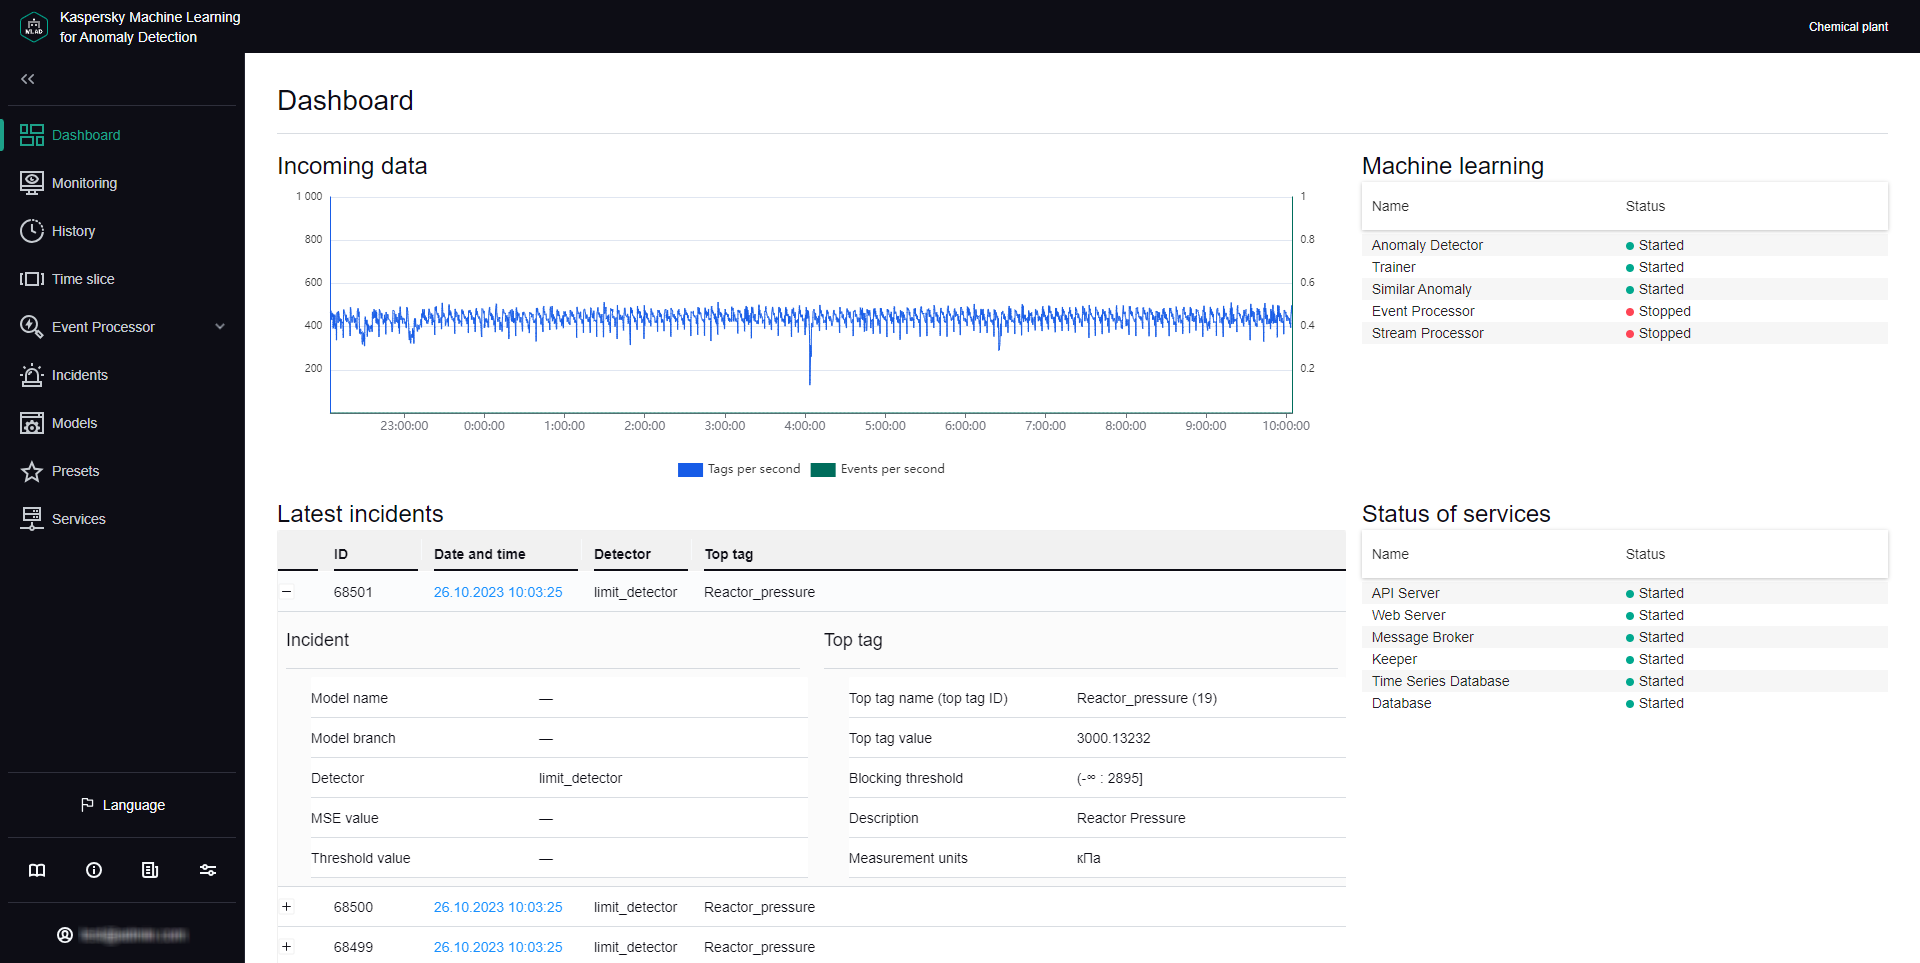
The Dashboard section provides summary information on the number of tags and events received by Kaspersky MLAD, registered incidents, and the status of services.
The information on the page is divided into the following blocks:
- Incoming data is a graph that displays the number of tags and events received by Kaspersky MLAD. You can enable or disable the display of incoming tags and events on the graph by clicking the corresponding data signature legend under the graph. The left scale of the graph displays the range for the number of incoming tags per second. The right scale of the graph displays the range for the number of incoming events per second.
- Latest incidents is a table that contains information about the latest registered incidents.
- ID refers to the ID of the registered incident.
- Date and time refers to the date and time when the incident occurred.
- Detector is the name of the detector that registered the incident.
- Top tag refers to the name of a technological process parameter for which the incident is registered.
Clicking the plus (
) next to the incident in the incidents table opens a window with the technical specification of the selected incident and tag:
- Incident is a section containing information about the incident:
- Model name refers to the name of the utilized ML model.
- Model branch is the name of the ML model branch being used.
- Detector is the name of the detector that registered the incident.
- MSE value is the value of the individual mean square error.
- Threshold value refers to the MSE threshold value for the ML model branch in use at the time of incident registration.
- Top tag is the section containing information about the tag for which the incident is registered:
- Top tag name (top tag ID) is the name and ID of the tag whose behavior invoked registration of the incident.
- Top tag value is the value of the top tag registered when the incident occurred.
- Blocking threshold refer to the thresholds of the top tag values, upon reaching which it is necessary for the ICS to take emergency response measures.
- Description refers to a description of the top tag.
- Measurement units refer to the units for measuring the top tag values.
- Machine learning is a table that displays the status of services used for operation and training of the ML model, and the name of the active ML model.
- Status of services is a table that displays the status of each service.
You can proceed to the History section from the Dashboard section by clicking the date and time of an incident in the Latest incidents table. The History section displays detailed information about the incidents registered by Kaspersky MLAD.
Dashboard section
Article ID: 248064, Last review: Dec 6, 2023