Working with events and patterns
The Event Processor section provides data on events and the structure of patterns detected by the Event Processor service in the event stream received from external sources or from the Anomaly Detector service.

In the Event Processor section, you can view the history of received events and the registration history of new and/or persistently recurring patterns. You can also configure the display of event parameters and can configure pattern registration settings. On the Monitoring tab, you can monitor specific events, patterns, or values of event parameters received by the Event Processor within the data stream from monitored assets.
If restarted, Kaspersky MLAD restores the state of the Event Processor service and pauses the processing of data received from the CEF Connector. This data is temporarily stored in the internal queue of the application message broker. Until the Event Processor service is restored, the Event Processor section tabs will display a notification informing you that the Event Processor service has stopped. This service restoration process may take several minutes if there is a significantly large number of processed events or registered patterns.
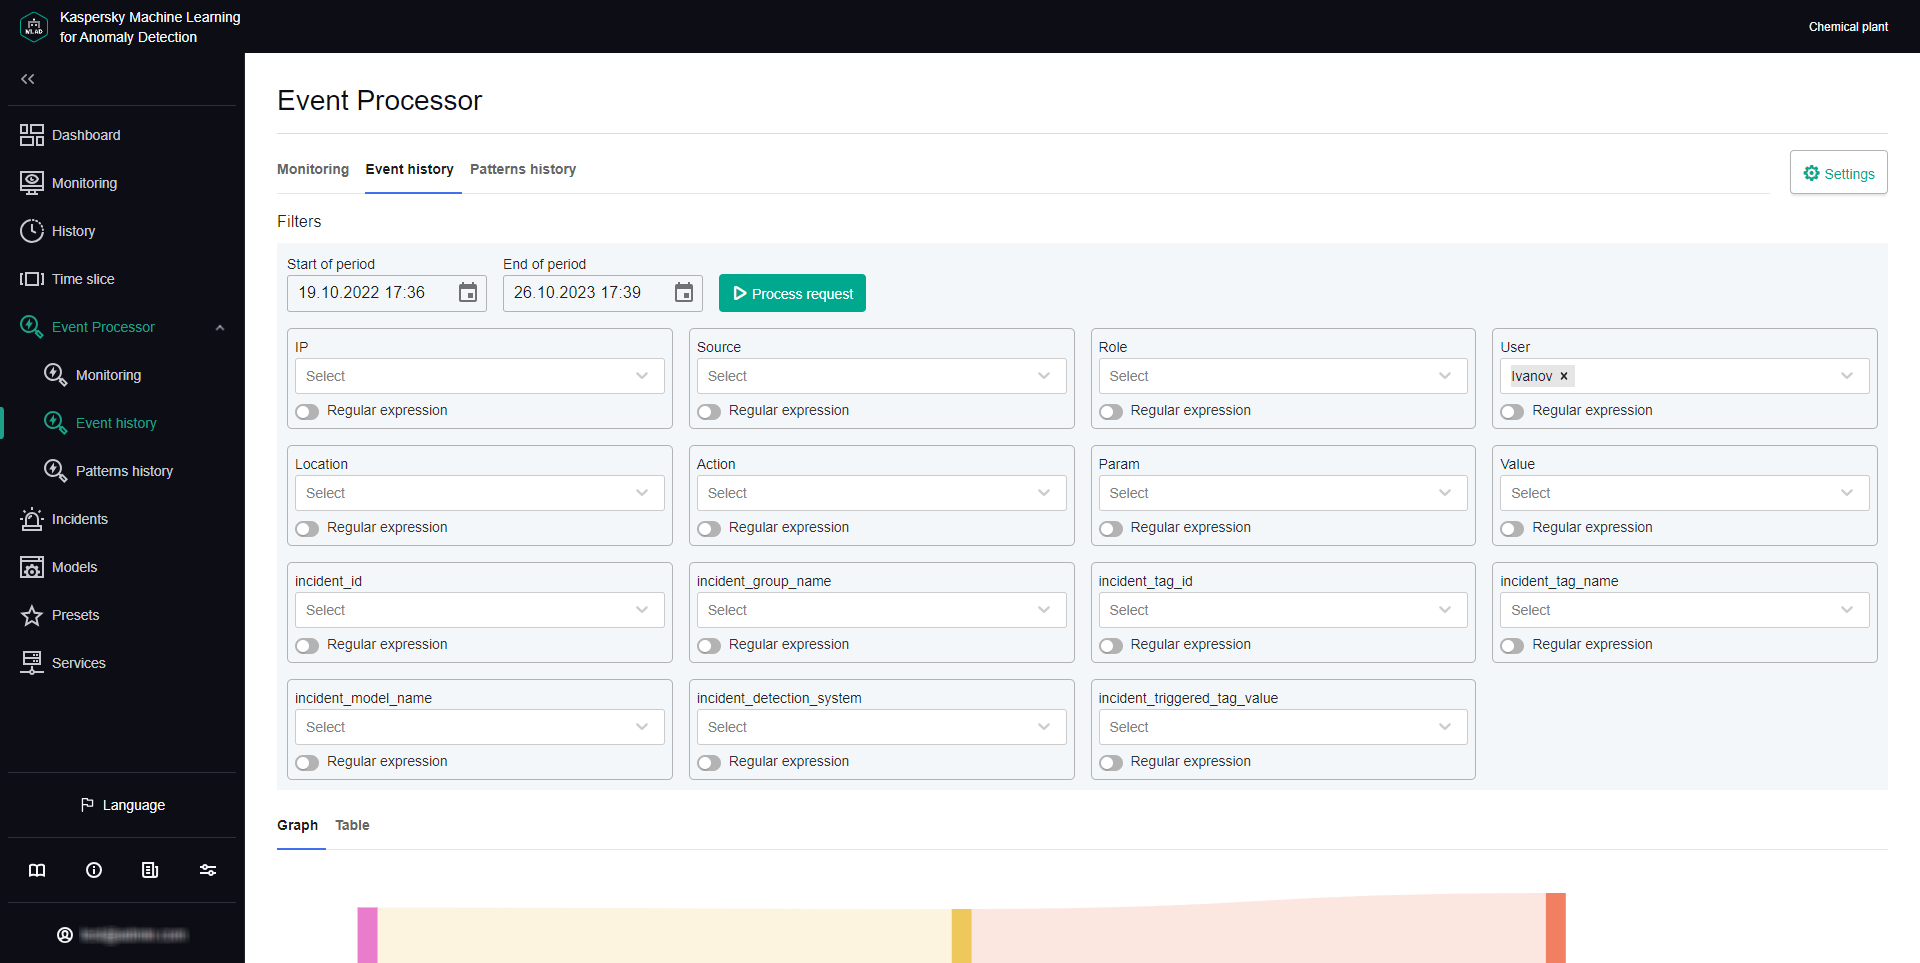
Event Processor section