Contents
Basic concepts of Kaspersky MLAD
This section contains expanded definitions of the basic concepts applied in Kaspersky MLAD.
Monitored asset hierarchical structure
The monitored asset hierarchical structure (also simply referred to as the hierarchical structure) is a method of organizing monitored asset data in the form of a tree, whose leaf nodes correspond to source tags and/or tags processed by the Stream Processor service.
Monitored asset tags are organized as a hierarchy of assets representing units, plants, shops, and factories. The number of assets depends on the structure of a specific monitored asset. Each asset has only one parent element. This element can be another asset (parent asset) or a head element of the hierarchical structure that corresponds to the monitored asset as a whole.
Tags and assets are the primary elements of a hierarchical structure. You can import or export an asset tree as an XLSX file, and create and manage them in the Assets section.
In addition to primary elements, the following functional elements can be added to the hierarchical structure in the process of or as a result of the operations of Kaspersky MLAD:
Page topTags
Tags are the main objects of observation in Kaspersky MLAD. A tag is a process parameter transmitted within the industrial network (for example, a controlled temperature). Measurements of physical parameters, as well as setpoints, commands, or states of control systems can be transmitted as tags. The values of tags are transmitted and received by the assets over specific protocols. The values of tags are displayed on graphs in the History and Monitoring sections and are also used to detect incidents.
Kaspersky MLAD provides the following types of tags:
Kaspersky MLAD supports several methods for obtaining telemetry data (tags). Depending on the monitored asset attributes and the tag transmission capabilities, you can select one of the following methods for receiving tags:
- Use the connectors of Kaspersky Industrial CyberSecurity for Networks that analyze mirrored traffic and send tags to Kaspersky MLAD in online mode. Kaspersky MLAD sends back information about detected incidents.
- Use the OPC UA Connector if the monitored asset provides the capability to transmit tags from ICS over the OPC UA protocol in the online mode.
- Use the MQTT Connector if the monitored asset provides the capability to transmit tags over the MQTT protocol and receive alerts about incident registration in the online mode.
- Use the AMQP Connector if the monitored asset has the capability to transmit tags over the AMQP protocol and receive alerts about incident registration in online mode.
- Use the WebSocket Connector if the monitored asset provides the capability to transmit tags over the WebSocket protocol and receive alerts about incident registration in the online mode.
- Use the CEF Connector if the monitored asset provides the capability to transmit tags using the CEF Connector technology and receive alerts about incident registration in the online mode.
- If the first four methods of tag transmission are not available, you can write a tag export script for using the HTTP Connector to configure a scheduled export of tags as CSV files over HTTP (for example, once per hour or once per minute).
ML models
An ML model is an algorithm based on machine learning methods tasked with analyzing the telemetry of the monitored asset and detecting anomalies.
An ML model is created for a specific monitored asset while taking into account the specifications of the asset and the characteristics of telemetry data. The general structure of the algorithm (architecture) is formed during creation of the ML model. Then the ML model is trained based on historical telemetry data and is thereby adjusted to the behavior of a specific object.
An ML model consists of one or several elements, each of which is an independent ML model. The overall result of the Anomaly Detector service is formed by combining the results of the ML model elements inference. Normally, the more complex the industrial processes of the monitored asset are, the more elements the ML model will contain.
Inference is the process of running telemetry data in an ML model to identify anomalous behavior. In Kaspersky MLAD, ML model inference can be performed on historical data (historical inference) and on telemetry data received in real time (streaming inference). If historical inference is started for multiple ML models, Kaspersky MLAD runs the inference of these ML models in the order of their startup queue. The duration of historical inference is determined by the time interval of the data analyzed by the ML model. If streaming inference is started for multiple ML models, Kaspersky MLAD runs the inference of these ML models simultaneously. Historical inference and streaming inference run in parallel and independently of each other.
During the inference process, the ML model registers incidents that can be viewed in the Incidents section.
ML models can be created by Kaspersky specialists or by a certified integrator as part of the Kaspersky MLAD Model-building and Deployment Service. To use such ML models, you must download them to Kaspersky MLAD. You can also create ML models independently and add the necessary elements to them using the model builder.
An ML model can include the following elements operating in parallel:
In Kaspersky MLAD, a ML model can be assigned one of the following statuses:
- Not activated: the ML model is imported but is not activated.
- Draft: the ML model is activated, or the ML model is created manually and contains untrained neural network elements.
- Trained: all the elements in the ML model are trained. Inference can be run on a trained ML model.
- Ready for publication: the ML model is prepared for publication and cannot be modified.
- Published: the ML model has been published. Inference can be run on a published ML model.
Element of an ML model based on a neural network
The most common type of ML model is a neural network, which predicts the behavior of an object based on data from its behavior in the recent past. This ML model is based on the Forecaster detector.
If the difference between the model prediction and the actual observed values exceeds a certain threshold, the Forecaster detector detects an anomaly in the monitored asset behavior and registers an incident. The cumulative indicator of the difference between the predicted values and the actual values (cumulative prediction error) is referred to as the MSE (mean squared error) in the user interface.
The MSE values graph and the MSE threshold which, when exceeded, causes the Forecaster to detect an incident, are displayed in the Monitoring and History sections under the tag graphs. If an ML model contains multiple elements, you can select a model element to view the MSE values calculated by that element.
Kaspersky MLAD model builder supports the following neural network architectures for elements of an ML model:
- Dense. Element of an ML model with a fully connected architecture. When creating an ML model element, you must specify the multipliers for calculating the number of neurons on inner layers and the activation functions on them.
- TCN. Element of an ML model with a hierarchical time-based convolutional architecture. When creating an ML model element, you must specify the activation function, filter size, extensions on layers, and the number of encoders.
- CNN. Element of an ML model with a convolutional architecture. When creating an ML model element, you must specify the number of convolutional layers, the size and number of filters on layers, and the size of the maximum sampling window (MaxPooling).
- RNN. Element of an ML model with a recurrent architecture. When creating an ML model element, you must specify the number of GRU neurons on layers and the number of time-distributed neurons on the layers of the decoder.
- Transformer. Element of an ML model with a transformer architecture. When creating an element of the ML model, the number of attention heads and the number of transformer encoders are specified.
Element of an ML model based on a diagnostic rule
Diagnostic rules describe previously known behavioral traits of the monitored asset that are considered anomalies. Diagnostic rules must be formalized and calculated based on available telemetry data for the object. Diagnostic rules are based on the Rule Detector.
Diagnostic rules are formulated by subject-area experts and are implemented by Kaspersky experts or a certified integrator as a JSON file in a serialized rule structure format. You can also formulate diagnostic rules on your own using the model builder.
Examples of diagnostic rules:
- The value of tag A does not change over the course of one minute.
- Over the past 12 hours, tag B has trended upward, tag C has trended downward, and tag D has not shown any clear dynamics.
- The value of tag X fell below 2800 after it previously rose higher than 2900.
ML model templates
ML model templates are created on the basis of ML models previously added to Kaspersky MLAD or created using the model builder functionality. ML model templates preserve the algorithm structure, set of elements, and the state of the ML model used to create the template. The training state of the created ML model will match the training state of the source ML model when the template was created.
Using templates, you can add ML models of the same type to Kaspersky MLAD. These models will analyze data received from equipment of the same type with a similar set of tags. When creating an ML model from a template, you can configure the use of other tags in the ML model by specifying tag IDs that differ from the ones in the source ML model.
Page topMarkups
A Markup is a set of time intervals specified for Tags according to certain rules. Markups are used to generate learning indicators and
of the ML model. Markups that form part of learning indicators define the data time intervals from which the ML model takes data for training. Markups that form part of inference indicators define the time intervals during which the ML model performs the inference.
Markup is a functional element of the hierarchical structure. Markups can be imported into Kaspersky MLAD together with an ML model, or they can be manually created.
Page topIncidents
An incident is a deviation from the expected (normal) behavior of a monitored asset identified by the anomaly detector.
Kaspersky MLAD supports multiple types of anomaly detectors: Forecaster, Rule Detector, and Limit Detector. The Forecaster Detector serves as the foundation for neural network elements of an ML model, while diagnostic rules are based on the Rule Detector. Each detector analyzes incoming telemetry data received from the monitored asset to identify deviations from normal behavior of the asset.
In addition to detecting deviations from normal object behavior, Kaspersky MLAD monitors the quality of incoming data. If the input data stream is terminated or interrupted for a specific tag, or observations that arrived at the application too soon or too late are detected in the input stream, the Stream Processor service registers incidents.
When a deviation is detected, the corresponding detector records the date, time and relevant deviation parameters, and saves this data as an entry in the Incidents section. If incident notifications for users or external systems are configured in Kaspersky MLAD, information about an incident is sent to the intended recipients via the corresponding services of Kaspersky MLAD.
Incidents detected by a neural network element of an ML model
An ML model neural network element based on the Forecaster detector is trained on a specific subset of tags and can predict the current behavior of tags. In this case, an incident is any substantial discrepancy between the observed (actual) values of tags and the predicted values of tags resulting from operations of the ML model element. In the model element settings, you can view which tags are analyzed by the neural network (Input tags parameter) and which tags' behavior is predicted (Output tags parameter).
An ML model built based on the Forecaster detector consists of one or several ML model elements that operate in parallel. In the History and Monitoring sections, you can select a specific branch of the ML model to display the incidents registered as a result of a specific model element operation on the MSE graphs. Registered incidents are displayed as color-coded dot indicators in the lower part of the MSE graph.
The MSE graph also displays the predicted tag values and MSEs for the selected element of the ML model. MSE (mean square error) is an indicator of the difference between predicted values from actual values, calculated cumulatively for all tags included in the selected element of the ML model. The higher the MSE value, the more the behavior of tags will differ from the expected (normal) behavior. The MSE threshold is the critical MSE value that, when exceeded, causes the Forecaster detector to register an incident. The MSE threshold on an MSE graph is shown as an orange line.
The MSE graph is displayed in the lower part of the History section (see the figure below).
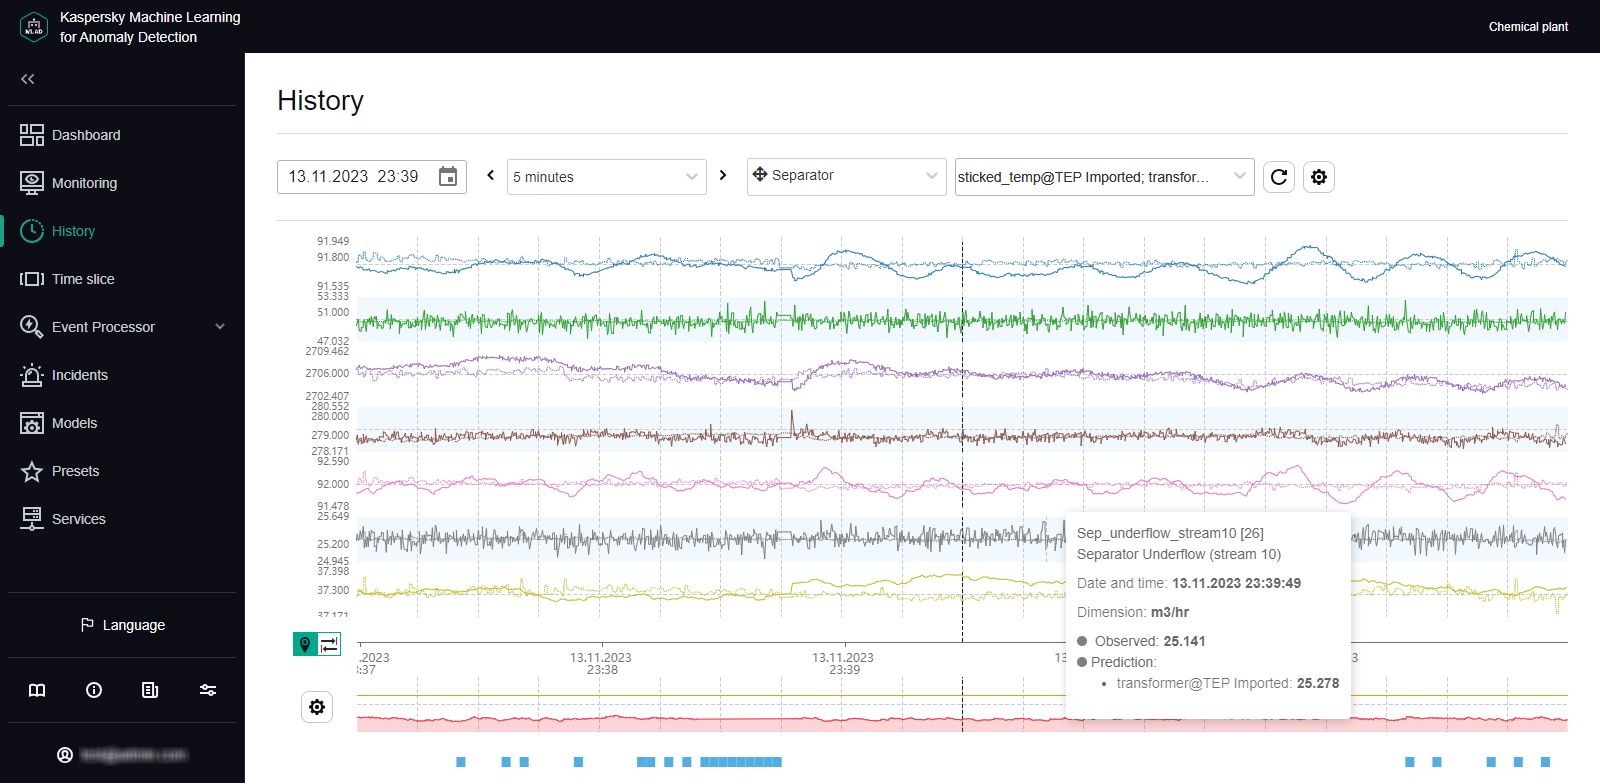
MSE graph in the History section
For each incident, the application automatically identifies the tags whose behavior had a stronger influence on incident registration. These tags are used to form the Tags for event #N preset, which is available for selection in the History section. Tags that are included in the Tags for event #N preset are sorted in descending order of their deviation from expected behavior. The first, most anomalous tag is also displayed in the incidents table in the Incidents section. The incidents table also indicates the MSE threshold and the actual MSE value at the moment when the incident was registered.
Information obtained when viewing the Tags for event #N preset is not actually diagnostic information for the purposes of identifying the causes of an incident, but you can still use this information when analyzing the values of tags with the largest deviations in behavior. The tag whose behavior was the first to deviate from the norm and caused subsequent deviations in other tags is referred to as the causal tag. In some cases, the causal tag may not be at the top of the list in the Tags for event #N preset and may even be entirely absent from this preset. This could happen due to the following reasons:
- Minor amplitude changes in the behavior of the causal tag had a multiplier effect and caused significant deviations in other tags that were included in the Tags for event #N preset.
- The causal tag is not analyzed by the ML model, and Kaspersky MLAD registers derivative changes in the behavior of tags caused by the deviation of the causal tag.
- Changes in the behavior of the causal tag had a delayed effect, and by the time an anomaly occurred in the operation of the monitored asset, the behavior of the causal tag returned to normal.
Incidents detected by an ML model element based on a diagnostic rule
An ML model element based on a diagnostic rule consists of one or more diagnostic rules. This element is based on the Rule Detector. Each diagnostic rule results in the following values being obtained that are calculated at each point in time:
- Value
0. The diagnostic rule was not triggered or applied at this moment. - Value
1. The diagnostic rule was triggered at this moment. - Intermediate values from
0to1are possible in individual cases. The diagnostic rule was partially triggered at this moment.
Whenever the received value reaches the threshold defined for a diagnostic rule (normally equal to 1), the Rule Detector registers an incident. For each incident registered by the Rule Detector, the application automatically creates the "Tags for event #N" preset, which is available in the History section. This preset contains the value obtained as a result of the work of the diagnostic rule, as well as the tags included in this rule.
To display graphs of values obtained as a result of the work of diagnostic rules, you can enable the display of predicted values of tags in the History section.
Page topIncidents detected by the Limit Detector
If the Limit Detector is enabled, Kaspersky MLAD automatically monitors all tags having blocking thresholds specified for the tag when using any ML model. Blocking thresholds can be defined in a tag configuration imported into Kaspersky MLAD at the start of operations. You can change the tag blocking thresholds when editing a tag.
To visually control the position of a tag graph relative to its blocking thresholds, enable the Always display blocking threshold option. If this option is disabled, the upper or lower threshold line is displayed only if the tag values have reached the corresponding threshold during the time interval displayed on the screen. The Limit Detector identifies and registers events regardless of whether or not the Always display blocking threshold option is enabled.
When the tag value reaches its upper or lower technical limit, the Limit Detector registers an incident. This tag is displayed in the incidents table in the Incidents section. The incidents table also shows the blocking thresholds of the tag and the actual value of a tag that violated one of these limits. For each incident registered by the Limit Detector, the application automatically creates the "Tags for event #N" preset, available in the History section. This preset includes the only causal tag of the incident.
Page topIncidents detected by the Stream Processor service
The Stream Processor service gathers real-time telemetry data received from the monitored asset at arbitrary points in time and converts this data to a uniform temporal grid (UTG). When analyzing incoming data, the Stream Processor service can detect losses of telemetry data and observations that were received by Kaspersky MLAD too early or too late. The Stream Processor service registers an incident in such cases.
Incidents detected by the Stream Processor service are displayed in the incidents table of the Incidents section. Each incident registered by the Stream Processor service is automatically assigned one of the following incident types:
- Clock malfunction – observations received by Kaspersky MLAD too early are detected.
- Late receipt of observation – observations received by Kaspersky MLAD too late are detected.
- No data – input data stream for a specific tag was terminated or interrupted.
The Stream Processor service transfers the UTG-converted data to the ML model of the Anomaly Detector service.
Page topAnomalies
An anomaly is any deviation in a monitored asset's behavior that is abnormal, not provided for by the current work procedure, and not normally caused by the industrial process.
Kaspersky MLAD registers only incidents. A specific incident can be identified as an anomaly only by an ICS specialist after conducting an analysis of incidents registered by the application. An incident analysis may result in one of the following conclusions:
- The incident is an anomaly that requires certain actions from a responding operator of the monitored asset.
- The incident is not actually an anomaly, but instead was a false positive by the triggered detector.
- The detector utilized in the ML model was correctly triggered but the incident is not an anomaly.
Incidents are analyzed and assessed by a subject-matter expert. In some cases, like when registering incidents detected by diagnostic rules or incidents that occur repeatedly, similar incidents can be automatically grouped and assessed.
The detector utilized in the ML model may fail to detect an actual anomaly. In this case, the anomaly will not be correlated to any registered incidents and will not be reflected in the Kaspersky MLAD history. If according to the expert or operator observations or external sources a detector is repeatedly not triggered, you need to identify the reason for the deteriorating quality of the detector, perform additional configuration, or conduct additional training of the ML model. Additional training of the ML model can be performed only by Kaspersky experts or certified integrators.
New
, , and values of the event parameters detected by the Event Processor service in the stream of incoming events can also indicate an anomaly in the operation of a monitored asset. When new events, patterns or values of event parameters are detected, the Event Processor service does not register incidents. To view new detections in the Event Processor section, you can view the history of registered patterns, filtering them by the New type. You can also create a monitor for tracking new events, patterns, or values of event parameters. The Event Processor service activates the monitor when it detects events, patterns, or event parameter values that match the specified search criteria. When the specified threshold for the number of monitor activations in a sliding window is reached, the Event Processor service sends an alert about the monitor activation to the external system using the CEF Connector. Page topEvent Processor
The Kaspersky MLAD Event Processor is designed to detect regularities in the form of recurring events and patterns in the stream of events received from monitored assets and from the Anomaly Detector service, as well as to detect new events and patterns. New events and patterns may indicate an anomaly in the monitored asset operation.
Events
Data received from monitored assets and from the Anomaly Detector service are processed as events by the Event Processor service. An event is a set of values describing a change in the monitored asset state according to a predefined list of parameters and the time when this change occurred. The set of event parameters depends on the monitored asset and is defined in the configuration file for the Event Processor service.
The Event Processor is designed to work only with categorical values of the event parameters. Event parameter values are converted to string type. Kaspersky MLAD uses the Anomaly Detector service to work with numeric values of telemetry data when processing the event stream. The system administrator can enable the processing of data received from the Anomaly Detector service when configuring the Event Processor service settings.
An event is a phenomenon distinct from other events. There may also be intervals of time during which no events have occurred. Event registration may be affected by such factors as the actions of personnel, changes in the asset operating mode at the facility, or the execution of ICS commands by a specialist.
Examples of situations that may lead to event registration in Kaspersky MLAD
An event is registered once by the Event Processor service. When an event stream is received, the Event Processor recognizes previously detected events. If events are found that do not match those previously detected, the Event Processor registers new events.
You can view the received events as a graph or a table. To view events, you need to upload them to Event Processor → Event history. Event parameters specified in the configuration file for the Event Processor service may not appear in all events received from the monitored asset. Thus, some parameters may be missing when you view the received events.
Patterns
The Event Processor detects regularities in the stream of events arriving from the monitored asset. These regularities are detected as a hierarchy of stable (persistently recurring) patterns, which can be either simple patterns (sequences of events) or composite patterns (sequences of patterns). The patterns that form a composite pattern are called subpatterns.
A sequence of events or patterns is considered recurrent if its constituent elements follow the same order, and the time intervals between similar elements in different sequences differ from each other by no more than a specific maximum range. The allowable range of intervals between the pattern elements is calculated considering the value of the Coefficient defining the permitted dispersion of the pattern duration parameter. Patterns are the result of the specific facility's adopted practices, prescribed procedures, or technical specifics of the industrial process.
The Event Processor presents the detected regularities as a layered hierarchy of nested elements (pattern structure) down to the event level. Events are the first layer elements, simple patterns are the second layer elements, and composite patterns are the third and higher layer elements. Event parameter values are elements of the null layer.
A pattern is registered once by the Event Processor service. When an event stream is received, the Event Processor recognizes previously detected patterns. If patterns are found that do not match previously detected regularities, the Event Processor registers new patterns.
New patterns also include the sequences of events or patterns with a deviation in the order or composition of subpatterns (for example, turning on an industrial unit before the operator has arrived at the workstation) or with significant changes in the intervals between events or subpatterns even though their sequence is preserved (for example, turning on an industrial unit immediately after or a lot later than the operator arrived at the workstation). Thus, the Event Processor registers patterns with a new structure.
New patterns may indicate an anomaly in the monitored asset operation. You can view the structure of the new pattern and examine its deviations from the structure of previously detected patterns.
If a newly identified sequence of events or patterns begins to repeat in a persistent manner, this sequence is converted to a stable pattern.
Page topAttention directions
The event stream from the monitored asset usually contains many unrelated events. The Event Processor service supports an attention direction mechanism to detect patterns based on a specific subset of events from the entire stream.
Attention is a special configuration of the Event Processor intended to track events and patterns for specific subsets of event history (attention directions). An attention direction is defined by the event parameter value that is common for all events of this direction. The Event Processor detects events and patterns only for the attention directions defined in the attention settings.
You can configure attention directions in the Event Processor section.
Page topEvent Processor operating modes
Kaspersky MLAD has the following operating modes of the Event Processor service:
- Online mode. In the online mode, the Event Processor processes the incoming stream as episodes. An episode is a sequence of events from the entire stream that is limited by a specific time period and/or the number of events. An episode is formed when one of the following conditions is fulfilled:
- The episode accumulation time reached the limit defined by the Interval for receiving batch events (sec.) parameter of the Event Processor service.
- The number of accumulated events reached the limit defined by the Batch size in online mode (number of events) parameter of the Event Processor service.
Based on an episode received in the event stream, the Event Processor service detects new and/or repeated (stable) events and patterns for each of the specified attention directions. You can configure attention directions in the Event Processor section.
When an event with the timestamp belonging to a previously processed episode is received, the Event Processor service does not revise the structure of patterns detected during the processing of that episode. The Event Processor service takes into account the events received by Kaspersky MLAD with a delay when detecting patterns during the event history reprocessing in the sleep mode.
- Sleep mode. To improve the quality and structure of the identified patterns, the Event Processor can switch to sleep mode according to the specified schedule. Processing of the event stream in the online mode is paused, and Kaspersky MLAD accumulates incoming events in the internal limited buffer on the server for subsequent processing after the application switches from the sleep mode back to online mode.
In sleep mode, the Event Processor re-analyzes sequences of events that were previously processed in online mode. To detect more complex pattern structures in the sleep mode, the Event Processor processes sequences of events during longer time intervals than the episode accumulation time in the online mode.
In the Event Processor service settings, you can configure a schedule for the sleep mode (for example, at the time when the event stream is least intense) and define a time interval for the events analyzed in the online mode to be forwarded for reprocessing in the sleep mode.
Monitors
A monitor is the source of notifications about patterns, events, or values of event parameters detected by the Event Processor according to the defined monitoring criteria. The monitoring criteria define a sliding time interval, the number of sequential detections, filters for event parameter values, and the condition for detecting new events, patterns, or event parameter values.
You can create monitors for alerts about the following detections in the event stream:
- Values of event parameters. You can create a monitor for alerts about the identification of new or previously encountered values of a specific event parameter. For example, to track new users on a monitored asset, create a monitor with the Parameter values subscription type and configure it to detect new values for the User parameter.
- Events. You can create a monitor for alerts about the identification of new or previously encountered events. You can also focus the attention of the Event Processor on a specific parameter of events. For example, to track new actions of a specific user at the monitored asset, you need to create a monitor with the Events subscription type and specify the name of the user whose actions you want to track in the User event parameter.
- Patterns. You can create a monitor for alerts about the identification of new or previously encountered patterns based on a specific attention direction. For example, to track regularities in the actions of a specific user at the monitored asset, create a monitor with the Patterns subscription type, focus the attention of the Event Processor on the User parameter, and set this parameter to the name of the user whose actions you want to track.
You can set fuzzy filters in the monitoring criteria. For example, you can create a monitor to track situations when a user (monitoring all values of the User parameter) accessed the accounting server (the value of the Server parameter) more than ten times (the value of the Threshold field) in the last five minutes (the value of the sliding time interval).
When events, patterns, or event parameter values matching the monitoring criteria are detected in the stream of incoming data, the Event Processor activates the monitor. Kaspersky MLAD displays information about the number of monitor activations when viewing a monitor, and sends to the external system alerts about the activation of monitors when the specified threshold is reached for a sliding window using the CEF Connector.
The custom monitors are displayed in the Event Processor section on the Monitoring tab.