Contents
Incidents
An incident is a deviation from the expected (normal) behavior of a monitored asset identified by the anomaly detector.
Kaspersky MLAD supports multiple types of anomaly detectors: Forecaster, Rule Detector, and Limit Detector. The Forecaster Detector serves as the foundation for neural network elements of an ML model, while diagnostic rules are based on the Rule Detector. Each detector analyzes incoming telemetry data received from the monitored asset to identify deviations from normal behavior of the asset.
In addition to detecting deviations from normal object behavior, Kaspersky MLAD monitors the quality of incoming data. If the input data stream is terminated or interrupted for a specific tag, or observations that arrived at the application too soon or too late are detected in the input stream, the Stream Processor service registers incidents.
When a deviation is detected, the corresponding detector records the date, time and relevant deviation parameters, and saves this data as an entry in the Incidents section. If incident notifications for users or external systems are configured in Kaspersky MLAD, information about an incident is sent to the intended recipients via the corresponding services of Kaspersky MLAD.
Incidents detected by a neural network element of an ML model
An ML model neural network element based on the Forecaster detector is trained on a specific subset of tags and can predict the current behavior of tags. In this case, an incident is any substantial discrepancy between the observed (actual) values of tags and the predicted values of tags resulting from operations of the ML model element. In the model element settings, you can view which tags are analyzed by the neural network (Input tags parameter) and which tags' behavior is predicted (Output tags parameter).
An ML model built based on the Forecaster detector consists of one or several ML model elements that operate in parallel. In the History and Monitoring sections, you can select a specific branch of the ML model to display the incidents registered as a result of a specific model element operation on the MSE graphs. Registered incidents are displayed as color-coded dot indicators in the lower part of the MSE graph.
The MSE graph also displays the predicted tag values and MSEs for the selected element of the ML model. MSE (mean square error) is an indicator of the difference between predicted values from actual values, calculated cumulatively for all tags included in the selected element of the ML model. The higher the MSE value, the more the behavior of tags will differ from the expected (normal) behavior. The MSE threshold is the critical MSE value that, when exceeded, causes the Forecaster detector to register an incident. The MSE threshold on an MSE graph is shown as an orange line.
The MSE graph is displayed in the lower part of the History section (see the figure below).
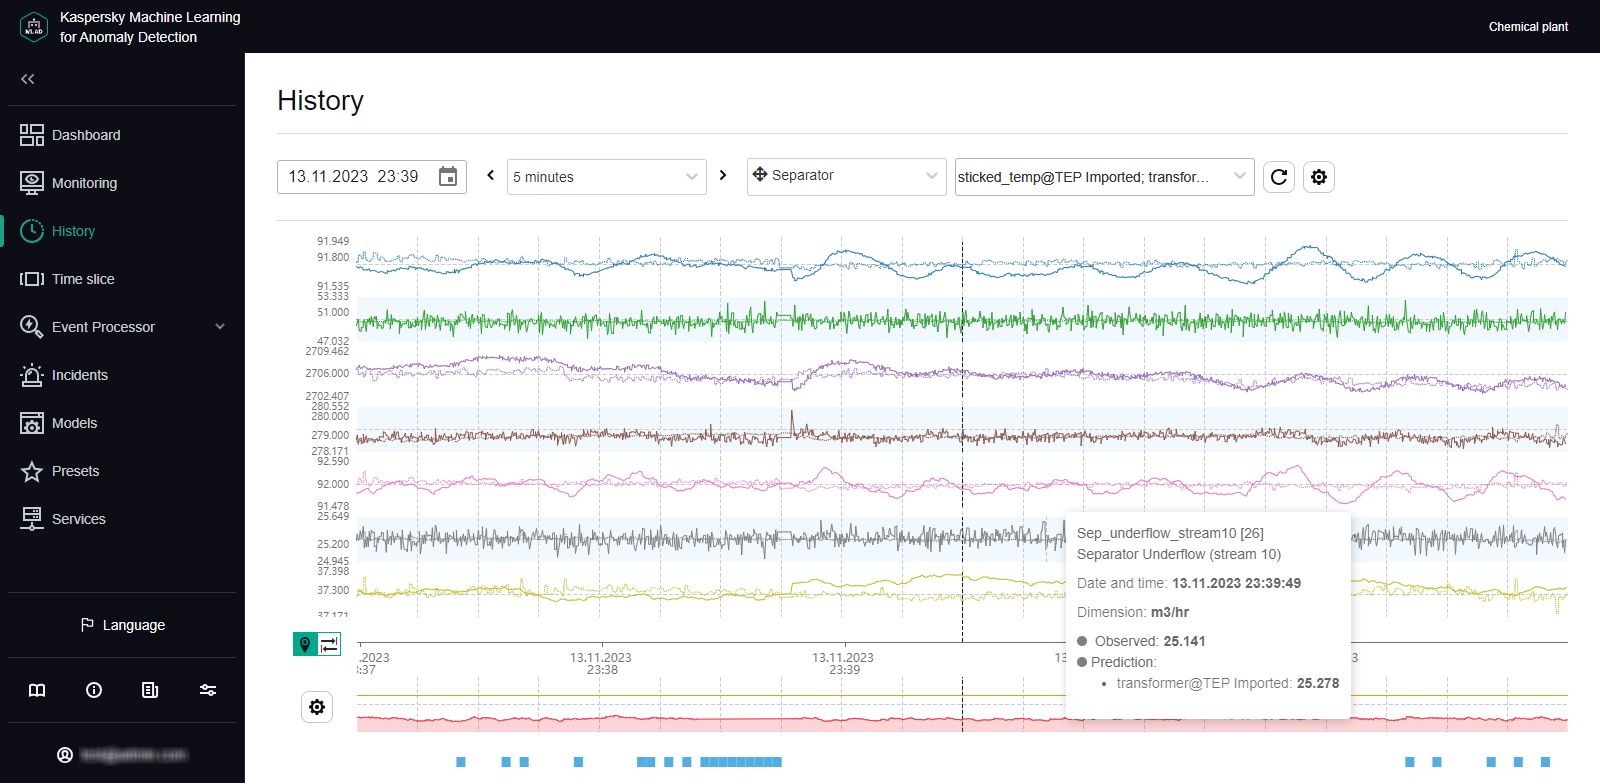
MSE graph in the History section
For each incident, the application automatically identifies the tags whose behavior had a stronger influence on incident registration. These tags are used to form the Tags for event #N preset, which is available for selection in the History section. Tags that are included in the Tags for event #N preset are sorted in descending order of their deviation from expected behavior. The first, most anomalous tag is also displayed in the incidents table in the Incidents section. The incidents table also indicates the MSE threshold and the actual MSE value at the moment when the incident was registered.
Information obtained when viewing the Tags for event #N preset is not actually diagnostic information for the purposes of identifying the causes of an incident, but you can still use this information when analyzing the values of tags with the largest deviations in behavior. The tag whose behavior was the first to deviate from the norm and caused subsequent deviations in other tags is referred to as the causal tag. In some cases, the causal tag may not be at the top of the list in the Tags for event #N preset and may even be entirely absent from this preset. This could happen due to the following reasons:
- Minor amplitude changes in the behavior of the causal tag had a multiplier effect and caused significant deviations in other tags that were included in the Tags for event #N preset.
- The causal tag is not analyzed by the ML model, and Kaspersky MLAD registers derivative changes in the behavior of tags caused by the deviation of the causal tag.
- Changes in the behavior of the causal tag had a delayed effect, and by the time an anomaly occurred in the operation of the monitored asset, the behavior of the causal tag returned to normal.
Incidents detected by an ML model element based on a diagnostic rule
An ML model element based on a diagnostic rule consists of one or more diagnostic rules. This element is based on the Rule Detector. Each diagnostic rule results in the following values being obtained that are calculated at each point in time:
- Value
0. The diagnostic rule was not triggered or applied at this moment. - Value
1. The diagnostic rule was triggered at this moment. - Intermediate values from
0to1are possible in individual cases. The diagnostic rule was partially triggered at this moment.
Whenever the received value reaches the threshold defined for a diagnostic rule (normally equal to 1), the Rule Detector registers an incident. For each incident registered by the Rule Detector, the application automatically creates the "Tags for event #N" preset, which is available in the History section. This preset contains the value obtained as a result of the work of the diagnostic rule, as well as the tags included in this rule.
To display graphs of values obtained as a result of the work of diagnostic rules, you can enable the display of predicted values of tags in the History section.
Page topIncidents detected by the Limit Detector
If the Limit Detector is enabled, Kaspersky MLAD automatically monitors all tags having blocking thresholds specified for the tag when using any ML model. Blocking thresholds can be defined in a tag configuration imported into Kaspersky MLAD at the start of operations. You can change the tag blocking thresholds when editing a tag.
To visually control the position of a tag graph relative to its blocking thresholds, enable the Always display blocking threshold option. If this option is disabled, the upper or lower threshold line is displayed only if the tag values have reached the corresponding threshold during the time interval displayed on the screen. The Limit Detector identifies and registers events regardless of whether or not the Always display blocking threshold option is enabled.
When the tag value reaches its upper or lower technical limit, the Limit Detector registers an incident. This tag is displayed in the incidents table in the Incidents section. The incidents table also shows the blocking thresholds of the tag and the actual value of a tag that violated one of these limits. For each incident registered by the Limit Detector, the application automatically creates the "Tags for event #N" preset, available in the History section. This preset includes the only causal tag of the incident.
Page topIncidents detected by the Stream Processor service
The Stream Processor service gathers real-time telemetry data received from the monitored asset at arbitrary points in time and converts this data to a uniform temporal grid (UTG). When analyzing incoming data, the Stream Processor service can detect losses of telemetry data and observations that were received by Kaspersky MLAD too early or too late. The Stream Processor service registers an incident in such cases.
Incidents detected by the Stream Processor service are displayed in the incidents table of the Incidents section. Each incident registered by the Stream Processor service is automatically assigned one of the following incident types:
- Clock malfunction – observations received by Kaspersky MLAD too early are detected.
- Late receipt of observation – observations received by Kaspersky MLAD too late are detected.
- No data – input data stream for a specific tag was terminated or interrupted.
The Stream Processor service transfers the UTG-converted data to the ML model of the Anomaly Detector service.
Page top