Contents
Viewing incoming data in the Monitoring section
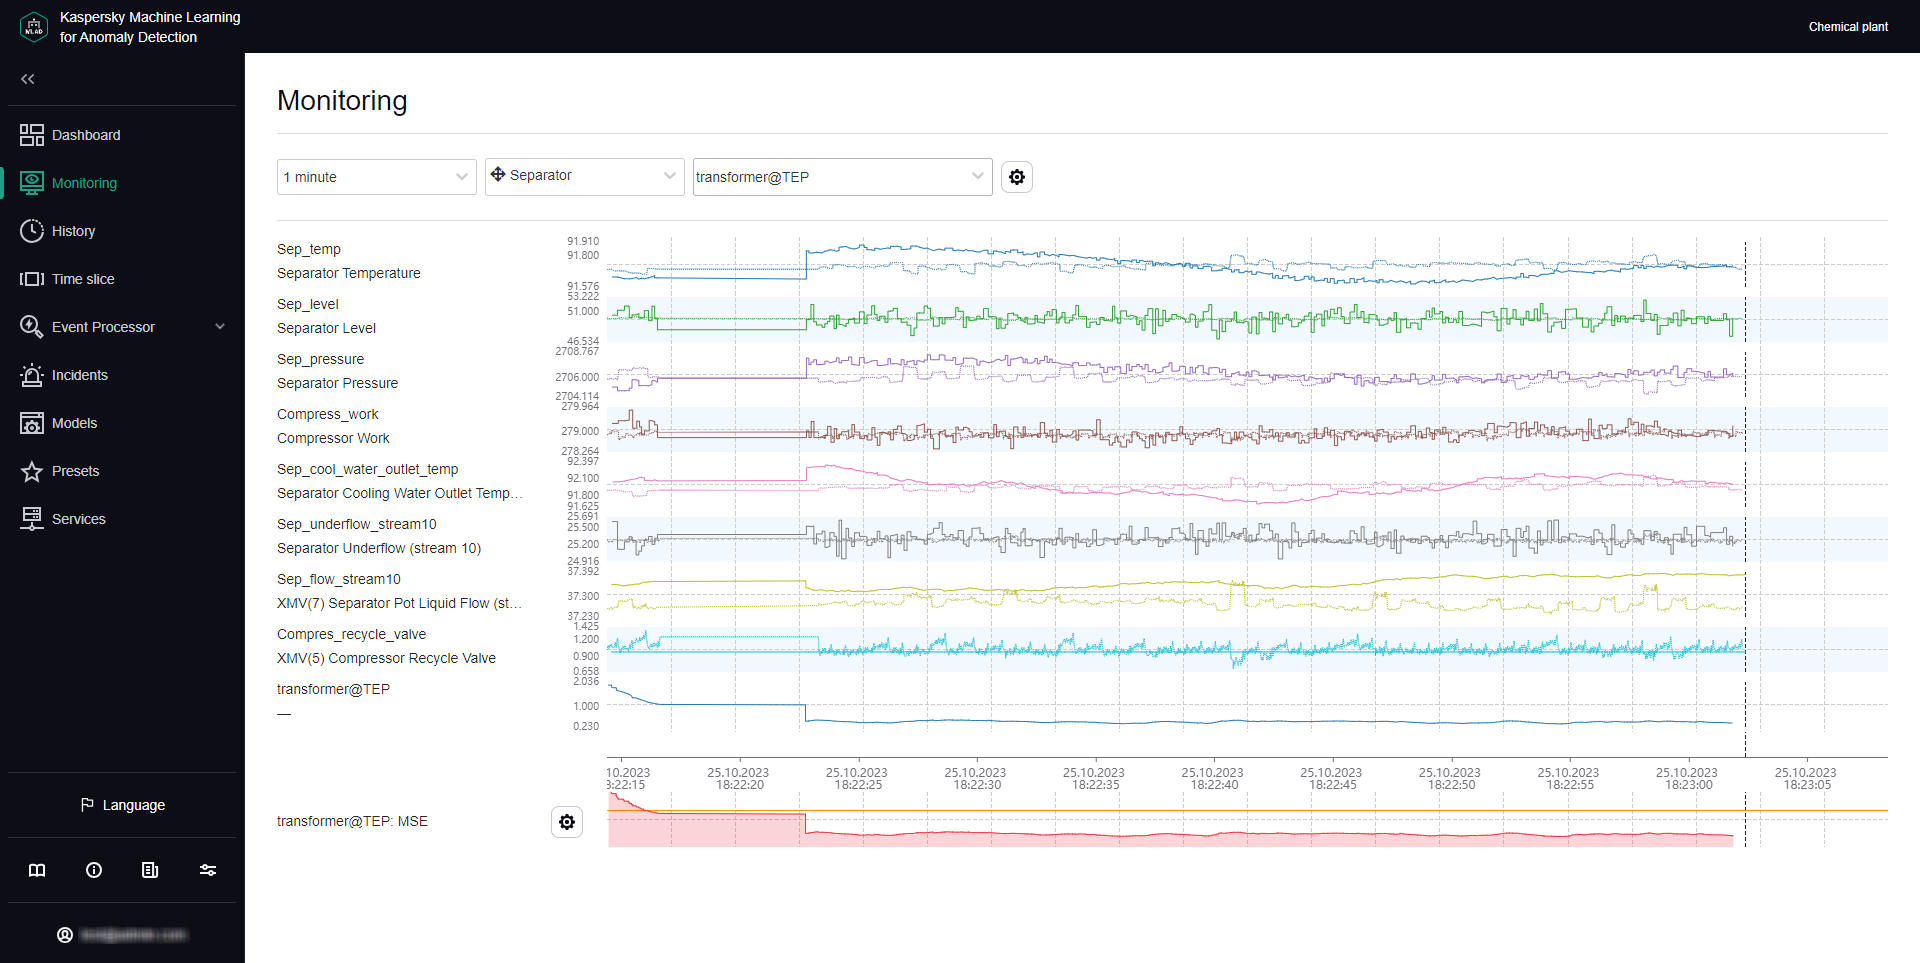
In the Monitoring section, you can view the real-time values of the tags included in the preset and their predicted values. You can view data on relevant tags by selecting the necessary preset from the drop-down list. This list includes presets that can be created in the Presets section. For each tag included in the selected preset, the incoming values are displayed as a graph. You can customize the display of graphs and select a branch of a specific ML model to view the operating results of this branch. For example, you can view the tag values predicted by the Forecaster Detector and their errors, or the values obtained as a result of the work of diagnostic rules.
The lower part of the page contains a section displaying the cumulative mean square error (also referred to as the "MSE" or "cumulative error"), and the number of registered incidents (color-coded dot indicators). The orange line shows the MSE threshold, above which Kaspersky MLAD registers an incident.
Depending on the selected time scale and the density of incidents, one dot indicator may correspond to one or multiple closely-spaced incidents that were registered by one or multiple different detectors. The color of dot indicators corresponds to the color of the ML model branch that was used to register the incident. Special colors are reserved for dot indicators that correspond to a group of incidents registered by different branches and for incidents registered by the Limit Detector.
There will be no MSE error value for incidents logged by the Rule Detector. When analyzing these incidents, pay attention to the rule triggering marker (color-coded dot indicator) below the MSE graph for the selected ML model branch.
Monitoring section
Viewing data for a specific preset in the Monitoring section
Kaspersky MLAD allows you to select presets for which real-time data is displayed.
To view incoming data for a specific preset in real time:
- In the main menu, select the Monitoring section.
- On the opened page, select the relevant preset from the Preset drop-down list.
The page displays graphs for tags that are included in the selected preset.
If necessary, you can change the time interval for displaying data, customize the display of graphs, or select a specific branch of the ML model. You can also change which tags are displayed by editing the preset.
Page topSelecting a specific branch of the ML model in the Monitoring section
In the Monitoring section, you can view in real time the incoming values of tags included in the preset, their predicted values, and MSEs.
If the ML model used for a monitored asset has several branches for processing and predicting data, Kaspersky MLAD lets you select a specific branch of the ML model to display the operating results of the corresponding model element:
- For an ML model branch based on the Forecaster Detector, operating results are displayed as predicted values for specific tags, individual errors in the prediction of specific tags, and cumulative MSE and dot indicators of incidents registered by the detector.
- For an ML model branch based on the Rule Detector, operating results are presented as values obtained as a result of the work of diagnostic rules and dot indicators of incidents.
- An ML model branch is not created for the Limit Detector. The dot indicators of incidents registered using this detector are displayed if use of the Limit Detector is enabled and the display of indicators for all tags is enabled.
To display the predicted values of a tag on graphs in the Monitoring section, and to display the values obtained as a result of the work of diagnostic rules, you must customize the display of graphs.
To view the operating results of a specific ML model branch:
- In the main menu, select the Monitoring section.
- On the opened page, in the Model branch drop-down list, select the check boxes next to the relevant branches of the ML model.
The names of the selected branches are displayed in the field.
The branches belonging to the currently used ML model are located in the upper part of the list. The lower part of the list displays branches of other currently unused ML models that were uploaded to Kaspersky MLAD. An ML model branch is displayed in the drop-down list only after Kaspersky MLAD receives data that resulted from operations of the specific branch.
The graphs of the selected preset will display the predicted values of tags or the values obtained as a result of the work of diagnostic rules depending on the type of detector in the selected ML model branch.
If you need to hide the display of operating results from previously selected ML model branches, clear the check boxes next to these branches (however, one of the branches must remain active for graphs to be displayed in the Monitoring section).
- If you need to display the MSE received as a result of data processing by a specific ML model branch:
- Click the settings button
 below the tag graphs on the left side of the page.
 - In the MSE graph display settings pane that appears on the right, select the branch from the Model branch drop-down list. You can select only one ML model branch from the list.
- Click the Close button.
- Click the settings button
The MSE graph displays the MSE values for the selected branch of the ML model. The lower part of the graph displays the dot indicators of incidents that were registered by the selected ML model branches. If the display of indicators for all tags is enabled, the dot indicators of incidents that were registered by all ML model branches will be displayed.
Page topSelecting a time interval in the Monitoring section
Kaspersky MLAD lets you select the time interval (scale) for displaying incoming data.
To select a time interval:
- In the main menu, select the Monitoring section.
- On the opened page, select the necessary time interval from the drop-down list. The following values are available by default:
- 1, 5, 10, 15, and 30 minutes
- 1, 3, 6, and 12 hours
- 1, 2, 15, and 30 days
- 3 and 6 months
- 1, 2, and 3 years
If necessary, the system administrator can create, edit, or delete time intervals.
The page will display graphs of the defined preset for the selected time interval.
Page topConfiguring how graphs are displayed in the Monitoring section
Kaspersky MLAD lets you configure how the graphs of presets are displayed in the Monitoring section.
To configure the display settings for preset graphs:
- In the main menu, select the Monitoring section.
- On the opened page, click the settings button in the upper part of the screen.
The Graph display settings pane will appear on the right.
- In the Graph height drop-down list, select one of the following values: 55 px, 110 px, 145 px, 190 px.
By default, the Graph height parameter is set to 55 px.
- In the To go to the History section, use drop-down list, select the preset whose graphs should be displayed by default when you navigate to the History section.
- If necessary, move the Show observation graphs in selected color toggle button to enable the display of tag observation graphs in a specific color, and select the color in the Color of observation graphs field.
- If necessary, use the Show prediction graphs in selected color toggle switch to enable the display of tag prediction graphs in a specific color, and select the color in the Color of prediction graphs field.
- If necessary, use the Tag description and name toggle switch to enable display of the tag description and name on graphs.
- If necessary, use the Predicted tag value toggle switch to enable the display of the predicted tag value and values obtained as a result of the work of diagnostic rules on graphs.
- If necessary, use the Personal tag error toggle switch to enable display of the personal tag error on graphs.
- If necessary, use the Display indicators for all incidents toggle switch to enable display of the dot indicators for incidents registered by all ML model branches.
If this mode is disabled, only the dot indicators for incidents that were registered by the selected ML model branches will be shown.
- If you need the graphs to display the defined technical limits for a tag:
- Turn on the Blocking threshold toggle switch.
- If you need to always display the defined technical limits, turn on the Always display blocking threshold toggle switch.
If this mode is disabled, the technical limits will be displayed only if the tag value has reached the corresponding limit in the graph area displayed on the screen.
- If necessary, use the Additional threshold lines toggle switch to enable the display of additional threshold lines on the graph.
- Click the Close button to return to viewing graphs in the Monitoring section.
The defined settings for displaying preset graphs in the Monitoring section will be applied.
Page top