Contents
- Working with incidents and groups of incidents
- Scenario: analysis of incidents
- Viewing incidents
- Viewing the technical specifications of a registered incident
- Viewing incident groups
- Studying the behavior of the monitored asset at the moment when an incident was detected
- Adding a status, cause, expert opinion or note to an incident or incident group
- Exporting incidents to a file
Working with incidents and groups of incidents
In Kaspersky MLAD, an ML model can simultaneously use multiple types of detectors that analyze incoming telemetry data and detect incidents independent of each other. The Kaspersky MLAD web interface provides the capability to investigate detected incidents. Depending on the type of detector that registered an incident, information about the incident and the methods you can use to investigate it may differ.
You can perform the following actions for any incident:
- Analyze the incident details.
- Find out if any similar incidents were detected previously.
- Study the behavior of the monitored asset at the moment when the incident was detected.
- Leave a note or expert opinion for a registered incident or incident group.
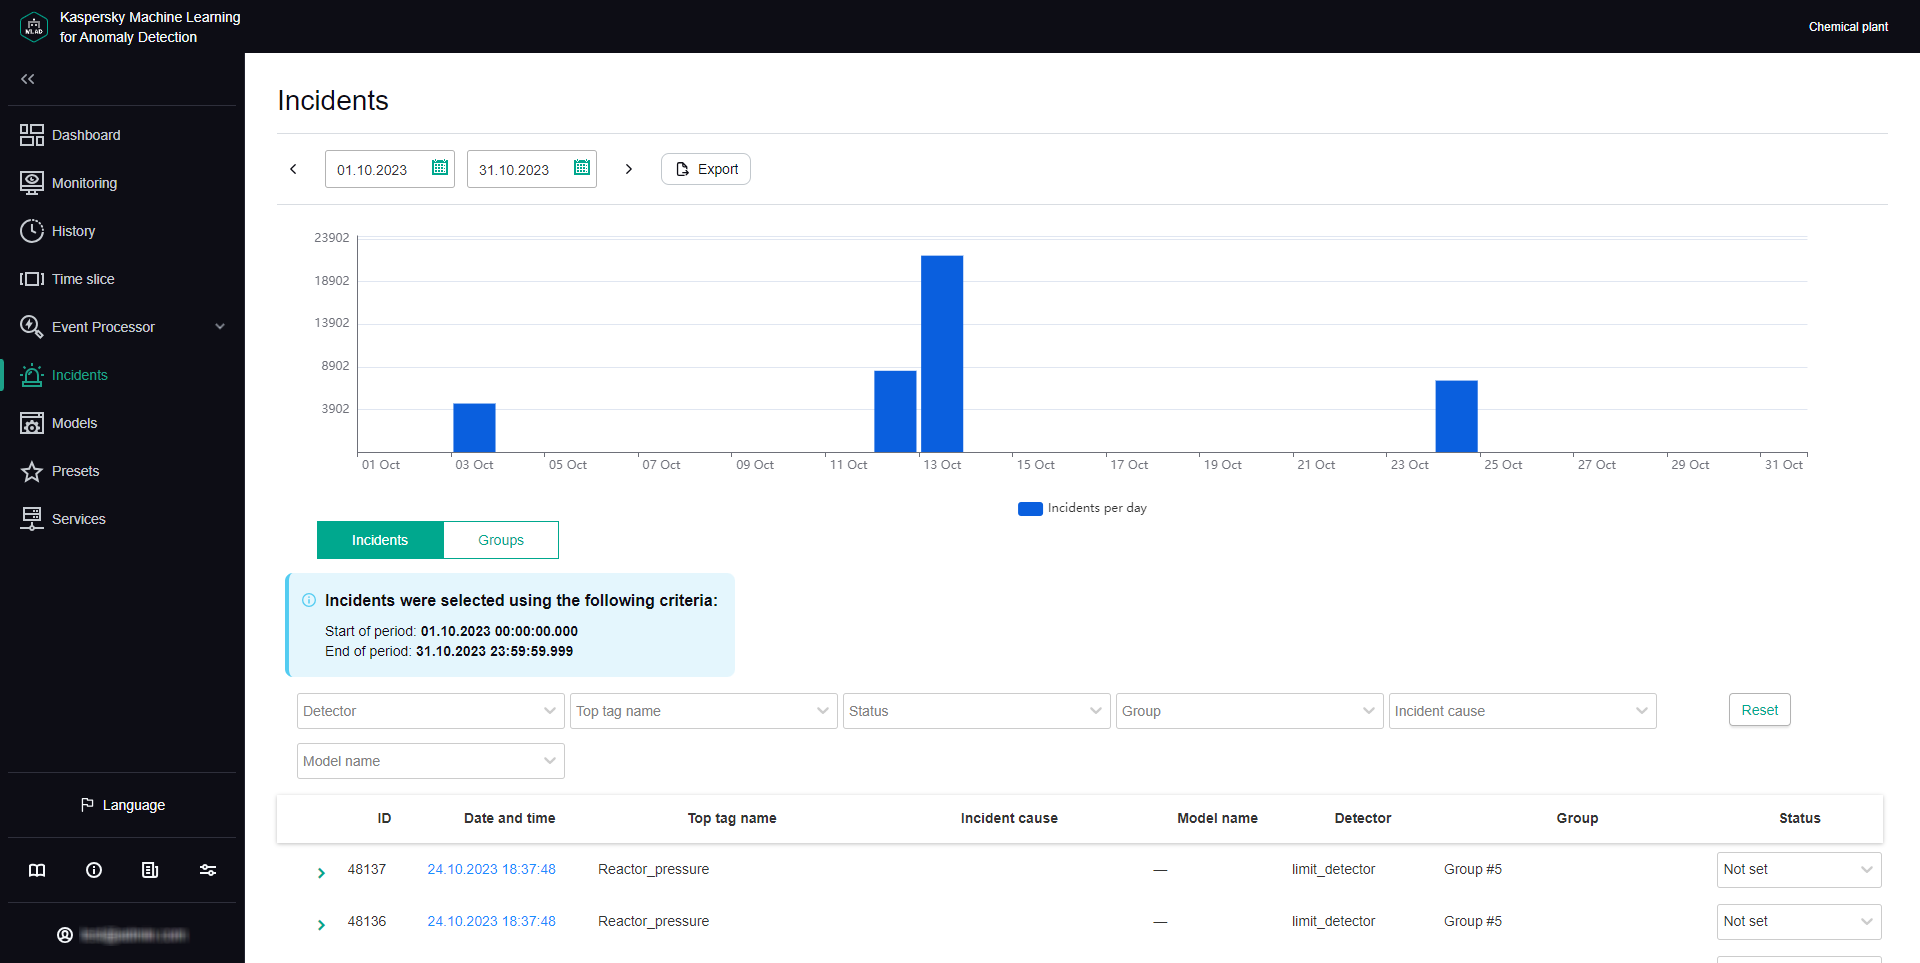
The Incidents section displays a column graph showing the incidents that match the filtering criteria specified under the graph. The graph displays statistics on the registered incidents for the period specified above the graph.
The graph can display up to 60 bars. If the specified period does not exceed 60 days, incidents on the graph are grouped by days. If the specified period is between 60 days and 60 weeks, incidents on the graph are grouped by weeks. If the specified period is longer than 60 weeks, incidents on the graph are grouped by months.
Hovering the mouse pointer over a bar of the graph displays a window showing the number of registered incidents per corresponding time period. Upon clicking a bar, the graph and in the table below display information about the incidents registered during the corresponding time period.
In this section, you can view individual incidents as well as groups of incidents.
Incidents tab
The Incidents tab shows a table of registered incidents. Incidents are sorted by date in descending order, with the newest incidents shown first.
Incidents tab
You can go to the History section by clicking the date and time of the incident.
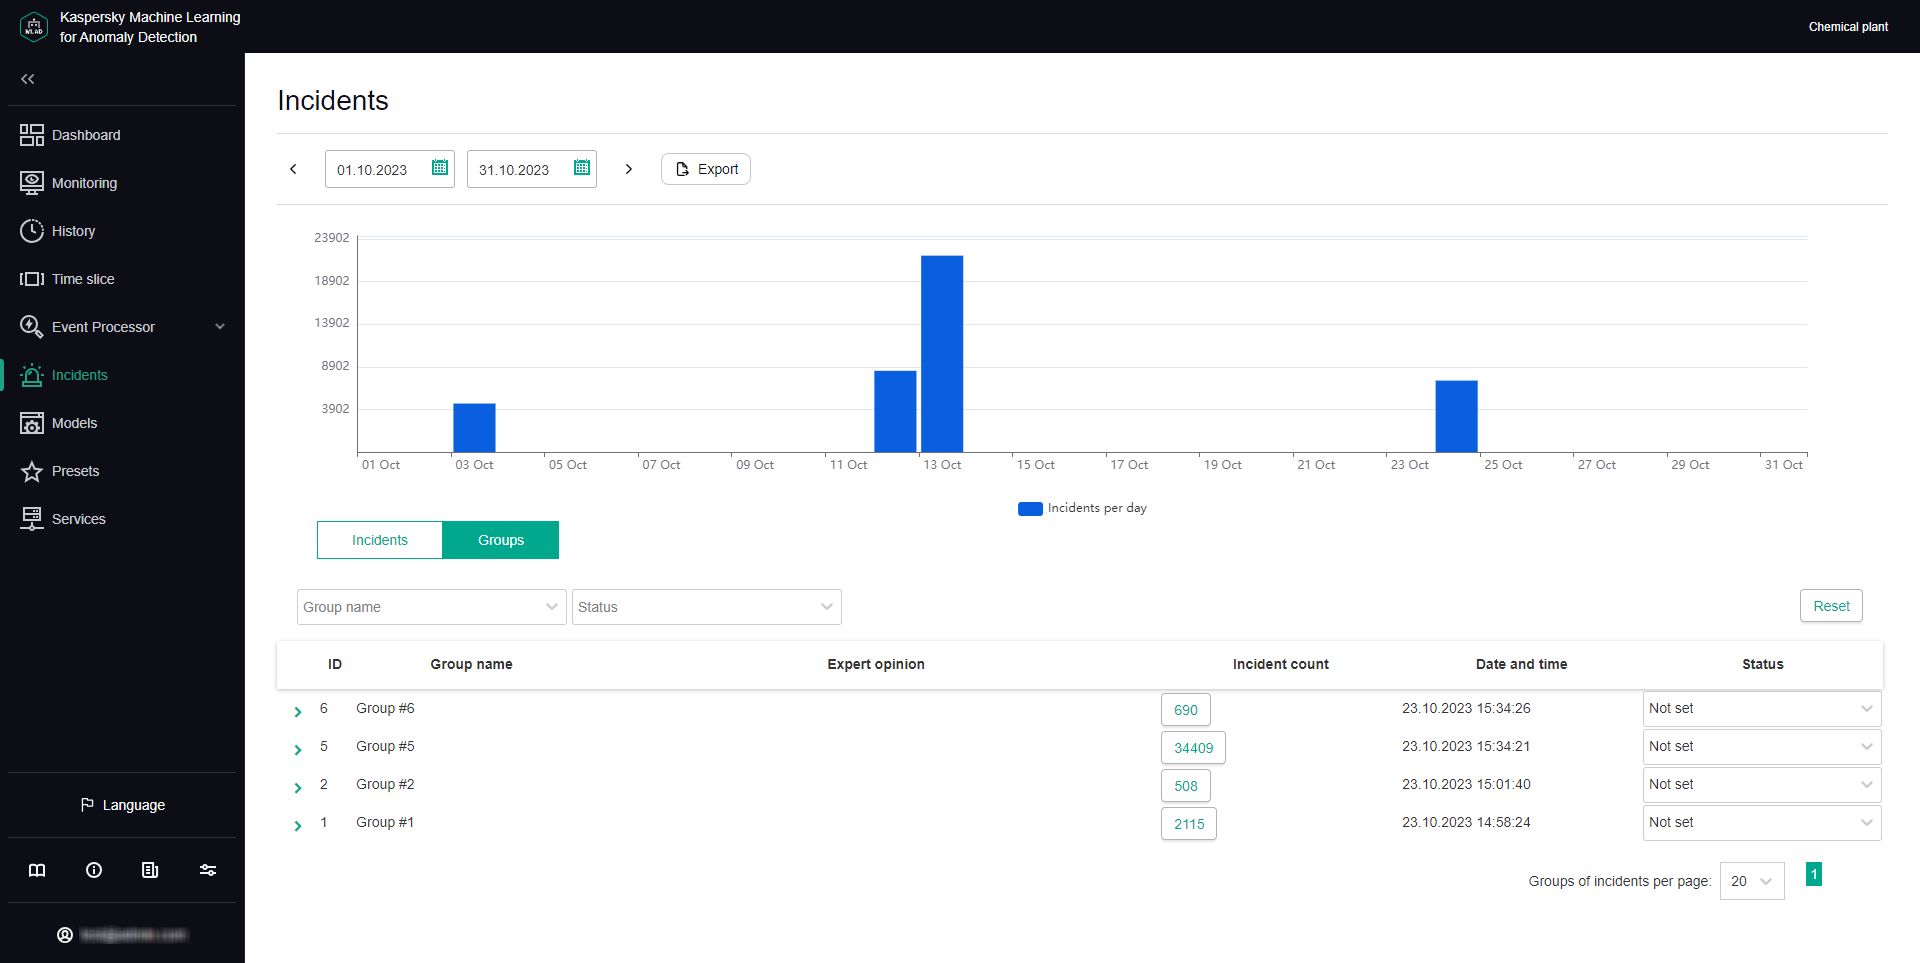
Groups tab
The Groups tab shows a table of incident groups. Kaspersky MLAD automatically generates groups of similar incidents.
You can change the group name that was assigned automatically and set the status of incidents that belong to this group. You can also provide an expert opinion that contains the recommended actions to take in response to new incidents in this group, for example.
Groups tab
Scenario: analysis of incidents
This section describes the sequence of actions required when analyzing incidents registered by Kaspersky MLAD.
The incident analysis scenario described in this section is not a precisely regulated procedure. The specific scope and sequence of actions taken to investigate an incident and identify its cause depend on the particular subject area, the knowledge level of the process engineer or ICS expert investigating the incident, and the availability of additional information on the monitored asset.
The incident analysis scenario consists of the following steps:
- Viewing information about a registered incident
The Incidents section displays all incidents registered by Kaspersky MLAD, and provides detailed information about their registration time, the detector that registered the incident, and an expert opinion if one was added. You can proceed to view incident information in one of the following ways:
- Viewing the latest incidents in the Dashboard section
If you want to view a recently detected incident, in the Dashboard section, click the date and time of the relevant incident in the Latest incidents table. In the History section that opens, in the lower part of the page, click the dot indicator in the MSE section to view a specific incident. The Incidents section opens showing only the incidents that were registered in the specific time interval represented by the selected dot indicator (the interval is displayed above the incidents table).
- Viewing incidents in the Incidents section
If you know the date and time when an incident was registered, select the corresponding incident in the Incidents section. You can change the time interval for the displayed incidents by using the bar graph or the date selection field in the upper part of the page.
- Navigating from an incident notification received by email
If an incident notification was created for you, you will receive the notification by email when an incident is registered. The email message contains the time when the incident began, the most anomalous tag, and a link to proceed to the History section in the Kaspersky MLAD web interface. You can use this link to proceed to the start of the incident in the History section. At the bottom of the History page, click on the dot indicator in the MSE section according to the incident start time. The Incidents section opens showing only the incidents that were registered in the specific time interval represented by the selected dot indicator (the interval is displayed above the incidents table).
When you find a record about the required incident, click the right arrow (
 ) to view detailed information about the incident.
 - Viewing the latest incidents in the Dashboard section
- Viewing information about similar incidents
When two or more similar incidents are detected, Kaspersky MLAD automatically combines them into a group. In the incidents table in the Incidents section, the group associated with the incident is displayed in the Group column. If nothing is indicated for the selected incident in this column, this means that Kaspersky MLAD has not yet detected incidents similar to this particular incident.
To view all incidents in a group, select the Groups tab and click the right arrow (
) next to the relevant group. The table displays information about the incidents assigned to the selected group, as well as an expert opinion if it was added. Read the expert opinions for individual incidents and for the group. - Studying the behavior of the monitored asset at the moment when an incident was detected
Study the behavior of the monitored asset at the moment when the incident was detected.
- Analyzing the incident
Analyze the incident while considering the specific details of incident registration depending on the type of detector that registered the incident:
- Forecaster. The neural network element of the ML model registers incidents when deviations in the behavior of the monitored asset are detected. Based on information obtained when viewing the automatically generated Tags for event #N preset and considering the available expert knowledge on the monitored asset, form a hypothesis regarding which tags could have caused the incident and select the appropriate preset after studying their behavior. Analyze the MSE graph, move back in time from the moment the MSE threshold was reached, and examine the behavior of tags at the moment when the MSE values started to grow.
- Rule Detector. For each incident registered by elements of the ML model on the basis of a diagnostic rule, the Tags for event #N preset is automatically generated, which includes the value obtained as a result of the diagnostic rule operation and which caused the incident registration.
- Limit Detector. For each incident that was registered by the Limit Detector, the application automatically creates the Tags for event #N preset, which includes a single causal tag for the incident.
- Stream Processor. The Stream Processor service registers incidents up until telemetry data is transmitted to the ML model for processing. Incidents are registered if data loss is detected or if observations are received by Kaspersky MLAD too early or too late.
- Adding a status, cause, expert opinion or note to an incident or its incident group
For each incident, add an expert opinion or note in which you can specify whether the incident is an anomaly. An expert opinion and note for an incident are displayed only when viewing a specific incident. If necessary, you can specify the status and cause of an incident. The cause of an incident is displayed in the incidents table and when viewing a specific incident. You can also add or edit the status and expert opinion for a group of incidents.
Viewing incidents
To view incidents that were registered on a specific date:
- In the main menu, select the Incidents section.
- In the upper part of the opened page, on the bar graph, click the graph column for the relevant date.
- If necessary, filter incidents by detector, top tag, status, group, or incident cause by selecting relevant values in the corresponding drop-down list.
The table located in the central area of the page shows the incidents registered on that day according to the specified filtering criteria. When you click the Reset button, the table and the bar graph show all registered incidents.
The following information is displayed for each incident in the table:
- ID refers to the ID of the registered incident.
- Date and time refers to the date and time when the incident was registered.
Clicking the incident registration date opens the History section, where you can view information about the "Tags for event #N" preset generated for the registered incident.
- Top tag name refers to the name of the process parameter for which the largest deviation from the prediction was recorded at the time of incident registration.
- Incident cause refers to the cause of a logged incident added by the expert (process engineer or ICS specialist) after incident analysis or defined by the ML model.
- Model name refers to the name of the ML model whose element registered the incident.
- Detector refers to the name of the detector that identified an anomaly and registered the incident: Forecaster, Limit Detector, Rule Detector, Stream Processor.
- Group refers to the name of the incident group to which the registered incident belongs.
If two or more similar incidents are detected, they are combined into a group that is created automatically by using the Similar Anomaly service. You can view only those incidents included in the group by selecting the group name from the drop-down list.
- Status refers to the status of a logged incident specified by the expert (process engineer or ICS specialist) after incident analysis or defined by the ML model.
You can set the incident status based on analysis results by selecting the appropriate value from the drop-down list. After installation of Kaspersky MLAD, the following statuses of incidents and incident groups are available by default: Under review, Decision pending, Instructions issued, Problem closed, Cause unknown, Ignore and False positive. If necessary, the system administrator can create, edit, or delete statuses of incidents.
Viewing the technical specifications of a registered incident
In the Incidents section, you can view the technical specifications of registered incidents. To do so, click the right arrow (![]() ) next to the relevant incident in the incidents table. The following technical specifications will be displayed for the selected incident:
) next to the relevant incident in the incidents table. The following technical specifications will be displayed for the selected incident:
- Incident is the section containing information about the incident.
- Top tag is the section containing information about the tag for which the incident was registered.
- Stream Processor service incident parameters is a section containing information about the parameters of the incident registered by the Stream Processor service. This group of parameters is displayed if the current incident is registered by the Stream Processor service.
- Incident cause is the field for selecting the cause of the incident. This field is completed by an expert (process engineer or ICS specialist). If necessary, the system administrator can create, edit, or delete causes of incidents.
- Expert opinion is the field for adding an expert opinion based on an analysis of the registered incident. This field is completed by an expert (process engineer or ICS specialist).
- Note is the field for entering a comment for the selected incident. If necessary, you can provide a comment for the incident.
Viewing incident groups
When two or more similar incidents are detected, Kaspersky MLAD automatically combines them into a group (using the Similar Anomaly service). This lets you analyze incidents with consideration of prior history and expert opinions that were generated for similar incidents. In the incidents table in the Incidents section, the group associated with the incident is displayed in the Group column. If nothing is indicated for the incident in this column, this means that Kaspersky MLAD has not yet detected incidents similar to this particular incident. Incidents can be regrouped, and the expert opinions that were added to these incidents are migrated to the new group. The group name is automatically assigned in the format Group #N (N is replaced by the sequence number of the group). If necessary, you can edit a group name.
To view incident groups:
In the main menu, select the Incidents section and click Groups.
All incident groups for your monitored asset are displayed in the table located in the central part of the page.
The following information is displayed for each incident group in the table:
- ID is the incident group identifier.
- Group name refers to the name of the incident group.
- Expert opinion is a conclusion added by an expert (process engineer or ICS specialist) based on an analysis of the group of registered incidents.
- Incident count refers to the number of registered incidents included in the group.
You can proceed to view incidents of the group by clicking Incident count.
- Date and time refers to the date and time when the incident group was created.
- Status refers to the status of registered incidents in a group specified by an expert (process engineer or ICS specialist) based on the results of the incident analysis.
You can set the incident group status based on analysis results by selecting the appropriate value from the drop-down list. After installation of Kaspersky MLAD, the following statuses of incidents and incident groups are available by default: Under review, Decision pending, Instructions issued, Problem closed, Cause unknown, Ignore and False positive. If necessary, the system administrator can create, edit, or delete statuses of incidents.
To view detailed information about an incident group:
- Click the right arrow () next to the incident group.
A list of incidents in this group is displayed. The following technical specifications are displayed for each incident of the group:
- Incident date is the date and time when the incident was registered.
You can go to the History section by clicking the incident registration date.
- Top tag name is the name of the process parameter that had the largest impact when the incident occurred.
- Top tag value is the registered value of the tag that had the largest impact when the incident occurred.
- Relevant tags refers to a table that contains the identifiers of tags that influenced the identification of similar incidents and merging of these incidents into a group.
- Incident date is the date and time when the incident was registered.
- If you need to view the degree of influence a tag had on the formation of similar incidents, click the Relevant tags table cell containing the identifier of the relevant tag.
All table cells containing the selected tag ID are highlighted in green. The closer the green-highlighted cells containing the ID of the selected tag are to the first table column, the more impact that tag has when identifying and grouping similar incidents.
You can also add a status and expert opinion for the incident group.
Page topStudying the behavior of the monitored asset at the moment when an incident was detected
This section describes the sequence of actions required when studying the behavior of a monitored asset at the moment when an incident was detected.
Studying the behavior of a monitored asset consists of the following steps:
- Viewing the history of tags received for a monitored asset in the History section
You can proceed to view incident information in one of the following ways:
- If you want to view a recently detected incident, in the Dashboard section, click the date and time of the relevant incident in the Latest incidents table.
- In the Incidents section, click the date and time of the relevant incident in the incidents table.
- If an incident notification was created for you, you can proceed to view the incident by clicking the link from the email notification. The email message contains the time when the incident began, the most anomalous tag, and a link to proceed to the History section in the Kaspersky MLAD web interface.
In the History section, Kaspersky MLAD displays a graph of tags received from the monitored asset for which the selected incident was registered. The graph displays data on the preset named Tags for event #N (N represents the incident number in the Incidents section), which is generated for the date and time when the selected incident was registered. This preset includes the tags that led to incident registration. Depending on the type of detector that registered an incident, this may involve the following tags:
- Tags whose actual values were deemed the most anomalous by the ML model, if the incident was registered by the Forecaster Detector.
- Tags included in a diagnostic rule and the value obtained as a result of the operation of this rule, if the incident was registered by the Rule Detector.
- A tag whose value was outside of the set blocking thresholds, if the incident was registered by the Limit Detector.
If necessary, you can select a different preset for displaying data received from the monitored asset at the moment when the incident was registered. The graph uses a vertical blue dashed line to indicate the date and time when the incident was registered.
Example tag graph in the History section.
The tag graph is displayed in the upper part of the History section. The MSE graph is displayed in the lower part of the History section.
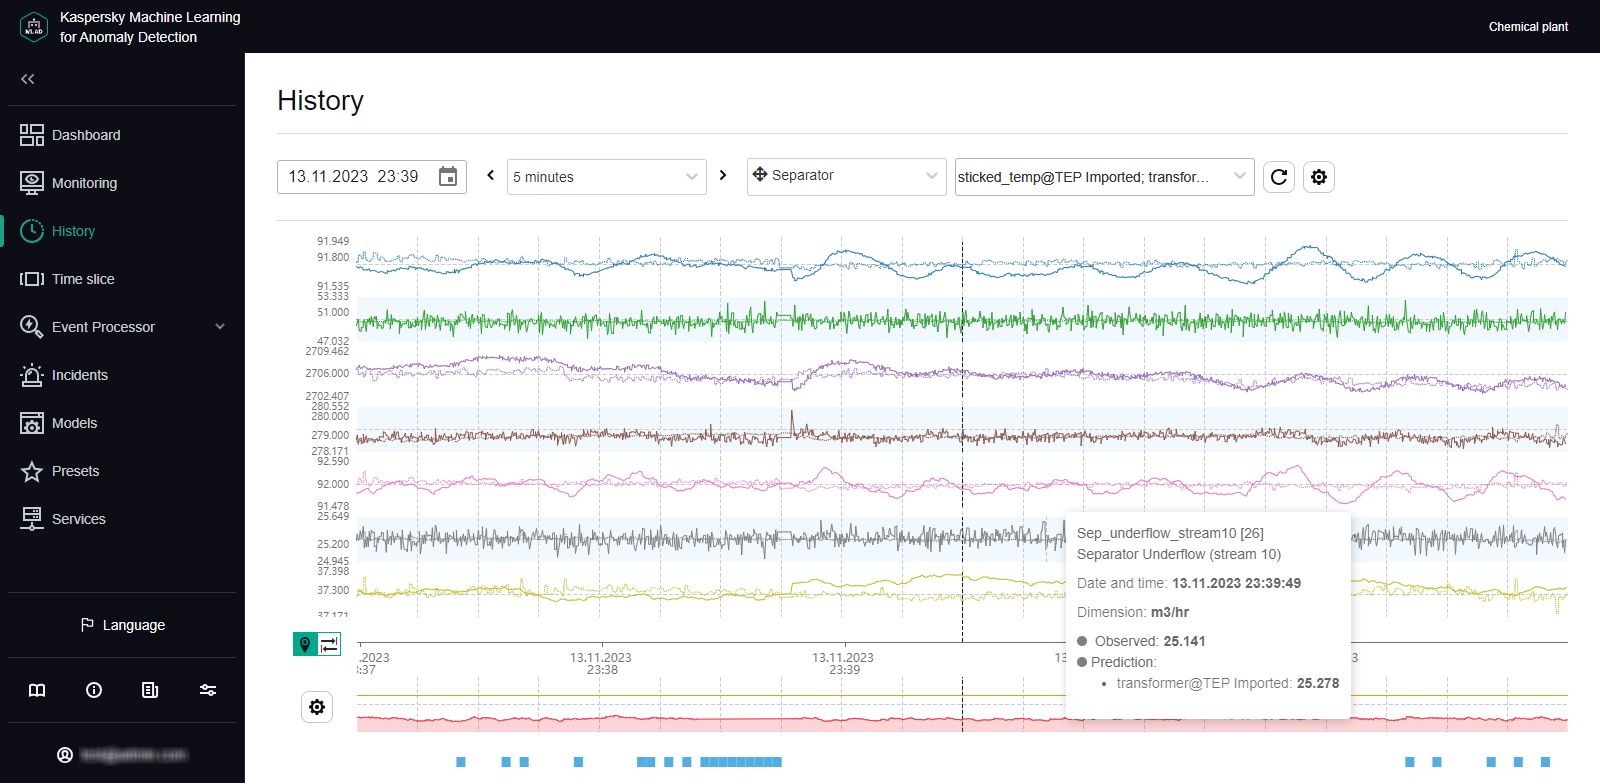
Tag graph in the History section
- Configuring how data is displayed on a graph in the History section
In the History section, you can enable the display of predicted tag values. This lets you assess the difference between actual tag values and predicted tag values. Enabling the display of predicted values will also let you view values obtained as a result of the work of diagnostic rules. Tag information (name, numerical ID, description, unit of measurement, time, and tag value) is displayed whenever you move your mouse cursor over a tag graph. You can also enable display of the tag name and description for each tag graph.
- Configuring the time settings for displaying data in the History section
When studying the behavior of tags, you can change the scale of the time axis or move forward or backward in time through graphs. When displaying shorter time intervals on tag graphs, the History section may show more details of the behavior of tags that had been averaged when a tag graph for a longer period was displayed.
- Changing the vertical boundaries for displaying data in the History section
The vertical scale of each graph is selected by default based on the minimum and maximum values of a tag in the displayed area. You can control the scale of graphs according to the scale of values on the vertical axis by using one of the following methods:
- If minimum and maximum permissible values (blocking thresholds) are defined for a tag, enable the Always display blocking threshold function.
If a tag value is within the permissible range, the vertical scale of the graph will be fixed by limit lines derived from the lower and upper thresholds of the tag graph. If the tag values go beyond the specified blocking thresholds, the vertical scale will be automatically changed to display the tag values exceeding the thresholds.
- In the tag properties, set the permissible boundaries for displaying tag values on graphs.
If tag values go beyond the defined boundaries, they will not be displayed on the tag graph. The permissible boundaries for displaying tag values take priority over the display of blocking thresholds, even if the Always display blocking threshold function is enabled.
- If minimum and maximum permissible values (blocking thresholds) are defined for a tag, enable the Always display blocking threshold function.
Adding a status, cause, expert opinion or note to an incident or incident group
Kaspersky MLAD lets you add an expert opinion or note to a registered incident.
An expert opinion is normally added by an expert (process engineer or ICS specialist) and may contain an incident analysis or recommendations on resolving a problem that is indicated by an identified incident. An expert opinion can be added to an individual incident or to a group of incidents. If expert opinions were previously added to incidents that are later put into a group, these opinions will also be displayed in the group (linked to each specific incident). When incidents are regrouped, the expert opinion for an incident migrates together with the incident to the new group.
Notes are intended to aid discussions between experts or operators of facilities regarding recommended actions for analysis, investigation, and remediation of an incident. Each note includes information stating who added the note and when it was added.
You can also add the cause of the incident and the incident status determined by the expert based on the incident analysis results. A status can be assigned to an individual incident or to a group of incidents. When changing the status of a group of incidents, Kaspersky MLAD changes the status of the incidents that are part of this group.
Before adding a cause, status, note or expert opinion, you must conduct an analysis of the registered incident.
To add an expert opinion, status, cause, or note to an incident:
- In the main menu, select the Incidents section.
- If necessary, change the incident status by selecting one of the following statuses from the Status drop-down list: Under review, Decision pending, Instructions issued, Problem closed, Cause unknown, Ignore, or False positive.
By default, an incident is assigned the Unknown status. If necessary, the system administrator can create, edit, or delete statuses of incidents.
- To display detailed technical specifications, click the right arrow () next to the relevant incident. In the details area that opens, you can do the following:
- If you need to add the cause of an incident, use the Incident cause field to select the cause of the incident.
If necessary, the system administrator can create, edit, or delete causes of incidents.
- If you want to add an expert opinion based on an analysis of a registered incident, click the Edit expert opinion (
 ) icon on the right of the Expert opinion field. In the field that opens, enter the opinion, and press ENTER.
The expert opinion will be added to the selected incident and will appear in the incidents table in the Incidents section.
- If you need to add a note to an incident, enter your message in the Note field and click the Add note button.
You can provide a message up to 512 characters long.
- If you need to add the cause of an incident, use the Incident cause field to select the cause of the incident.
The status, cause, expert opinion, and note will be added to the incident and will be available to other users when viewing this incident.
When two or more similar incidents are detected, Kaspersky MLAD automatically combines them into a group. The group name is also automatically assigned in the format Group #N (N is replaced by the sequence number of the group). You can edit the group name, change the status of an incident group, and edit the expert opinion containing recommendations for analyzing similar events, for example.
To add a status and expert opinion to a group of incidents:
- In the main menu, select the Incidents section and click Groups.
- If necessary, change the incident group status by selecting one of the following statuses from the Status drop-down list: Under review, Decision pending, Instructions issued, Problem closed, Cause unknown, Ignore, or False positive.
When changing the status of a group of incidents, Kaspersky MLAD changes the status of the incidents that are part of this group. By default, a group of incidents is assigned the Unknown status.
If necessary, the system administrator can create, edit, or delete statuses of incidents.
- In the incident groups table, double-click the row of the incident group.
The Edit group window opens.
You can also change the group on the Incidents tab. To do so, select the required group in the Group filter, and in the expert opinion section for the group, which is displayed above the incidents table, click the Edit button.
- To change the name of the incident group, enter a new name for the group in the Group name field.
- In the Expert opinion field, enter the text of the expert opinion (for example, recommendations for analyzing similar incidents).
- Click the Save button.
The status and expert opinion will be changed for the incident group and can now be viewed by other users in the Groups table in the Incidents section.
Page topExporting incidents to a file
Incidents registered for a specific period in Kaspersky MLAD can be exported to an XLSX file.
To save incidents registered for a specific period to a file:
- In the main menu, select the Incidents section.
- In the upper part of the opened page, select the start and end dates of the period.
- Click the Export button.
- Select a directory to save on your local drive, and save the file.
Incidents registered for the selected period in Kaspersky MLAD will be saved to an XLSX file on the local drive. The XLSX file can be opened in Microsoft Excel.
Page top