Viewing data in the History section
The History section provides access to the history of incoming data, the results of data processing by Kaspersky MLAD, generated ML model artifacts, and registered incidents information.
The central part of the History section consists of a set of horizontal segments designed to display graphs. Each such segment is called a graphic area. The graphic areas for the selected preset are displayed first. A single graphic area of a preset can display a graph of one tag or graphs of multiple tags superimposed over each other. The composition of tags whose data is shown in the graphic area can be determined when you create a preset. The graphs display the values of preset tags received by Kaspersky MLAD from the monitoring object during the selected time interval. You can choose ML model elements and customize graph display for the graphs for individual graphic areas to show artifacts linked to the tags associated with those areas and generated by the ML model elements that use these tags.
Graphic areas for each selected ML model element are displayed after the preset graphic areas. These graphic areas display graphs for ML model element artifacts. The value of an ML model element artifact depends on the analytical algorithms used by the element. It is displayed as a colored line. The color of the line corresponds to the color selected for the Color of incident dot indicators setting when the corresponding element was created. Graphs also display an orange line that represents the threshold. When a value exceeds this threshold, the ML model element registers an incident.
At the bottom of the section, there is a graphic area that displays a graph of the ML model element artifact selected in the ML model element artifact graph display settings panel. The red line on the graph corresponds to the value of the ML model element artifact, while the orange line represents a threshold. When the value crosses this threshold, Kaspersky MLAD registers an incident. The area on the graph where the value of the ML model element artifact exceeds the specified threshold is colored red. Below the graph, color-coded dots that represent recorded incidents are displayed.
Depending on the selected time scale and the density of incidents, one dot indicator may correspond to one or multiple closely-spaced incidents that were registered by one or multiple ML model elements. The color of the indicator points relating to incidents recorded by a single ML model element is assigned when that element is created. Purple is reserved for indicator points that correspond to a group of incidents recorded by different elements. Red is reserved for indicator points that correspond to incidents recorded by Limit Detector.
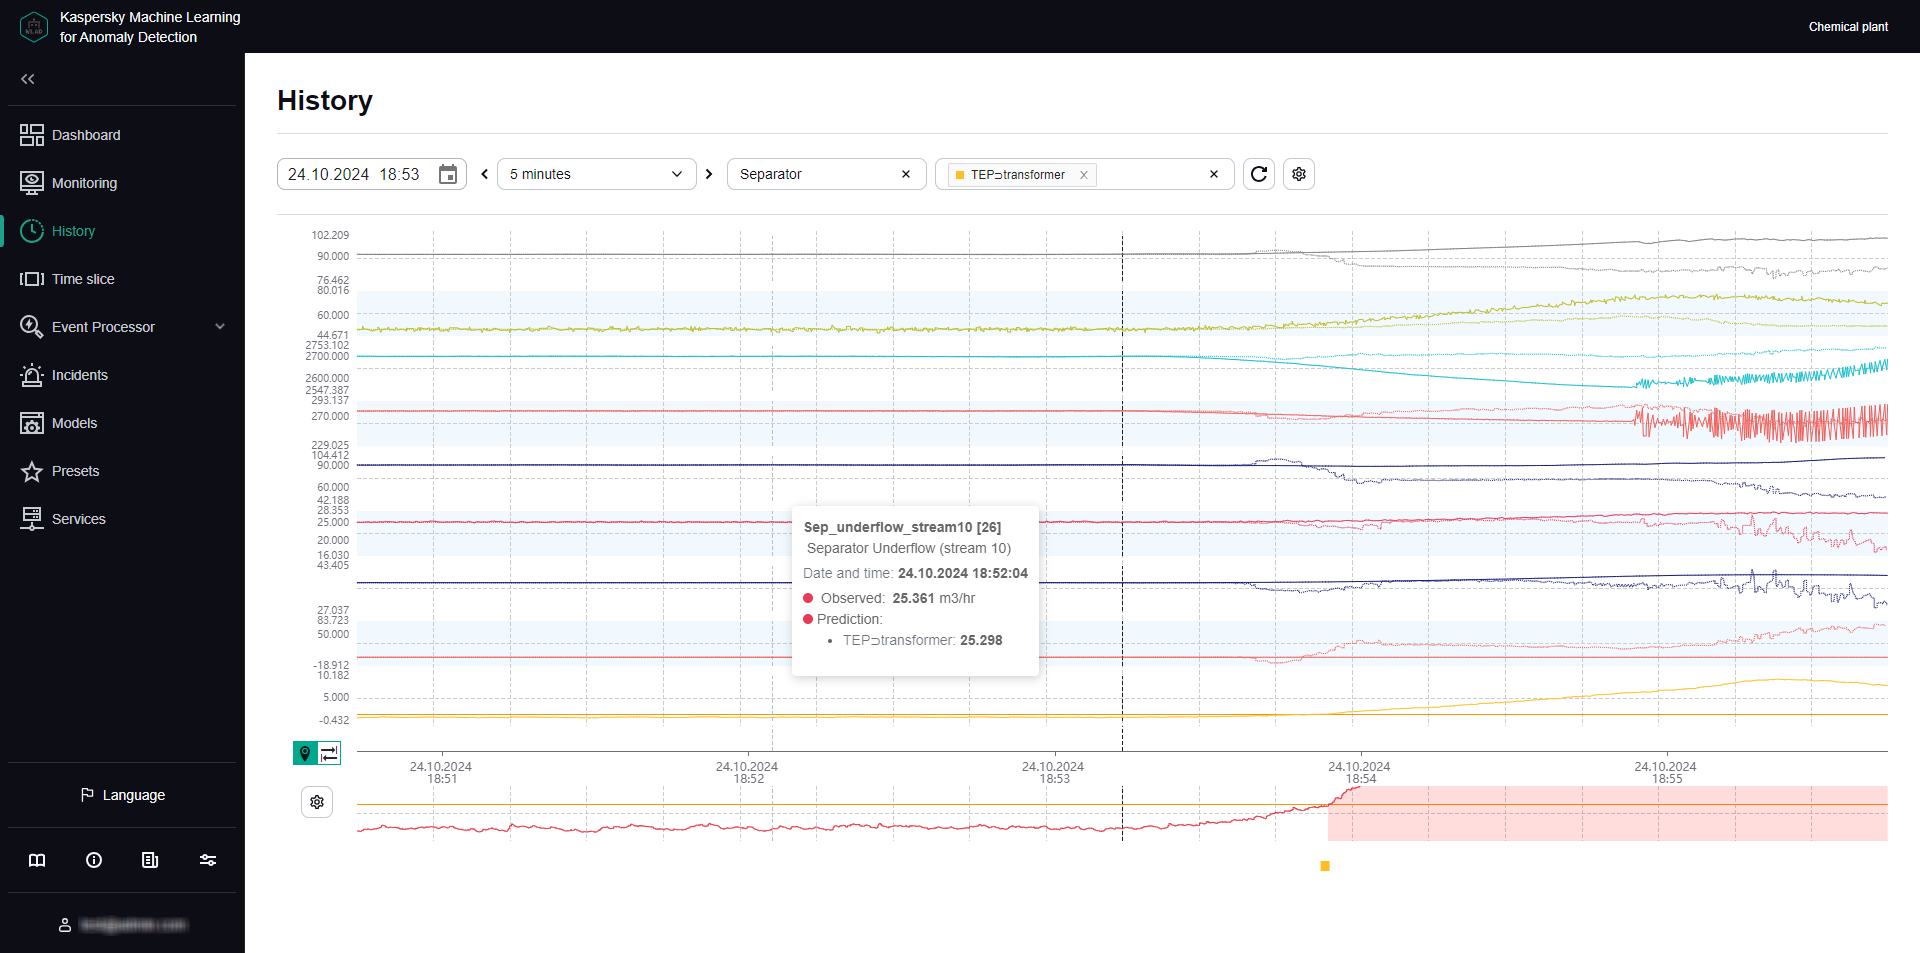
History section