Contents
- Viewing data in the Time slice section
- Viewing data for a specific preset in the Time slice section
- Selecting a specific element of the ML model in the Time slice section
- Selecting a date and time interval in the Time slice section
- Navigating through time in the Time slice section
- Configuring how graphs are displayed in the Time slice section
Viewing data in the Time slice section
In the Time slice section, you can view the values of process parameters received from sensors of the monitored asset at the same point in time. The sensors must be of the same type (have the same dimension) and must be positioned linearly, like pressure sensors in an oil pipeline, for example.
Data is presented in the form of graphs that display whether an incident was detected at the selected time and where the likely source of the incident is located.
The lower part of the page contains a section displaying the individual errors of tags. The data is presented as a bar graph. The error value for each tag is displayed when the mouse cursor hovers over the relevant column. The prediction error graph is located on the right of the preset tag graphs.
In the Time slice section, you can use the drop-down list to select a preset and the date and time when data was received. This list includes special presets that can be created in the Presets section. A special preset should contain only tags of the same type that have defined x-axis coordinates. You can additionally specify expressions dynamically calculated for each tag based on actual and predicted tag values, individual prediction errors, and tag coordinate values and constants defined in expressions.
You can also customize the display of graphs, select a time interval for viewing data, and select a specific element of the ML model to view the individual errors of preset tags obtained as a result of data processing by the selected element of the ML model.
Data processing results can be displayed only for predictive ML model elements.
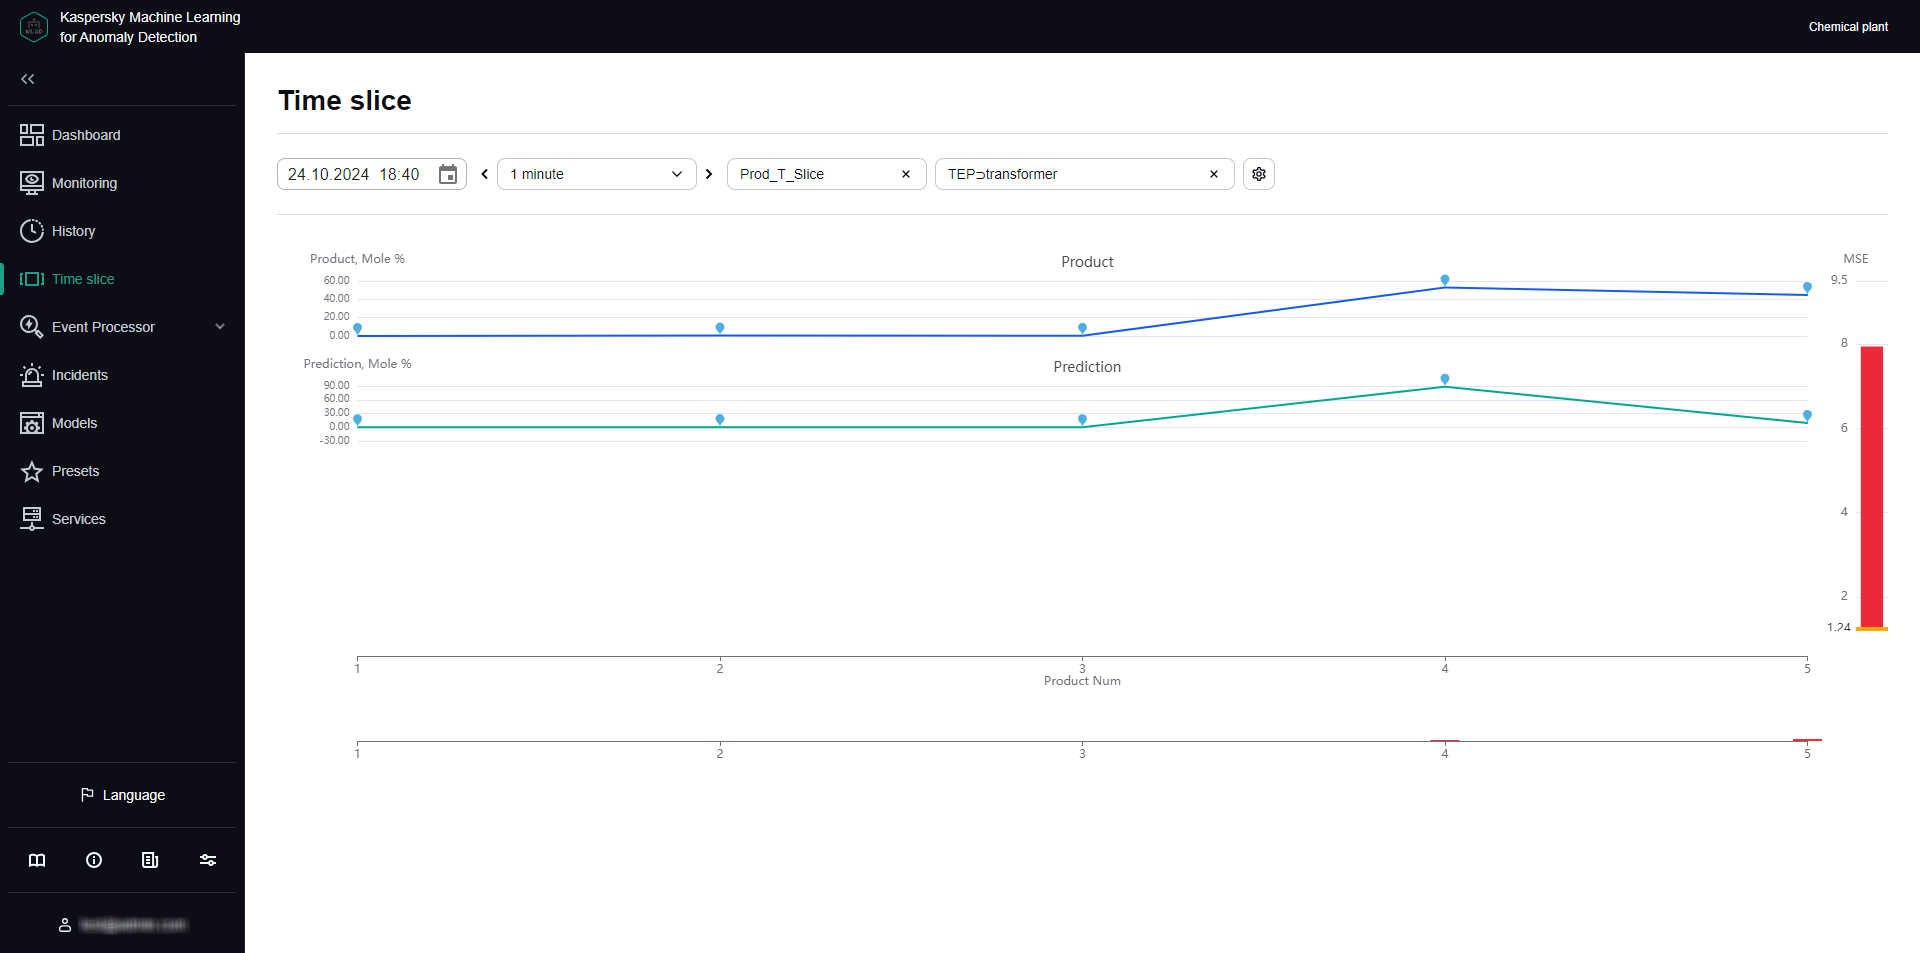
Time slice section
Viewing data for a specific preset in the Time slice section
To view data for a specific preset:
- In the main menu, select the Time slice section.
- On the opened page, select the relevant preset from the Preset drop-down list.
The page displays graphs for tags that are included in the selected preset.
If necessary, you can change the time interval for displaying data, customize the display of a graph, or select a specific element of the ML model. You can also change which tags are displayed by editing the preset.
Page topSelecting a specific element of the ML model in the Time slice section
If the ML model used for a monitored asset has several elements for processing and predicting data, Kaspersky MLAD lets you select a specific element of the ML model to display the individual tag errors obtained as a result of this element in the Time slice section.
The functionality is available after a license key is added.
Data processing results can be displayed only for predictive ML model elements.
To view the individual tag errors resulting from data processing by a specific ML model element:
- In the main menu, select the Time slice section.
- On the opened page, select the relevant element of the ML model from the Model element drop-down list.
Element names are displayed as
<ML model name>
<element name>.
The bottom of the section displays the individual tag errors resulting from data processing by the selected element of the ML model.
Page topSelecting a date and time interval in the Time slice section
Kaspersky MLAD lets you select a date and time interval (scale) for displaying incoming data.
To select the date for displaying incoming data:
- In the main menu, select the Time slice section.
- Click the
 button. In the opened window, select the date and time for which you need to display data.
 - Click the Apply button.
The graphs will display the tag values for the selected date and time.
To select a time interval for displaying incoming data:
- In the main menu, select the Time slice section.
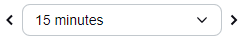
- Select the required time interval from the drop-down list in the upper part of the opened page. The following time intervals are available by default:
- 1, 5, 10, 15, and 30 minutes
- 1, 3, 6, and 12 hours
- 1, 2, 15, and 30 days
- 3 and 6 months
- 1, 2, and 3 years
If necessary, the system administrator can create, edit, or delete time intervals.
The page will display graphs of the defined preset for the selected time interval.
Page topNavigating through time in the Time slice section
Kaspersky MLAD provides the capability to navigate through time for convenient viewing of data.
To use time navigation when viewing data:
- In the main menu, select the Time slice section.
- On the opened page, select the time interval for the data that you want to view.
- Use the
 and
and  buttons in the upper part of the page to move along the time axis to the right or left.
The time axis for viewing data on the graph will shift to the selected time interval.
Navigating through time
Page topConfiguring how graphs are displayed in the Time slice section
Kaspersky MLAD lets you configure the settings for displaying preset graphs in the Time slice section.
To configure the display settings for preset graphs:
- In the main menu, select the Time slice section.
- On the opened page, click the
 button located in the upper part of the screen.
The Graph display settings pane appears on the right.
- In the Graph height drop-down list, select one of the following values: 55 px, 110 px, 145 px, 190 px.
By default, the Graph height parameter is set to 55 px.
- Click the Close button to return to viewing the graphs.
The graph display settings will be applied.
Page top