Contents
Monitoring solution components
Monitoring of
, , and CPE devices is provided by an external Zabbix monitoring system. Part of the data is collected through the SD-WAN Controller. To integrate with the monitoring system, you must deploy the Zabbix server in one of your data centers, or connect an existing server.The Zabbix server contains monitoring settings, processes monitoring results, provides them as data for visualization, and sends notifications about any errors that may have occurred.
To collect monitoring results in individual data centers and send them to the central Zabbix server, you must deploy Zabbix proxy servers. Such servers help reduce the CPU load of the Zabbix server, reduces the IOPS (Input/Output Operations Per Second) of its disk, and also lets you quickly scale the monitoring system.
Monitoring can be performed in two ways, depending on the software installed on the device:
- If the software installed on the device supports the installation of Zabbix agents, it automatically sends monitoring data to the Zabbix server or Zabbix proxy.
- If the software installed on the device does not support the installation of Zabbix agents, the Zabbix proxy server automatically connects to it over SNMP and collects the necessary data.
When managing CPE devices, as well as VNF and PNF, the orchestrator uses the API to automatically create, update, and delete their corresponding hosts on the Zabbix server.
Monitoring results are displayed as graphs, the number of which depends on which Zabbix template was applied to the solution component. Zabbix monitoring templates are configured on the Zabbix server.
If you have created a Zabbix template for monitoring an individual VNF, you must specify its name in the VNF descriptor. Then you can view the monitoring results on individual VNFs. VNF monitoring is necessary for using the Auto Healing and Auto Scaling functionality.
For details about configuring the monitoring system, see the official documentation of the Zabbix solution.
Connecting to a Zabbix server
Integration with Zabbix allows monitoring solution components. Before connecting to the Zabbix server, it must be deployed in one of your data centers.
To connect to the Zabbix server:
- In the menu, go to the Monitoring section.
The settings for connecting to the Zabbix server are displayed.
- In the URL field, enter the web address of the Zabbix API. The orchestrator sends HTTP requests to this address to receive monitoring results and display then as charts.
The address consists of the address of the Zabbix web interface and the api_jsonrpc.php file name, which is used for API calls. For example, if the Zabbix web interface is located at http://192.168.2.1, enter
http://192.168.2.1/api_jsonrpc.php. - In the Username field, enter the user name for connecting to the Zabbix API. You must enter the user name for an account that has read and write permissions in the host groups that you created on the Zabbix server to monitor the components of the Kaspersky SD-WAN solution. This account is used for authentication on the Zabbix server when sending an API request.
- In the Password field, enter the password for connecting to the Zabbix API.
- In the VNF/PNF group, enter the name of the host group that you created on the Zabbix server for monitoring VNFs or PNFs. If you have not created a group, the orchestrator automatically creates one.
- In the CPE group field, enter the name of the host group that you created on the Zabbix server for monitoring CPE devices. If you have not created a group, the orchestrator automatically creates one.
- In the Triggers synchronization (sec.) field, enter the time interval in seconds for sending notifications about errors from the Zabbix server. Range of values: 5 to 600. The default setting is
600. - Below the Token field, click Generate to generate a token that the Zabbix server must use to establish a secure connection with the orchestrator. Security is also protected by TLS certificates. You can enter the token manually or view it by clicking the view button
 .
. - To check the availability of the Zabbix server, click Test connection.
- Click Apply.
Connecting to a Zabbix proxy server
Integration with Zabbix allows monitoring solution components. Before connecting to the Zabbix proxy server, it must be deployed in one of your data centers.
To connect to the Zabbix proxy server:
- In the menu, go to the Infrastructure section.
The SD-WAN infrastructure management page is displayed. By default, the Network resources tab is selected, which displays the table of SD-WAN Controllers.
- In the Resources pane, select the Data center tab.
A list of data centers is displayed.
- Click the data center where the Zabbix proxy server is deployed.
- Select the System resources tab.
The settings for connecting to the Zabbix proxy server are displayed.
- Under Zabbix proxy, in the Name field, enter the name of the Zabbix proxy server. The name must match the name specified in the Zabbix proxy server settings.
- In the IP field, enter the IP address of the Zabbix proxy server.
- Click Apply.
Configuring CPE device monitoring
You must configure monitoring in the CPE template configuration and apply the template to the devices on which you want to view monitoring results.
To configure CPE device monitoring:
- In the menu, go to the SD-WAN → CPE templates subsection.
A table of CPE templates is displayed.
- Click the CPE template.
The settings area is displayed in the lower part of the page. You can expand the settings area to fill the entire page by clicking the expand button
 .
. - Select the Monitoring tab.
The CPE device monitoring settings are displayed.
- In the Monitoring type drop-down list, select one of the following values:
- SNMP — For monitoring CPE devices whose software does not support the installation of Zabbix agents.
- Agent — For monitoring CPE devices whose software supports the installation of Zabbix agents.
- In the Zabbix template field, enter the name of the Zabbix template.
- In the upper part of the settings area, click Save to save the configuration of the CPE template.
Viewing monitoring results
You can view monitoring results for components of the solution. To do so, use the following instructions:
- Viewing CPE device monitoring results.
Before viewing CPE device monitoring results, you must configure monitoring in the CPE template.
To view CPE device monitoring results:
- In the menu, go to the SD-WAN section.
By default, the CPE subsection is displayed with a table of CPE devices.
- Click the CPE device.
The settings area is displayed in the lower part of the page. You can expand the settings area to fill the entire page by clicking the expand button
. - Select the Monitoring tab.
The monitoring results are displayed for the entire period. You can display the results for a custom period using the filter in the upper part of the page. For example, you can display results for a year, a month, or an arbitrary time period.
- Select the parameter for which you want to display monitoring results.
The available monitoring results are displayed as a chart.
- In the menu, go to the SD-WAN section.
- Viewing SD-WAN instance monitoring results.
To view monitoring results for a deployed SD-WAN instance:
- In the menu, go to the SD-WAN → SD-WAN instances subsection.
A table of SD-WAN instances is displayed.
- Click the relevant SD-WAN instance.
The settings area is displayed in the lower part of the page. You can expand the settings area to fill the entire page by clicking the expand button
. - Select the Monitoring tab.
The monitoring results are displayed for the entire period. You can display the results for a custom period using the filter in the upper part of the page. For example, you can display results for a year, a month, or an arbitrary time period.
- Select the parameter for which you want to display monitoring results.
The available monitoring results are displayed as a chart.
- In the menu, go to the SD-WAN → SD-WAN instances subsection.
- Viewing VNF monitoring results.
To view VNF monitoring results:
- In the menu, go to the Catalog section.
The network service management page is displayed.
- In the Network services panel, select a network service.
The graphical design tool with the network service topology is displayed.
- Click the VNF.
The settings area is displayed in the lower part of the page. You can expand the settings area to fill the entire page by clicking the expand button
.By default, the Flavours tab is selected, which displays the flavours of virtual machines for the network function. Flavours are described in the VNF package.
- Select the Monitoring tab.
The monitoring results are displayed for the entire period. You can display the results for a custom period using the filter in the upper part of the page. For example, you can display results for a year, a month, or an arbitrary time period.
- Select the parameter for which you want to display monitoring results.
The available monitoring results are displayed as a chart.
- In the menu, go to the Catalog section.
- Viewing PNF monitoring results.
To view PNF monitoring results:
- In the menu, go to the Catalog section.
The network service management page is displayed.
- In the Network services panel, select a network service.
The graphical design tool with the network service topology is displayed.
- Click the PNF.
The settings area is displayed in the lower part of the page. You can expand the settings area to fill the entire page by clicking the expand button
.By default, the Flavours tab is selected, which displays the flavours of virtual machines for the network function. Flavours are described in the PNF package.
- Select the Monitoring tab.
The monitoring results are displayed for the entire period. You can display the results for a custom period using the filter in the upper part of the page. For example, you can display results for a year, a month, or an arbitrary time period.
- Select the parameter for which you want to display monitoring results.
The available monitoring results are displayed as a chart.
- In the menu, go to the Catalog section.
Viewing errors
The monitoring system sends you notifications about errors that occur during the operation of components of the solution. These notifications can help you identify and fix the causes of incorrect operation of components. When an error occurs, it is assigned one of the following severity levels:
- Warning
- Average
- High
- Disaster
The monitoring settings that you specify on the Zabbix server determine which errors warrant notifications and how these errors are classified according to their severity levels. You can view the time when the error occurred and for how long it remained uncorrected.
To view errors, use the following instructions:
- Viewing errors on a CPE device.
To view errors on a CPE device:
- In the menu, go to the SD-WAN section.
By default, the CPE subsection is displayed with a table of CPE devices.
- Click the CPE device.
The settings area is displayed in the lower part of the page. You can expand the settings area to fill the entire page by clicking the expand button
. - Select the Problems tab.
A table of errors that occurred during the operation of the CPE device is displayed.
- In the menu, go to the SD-WAN section.
- Viewing errors on a VNF.
To view errors on a VNF:
- In the menu, go to the Catalog section.
The network service management page is displayed.
- In the Network services panel, select a network service.
The graphical design tool with the network service topology is displayed.
- Click the VNF.
The settings area is displayed in the lower part of the page. You can expand the settings area to fill the entire page by clicking the expand button
.By default, the Flavours tab is selected, which displays the flavours of virtual machines for the network function. Flavours are described in the VNF package.
- Select the Problems tab.
A table of errors that occurred during the operation of the VNF is displayed.
- In the menu, go to the Catalog section.
- View errors on a PNF.
To view errors on a PNF:
- In the menu, go to the Catalog section.
The network service management page is displayed.
- In the Network services panel, select a network service.
The graphical design tool with the network service topology is displayed.
- Click the PNF.
The settings area is displayed in the lower part of the page. You can expand the settings area to fill the entire page by clicking the expand button
.By default, the Flavours tab is selected, which displays the flavours of virtual machines for the network function. Flavours are described in the PNF package.
- Select the Problems tab.
A table of errors that occurred during the operation of the PNF is displayed.
- In the menu, go to the Catalog section.
Enabling monitoring on a link
You can enable monitoring on a link. All links built within the SD-WAN network are displayed in the overall table of links in the Tunnels section, as well as in the graphic topology in the Topology section. A table of links built using a particular CPE device is also displayed in the configuration of that CPE device, on the Tunnels tab.
To enable monitoring on a link, use the following instructions:
- Enabling monitoring on a link using the overall table.
- Enabling monitoring on a link using the graphical topology.
- Enabling monitoring on a link on an individual CPE device.
To enable monitoring on a link on an individual CPE device:
- In the menu, go to the SD-WAN section.
By default, the CPE subsection is displayed with a table of CPE devices.
- Click the CPE device.
The settings area is displayed in the lower part of the page. You can expand the settings area to fill the entire page by clicking the expand button
. - Select the Tunnels tab.
A table of links is displayed.
- Click Management next to the link and in the drop-down list, select Set thresholds.
- This opens a window, in that window, select the Enable tunnel thresholds monitoring check box.
- To use the default monitoring thresholds, click Set to default.
- If you want to mark the link as charged and prohibit using it for routing or make it the last priority link, regardless of the connection quality, select the Unsolicited check box. This check box is cleared by default.
- In the Interval for processing errors and utilization rate (sec.) field, enter the time interval in seconds for measuring the number of errors on the link and its level of utilization. Range of values: 1 to 300. The default setting is
60. - Select the Enable error monitoring check box to specify the threshold number of errors on the link, and in the Critical error level (errors/sec.) field, enter the value that you want to configure. Range of values: 1 to 1,000,000. By default, the check box is cleared and the field is set to
1,000. - Select the Enable utilization monitoring check box to specify the link utilization threshold as a percentage of the configured speed of the service interface and in the Critical utilization level (%) field, enter the value that you want to configure. By default, the check box is cleared and the field is set to
95. - In the Interval for processing latency, jitter, and packet loss (sec.) field, enter the time interval, in seconds, for measuring latency, jitter, and packet loss on the link. Range of values: 1 to 600. The default setting is
15. - Select the Enable latency monitoring check box to specify the maximum latency in milliseconds for packet transmission through the link, and in the Critical latency level (ms.) field, enter the value that you want to configure. Range of values: 5 to 1,000. By default, the check box is cleared and the field is set to
100. - Select the Critical jitter level (ms.) check box to specify the maximum jitter time in milliseconds for packet transmission through the link, and in the Enable jitter monitoring field, enter the value that you want to configure. Range of values: 5 to 1,000. By default, the check box is cleared and the field is set to
100. - Select the Enable packet loss monitoring check box to specify the maximum packet loss percentage on the link and in the Critical packet loss level (%) field, enter the value that you want to configure. Range of values: 1 to 100. By default, the check box is cleared and the field is set to
2. - Save the settings:
- Click Save to save the monitoring settings on the link.
- Click Save for both tunnels to save the specified monitoring settings on the link, as well as on the corresponding link in the opposite direction.
- In the upper part of the settings area, click Save to save the configuration of the CPE device.
- In the menu, go to the SD-WAN section.
Viewing the status of the solution and its components
You can view information about the status of the solution and its components in the Dashboard section, which opens automatically after you authenticate in the orchestrator web interface.
To view the status of solution components:
In the menu, go to the Dashboard section.
The dashboard consists of widgets that display information. For example, the Disconnected CPE widget displays CPE devices to which access is lost. If a solution component is operating correctly, the corresponding widget displays the Everything is running smoothly message.
You can drag widgets with the mouse to change the layout. The upper part of each widget has an update button ![]() , which resets all displayed information. You can also use the settings button
, which resets all displayed information. You can also use the settings button ![]() in the upper corner of the page to reset the statistics or change the update interval for information displayed in widgets.
in the upper corner of the page to reset the statistics or change the update interval for information displayed in widgets.
SNMP protocol
You can use SNMP to collect monitoring data for equipment that does not support installing Zabbix agents. In this case, instead of the Zabbix agent, a special software entity called an SNMP agent is installed. It continuously monitors the equipment, gathering basic information about status, performance indicators, and configuration. The gathered information is then transferred to the SNMP manager, which is a centralized system that processes the received monitoring data. In Kaspersky SD-WAN, the Zabbix proxy server acts as the SNMP manager.
The SNMP protocol operates at the TCP/IP application layer (the seventh layer of the OSI model). The SNMP manager and SNMP agents exchange requests and notifications. In both cases these are standard messages. The difference lies in the direction in which the message is sent, as well as its function.
When the SNMP manager sends a message to the SNMP agent, it is used to obtain monitoring data and is called a request. By default, SNMP agents receive requests from the SNMP manager on port 161. However, the manager can send requests through any available port. The response arrives on the same port from which the request was sent.
On the other hand, if the SNMP agent sends a message to the SNMP manager, it is used to provide monitoring data and is called a notification. By default, the SNMP manager receives notifications from SNMP agents on port 162. However, agents can send notifications through any available port. Two types of notifications exist:
- Traps are notifications with information about certain events that the SNMP agent sends without a prior request from the SNMP manager. When a specified event occurs, such as a shutdown of equipment or one of its network interfaces, the SNMP agent generates a trap and sends it to the SNMP manager as a UPD message. Traps let the equipment automatically inform the SNMP manager about important events without waiting for a request.
- Inform requests are notifications similar to traps, which differ in that they require additional confirmation from the SNMP manager. When the SNMP agent sends an inform request to the SNMP manager, the agent waits to receive an acknowledgment. If the SNMP manager successfully receives and processes the inform request, it sends an acknowledgment message to the SNMP agent. The acknowledgement mechanism allows you to ensure the reliability of delivery of notifications.
When using the TLS or DTLS protocol, traps arrive on port 10162 of the SNMP manager, and information requests arrive on port 10161.
In the case of SNMP, all basic protocol data units (PDUs) have the same structure (see figure below). The IP header and UDP header are used for encapsulation and are not actually part of the protocol data unit.
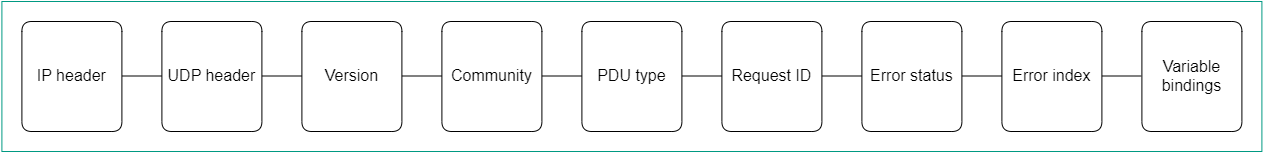
SNMP Protocol Data Unit diagram
Configuring the connection of the SNMP manager to SNMP agents
You must specify the settings for connecting the SNMP manager to SNMP agents installed on your equipment, such as CPE devices. In Kaspersky SD-WAN, the Zabbix proxy server acts as the SNMP manager.
The specified settings are used for all SNMP agents. This saves time and avoids the need to configure individual pieces of equipment. The exception is when connection settings are locally overridden on the equipment.
To configure the connection of the SNMP manager to SNMP agents:
- In the menu, go to the Infrastructure section.
The SD-WAN infrastructure management page is displayed. By default, the Network resources tab is selected, which displays the table of SD-WAN Controllers.
- Click Management next to the SD-WAN Controller and in the drop-down list, select Configuration menu.
This opens the SD-WAN Controller configuration menu. By default, you are taken to the Controller nodes section, which displays a table of Controller nodes.
- Go to the SNMP section.
A table of traps is displayed.
- In the upper part of the page, under Manager parameters, click Edit.
- This opens a window; in that window, in the Address field, enter the IP address or host name of the equipment on which the SNMP agent is installed, in the <transport protocol>:<IP address or host name>/<port number> format. For example, you can enter
udp:192.168.2.0/24. - In the Community field, enter the SNMP community string. The community string is used as a password which the SNMP manager uses to connect to SNMP agents. The default value is
public, which provides read-only access. We recommend changing the default to a more secure and unique community string to ensure reliable communication between your SNMP manager and SNMP agents.You must specify the same community string when configuring the SNMP manager connection to SNMP agents and when creating traps.
- Click Save.
Creating a trap
You can create a trap that SNMP agents must send to the SNMP manager.
To create a trap:
- In the menu, go to the Infrastructure section.
The SD-WAN infrastructure management page is displayed. By default, the Network resources tab is selected, which displays the table of SD-WAN Controllers.
- Click Management next to the SD-WAN Controller and in the drop-down list, select Configuration menu.
This opens the SD-WAN Controller configuration menu. By default, you are taken to the Controller nodes section, which displays a table of Controller nodes.
- Go to the SNMP section.
A table of traps is displayed.
- Under Trap parameters, click Edit.
- This opens a window; in that window, click Add to create a trap.
- In the Manager port field, enter the IP address or hostname of the SNMP manager. In Kaspersky SD-WAN, the Zabbix proxy server acts as the SNMP manager.
- In the Manager port field, enter the port number of the SNMP manager. The default setting is
162. - In the Community field, enter the SNMP community string. The community string is used as a password which the SNMP manager uses to connect to SNMP agents. The default value is
public, which provides read-only access. We recommend changing the default to a more secure and unique community string to ensure reliable communication between your SNMP manager and SNMP agents.You must specify the same community string when configuring the SNMP manager connection to SNMP agents and when creating traps.
- In the Allowed traps field, click Edit and select the following check boxes to select which traps SNMP agents can send to the SNMP manager:
- Select the ifUpNotification check box to have the SNMP agent send a trap to the SNMP manager when one of the network interfaces of the equipment on which the agent is installed becomes active.
- Select the ifDownNotification check box to have the SNMP agent send a trap to the SNMP manager when one of the network interfaces of the equipment on which the agent is installed becomes inactive.
- Select the swUpNotification check box to have the SNMP agent send a trap to the SNMP manager when one the equipment on which the agent is installed becomes active.
- Select the swDownNotification check box to have the SNMP agent send a trap to the SNMP manager when the equipment on which the agent is installed becomes inactive.
By default, all check boxes are selected.
- Click Back to continue specifying settings.
- In the Description field, enter a brief description of the trap.
- Click Save.
The trap is created and displayed in the table.
Page topEditing a trap
To edit a trap:
- In the menu, go to the Infrastructure section.
The SD-WAN infrastructure management page is displayed. By default, the Network resources tab is selected, which displays the table of SD-WAN Controllers.
- Click Management next to the SD-WAN Controller and in the drop-down list, select Configuration menu.
This opens the SD-WAN Controller configuration menu. By default, you are taken to the Controller nodes section, which displays a table of Controller nodes.
- Go to the SNMP section.
A table of traps is displayed.
- Under Trap parameters, click Edit.
- This opens a window; in that window, edit the settings that you want to change. For a description of the settings, see instructions for creating a trap.
- Click Save.
Deleting a trap
Deleted traps cannot be restored.
To delete a trap:
- In the menu, go to the Infrastructure section.
The SD-WAN infrastructure management page is displayed. By default, the Network resources tab is selected, which displays the table of SD-WAN Controllers.
- Click Management next to the SD-WAN Controller and in the drop-down list, select Configuration menu.
This opens the SD-WAN Controller configuration menu. By default, you are taken to the Controller nodes section, which displays a table of Controller nodes.
- Go to the SNMP section.
A table of traps is displayed.
- Under Trap parameters, click Edit.
- This opens a window; in that window, click Delete next to the trap.
- Click Save.
The trap is deleted and is no longer displayed in the table.
Page top