Contents
- Administrator's guide
- Logging in to the KUMA console
- KUMA services
- Services tools
- Service resource sets
- Creating a storage
- Creating a correlator
- Creating a collector
- Creating an agent
- Configuring event sources
- Configuring receipt of Auditd events
- Configuring receipt of KATA/EDR events
- Configuring Kaspersky Security Center event receiving in CEF format
- Configuring receiving Kaspersky Security Center event from MS SQL
- Creating an account in the MS SQL database
- Configuring the SQL Server Browser service
- Creating a secret in KUMA
- Configuring a connector
- Configuring the KUMA Collector for receiving Kaspersky Security Center events from an MS SQL database
- Installing the KUMA Collector for receiving Kaspersky Security Center events from the MS SQL database
- Configuring receipt of events from Windows devices using KUMA Agent (WEC)
- Configuring audit of events from Windows devices
- Configuring centralized receipt of events from Windows devices using the Windows Event Collector service
- Granting permissions to view Windows events
- Granting permissions to log on as a service
- Configuring the KUMA Collector for receiving events from Windows devices
- Installing the KUMA Collector for receiving events from Windows devices
- Configuring forwarding of events from Windows devices to KUMA using KUMA Agent (WEC)
- Configuring receipt of events from Windows devices using KUMA Agent (WMI)
- Configuring receipt of PostgreSQL events
- Configuring receipt of IVK Kolchuga-K events
- Configuring receipt of CryptoPro NGate events
- Configuring receipt of Ideco UTM events
- Configuring receipt of KWTS events
- Configuring receipt of KLMS events
- Configuring receipt of KSMG events
- Configuring receipt of PT NAD events
- Configuring receipt of events using the MariaDB Audit Plugin
- Configuring receipt of Apache Cassandra events
- Configuring receipt of FreeIPA events
- Configuring receipt of VipNet TIAS events
- Configuring receipt of Nextcloud events
- Configuring receipt of Snort events
- Configuring receipt of Suricata events
- Configuring receipt of FreeRADIUS events
- Configuring receipt of VMware vCenter events
- Configuring receipt of zVirt events
- Configuring receipt of Zeek IDS events
- Monitoring event sources
- Managing assets
- Adding an asset category
- Configuring the table of assets
- Searching assets
- Exporting asset data
- Viewing asset details
- Adding assets
- Assigning a category to an asset
- Editing the parameters of assets
- Archiving assets
- Deleting assets
- Updating third-party applications and fixing vulnerabilities on Kaspersky Security Center assets
- Moving assets to a selected administration group
- Asset audit
- Custom asset fields
- Critical information infrastructure assets
- Integration with other solutions
- Integration with Kaspersky Security Center
- Kaspersky Endpoint Detection and Response integration
- Integration with Kaspersky CyberTrace
- Integration with Kaspersky Threat Intelligence Portal
- Connecting over LDAP
- Enabling and disabling LDAP integration
- Adding a tenant to the LDAP server integration list
- Creating an LDAP server connection
- Creating a copy of an LDAP server connection
- Changing an LDAP server connection
- Changing the data update frequency
- Changing the data storage period
- Starting account data update tasks
- Deleting an LDAP server connection
- Kaspersky Industrial CyberSecurity for Networks integration
- Integration with Neurodat SIEM IM
- Kaspersky Automated Security Awareness Platform
- Sending notifications to Telegram
- UserGate integration
- Integration with Kaspersky Web Traffic Security
- Integration with Kaspersky Secure Mail Gateway
- Importing asset information from RedCheck
- Configuring receipt of Sendmail events
- Managing KUMA
- Working with geographic data
Administrator's guide
This chapter provides information about installing and configuring the KUMA SIEM system.
Logging in to the KUMA console
To go to the KUMA console, in the XDR web interface, go to the Settings → KUMA section.
This takes you to the KUMA console. The console is opened in a new browser tab.
Page topKUMA services
Services are the main components of KUMA that help the system to manage events: services allow you to receive events from event sources and subsequently bring them to a common form that is convenient for finding correlation, as well as for storage and manual analysis. Each service consists of two parts that work together:
- One part of the service is created inside the KUMA web interface based on set of resources for services.
- The second part of the service is installed in the network infrastructure where the KUMA system is deployed as one of its components. The server part of a service can consist of multiple instances: for example, services of the same agent or storage can be installed on multiple devices at once.
On the server side, KUMA services are located in the
/opt/kaspersky/kumadirectory.When you install KUMA in high availability mode, only the KUMA Core is installed in the cluster. Collectors, correlators, and storages are hosted on hosts outside of the Kubernetes cluster.
Parts of services are connected to each other via the service ID.
Service types:
- Storages are used to save events.
- Correlators are used to analyze events and search for defined patterns.
- Collectors are used to receive events and convert them to KUMA format.
- Agents are used to receive events on remote devices and forward them to KUMA collectors.
In the KUMA web interface, services are displayed in the Resources → Active services section in table format. The table of services can be updated using the Refresh button and sorted by columns by clicking on the active headers.
The maximum table size is not limited. If you want to select all services, scroll to the end of the table and select the Select all check box, which selects all available services in the table.
Table columns:
- Status—service status:
- Green means that the service is running.
- Red means that the service is not running.
- Yellow means that there is no connection with ClickHouse nodes (this status is applied only to storage services). The reason for this is indicated in the service log if logging was enabled.
- Gray—if a deleted tenant had a running service that continues to work, that service is displayed with a gray status on the Active services page. Services with the gray status are kept to let you copy the ID and remove services on your servers. Only the General administrator can delete services with the gray status. When a tenant is deleted, the services of that tenant are assigned to the Main tenant.
- Type—type of service: agent, collector, correlator, or storage.
- Name—name of the service. Clicking on the name of the service opens its settings.
- Version—service version.
- Tenant—the name of the tenant that owns the service.
- FQDN—fully qualified domain name of the service server.
- IP address—IP address of the server where the service is installed.
- API port—Remote Procedure Call port number.
- Uptime—the time showing how long the service has been running.
- Created—the date and time when the service was created.
The table can be sorted in ascending and descending order, as well as by the Status parameter. To sort active services, right-click the context menu and select one or more statuses.
You can use the buttons in the upper part of the Services window to perform the following group actions:
- Add service
You can create new services based on existing service resource sets. We do not recommend creating services outside the main tenant without first carefully planning the inter-tenant interactions of various services and users.
- Refresh list
- Update configuration
- Restart
- Reset certificate
- Delete
To perform an action with an individual service, right-click the service to display its context menu. The following actions are available:
- Copy service ID
You need this ID to install, restart, stop, or delete the service.
- Go to Events
- Update service configuration
- Restart service
- Download log
If you want to receive detailed information, enable the Debug mode in the service settings.
- Reset certificate
- Delete service
To change a service, select a service under Resources → Active services. This opens a window with a set of resources based on which the service was created. You can edit the settings of the set of resources and save your changes. To apply the saved changes, restart the service.
If, when changing the settings of a collector resource set, you change or delete conversions in a normalizer connected to it, the edits will not be saved, and the normalizer itself may be corrupted. If you need to modify conversions in a normalizer that is already part of a service, the changes must be made directly to the normalizer under Resources → Normalizers in the web interface.
Services tools
This section describes the tools for working with services available in the Resources → Active services section of the KUMA web interface.
Getting service identifier
The service identifier is used to bind parts of the service residing within KUMA and installed in the network infrastructure into a single complex. An identifier is assigned to a service when it is created in KUMA, and is then used when installing the service to the server.
To get the identifier of a service:
- Log in to the KUMA console and open Resources → Active services.
- Select the check box next to the service whose ID you want to obtain, and click Copy ID.
The identifier of the service will be copied to the clipboard. It can be used, for example, for installing the service on a server.
Page topStopping, starting, checking status of the service
While managing KUMA, you may need to perform the following operations.
- Temporarily stop the service. For example, when restoring the Core from backup, or to edit service settings related to the operating system.
- Start the service.
- Check the status of the service.
The "Commands for stopping, starting, and checking the status of a service" table lists commands that may be useful when managing KUMA.
Commands for stopping, starting, and checking the status of a service
Service |
Stop service |
Start service |
Check the status of the service |
|---|---|---|---|
Core |
|
|
|
Services with an ID:
|
|
|
|
Services without an ID:
|
|
|
|
Windows agents |
To stop an agent service: 1. Copy the agent ID in the KUMA web interface. 2. Connect to the host on which you want to start the KUMA agent service. 3. Run PowerShell as a user with administrative privileges. 4. Run the following command in PowerShell:
|
To start an agent service: 1. Copy the agent ID in the KUMA web interface. 2. Connect to the host on which you want to start the KUMA agent service. 3. Run PowerShell as a user with administrative privileges. 4. Run the following command in PowerShell:
|
To view the status of an agent service: 1. In Windows, go to the Start → Services menu, and in the list of services, double-click the relevant KUMA agent. 2. This opens a window; in that window, view the status of the agent in the Service status field. |
Restarting the service
To restart the service:
- Log in to the KUMA console and open Resources → Active services.
- Select the check box next to the service and select the necessary option:
- Update configuration—perform a hot update of a running service configuration. For example, you can change the field mapping settings or the destination point settings this way.
- Restart—stop a service and start it again. This option is used to modify the port number or connector type.
Restarting KUMA agents:
- KUMA Windows Agent can be restarted as described above only if it is running on a remote computer. If the service on the remote computer is inactive, you will receive an error when trying to restart from KUMA. In that case you must restart KUMA Windows Agent service on the remote Windows machine. For information on restarting Windows services, refer to the documentation specific to the operating system version of your remote Windows computer.
- KUMA Agent for Linux stops when this option is used. To start the agent again, you must execute the command that was used to start it.
- Reset certificate—remove certificates that the service uses for internal communication. For example, this option can be used to renew the Core certificate.
Special considerations for deleting Windows agent certificates:
- If the agent has the green status and you select Reset certificate, KUMA deletes the current certificate and creates a new one, the agent continues working with the new certificate.
- If the agent has the red status and you select Reset certificate, KUMA generates an error that the agent is not running. In the agent installation folder %APPDATA%\kaspersky\kuma\<Agent ID>\certificates, manually delete the internal.cert and internal.key files and start the agent manually. When the agent starts, a new certificate is created automatically.
Special considerations for deleting Linux agent certificates:
- Regardless of the agent status, apply the Reset certificate option in the web interface to delete the certificate in the databases.
- In the agent installation folder /opt/kaspersky/agent/<Agent ID>/certificates, manually delete the internal.cert and internal.key files.
- Since the Reset certificate option stops the agent, to continue its operation, start the agent manually. When the agent starts, a new certificate is created automatically.
Deleting the service
Before deleting the service get its ID. The ID will be required to remove the service for the server.
To remove a service in the KUMA console:
- Log in to the KUMA console and open Resources → Active services.
- Select the check box next to the service you want to delete, and click Delete.
A confirmation window opens.
- Click OK.
The service has been deleted from KUMA.
To remove a service from the server, run the following command:
sudo /opt/kaspersky/kuma/kuma <collector/correlator/storage> --id <service ID> --uninstall
The service has been deleted from the server.
Partitions window
If the storage service was created and installed, you can view its partitions in the Partitions table.
To open Partitions table:
- Log in to the KUMA console and open Resources → Active services.
- Select the check box next to the relevant storage and click Go to partitions.
The Partitions table opens.
The table has the following columns:
- Tenant—the name of the tenant that owns the stored data.
- Created—partition creation date.
- Space—the name of the space.
- Size—the size of the space.
- Events—the number of stored events.
- Transfer to cold storage—the date when data will be migrated from the ClickHouse clusters to cold storage disks.
- Expires—the date when the partition expires. After this date, the partition and the events it contains are no longer available.
You can delete partitions.
To delete a partition:
- Open the Partitions table (see above).
- Open the
 drop-down list to the left from the required partition.
 - Select Delete.
A confirmation window opens.
- Click OK.
The partition has been deleted. Audit event partitions cannot be deleted.
Page topSearching for related events
You can search for events processed by the Correlator or the Collector services.
To search for events related to the Correlator or the Collector service:
- Log in to the KUMA console and open Resources → Active services.
- Select the check box next to the required correlator or collector and click Go to Events.
A new browser tab opens with the KUMA Events section open.
- To find events, click the
 icon.
icon.A table with events selected by the search expression
ServiceID = <ID of the selected service> will be displayed.
Service resource sets
Service resource sets are a resource type, a KUMA component, a set of settings based on which the KUMA services are created and operate. Resource sets for services are collections of resources.
Any resources added to a set of resources must be owned by the same tenant that owns the created set of resources. An exception is the shared tenant, whose owned resources can be used in the sets of resources of other tenants.
Resource sets for services are displayed in the Resources → <Resource set type for the service> section of the KUMA console. Available types:
- Collectors
- Correlators
- Storages
- Agents
When you select the required type, a table opens with the available sets of resources for services of this type. The resource table contains the following columns:
- Name—the name of a resource set. Can be used for searching and sorting.
- Updated—the date and time of the last update of the resource set. Can be used for sorting.
- Created by—the name of the user who created the resource set.
- Description—the description of the resource set.
Creating a storage
A storage consists of two parts: one part is created inside the KUMA console, and the other part is installed on network infrastructure servers intended for storing events. The server part of a KUMA storage consists of ClickHouse nodes collected into a cluster. ClickHouse clusters can be supplemented with cold storage disks.
For each ClickHouse cluster, a separate storage must be installed.
Prior to storage creation, carefully plan the cluster structure and deploy the necessary network infrastructure. When choosing a ClickHouse cluster configuration, consider the specific event storage requirements of your organization.
It is recommended to use ext4 as the file system.
A storage is created in several steps:
- Creating a set of resources for a storage in the KUMA console
- Creating a storage service in the KUMA console
- Installing storage nodes in the network infrastructure
When creating storage cluster nodes, verify the network connectivity of the system and open the ports used by the components.
If the storage settings are changed, the service must be restarted.
ClickHouse cluster structure
A ClickHouse cluster is a logical group of devices that possess all accumulated normalized KUMA events. It consists of one or more logical shards.
A shard is a logical group of devices that possess a specific portion of all normalized events accumulated in the cluster. It consists of one or more replicas. Increasing the number of shards lets you do the following:
- Accumulate more events by increasing the total number of servers and disk space.
- Absorb a larger stream of events by distributing the load associated with an influx of new events.
- Reduce the time taken to search for events by distributing search zones among multiple devices.
A replica is a device that is a member of a logical shard and possesses a single copy of that shard's data. If multiple replicas exist, it means multiple copies exist (the data is replicated). Increasing the number of replicas lets you do the following:
- Improve high availability.
- Distribute the total load related to data searches among multiple machines (although it's best to increase the number of shards for this purpose).
A keeper is a device that participates in coordination of data replication at the whole cluster level. At least one device per cluster must have this role. The recommended number of the devices with this role is 3. The number of devices involved in coordinating replication must be an odd number. The keeper and replica roles can be combined in one machine.
Page topClickHouse cluster node settings
Prior to storage creation, carefully plan the cluster structure and deploy the necessary network infrastructure. When choosing a ClickHouse cluster configuration, consider the specific event storage requirements of your organization.
When creating ClickHouse cluster nodes, verify the network connectivity of the system and open the ports used by the components.
For each node of the ClickHouse cluster, you need to specify the following settings:
- Fully qualified domain name (FQDN)—a unique address to access the node. Specify the entire FQDN, for example,
kuma-storage.example.com. - Shard, replica, and keeper IDs—the combination of these settings determines the position of the node in the ClickHouse cluster structure and the node role.
Node roles
The roles of the nodes depend on the specified settings:
- shard, replica, keeper—the node participates in the accumulation and search of normalized KUMA events and helps coordinate data replication at the cluster-wide level.
- shard, replica—the node participates in the accumulation and search of normalized KUMA events.
- keeper—the node does not accumulate normalized events, but helps coordinate data replication at the cluster-wide level. Dedicated keepers must be specified at the beginning of the list in the Resources → Storages → <Storage> → Basic settings → ClickHouse cluster nodes section.
ID requirements:
- If multiple shards are created in the same cluster, the shard IDs must be unique within this cluster.
- If multiple replicas are created in the same shard, the replica IDs must be unique within this shard.
- The keeper IDs must be unique within the cluster.
Example of ClickHouse cluster node IDs:
- shard 1, replica 1, keeper 1;
- shard 1, replica 2;
- shard 2, replica 1;
- shard 2, replica 2, keeper 3;
- shard 2, replica 3;
- keeper 2.
Cold storage of events
In KUMA, you can configure the migration of legacy data from a ClickHouse cluster to the cold storage. Cold storage can be implemented using the local disks mounted in the operating system or the Hadoop Distributed File System (HDFS). Cold storage is enabled when at least one cold storage disk is specified. If a cold storage disk is not configured and the server runs out of disk space, the storage service is stopped. If both hot storage and cold storage are configured, and space runs out on the cold storage disk, the KUMA storage service is stopped. We recommend avoiding such situations.
Cold storage disks can be added or removed.
After changing the cold storage settings, the storage service must be restarted. If the service does not start, the reason is specified in the storage log.
If the cold storage disk specified in the storage settings has become unavailable (for example, out of order), this may lead to errors in the operation of the storage service. In this case, recreate a disk with the same path (for local disks) or the same address (for HDFS disks) and then delete it from the storage settings.
Rules for moving the data to the cold storage disks
When cold storage is enabled, KUMA checks the storage terms of the spaces once an hour:
- If the storage term for a space on a ClickHouse cluster expires, the data is moved to the cold storage disks. If a cold storage disk is misconfigured, the data is deleted.
- If the storage term for a space on a cold storage disk expires, the data is deleted.
- If the ClickHouse cluster disks are 95% full, the biggest partitions are automatically moved to the cold storage disks. This can happen more often than once per hour.
- Audit events are generated when data transfer starts and ends.
During data transfer, the storage service remains operational, and its status stays green in the Resources → Active services section of the KUMA web interface. When you hover the mouse pointer over the status icon, a message indicating the data transfer appears. When a cold storage disk is removed, the storage service has the yellow status.
Special considerations for storing and accessing events
- When using HDFS disks for cold storage, protect your data in one of the following ways:
- Configure a separate physical interface in the VLAN, where only HDFS disks and the ClickHouse cluster are located.
- Configure network segmentation and traffic filtering rules that exclude direct access to the HDFS disk or interception of traffic to the disk from ClickHouse.
- Events located in the ClickHouse cluster and on the cold storage disks are equally available in the KUMA web interface. For example, when you search for events or view events related to alerts.
- Storing events or audit events on cold storage disks is not mandatory; to disable this functionality, specify
0(days) in the Cold retention period or Audit cold retention period field in the storage settings.
Special considerations for using HDFS disks
- Before connecting HDFS disks, create directories for each node of the ClickHouse cluster on them in the following format:
<HDFS disk host>/<shard ID>/<replica ID>. For example, if a cluster consists of two nodes containing two replicas of the same shard, the following directories must be created:- hdfs://hdfs-example-1:9000/clickhouse/1/1/
- hdfs://hdfs-example-1:9000/clickhouse/1/2/
Events from the ClickHouse cluster nodes are migrated to the directories with names containing the IDs of their shard and replica. If you change these node settings without creating a corresponding directory on the HDFS disk, events may be lost during migration.
- HDFS disks added to storage operate in the JBOD mode. This means that if one of the disks fails, access to the storage will be lost. When using HDFS, take high availability into account and configure RAID, as well as storage of data from different replicas on different devices.
- The speed of event recording to HDFS is usually lower than the speed of event recording to local disks. The speed of accessing events in HDFS, as a rule, is significantly lower than the speed of accessing events on local disks. When using local disks and HDFS disks at the same time, the data is written to them in turn.
Removing cold storage disks
Before physically disconnecting cold storage disks, remove these disks from the storage settings.
To remove a disk from the storage settings:
- In the KUMA console, under Resources → Storages, select the relevant storage.
This opens the storage.
- In the window, in the Disks for cold storage section, in the required disk's group of settings, click Delete disk.
Data from removed disk is automatically migrated to other cold storage disks or, if there are no such disks, to the ClickHouse cluster. During data migration, the storage status icon is highlighted in yellow. Audit events are generated when data transfer starts and ends.
- After event migration is complete, the disk is automatically removed from the storage settings. It can now be safely disconnected.
Removed disks can still contain events. If you want to delete them, you can manually delete the data partitions using the DROP PARTITION command.
If the cold storage disk specified in the storage settings has become unavailable (for example, out of order), this may lead to errors in the operation of the storage service. In this case, create a disk with the same path (for local disks) or the same address (for HDFS disks) and then delete it from the storage settings.
Page topDetaching, archiving, and attaching partitions
If you want to optimize disk space and speed up queries in KUMA, you can detach data partitions in ClickHouse, archive partitions, or move partitions to a drive. If necessary, you can later reattach the partitions you need and perform data processing.
Detaching partitions
To detach partitions:
- Determine the shard on all replicas of which you want to detach the partition.
- Get the partition ID using the following command:
sudo /opt/kaspersky/kuma/clickhouse/bin/client.sh -d kuma --multiline --query "SELECT partition, name FROM system.parts;" |grep 20231130In this example, the command returns the partition ID for November 30, 2023.
- One each replica of the shard, detach the partition using the following command and specifying the partition ID:
sudo /opt/kaspersky/kuma/clickhouse/bin/client.sh -d kuma --multiline --query "ALTER TABLE events_local_v2 DETACH PARTITION ID '<partition ID>'"
As a result, the partition is detached on all replicas of the shard. Now you can move the data directory to a drive or archive the partition.
Archiving partitions
To archive detached partitions:
- Find the detached partition in disk subsystem of the server:
sudo find /opt/kaspersky/kuma/clickhouse/data/ -name <ID of the detached partition>\* Change to the 'detached' directory that contains the detached partition, and while in the 'detached' directory, perform the archival:sudo cd <path to the 'detached' directory containing the detached partition>sudo zip -9 -r detached.zip *For example:
sudo cd /opt/kaspersky/kuma/clickhouse/data/store/d5b/d5bdd8d8-e1eb-4968-95bd-d8d8e1eb3968/detached/sudo zip -9 -r detached.zip *
The partition is archived.
Attaching partitions
To attach archived partitions to KUMA:
- Increase the Retention period value.
KUMA deletes data based on the date specified in the Timestamp field, which records the time when the event is received, and based on the Retention period value that you set for the storage.
Before restoring archived data, make sure that the Retention period value overlaps the date in the Timestamp field. If this is not the case, the archived data will be deleted within 1 hour.
- Place the archive partition in the 'detached' section of your storage and unpack the archive:
sudounzip detached.zip -d<path to the 'detached' directory>For example:
sudounzip detached.zip -d/opt/kaspersky/kuma/clickhouse/data/store/d5b/d5bdd8d8-e1eb-4968-95bd-d8d8e1eb3968/detached/ - Run the command to attach the partition:
sudo /opt/kaspersky/kuma/clickhouse/bin/client.sh -d kuma --multiline --query "ALTER TABLE events_local_v2 ATTACH PARTITION ID '<partition ID>'"Repeat the steps of unpacking the archive and attaching the partition on each replica of the shard.
As a result, the archived partition is attached and its events are again available for search.
Page topCreating a set of resources for a storage
In the KUMA console, a storage service is created based on the set of resources for the storage.
To create a set of resources for a storage in the KUMA console:
- In the KUMA console, under Resources → Storages, click Add storage.
This opens the Create storage window.
- On the Basic settings tab, in the Storage name field, enter a unique name for the service you are creating. The name must contain 1 to 128 Unicode characters.
- In the Tenant drop-down list, select the tenant that will own the storage.
- You can optionally add up to 256 Unicode characters describing the service in the Description field.
- In the Retention period field, specify the period, in days from the moment of arrival, during which you want to store events in the ClickHouse cluster. When the specified period expires, events are automatically deleted from the ClickHouse cluster. If cold storage of events is configured, when the event storage period in the ClickHouse cluster expires, the data is moved to cold storage disks. If a cold storage disk is misconfigured, the data is deleted.
- In the Audit retention period field, specify the period, in days, to store audit events. The minimum value and default value is
365. - If cold storage is required, specify the event storage term:
- Cold retention period—the number of days to store events. The minimum value is
1. - Audit cold retention period—the number of days to store audit events. The minimum value is 0.
- Cold retention period—the number of days to store events. The minimum value is
- In the Debug drop-down list, specify whether resource logging must be enabled. The default value (Disabled) means that only errors are logged for all KUMA components. If you want to obtain detailed data in the logs, select Enabled.
- If you want to change ClickHouse settings, in the ClickHouse configuration override field, paste the lines with settings from the ClickHouse configuration XML file /opt/kaspersky/kuma/clickhouse/cfg/config.xml. Specifying the root elements <yandex>, </yandex> is not required. Settings passed in this field are used instead of the default settings.
Example:
<merge_tree>
<parts_to_delay_insert>600</parts_to_delay_insert>
<parts_to_throw_insert>1100</parts_to_throw_insert>
</merge_tree>
- If necessary, in the Spaces section, add spaces to the storage to distribute the stored events.
There can be multiple spaces. You can add spaces by clicking the Add space button and remove them by clicking the Delete space button.
Available settings:
- In the Name field, specify a name for the space containing 1 to 128 Unicode characters.
- In the Retention period field, specify the number of days to store events in the ClickHouse cluster.
- If necessary, in the Cold retention period field, specify the number of days to store the events in the cold storage. The minimum value is
1. - In the Filter section, you can specify conditions to identify events that will be put into this space. You can select an existing filter from the drop-down list or create a new filter.
Creating a filter in resources
- In the Filter drop-down list, select Create new.
- If you want to keep the filter as a separate resource, select the Save filter check box.
In this case, you will be able to use the created filter in various services.
This check box is cleared by default.
- If you selected the Save filter check box, enter a name for the created filter resource in the Name field. The name must contain 1 to 128 Unicode characters.
- In the Conditions settings block, specify the conditions that the events must meet:
- Click the Add condition button.
- In the Left operand and Right operand drop-down lists, specify the search parameters.
Depending on the data source selected in the Right operand field, you may see fields of additional parameters that you need to use to define the value that will be passed to the filter. For example, when choosing active list you will need to specify the name of the active list, the entry key, and the entry key field.
- In the operator drop-down list, select the relevant operator.
- If necessary, select the do not match case check box. When this check box is selected, the operator ignores the case of the values.
The selection of this check box does not apply to the InSubnet, InActiveList, InCategory or InActiveDirectoryGroup operators.
This check box is cleared by default.
- If you want to add a negative condition, select If not from the If drop-down list.
- You can add multiple conditions or a group of conditions.
- If you have added multiple conditions or groups of conditions, choose a search condition (and, or, not) by clicking the AND button.
- If you want to add existing filters that are selected from the Select filter drop-down list, click the Add filter button.
You can view the nested filter settings by clicking the
 button.
After the service is created, you can view and delete spaces in the storage resource settings.
There is no need to create a separate space for audit events. Events of this type (Type=4) are automatically placed in a separate Audit space with a storage term of at least 365 days. This space cannot be edited or deleted from the KUMA console.
- If necessary, in the Disks for cold storage section, add to the storage the disks where you want to transfer events from the ClickHouse cluster for long-term storage.
There can be multiple disks. You can add disks by clicking the Add disk button and remove them by clicking the Delete disk button.
Available settings:
- In the Type drop-down list, select the type of the disk being connected:
- Local—for the disks mounted in the operating system as directories.
- HDFS—for the disks of the Hadoop Distributed File System.
- In the Name field, specify the disk name. The name must contain 1 to 128 Unicode characters.
- If you select Local disk type, specify the absolute directory path of the mounted local disk in the Path field. The path must begin and end with a "/" character.
- If you select HDFS disk type, specify the path to HDFS in the Host field. For example,
hdfs://hdfs1:9000/clickhouse/.
- In the Type drop-down list, select the type of the disk being connected:
- If necessary, in the ClickHouse cluster nodes section, add ClickHouse cluster nodes to the storage.
There can be multiple nodes. You can add nodes by clicking the Add node button and remove them by clicking the Remove node button.
Available settings:
- In the FQDN field, specify the fully qualified domain name of the node being added. For example,
kuma-storage-cluster1-server1.example.com. - In the shard, replica, and keeper ID fields, specify the role of the node in the ClickHouse cluster. The shard and keeper IDs must be unique within the cluster, the replica ID must be unique within the shard. The following example shows how to populate the ClickHouse cluster nodes section for a storage with dedicated keepers in a distributed installation. You can adapt the example to suit your needs.
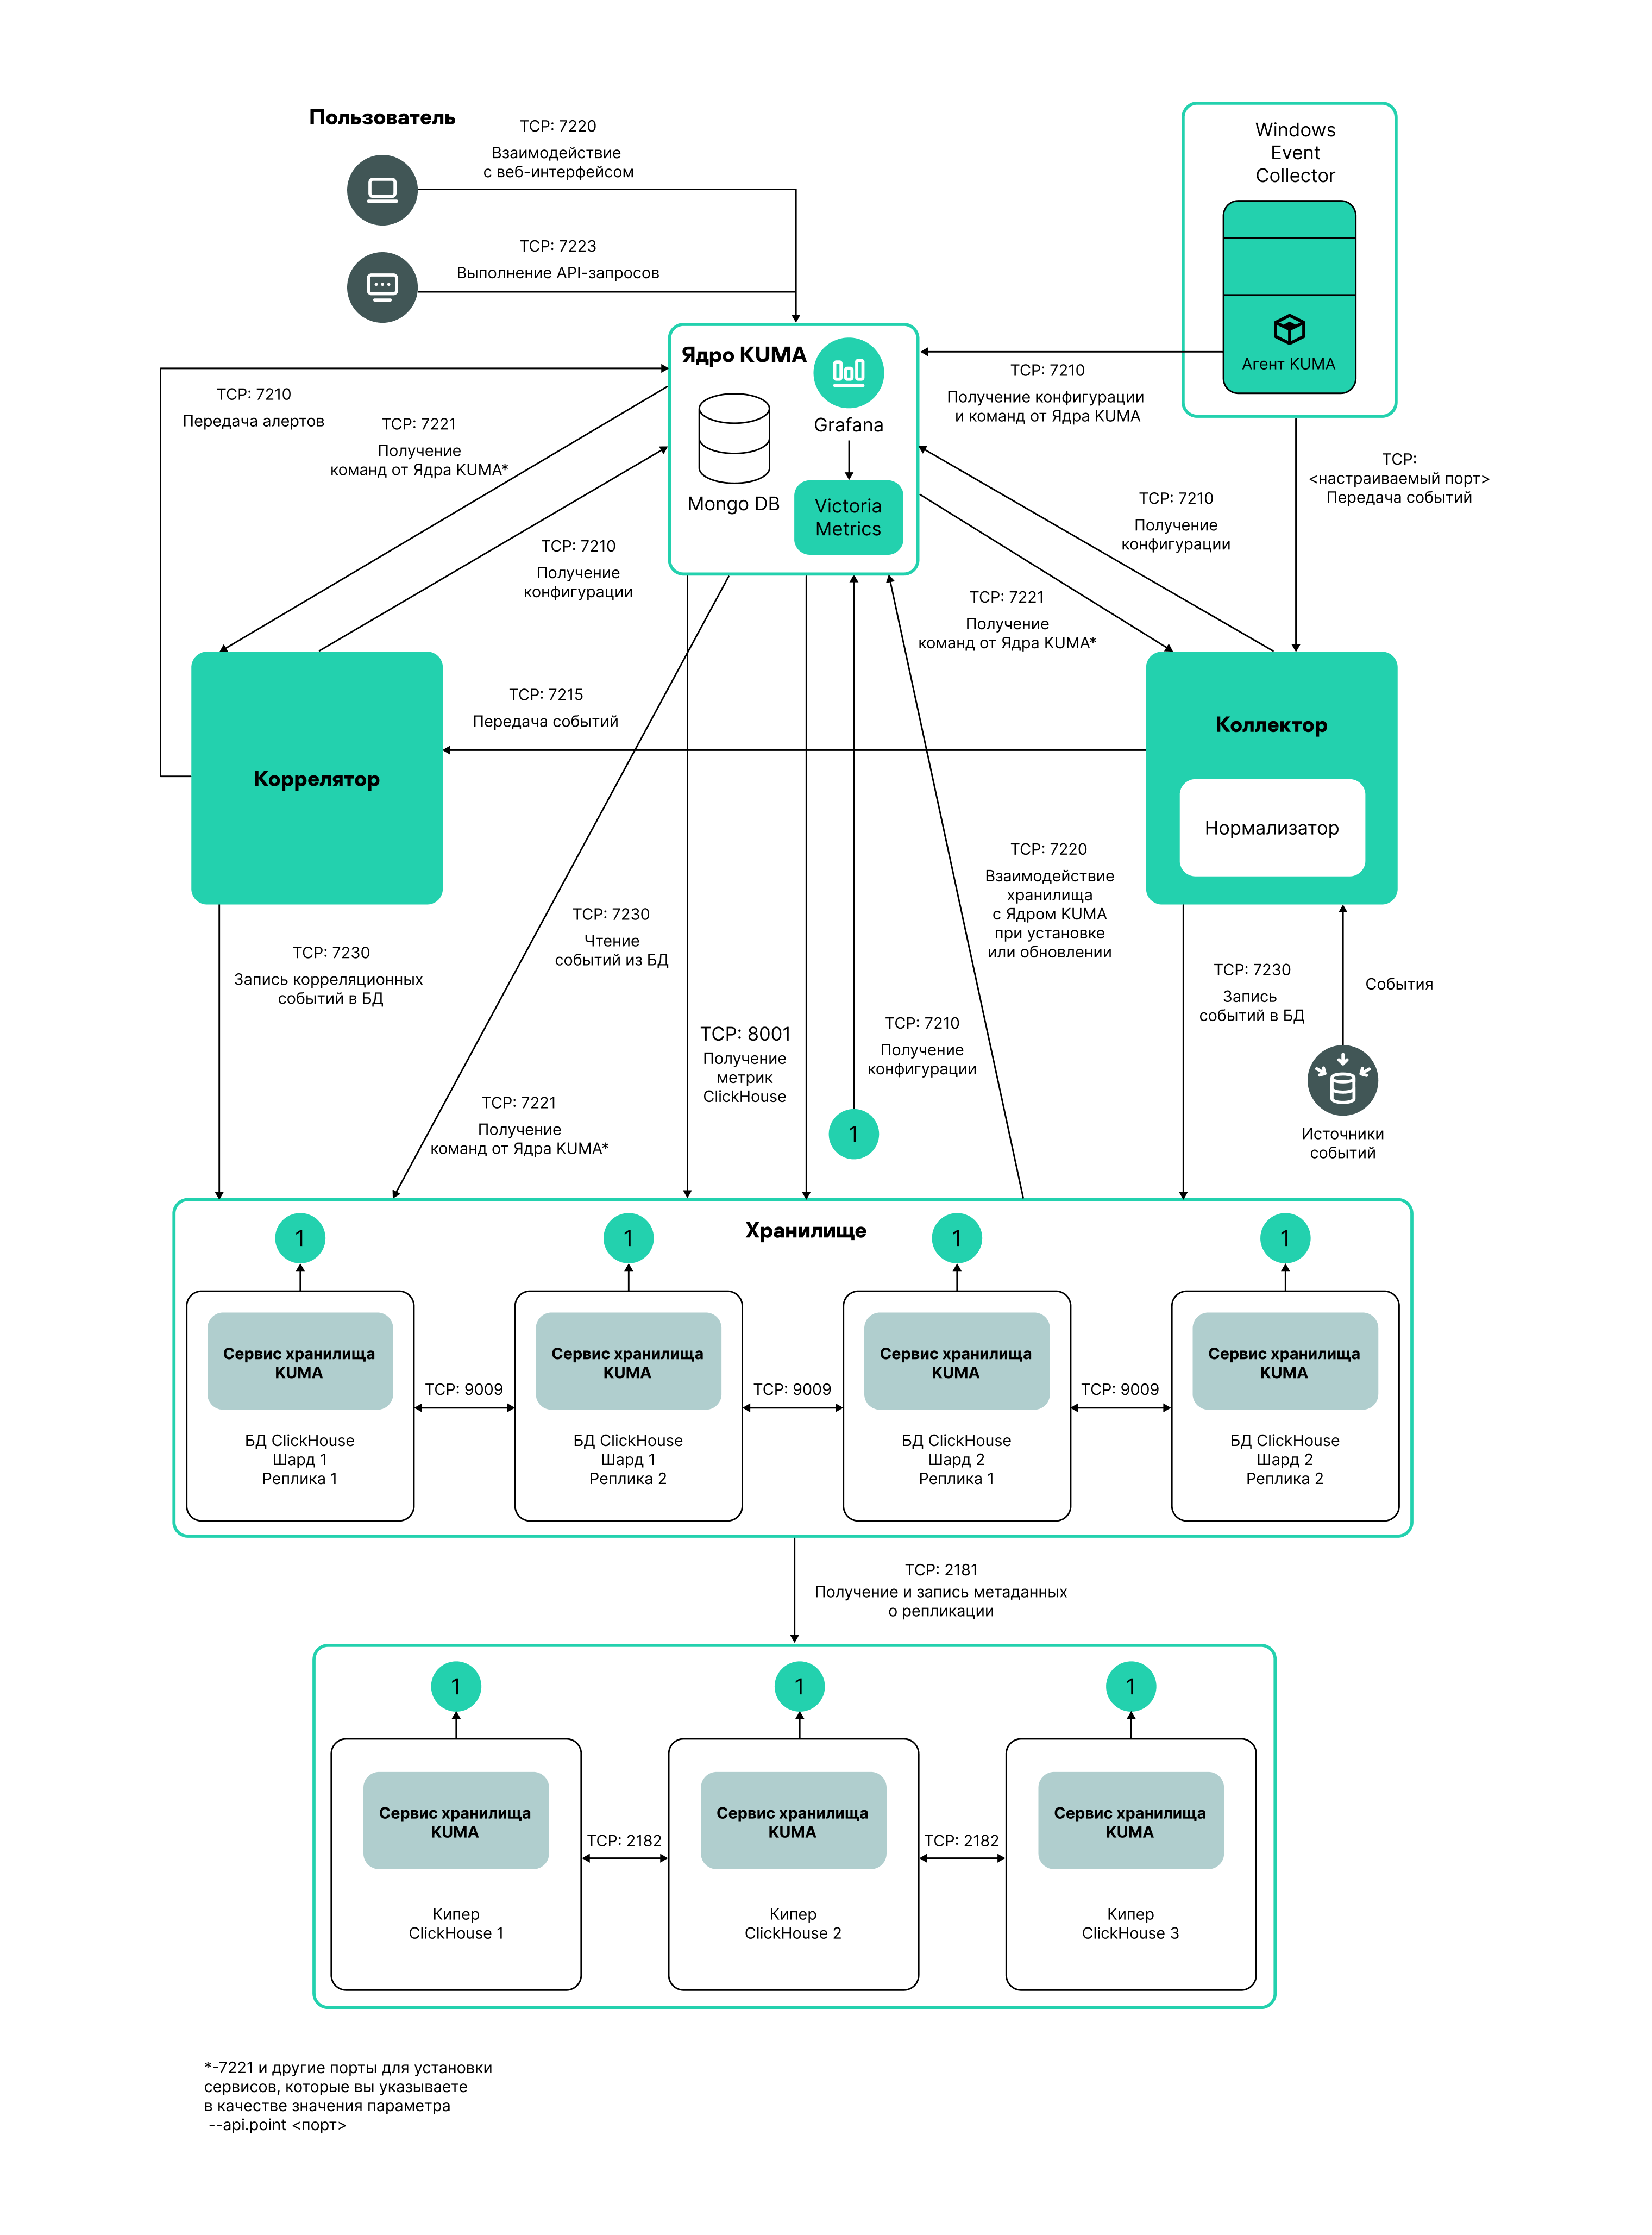
Distributed Installation diagram
Example:
ClickHouse cluster nodes
FQDN: kuma-storage-cluster1-server1.example.com
Shard ID: 0
Replica ID: 0
Keeper ID: 1
FQDN: kuma-storage-cluster1server2.example.com
Shard ID: 0
Replica ID: 0
Keeper ID: 2
FQDN: kuma-storage-cluster1server3.example.com
Shard ID: 0
Replica ID: 0
Keeper ID: 3
FQDN: kuma-storage-cluster1server4.example.com
Shard ID: 1
Replica ID: 1
Keeper ID: 0
FQDN: kuma-storage-cluster1server5.example.com
Shard ID: 1
Replica ID: 2
Keeper ID: 0
FQDN: kuma-storage-cluster1server6.example.com
Shard ID: 2
Replica ID: 1
Keeper ID: 0
FQDN: kuma-storage-cluster1server7.example.com
Shard ID: 2
Replica ID: 2
Keeper ID: 0
- In the FQDN field, specify the fully qualified domain name of the node being added. For example,
- On the Advanced settings tab, in the Buffer size field, enter the buffer size in bytes, that causes events to be sent to the database when reached. The default value is 64 MB. No maximum value is configured. If the virtual machine has less free RAM than the specified Buffer size, KUMA sets the limit to 128 MB.
- On the Advanced Settings tab, In the Buffer flush interval field, enter the time in seconds for which KUMA waits for the buffer to fill up. If the buffer is not full, but the specified time has passed, KUMA sends events to the database. The default value is 1 second.
- On the Advanced settings tab, in the Disk buffer size limit field, enter the value in bytes. The disk buffer is used to temporarily store events that could not be sent for further processing or storage. If the disk space allocated for the disk buffer is exhausted, events are rotated as follows: new events replace the oldest events written to the buffer. The default value is 10 GB.
- On the Advanced Settings tab, from the Disk buffer disabled drop-down list, select a value to Enable or Disable the use of the disk buffer. By default, the disk buffer is enabled.
- On the Advanced Settings tab, In the Write to local database table drop-down list, select Enable or Disable. Writing is disabled by default.
In Enable mode, data is written only on the host where the storage is located. We recommend using this functionality only if you have configured balancing on the collector and/or correlator — at step 6. Routing, in the Advanced settings section, the URL selection policy field is set to Round robin.
In Disable mode, data is distributed among the shards of the cluster.
The set of resources for the storage is created and is displayed under Resources → Storages. Now you can create a storage service.
Page topCreating a storage service in the KUMA console
When a set of resources is created for a storage, you can proceed to create a storage service in KUMA.
To create a storage service in the KUMA console:
- In the KUMA console, under Resources → Active services, click Add service.
- In the opened Choose a service window, select the set of resources that you just created for the storage and click Create service.
The storage service is created in the KUMA console and is displayed under Resources → Active services. Now storage services must be installed to each node of the ClickHouse cluster by using the service ID.
Page topInstalling a storage in the KUMA network infrastructure
To create a storage:
- Log in to the server where you want to install the service.
- Create the /opt/kaspersky/kuma/ folder.
- Copy the "kuma" file to the /opt/kaspersky/kuma/ folder. The file is located in the installer in the /kuma-ansible-installer/roles/kuma/files/ folder.
Make sure the kuma file has sufficient rights to run.
- Execute the following command:
sudo /opt/kaspersky/kuma/kuma storage --core https://<KUMA Core server FQDN>:<port used by KUMA Core for internal communication (port 7210 by default)> --id <service ID copied from the KUMA console> --installExample:
sudo /opt/kaspersky/kuma/kuma storage --core https://kuma.example.com:7210 --id XXXXX --installWhen deploying several KUMA services on the same host, during the installation process you must specify unique ports for each component using the
--api.port <port>parameter. The following setting values are used by default:--api.port 7221. - Repeat steps 1–2 for each storage node.
The storage is installed.
Page topCreating a correlator
A correlator consists of two parts: one part is created inside the KUMA console, and the other part is installed on the network infrastructure server intended for processing events.
Actions in the KUMA console
A correlator is created in the KUMA console by using the Installation Wizard. This Wizard combines the necessary resources into a set of resources for the correlator. Upon completion of the Wizard, the service itself is automatically created based on this set of resources.
To create a correlator in the KUMA console,
Start the Correlator Installation Wizard:
- In the KUMA console, under Resources, click Add correlator.
- In the KUMA console, under Resources → Correlators, click Add correlator.
As a result of completing the steps of the Wizard, a correlator service is created in the KUMA console.
A resource set for a correlator includes the following resources:
- Correlation rules
- Enrichment rules (if required)
- Response rules (if required)
- Destinations (normally one for sending events to a storage)
These resources can be prepared in advance, or you can create them while the Installation Wizard is running.
Actions on the KUMA correlator server
If you are installing the correlator on a server that you intend to use for event processing, you need to run the command displayed at the last step of the Installation Wizard on the server. When installing, you must specify the ID automatically assigned to the service in the KUMA console, as well as the port used for communication.
Testing the installation
After creating a correlator, it is recommended to make sure that it is working correctly.
Starting the Correlator Installation Wizard
To start the Correlator Installation Wizard:
- In the KUMA console, under Resources, click Add correlator.
- In the KUMA console, under Resources → Correlators, click Add correlator.
Follow the instructions of the Wizard.
Aside from the first and last steps of the Wizard, the steps of the Wizard can be performed in any order. You can switch between steps by using the Next and Previous buttons, as well as by clicking the names of the steps in the left side of the window.
After the Wizard completes, a resource set for the correlator is created in the KUMA console under Resources → Correlators, and a correlator service is added under Resources → Active services.
Step 1. General correlator settings
This is a required step of the Installation Wizard. At this step, you specify the main settings of the correlator: the correlator name and the tenant that will own it.
To define the main settings of the correlator:
- In the Name field, enter a unique name for the service you are creating. The name must contain 1 to 128 Unicode characters.
- In the Tenant drop-down list, select the tenant that will own the correlator. The tenant selection determines what resources will be available when the collector is created.
If you return to this window from another subsequent step of the Installation Wizard and select another tenant, you will have to manually edit all the resources that you have added to the service. Only resources from the selected tenant and shared tenant can be added to the service.
- If required, specify the number of processes that the service can run concurrently in the Workers field. By default, the number of worker processes is the same as the number of vCPUs on the server where the service is installed.
- If necessary, use the Debug drop-down list to enable logging of service operations.
- You can optionally add up to 256 Unicode characters describing the service in the Description field.
The main settings of the correlator are defined. Proceed to the next step of the Installation Wizard.
Page topStep 2. Global variables
If tracking values in event fields, active lists, or dictionaries is not enough to cover some specific security scenarios, you can use global and local variables. You can use them to take various actions on the values received by the correlators by implementing complex logic for threat detection. Variables can be assigned a specific function and then queried from correlation rules as if they were ordinary event fields, with the triggered function result received in response.
To add a global variable in the correlator,
click the Add variable button and specify the following parameters:
- In the Variable window, enter the name of the variable.
- In the Value window, enter the variable function.
The global variable is added. It can be queried from correlation rules by adding the $ character in front of the variable name. There can be multiple variables. Added variables can be edited or deleted by using the  icon.
icon.
Proceed to the next step of the Installation Wizard.
Page topStep 3. Correlation
This is an optional but recommended step of the Installation Wizard. On the Correlation tab of the Installation Wizard, select or create correlation rules. These resources define the sequences of events that indicate security-related incidents. When these sequences are detected, the correlator creates a correlation event and an alert.
If you have added global variables to the correlator, all added correlation rules can query them.
Correlation rules that are added to the set of resources for the correlator are displayed in the table with the following columns:
- Correlation rules—name of the correlation rule resource.
- Type—type of correlation rule: standard, simple, operational. The table can be filtered based on the values of this column by clicking the column header and selecting the relevant values.
- Actions—list of actions that will be performed by the correlator when the correlation rule is triggered. These actions are indicated in the correlation rule settings. The table can be filtered based on the values of this column by clicking the column header and selecting the relevant values.
Available values:
- Output—correlation events created by this correlation rule are transmitted to other correlator resources: enrichment, response rule, and then to other KUMA services.
- Edit active list—the correlation rule changes the active lists.
- Loop to correlator—the correlation event is sent to the same correlation rule for reprocessing.
- Categorization—the correlation rule changes asset categories.
- Event enrichment—the correlation rule is configured to enrich correlation events.
- Do not create alert—when a correlation event is created as a result of a correlation rule triggering, no alert is created for that. If you do not want to create an alert when a correlation rule is triggered, but you still want to send a correlation event to the storage, select the Output and No alert check boxes. If you select only the No alert check box, a correlation event is not saved in the storage.
- Shared resource—the correlation rule or the resources used in the correlation rule are located in a shared tenant.
You can use the Search field to search for a correlation rule. Added correlation rules can be removed from the set of resources by selecting the relevant rules and clicking Delete.
Selecting a correlation rule opens a window with its settings, which can be edited and then saved by clicking Save. If you click Delete in this window, the correlation rule is unlinked from the set of resources.
Use the Move up and Move down buttons to change the position of the selected correlation rules in the table. It affects their execution sequence when events are processed. Using the Move operational to top button, you can move correlation rules of the operational type to the beginning of the correlation rules list.
To link the existing correlation rules to the set of resources for the correlator:
- Click Link.
The resource selection window opens.
- Select the relevant correlation rules and click OK.
The correlation rules will be linked to the set of resources for the correlator and will be displayed in the rules table.
To create a new correlation rule in a set of resources for a correlator:
- Click Add.
The correlation rule creation window opens.
- Specify the correlation rule settings and click Save.
The correlation rule will be created and linked to the set of resources for the correlator. It is displayed in the correlation rules table and in the list of resources under Resources → Correlation rules.
Proceed to the next step of the Installation Wizard.
Page topStep 4. Enrichment
This is an optional step of the Installation Wizard. On the Enrichment tab of the Installation Wizard, you can select or create enrichment rules and indicate which data from which sources you want to add to correlation events that the correlator creates. There can be more than one enrichment rule. You can add them by clicking the Add button and can remove them by clicking the button.
To add an existing enrichment rule to a set of resources:
- Click Add.
This opens the enrichment rule settings block.
- In the Enrichment rule drop-down list, select the relevant resource.
The enrichment rule is added to the set of resources for the correlator.
To create a new enrichment rule in a set of resources:
- Click Add.
This opens the enrichment rule settings block.
- In the Enrichment rule drop-down list, select Create new.
- In the Source kind drop-down list, select the source of data for enrichment and define its corresponding settings:
- constant
- dictionary
- event
- template
- dns
- cybertrace
This type of enrichment is used to add information from CyberTrace data streams to event fields.
Available settings:
- URL (required)—in this field, you can specify the URL of a CyberTrace server to which you want to send requests.
- Number of connections—maximum number of connections to the CyberTrace server that can be simultaneously established by KUMA. By default, this value is equal to the number of vCPUs of the KUMA Core server.
- RPS—maximum number of requests sent to the server per second. The default value is
1,000. - Timeout—amount of time to wait for a response from the CyberTrace server, in seconds. The default value is
30. - Mapping (required)—this settings block contains the mapping table for mapping KUMA event fields to CyberTrace indicator types. The KUMA field column shows the names of KUMA event fields, and the CyberTrace indicator column shows the types of CyberTrace indicators.
Available types of CyberTrace indicators:
- ip
- url
- hash
In the mapping table, you must provide at least one string. You can use the Add row button to add a string, and can use the
button to remove a string.
- timezone
- Use the Debug drop-down list to indicate whether or not to enable logging of service operations. Logging is disabled by default.
- In the Filter section, you can specify conditions to identify events that will be processed using the enrichment rule. You can select an existing filter from the drop-down list or create a new filter.
Creating a filter in resources
- In the Filter drop-down list, select Create new.
- If you want to keep the filter as a separate resource, select the Save filter check box.
In this case, you will be able to use the created filter in various services.
This check box is cleared by default.
- If you selected the Save filter check box, enter a name for the created filter resource in the Name field. The name must contain 1 to 128 Unicode characters.
- In the Conditions settings block, specify the conditions that the events must meet:
- Click the Add condition button.
- In the Left operand and Right operand drop-down lists, specify the search parameters.
Depending on the data source selected in the Right operand field, you may see fields of additional parameters that you need to use to define the value that will be passed to the filter. For example, when choosing active list you will need to specify the name of the active list, the entry key, and the entry key field.
- In the operator drop-down list, select the relevant operator.
- If necessary, select the do not match case check box. When this check box is selected, the operator ignores the case of the values.
The selection of this check box does not apply to the InSubnet, InActiveList, InCategory or InActiveDirectoryGroup operators.
This check box is cleared by default.
- If you want to add a negative condition, select If not from the If drop-down list.
- You can add multiple conditions or a group of conditions.
- If you have added multiple conditions or groups of conditions, choose a search condition (and, or, not) by clicking the AND button.
- If you want to add existing filters that are selected from the Select filter drop-down list, click the Add filter button.
You can view the nested filter settings by clicking the
button.
The new enrichment rule was added to the set of resources for the correlator.
Proceed to the next step of the Installation Wizard.
Page topStep 5. Response
This is an optional step of the Installation Wizard. On the Response tab of the Installation Wizard, you can select or create response rules and indicate which actions must be performed when the correlation rules are triggered. There can be multiple response rules. You can add them by clicking the Add button and can remove them by clicking the button.
To add an existing response rule to a set of resources:
- Click Add.
The response rule settings window opens.
- In the Response rule drop-down list, select the relevant resource.
The response rule is added to the set of resources for the correlator.
To create a new response rule in a set of resources:
- Click Add.
The response rule settings window opens.
- In the Response rule drop-down list, select Create new.
- In the Type drop-down list, select the type of response rule and define its corresponding settings:
- KSC response—response rules for automatically launching the tasks on Kaspersky Security Center assets. For example, you can configure automatic startup of a virus scan or database update.
Tasks are automatically started when KUMA is integrated with Kaspersky Security Center. Tasks are run only on assets that were imported from Kaspersky Security Center.
- Run script—response rules for automatically running a script. For example, you can create a script containing commands to be executed on the KUMA server when selected events are detected.
The script file is stored on the server where the correlator service using the response resource is installed: /opt/kaspersky/kuma/correlator/<Correlator ID>/scripts.
The
kumauser of this server requires the permissions to run the script. - KEDR response—response rules for automatically creating prevention rules, starting network isolation, or starting the application on Kaspersky Endpoint Detection and Response and Kaspersky Security Center assets.
Automatic response actions are carried out when KUMA is integrated with Kaspersky Endpoint Detection and Response.
- Response via KICS for Networks—response rules for automatically starting tasks on KICS for Networks assets. For example, you can change the asset status in KICS for Networks.
Tasks are automatically started when KUMA is integrated with KICS for Networks.
- Response via Active Directory—response rules for changing the permissions of Active Directory users. For example, block a user.
Tasks are started if integration with Active Directory is configured.
- KSC response—response rules for automatically launching the tasks on Kaspersky Security Center assets. For example, you can configure automatic startup of a virus scan or database update.
- In the Workers field, specify the number of processes that the service can run simultaneously.
By default, the number of workers is the same as the number of virtual processors on the server where the service is installed.
This field is optional.
- In the Filter section, you can specify conditions to identify events that will be processed using the response rule. You can select an existing filter from the drop-down list or create a new filter.
Creating a filter in resources
- In the Filter drop-down list, select Create new.
- If you want to keep the filter as a separate resource, select the Save filter check box.
In this case, you will be able to use the created filter in various services.
This check box is cleared by default.
- If you selected the Save filter check box, enter a name for the created filter resource in the Name field. The name must contain 1 to 128 Unicode characters.
- In the Conditions settings block, specify the conditions that the events must meet:
- Click the Add condition button.
- In the Left operand and Right operand drop-down lists, specify the search parameters.
Depending on the data source selected in the Right operand field, you may see fields of additional parameters that you need to use to define the value that will be passed to the filter. For example, when choosing active list you will need to specify the name of the active list, the entry key, and the entry key field.
- In the operator drop-down list, select the relevant operator.
- If necessary, select the do not match case check box. When this check box is selected, the operator ignores the case of the values.
The selection of this check box does not apply to the InSubnet, InActiveList, InCategory or InActiveDirectoryGroup operators.
This check box is cleared by default.
- If you want to add a negative condition, select If not from the If drop-down list.
- You can add multiple conditions or a group of conditions.
- If you have added multiple conditions or groups of conditions, choose a search condition (and, or, not) by clicking the AND button.
- If you want to add existing filters that are selected from the Select filter drop-down list, click the Add filter button.
You can view the nested filter settings by clicking the
button.
The new response rule was added to the set of resources for the correlator.
Proceed to the next step of the Installation Wizard.
Page topStep 6. Routing
This is an optional step of the Installation Wizard. On the Routing tab of the Installation Wizard, you can select or create destinations with settings indicating the forwarding destination of events created by the correlator. Events from a correlator are usually redirected to storage so that they can be saved and later viewed if necessary. Events can be sent to other locations as needed. There can be more than one destination point.
To add an existing destination to a set of resources for a correlator:
- In the Add destination drop-down list, select the type of destination resource you want to add:
- Select Storage if you want to configure forwarding of processed events to the storage.
- Select Correlator if you want to configure forwarding of processed events to a correlator.
- Select Other if you want to send events to other locations.
This type of resource includes correlator and storage services that were created in previous versions of the program.
The Add destination window opens where you can specify parameters for events forwarding.
- In the Destination drop-down list, select the necessary destination.
The window name changes to Edit destination, and it displays the settings of the selected resource. The resource can be opened for editing in a new browser tab using the
button. - Click Save.
The selected destination is displayed on the Installation Wizard tab. A destination resource can be removed from the resource set by selecting it and clicking Delete in the opened window.
To add a new destination to a set of resources for a correlator:
- In the Add destination drop-down list, select the type of destination resource you want to add:
- Select Storage if you want to configure forwarding of processed events to the storage.
- Select Correlator if you want to configure forwarding of processed events to a correlator.
- Select Other if you want to send events to other locations.
This type of resource includes correlator and storage services that were created in previous versions of the program.
The Add destination window opens where you can specify parameters for events forwarding.
- Specify the settings on the Basic settings tab:
- In the Destination drop-down list, select Create new.
- In the Name field, enter a unique name for the destination resource. The name must contain 1 to 128 Unicode characters.
- Use the Disabled toggle button to specify whether events will be sent to this destination. By default, sending events is enabled.
- Select the Type for the destination resource:
- Select storage if you want to configure forwarding of processed events to the storage.
- Select correlator if you want to configure forwarding of processed events to a correlator.
- Select nats-jetstream, tcp, http, kafka, or file if you want to configure sending events to other locations.
- Specify the URL to which events should be sent in the hostname:<API port> format.
You can specify multiple destination addresses using the URL button for all types except nats-jetstream and file.
- For the nats-jetstream and kafka types, use the Topic field to specify which topic the data should be written to. The topic must contain Unicode characters. The Kafka topic is limited to 255 characters.
- If necessary, specify the settings on the Advanced settings tab. The available settings vary based on the selected destination resource type:
- Compression is a drop-down list where you can enable Snappy compression. By default, compression is disabled.
- Proxy is a drop-down list for proxy server selection.
- The Buffer size field is used to set buffer size (in bytes) for the destination. The default value is 1 MB, and the maximum value is 64 MB.
- Timeout field is used to set the timeout (in seconds) for another service or component response. The default value is
30. - Disk buffer size limit field is used to specify the size of the disk buffer in bytes. The default size is 10 GB.
- Cluster ID is the ID of the NATS cluster.
- TLS mode is a drop-down list where you can specify the conditions for using TLS encryption:
- Disabled (default)—do not use TLS encryption.
- Enabled—encryption is enabled, but without verification.
- With verification—use encryption with verification that the certificate was signed with the KUMA root certificate. The root certificate and key of KUMA are created automatically during program installation and are stored on the KUMA Core server in the folder /opt/kaspersky/kuma/core/certificates/.
When using TLS, it is impossible to specify an IP address as a URL.
- URL selection policy is a drop-down list in which you can select a method for determining which URL to send events to if several URLs have been specified:
- Any. Events are sent to one of the available URLs as long as this URL receives events. If the connection is broken (for example, the receiving node is disconnected) a different URL will be selected as the events destination.
- Prefer first. Events are sent to the first URL in the list of added addresses. If it becomes unavailable, events are sent to the next available node in sequence. When the first URL becomes available again, events start to be sent to it again.
- Balanced means that packages with events are evenly distributed among the available URLs from the list. Because packets are sent either on a destination buffer overflow or on the flush timer, this URL selection policy does not guarantee an equal distribution of events to destinations.
- Delimiter is used to specify the character delimiting the events. By default,
\nis used. - Path—the file path if the file destination type is selected.
- Buffer flush interval—this field is used to set the time interval (in seconds) at which the data is sent to the destination. The default value is
100. - Workers—this field is used to set the number of services processing the queue. By default, this value is equal to the number of vCPUs of the KUMA Core server.
- You can set health checks using the Health check path and Health check timeout fields. You can also disable health checks by selecting the Health Check Disabled check box.
- Debug—a toggle switch that lets you specify whether resource logging must be enabled. By default, this toggle switch is in the Disabled position.
- The Disk buffer disabled drop-down list is used to enable or disable the use of a disk buffer. By default, the disk buffer is disabled.
- In the Filter section, you can specify the conditions to define events that will be processed by this resource. You can select an existing filter from the drop-down list or create a new filter.
Creating a filter in resources
- In the Filter drop-down list, select Create new.
- If you want to keep the filter as a separate resource, select the Save filter check box.
In this case, you will be able to use the created filter in various services.
This check box is cleared by default.
- If you selected the Save filter check box, enter a name for the created filter resource in the Name field. The name must contain 1 to 128 Unicode characters.
- In the Conditions settings block, specify the conditions that the events must meet:
- Click the Add condition button.
- In the Left operand and Right operand drop-down lists, specify the search parameters.
Depending on the data source selected in the Right operand field, you may see fields of additional parameters that you need to use to define the value that will be passed to the filter. For example, when choosing active list you will need to specify the name of the active list, the entry key, and the entry key field.
- In the operator drop-down list, select the relevant operator.
- If necessary, select the do not match case check box. When this check box is selected, the operator ignores the case of the values.
The selection of this check box does not apply to the InSubnet, InActiveList, InCategory or InActiveDirectoryGroup operators.
This check box is cleared by default.
- If you want to add a negative condition, select If not from the If drop-down list.
- You can add multiple conditions or a group of conditions.
- If you have added multiple conditions or groups of conditions, choose a search condition (and, or, not) by clicking the AND button.
- If you want to add existing filters that are selected from the Select filter drop-down list, click the Add filter button.
You can view the nested filter settings by clicking the
button.
- Click Save.
The created destination is displayed on the Installation Wizard tab. A destination resource can be removed from the resource set by selecting it and clicking Delete in the opened window.
Proceed to the next step of the Installation Wizard.
Page topStep 7. Setup validation
This is the required, final step of the Installation Wizard. At this step, KUMA creates a service resource set, and the Services are created automatically based on this set:
- The set of resources for the correlator is displayed under Resources → Correlators. It can be used to create new correlator services. When this set of resources changes, all services that operate based on this set of resources will start using the new parameters after the services restart. To do so, you can use the Save and restart services and Save and update service configurations buttons.
A set of resources can be modified, copied, moved from one folder to another, deleted, imported, and exported, like other resources.
- Services are displayed in Resources → Active services. The services created using the Installation Wizard perform functions inside the KUMA program. To communicate with external parts of the network infrastructure, you need to install similar external services on the servers and assets intended for them. For example, an external correlator service should be installed on a server intended to process events, external storage services should be installed on servers with a deployed ClickHouse service, and external agent services should be installed on Windows assets that must both receive and forward Windows events.
To finish the Installation Wizard:
- Click Create and save service.
The Setup validation tab of the Installation Wizard displays a table of services created based on the set of resources selected in the Installation Wizard. The lower part of the window shows examples of commands that you must use to install external equivalents of these services on their intended servers and assets.
For example:
/opt/kaspersky/kuma/kuma correlator --core https://kuma-example:<port used for communication with the KUMA Core> --id <service ID> --api.port <port used for communication with the service> --install
The "kuma" file can be found inside the installer in the /kuma-ansible-installer/roles/kuma/files/ directory.
The port for communication with the KUMA Core, the service ID, and the port for communication with the service are added to the command automatically. You should also ensure the network connectivity of the KUMA system and open the ports used by its components if necessary.
- Close the Wizard by clicking Save.
The correlator service is created in KUMA. Now the equivalent service must be installed on the server intended for processing events.
Page topInstalling a correlator in a KUMA network infrastructure
A correlator consists of two parts: one part is created inside the KUMA console, and the other part is installed on the network infrastructure server intended for processing events. The second part of the correlator is installed in the network infrastructure.
To install a correlator:
- Log in to the server where you want to install the service.
- Create the /opt/kaspersky/kuma/ folder.
- Copy the "kuma" file to the /opt/kaspersky/kuma/ folder. The file is located in the installer in the /kuma-ansible-installer/roles/kuma/files/ folder.
Make sure the kuma file has sufficient rights to run.
- Execute the following command:
sudo /opt/kaspersky/kuma/kuma correlator --core https://<KUMA Core server FQDN>:<port used by KUMA Core server for internal communication (port 7210 by default)> --id <service ID copied from the KUMA console> --api.port <port used for communication with the installed component> --installExample:
sudo /opt/kaspersky/kuma/kuma correlator --core https://kuma.example.com:7210 --id XXXX --api.port YYYY --installYou can copy the correlator installation command at the last step of the Installation Wizard. It automatically specifies the address and port of the KUMA Core server, the identifier of the correlator to be installed, and the port that the correlator uses for communication. Before installation, ensure the network connectivity of KUMA components.
When deploying several KUMA services on the same host, during the installation process you must specify unique ports for each component using the
--api.port <port>parameter. The following setting values are used by default:--api.port 7221.
The correlator is installed. You can use it to analyze events for threats.
Page topValidating correlator installation
To verify that the correlator is ready to receive events:
- In the KUMA console, go to the Resources → Active services section.
- Make sure that the correlator you installed has the green status.
If the events that are fed into the correlator contain events that meet the correlation rule filter conditions, the events tab will show events with the DeviceVendor=Kaspersky and DeviceProduct=KUMA parameters. The name of the triggered correlation rule will be displayed as the name of these correlation events.
If no correlation events are found
You can create a simpler version of your correlation rule to find possible errors. Use a simple correlation rule and a single Output action. It is recommended to create a filter to find events that are regularly received by KUMA.
When updating, adding, or removing a correlation rule, you must update configuration of the correlator.
When you finish testing your correlation rules, you must remove all testing and temporary correlation rules from KUMA and update configuration of the correlator.
Page topCreating a collector
A collector consists of two parts: one part is created inside the KUMA console, and the other part is installed on a server in the network infrastructure intended for receiving events.
Actions in the KUMA console
A collector is created in the KUMA console by using the Installation Wizard. This Wizard combines the necessary resources into a set of resources for the collector. Upon completion of the Wizard, the service itself is automatically created based on this set of resources.
To create a collector in the KUMA console,
Start the Collector Installation Wizard:
- In the KUMA console, in the Resources section, click Add event source.
- In the KUMA console, in the Resources → Collectors section, click Add collector.
As a result of completing the steps of the Wizard, a collector service is created in the KUMA console.
A resource set for a collector includes the following resources:
- Connector
- Normalizer (at least one)
- Filters (if required)
- Aggregation rules (if required)
- Enrichment rules (if required)
- Destinations (normally two are defined for sending events to the correlator and storage)
These resources can be prepared in advance, or you can create them while the Installation Wizard is running.
Actions on the KUMA Collector Server
When installing the collector on the server that you intend to use for receiving events, run the command displayed at the last step of the Installation Wizard. When installing, you must specify the ID automatically assigned to the service in the KUMA console, as well as the port used for communication.
Testing the installation
After creating a collector, you are advised to make sure that it is working correctly.
Starting the Collector Installation Wizard
A collector consists of two parts: one part is created inside the KUMA web interface, and the other part is installed on the network infrastructure server intended for receiving events. The Installation Wizard creates the first part of the collector.
To start the Collector Installation Wizard:
- In the KUMA console, in the Resources section, click Add event source.
- In the KUMA console, in the Resources → Collectors section, click Add collector.
Follow the instructions of the Wizard.
Aside from the first and last steps of the Wizard, the steps of the Wizard can be performed in any order. You can switch between steps by using the Next and Previous buttons, as well as by clicking the names of the steps in the left side of the window.
After the Wizard completes, a resource set for a collector is created in the KUMA console under Resources → Collectors, and a collector service is added under Resources → Active services.
Step 1. Connect event sources
This is a required step of the Installation Wizard. At this step, you specify the main settings of the collector: its name and the tenant that will own it.
To specify the basic settings of the collector:
- In the Collector name field, enter a unique name for the service you are creating. The name must contain 1 to 128 Unicode characters.
When certain types of collectors are created, agents named "agent: <Collector name>, auto created" are also automatically created together with the collectors. If this type of agent was previously created and has not been deleted, it will be impossible to create a collector named <Collector name>. If this is the case, you will have to either specify a different name for the collector or delete the previously created agent.
- In the Tenant drop-down list, select the tenant that will own the collector. The tenant selection determines what resources will be available when the collector is created.
If you return to this window from another subsequent step of the Installation Wizard and select another tenant, you will have to manually edit all the resources that you have added to the service. Only resources from the selected tenant and shared tenant can be added to the service.
- If required, specify the number of processes that the service can run concurrently in the Workers field. By default, the number of worker processes is the same as the number of vCPUs on the server where the service is installed.
- If necessary, use the Debug drop-down list to enable logging of service operations.
Error messages of the collector service are logged even when debug mode is disabled. The log can be viewed on the machine where the collector is installed, in the /opt/kaspersky/kuma/collector/<collector ID>/log/collector directory.
- You can optionally add up to 256 Unicode characters describing the service in the Description field.
The main settings of the collector are specified. Proceed to the next step of the Installation Wizard.
Page topStep 2. Transportation
This is a required step of the Installation Wizard. On the Transport tab of the Installation Wizard, select or create a connector and in its settings, specify the source of events for the collector service.
To add an existing connector to a resource set,
select the name of the required connector from the Connector drop-down list.
The Transport tab of the Installation Wizard displays the settings of the selected connector. You can open the selected connector for editing in a new browser tab using the button.
To create a new connector:
- Select Create new from the Connector drop-down list.
- In the Type drop-down list, select the connector type and specify its settings on the Basic settings and Advanced settings tabs. The available settings depend on the selected type of connector:
When using the tcp or udp connector type at the normalization stage, IP addresses of the assets from which the events were received will be written in the DeviceAddress event field if it is empty.
When using a wmi or wec connector, agents will be automatically created for receiving Windows events.
It is recommended to use the default encoding (UTF-8), and to apply other settings only if bit characters are received in the fields of events.
Making KUMA collectors to listen on ports up to 1,000 requires running the service of the relevant collector with root privileges. To do this, after installing the collector, add the line
AmbientCapabilities = CAP_NET_BIND_SERVICEto its systemd configuration file in the [Service] section.
The systemd file is located in the /usr/lib/systemd/system/kuma-collector-<collector ID>.service directory.
The connector is added to the resource set of the collector. The created connector is only available in this resource set and is not displayed in the web interface Resources → Connectors section.
Proceed to the next step of the Installation Wizard.
Page topStep 3. Event parsing
This is a required step of the Installation Wizard. On the Event parsing tab of the Installation Wizard, select or create a normalizer whose settings will define the rules for converting raw events into normalized events. You can add multiple event parsing rules to the normalizer to implement complex event processing logic. You can test the normalizer using test events.
When creating a new normalizer in the Installation Wizard, by default it is saved in the set of resources for the collector and cannot be used in other collectors. The Save normalizer check box lets you create the normalizer as a separate resource, in which case the normalizer can be selected in other collectors of the tenant.
If, when changing the settings of a collector resource set, you change or delete conversions in a normalizer connected to it, the edits will not be saved, and the normalizer itself may be corrupted. If you need to modify conversions in a normalizer that is already part of a service, the changes must be made directly to the normalizer under Resources → Normalizers in the web interface.
Adding a normalizer
To add an existing normalizer to a resource set:
- Click the Add event parsing button.
This opens the Basic event parsing window with the normalizer settings and the Normalization scheme tab active.
- In the Normalizer drop-down list, select the required normalizer. The drop-down list includes normalizers belonging to the tenant of the collector and the Shared tenant.
The Basic event parsing window displays the settings of the selected normalizer.
If you want to edit the normalizer settings, in the Normalizer drop-down list, click the pencil icon next to the name of the relevant normalizer. This opens the Edit normalizer window with a dark circle. Clicking the dark circle opens the Basic event parsing window where you can edit the normalizer settings.
If you want to edit advanced parsing settings, move the cursor over the dark circle to make a plus icon appear; click the plus icon to open the Advanced event parsing window. For details about configuring advanced event parsing, see below.
- Click OK.
The normalizer is displayed as a dark circle on the Basic event parsing tab of the Installation Wizard. Clicking on the circle will open the normalizer options for viewing.
To create a new normalizer in the collector:
- At the Event parsing step, on the Parsing schemes tab, click the Add event parsing.
This opens the Basic event parsing window with the normalizer settings and the Normalization scheme tab active.
- If you want to save the normalizer as a separate resource, select the Save normalizer check box; this makes the saved normalizer available for use in other collectors of the tenant. This check box is cleared by default.
- In the Name field, enter a unique name for the normalizer. The name must contain 1 to 128 Unicode characters.
- In the Parsing method drop-down list, select the type of events to receive. Depending on your choice, you can use the preconfigured rules for matching event fields or set your own rules. When you select some of the parsing methods, additional settings fields may need to be filled.
Available parsing methods:
- json
- cef
- regexp
This parsing method is used to create custom rules for processing data in a format using regular expressions.
In the Normalization parameter block field, add a regular expression (RE2 syntax) with named capture groups. The name of a group and its value will be interpreted as the field and the value of the raw event, which can be converted into an event field in KUMA format.
To add event handling rules:
- Copy an example of the data you want to process to the Event examples field. This is an optional but recommended step.
- In the Normalization parameter block field add a regular expression with named capture groups in RE2 syntax, for example "(?P<name>regexp)". The regular expression added to the Normalization parameter must exactly match the event. Also, when developing the regular expression, it is recommended to use special characters that match the starting and ending positions of the text: ^, $.
You can add multiple regular expressions by using the Add regular expression button. If you need to remove the regular expression, use the
button. - Click the Copy field names to the mapping table button.
Capture group names are displayed in the KUMA field column of the Mapping table. Now you can select the corresponding KUMA field in the column next to each capture group. Otherwise, if you named the capture groups in accordance with the CEF format, you can use the automatic CEF mapping by selecting the Use CEF syntax for normalization check box.
Event handling rules were added.
- syslog
- csv
- kv
- xml
This parsing method is used to process XML data in which each object, including its nested objects, occupies a single line in a file. Files are processed line by line.
If you want to send the raw event for advanced normalization, at each nesting level in the Advanced event parsing window, select Yes in the Keep raw event drop-down list.
When this method is selected in the parameter block XML attributes you can specify the key attributes to be extracted from tags. If an XML structure has several attributes with different values in the same tag, you can indicate the necessary value by specifying its key in the Source column of the Mapping table.
To add key XML attributes,
Click the Add field button, and in the window that appears, specify the path to the required attribute.
You can add more than one attribute. Attributes can be removed one at a time using the cross icon or all at once using the Reset button.
If XML key attributes are not specified, then in the course of field mapping the unique path to the XML value will be represented by a sequence of tags.
Tag numbering
Tag numbering is available as of KUMA 2.1.3. This functionality allows automatically numbering tags in XML events, which lets you parse an event with identical tags or unnamed tags, such as <Data>.
As an example, we will use the Tag numbering functionality to number the tags of the EventData attribute of Microsoft Windows PowerShell event ID 800.
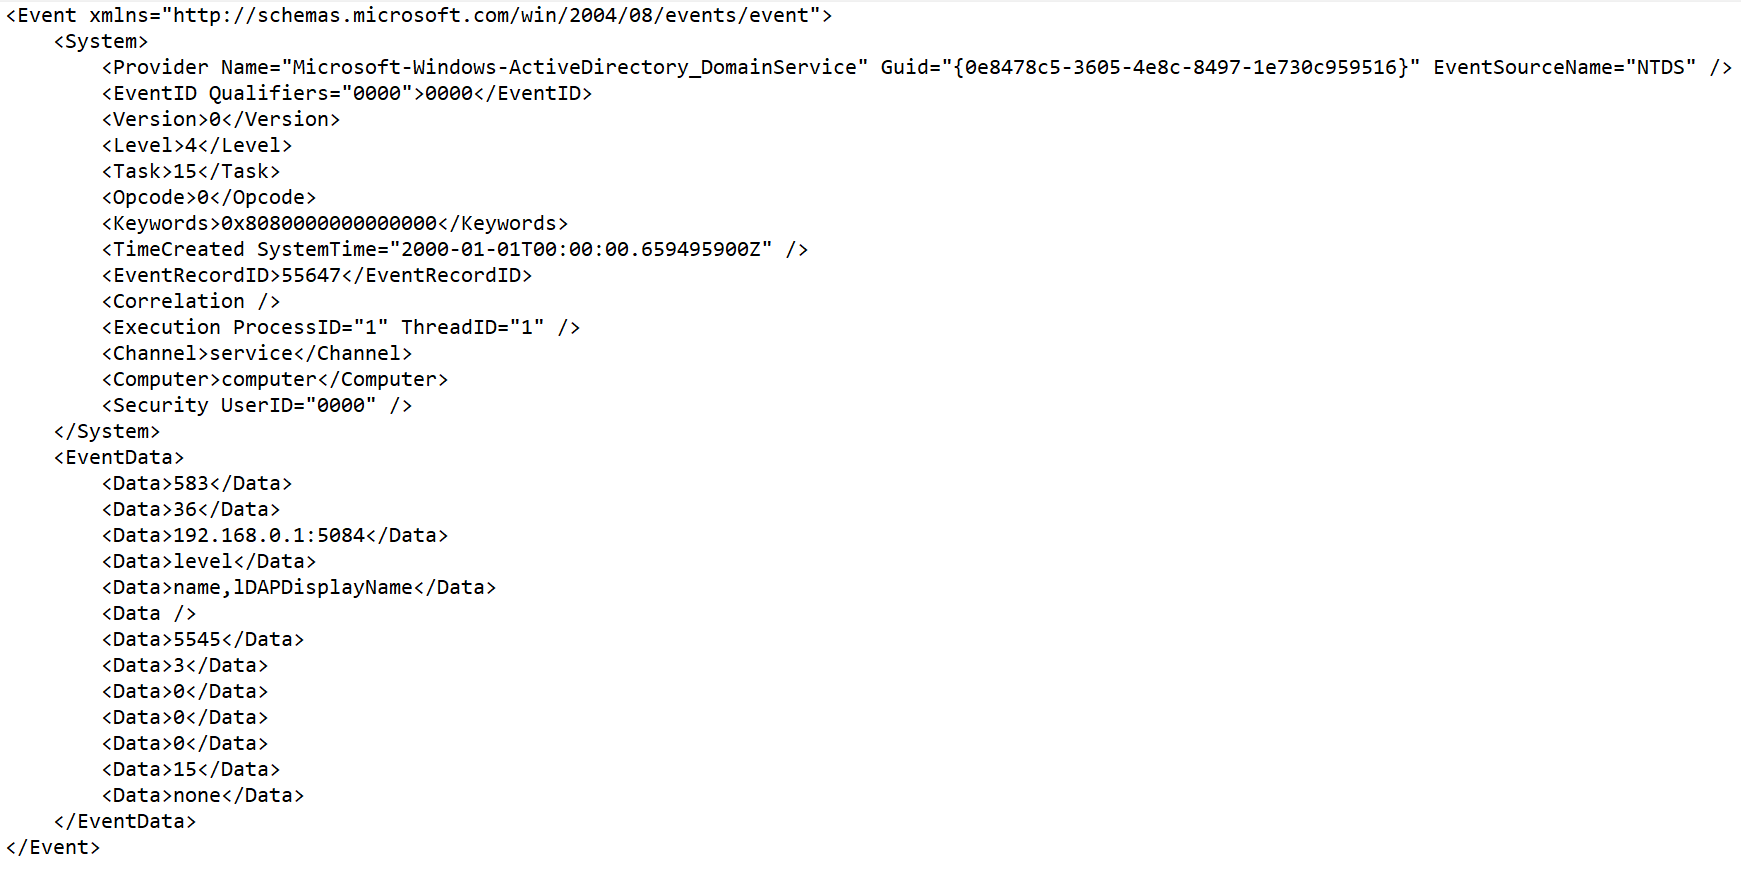
To parse such events, you must:
- Configure tag numbering.
- Configure data mapping for numbered tags with KUMA event fields.
KUMA 3.0.x supports using XML attributes and Tag numbering functionality at the same time in the same extra normalizer. If an attribute contains unnamed tags or identical tags, we recommend using the Tag numbering functionality. If the attribute contains only named tags, use XML attributes. To use this functionality in extra normalizers, you must sequentially enable the "Keep raw event" setting in each extra normalizer along the path that the event follows to the target extra normalizer, and in the target extra normalizer itself.
For an example of this functionality in action, you can refer to the MicrosoftProducts normalizer — the "Keep raw event" setting is enabled sequentially in the "AD FS" and "424" extra normalizers.
To configure parsing of events with identically named or unnamed tags:
- Create a new normalizer or open an existing normalizer for editing.
- In the Basic event parsing window of the normalizer, in the Parsing method drop-down list, select 'xml' and in the Tag numbering field, click Add field.
In the displayed field, enter the full path to the tag to whose elements you want to assign a number. For example, Event.EventData.Data. The first number to be assigned to a tag is 0. If the tag is empty, for example, <Data />, it is also assigned a number.
- To configure data mapping, under Mapping, click Add row and do the following:
- In the new row, in the Source field, enter the full path to the tag and its index. For the Microsoft Windows event from the example above, the full path with indices look like this:
- Event.EventData.Data.0
- Event.EventData.Data.1
- Event.EventData.Data.2 and so on
- In the KUMA field drop-down list, select the field in the KUMA event that will receive the value from the numbered tag after parsing.
- In the new row, in the Source field, enter the full path to the tag and its index. For the Microsoft Windows event from the example above, the full path with indices look like this:
- To save changes:
- If you created a new normalizer, click Save.
- If you edited an existing normalizer, click Update configuration in the collector to which the normalizer is linked.
Parsing is configured.
- netflow5
- netflow9
- sflow5
- ipfix
- sql—this method becomes available only when using a sql type connector.
- In the Keep raw event drop-down list, specify whether to store the original raw event in the newly created normalized event. Available values:
- Don't save—do not save the raw event. This is the default setting.
- Only errors—save the raw event in the
Rawfield of the normalized event if errors occurred when parsing it. This value is convenient to use when debugging a service. In this case, every time an event has a non-emptyRawfield, you know there was a problem. - Always—always save the raw event in the
Rawfield of the normalized event.
- In the Keep extra fields drop-down list, choose whether you want to store the raw event fields in the normalized event if no mapping rules have been configured for them (see below). The data is stored in the Extra event field. By default, fields are not saved.
- Copy an example of the data you want to process to the Event examples field. This is an optional but recommended step.
- In the Mapping table, configure the mapping of raw event fields to event fields in the KUMA format:
- In the Source column, provide the name of the raw event field that you want to convert into the KUMA event field.
For details about the field format, refer to the Normalized event data model article. For a description of the mapping, refer to the Mapping fields of predefined normalizers article.
Clicking the
 button next to the field names in the Source column opens the Conversion window, in which you can use the Add conversion button to create rules for modifying the original data before they are written to the KUMA event fields.
In the Conversion window, you can swap the added rules by dragging them by the
 icon; you can also delete them using the
  icon.
icon. - In the KUMA field column, select the required KUMA event field from the drop-down list. You can search for fields by entering their names in the field.
- If the name of the KUMA event field selected at the previous step begins with
DeviceCustom*orFlex*, you can add a unique custom label in the Label field.
New table rows can be added by using the Add row button. Rows can be deleted individually using the
button or all at once using the Clear all button.If you want KUMA to enrich events with asset information, and the asset information to be available in the alert card when a correlation rule is triggered, in the Mapping table, configure a mapping of host address and host name fields depending on the purpose of the asset. For example, the mapping can apply to SourceAddress and SourceHostName, or DestinationAddress and DestinationHostName fields. As a result of enrichment, the event card includes a SourceAssetID or DestinationAssetID field, and a link to the asset card. Also, as a result of enrichment, asset information is available in the alert card.
If you have loaded data into the Event examples field, the table will have an Examples column containing examples of values carried over from the raw event field to the KUMA event field.
- In the Source column, provide the name of the raw event field that you want to convert into the KUMA event field.
- Click OK.
The normalizer is displayed as a dark circle on the Event parsing tab of the Installation Wizard. If you want to open the normalizer settings for viewing, click the dark circle. When you hover the mouse over the circle, a plus sign is displayed. Click it to add event parsing rules (see below).
Enriching normalized events with additional data
You can add additional data to newly created normalized events by creating enrichment rules in the normalizer. These enrichment rules are stored in the normalizer where they were created. There can be more than one enrichment rule.
To add enrichment rules to the normalizer:
- Select the main or additional normalization rule to open a window, and in that window, click the Enrichment tab.
- Click the Add enrichment button.
The enrichment rule parameter block appears. You can delete the group of settings using the
button. - Select the enrichment type from the Source kind drop-down list. Depending on the selected type, you may see advanced settings that will also need to be completed.
Available Enrichment rule source types:
- constant
- dictionary
- table
This type of enrichment is used if you need to add a value from the dictionary of the Table type.
When this enrichment type is selected in the Dictionary name drop-down list, select the dictionary for providing the values. In the Key fields group of settings, use the Add field button to select the event fields whose values are used for dictionary entry selection.
In the Mapping table, configure the dictionary fields to provide data and the event fields to receive data:
- In the Dictionary field column, select the dictionary field. The available fields depend on the selected dictionary resource.
- In the KUMA field column, select the event field to which the value is written. For some of the selected fields (
*custom*and*flex*), in the Label column, you can specify a name for the data written to them.
New table rows can be added by using the Add new element button. Columns can be deleted using the
button. - event
This type of enrichment is used when you need to write a value from another event field to the current event field. Settings of this type of enrichment:
- In the Target field drop-down list, select the KUMA event field to which you want to write the data.
- In the Source field drop-down list, select the event field whose value will be written to the target field.
- Clicking the button opens the Conversion window in which you can, using the Add conversion button, create rules for modifying the original data before writing them to the KUMA event fields.
When using enrichment of events that have the "Event" selected as the "Source kind" setting and the fields of the extended event schema are used as arguments, the following special considerations apply:
- If the source field is an "Array of strings" field and the target field is a "String" field, the values are written to the target field in the TSV format.
Example: The SA.StringArray extended event schema field contains values: "string1", "string2", "string3". An event enrichment operation is performed. The result of the operation is written to the DeviceCustomString1 event schema field. As a result of the operation, the DeviceCustomString1 field contains ["string1", "string2", "string3"].
- If the source field is an "Array of strings" field and the target field is an "Array of strings" field, the values of the source field are appended to the values of the target field and are placed in the target field, with commas (",") used as the separator character.
Example: The SA.StringArrayOne extended event schema field contains values: "string1", "string2", "string3". An event enrichment operation is performed. The result of the operation is written to the SA.StringArrayTwo event schema field. As a result of the operation, the SA.StringArrayTwo field contains "string1", "string2", "string3".
- template
- In the Target field drop-down list, select the KUMA event field to which you want to write the data.
This setting is not available for the enrichment source of the Table type.
- If you want to enable details in the normalizer log, set the Debug toggle switch to enabled. Details are disabled by default.
- Click OK.
Event enrichment rules with the additional data are added to the normalizer, to the selected parsing rule.
Configuring parsing linked to IP addresses
You can direct events from multiple IP addresses, from sources of different types, to the same collector, and the collector will apply the corresponding configured normalizers.
You can use this method for collectors with a connector of the UDP, TCP, or HTTP type. If a UDP, TCP, or HTTP connector is specified in the collector at the Transport step, then at the Event parsing step, you can specify multiple IP addresses on the Parsing settings tab and choose the normalizer that you want to use for events coming from the specified addresses. The following types of normalizers are available: json, cef, regexp, syslog, csv, kv, xml.
In a collector with configured normalizers linked to IP addresses, if you change the connector type to any type other than UDP, TCP, HTTP, the Parsing settings tab disappears and only the first of the previously specified normalizers is specified at the Parsing step. The tab disappears from the web interface immediately, but the changes are applied after the resource is saved. If you want to restore the previous settings, exit the collector installation wizard without saving.
For normalizers of the Syslog and regexp types, you can use a normalizer chain by specifying extra normalization conditions depending on the value of the DeviceProcessName field. The difference from extra normalization is that you can specify shared normalizers.
To configure parsing with linking to IP addresses:
- At the Event parsing step, go to the Parsing settings tab.
- In the IP address(-es) field, specify one or more IP addresses from which events will be received. You can specify multiple IP addresses separated by commas. Available format: IPv4. The length of the address list is unlimited; however, we recommend specifying a reasonable number of addresses to keep the load on the collector balanced. This field is mandatory if you want to apply multiple normalizers in one collector.
Limitation: for each IP+normalizer combination, the IP address must be unique. KUMA checks the uniqueness of addresses, and if you specify the same IP address for different normalizers, the "The field must be unique" message is displayed.
If you want to send all events to the same normalizer without specifying IP addresses, we recommend creating a separate collector. We also recommend creating a separate collector with one normalizer if you want to apply the same normalizer to events from a large number of IP addresses; this helps improve the performance.
- In the Normalizer field, create a normalizer or select an existing normalizer from the drop-down list. The arrow next to the drop-down list takes you to the Parsing schemes tab.
Normalization is triggered if you have a connector type configured: UDP, TCP, HTTP; the event source header must be specified in the HTTP case.
Taking into account the available connectors, the following normalizer types are available for automatic source recognition: json, cef, regexp, syslog, csv, kv, xml.
- If you selected the Syslog or regexp normalizer type, you can Additional condition. Conditional normalization is available if Field mapping for DeviceProcessName is configured in the main normalizer. Under Condition, specify the process name in the DeviceProcessName field and create a normalizer or select an existing normalizer from the drop-down list. You can specify multiple combinations of DeviceProcessName + normalizer, normalization is performed until the first match is achieved.
Parsing with linking to IP addresses is configured.
Creating a structure of event normalization rules
To implement a complex event processing logic, you can add multiple event parsing rules to the normalizer. Events are transmitted between the parsing rules depending on the specified conditions. The sequence of creating parsing rules is important. The event is processed sequentially, and its path is shown using arrows.
To create an additional parsing rule:
- Create a normalizer (see above).
The created normalizer is displayed in the window as a dark circle.
- Hover the mouse over the circle and click the plus sign button that appears.
- In the Additional event parsing window that opens, specify the parameters of the additional event parsing rule:
- Extra normalization conditions tab:
If you want to send a raw event for extra normalization, select Yes in the Keep raw event drop-down list. The default value is No. We recommend passing a raw event to normalizers of json and xml types. If you want to send a raw event for extra normalization to the second, third, etc nesting levels, at each nesting level, select Yes in the Keep raw event drop-down list.
To send only the events with a specific field to the additional normalizer, specify this field in the Field to pass into normalizer field.
On this tab, you can also define other conditions. When these conditions are met, the event is sent for additional parsing.
- Normalization scheme tab:
On this tab, you can configure event processing rules, similar to the main normalizer settings (see above). The Keep raw event setting is not available. The Event examples field displays the values specified when the initial normalizer was created.
- Enrichment tab:
On this tab, you can configure event enrichment rules (see above).
- Extra normalization conditions tab:
- Click OK.
The additional parsing rule is added to the normalizer. It is displayed as a dark block with the conditions under which this rule is triggered. You can change the settings of the additional parsing rule by clicking it. If you hover the mouse over the additional parsing rule, a plus button appears. You can use this button to create a new additional parsing rule. To delete a normalizer, use the button with the trash icon.
The upper right corner of the window contains a search window where you can search parsing rules by name.
Proceed to the next step of the Installation Wizard.
Page topStep 4. Filtering events
This is an optional step of the Installation Wizard. The Event filtering tab of the Installation Wizard allows you to select or create a filter whose settings specify the conditions for selecting events. You can add multiple filters to the collector. You can swap the filters by dragging them by the icon as well as delete them. Filters are combined by the AND operator.
To add an existing filter to a collector resource set,
Click the Add filter button and select the required filter from the Filter drop-down menu.
To add a new filter to the collector resource set:
- Click the Add filter button and select Create new from the Filter drop-down menu.
- If you want to keep the filter as a separate resource, select the Save filter check box. This can be useful if you decide to reuse the same filter across different services. This check box is cleared by default.
- If you selected the Save filter check box, enter a name for the created filter in the Name field. The name must contain 1 to 128 Unicode characters.
- In the Conditions section, specify the conditions that must be met by the filtered events:
- The Add condition button is used to add filtering conditions. You can select two values (two operands, left and right) and assign the operation you want to perform with the selected values. The result of the operation is either True or False.
- In the operator drop-down list, select the function to be performed by the filter.
In this drop-down list, you can select the do not match case check box if the operator should ignore the case of values. This check box is ignored if the InSubnet, InActiveList, InCategory, and InActiveDirectoryGroup operators are selected. This check box is cleared by default.
- In the Left operand and Right operand drop-down lists, select where the data to be filtered will come from. As a result of the selection, Advanced settings will appear. Use them to determine the exact value that will be passed to the filter. For example, when choosing active list you will need to specify the name of the active list, the entry key, and the entry key field.
- You can use the If drop-down list to choose whether you need to create a negative filter condition.
Conditions can be deleted using the
button. - In the operator drop-down list, select the function to be performed by the filter.
- The Add group button is used to add groups of conditions. Operator AND can be switched between AND, OR, and NOT values.
A condition group can be deleted using the
button. - By clicking Add filter, you can add existing filters selected in the Select filter drop-down list to the conditions. You can click to navigate to a nested filter.
A nested filter can be deleted using the
button.
- The Add condition button is used to add filtering conditions. You can select two values (two operands, left and right) and assign the operation you want to perform with the selected values. The result of the operation is either True or False.
The filter has been added.
Proceed to the next step of the Installation Wizard.
Page topStep 5. Event aggregation
This is an optional step of the Installation Wizard. The Event aggregation tab of the Installation Wizard allows you to select or create an aggregation rule whose settings specify the conditions for aggregating events of the same type. You can add multiple aggregation rules to the collector.
To add an existing aggregation rule to a set of collector resources,
click Add aggregation rule and select Aggregation rule in the drop-down list.
To add a new aggregation rule to a set of collector resources:
- Click the Add aggregation rule button and select Create new from the Aggregation rule drop-down menu.
- Enter the name of the newly created aggregation rule in the Name field. The name must contain 1 to 128 Unicode characters.
- In the Threshold field, specify how many events must be accumulated before the aggregation rule triggers and the events are aggregated. The default value is
100. - In the Triggered rule lifetime field, specify how long (in seconds) the collector must accumulate events to be aggregated. When this time expires, the aggregation rule is triggered and a new aggregation event is created. The default value is
60. - In the Identical fields section, use the Add field button to select the fields that will be used to identify the same types of events. Selected events can be deleted using the buttons with a cross icon.
- In the Unique fields section, you can click Add field to select the fields that will disqualify events from aggregation even if the events contain fields listed in the Identical fields section. Selected events can be deleted using the buttons with a cross icon.
- In the Sum fields section, you can use the Add field button to select the fields whose values will be summed during the aggregation process. Selected events can be deleted using the buttons with a cross icon.
- In the Filter section, you can specify the conditions to define events that will be processed by this resource. You can select an existing filter from the drop-down list or create a new filter.
Creating a filter in resources
- In the Filter drop-down list, select Create new.
- If you want to keep the filter as a separate resource, select the Save filter check box.
In this case, you will be able to use the created filter in various services.
This check box is cleared by default.
- If you selected the Save filter check box, enter a name for the created filter resource in the Name field. The name must contain 1 to 128 Unicode characters.
- In the Conditions settings block, specify the conditions that the events must meet:
- Click the Add condition button.
- In the Left operand and Right operand drop-down lists, specify the search parameters.
Depending on the data source selected in the Right operand field, you may see fields of additional parameters that you need to use to define the value that will be passed to the filter. For example, when choosing active list you will need to specify the name of the active list, the entry key, and the entry key field.
- In the operator drop-down list, select the relevant operator.
- If necessary, select the do not match case check box. When this check box is selected, the operator ignores the case of the values.
The selection of this check box does not apply to the InSubnet, InActiveList, InCategory or InActiveDirectoryGroup operators.
This check box is cleared by default.
- If you want to add a negative condition, select If not from the If drop-down list.
- You can add multiple conditions or a group of conditions.
- If you have added multiple conditions or groups of conditions, choose a search condition (and, or, not) by clicking the AND button.
- If you want to add existing filters that are selected from the Select filter drop-down list, click the Add filter button.
You can view the nested filter settings by clicking the
button.
Aggregation rule added. You can delete it using the button.
Proceed to the next step of the Installation Wizard.
Page topStep 6. Event enrichment
This is an optional step of the Installation Wizard. On the Event enrichment tab of the Installation Wizard, you can specify which data from which sources should be added to events processed by the collector. Events can be enriched with data obtained using enrichment rules or LDAP.
Rule-based enrichment
There can be more than one enrichment rule. You can add them by clicking the Add enrichment button and can remove them by clicking the button. You can use existing enrichment rules or create rules directly in the Installation Wizard.
To add an existing enrichment rule to a set of resources:
- Click Add enrichment.
This opens the enrichment rules settings block.
- In the Enrichment rule drop-down list, select the relevant resource.
The enrichment rule is added to the set of resources for the collector.
To create a new enrichment rule in a set of resources:
- Click Add enrichment.
This opens the enrichment rules settings block.
- In the Enrichment rule drop-down list, select Create new.
- In the Source kind drop-down list, select the source of data for enrichment and define its corresponding settings:
- constant
- dictionary
- event
- template
- dns
- cybertrace
This type of enrichment is used to add information from CyberTrace data streams to event fields.
Available settings:
- URL (required)—in this field, you can specify the URL of a CyberTrace server to which you want to send requests.
- Number of connections—maximum number of connections to the CyberTrace server that can be simultaneously established by KUMA. By default, this value is equal to the number of vCPUs of the KUMA Core server.
- RPS—maximum number of requests sent to the server per second. The default value is
1,000. - Timeout—amount of time to wait for a response from the CyberTrace server, in seconds. The default value is
30. - Mapping (required)—this settings block contains the mapping table for mapping KUMA event fields to CyberTrace indicator types. The KUMA field column shows the names of KUMA event fields, and the CyberTrace indicator column shows the types of CyberTrace indicators.
Available types of CyberTrace indicators:
- ip
- url
- hash
In the mapping table, you must provide at least one string. You can use the Add row button to add a string, and can use the
button to remove a string.
- timezone
- geographic data
This type of enrichment is used to add IP address geographic data to event fields. Learn more about linking IP addresses to geographic data.
When this type is selected, in the Mapping geographic data to event fields settings block, you must specify from which event field the IP address will be read, select the required attributes of geographic data, and define the event fields in which geographic data will be written:
- In the Event field with IP address drop-down list, select the event field from which the IP address is read. Geographic data uploaded to KUMA is matched against this IP address.
You can use the Add event field with IP address button to specify multiple event fields with IP addresses that require geographic data enrichment. You can delete event fields added in this way by clicking the Delete event field with IP address button.
When the
SourceAddress,DestinationAddress, andDeviceAddressevent fields are selected, the Apply default mapping button becomes available. You can use this button to add preconfigured mapping pairs of geographic data attributes and event fields. - For each event field you need to read the IP address from, select the type of geographic data and the event field to which the geographic data should be written.
You can use the Add geodata attribute button to add field pairs for Geodata attribute – Event field to write to. You can also configure different types of geographic data for one IP address to be written to different event fields. To delete a field pair, click
 .
.- In the Geodata attribute field, select which geographic data corresponding to the read IP address should be written to the event. Available geographic data attributes: Country, Region, City, Longitude, Latitude.
- In the Event field to write to, select the event field which the selected geographic data attribute must be written to.
You can write identical geographic data attributes to different event fields. If you configure multiple geographic data attributes to be written to the same event field, the event will be enriched with the last mapping in the sequence.
- In the Event field with IP address drop-down list, select the event field from which the IP address is read. Geographic data uploaded to KUMA is matched against this IP address.
- Use the Debug drop-down list to indicate whether or not to enable logging of service operations. Logging is disabled by default.
- In the Filter section, you can specify conditions to identify events that will be processed by the enrichment rule resource. You can select an existing filter from the drop-down list or create a new filter.
Creating a filter in resources
- In the Filter drop-down list, select Create new.
- If you want to keep the filter as a separate resource, select the Save filter check box.
In this case, you will be able to use the created filter in various services.
This check box is cleared by default.
- If you selected the Save filter check box, enter a name for the created filter resource in the Name field. The name must contain 1 to 128 Unicode characters.
- In the Conditions settings block, specify the conditions that the events must meet:
- Click the Add condition button.
- In the Left operand and Right operand drop-down lists, specify the search parameters.
Depending on the data source selected in the Right operand field, you may see fields of additional parameters that you need to use to define the value that will be passed to the filter. For example, when choosing active list you will need to specify the name of the active list, the entry key, and the entry key field.
- In the operator drop-down list, select the relevant operator.
- If necessary, select the do not match case check box. When this check box is selected, the operator ignores the case of the values.
The selection of this check box does not apply to the InSubnet, InActiveList, InCategory or InActiveDirectoryGroup operators.
This check box is cleared by default.
- If you want to add a negative condition, select If not from the If drop-down list.
- You can add multiple conditions or a group of conditions.
- If you have added multiple conditions or groups of conditions, choose a search condition (and, or, not) by clicking the AND button.
- If you want to add existing filters that are selected from the Select filter drop-down list, click the Add filter button.
You can view the nested filter settings by clicking the
button.
The new enrichment rule was added to the set of resources for the collector.
LDAP enrichment
To enable enrichment using LDAP:
- Click Add enrichment with LDAP data.
This opens the settings block for LDAP enrichment.
- In the LDAP accounts mapping settings block, use the New domain button to specify the domain of the user accounts. You can specify multiple domains.
- In the LDAP mapping table, define the rules for mapping KUMA fields to LDAP attributes:
- In the KUMA field column, indicate the KUMA event field which data should be compared to LDAP attribute.
- In the LDAP attribute column, specify the attribute that must be compared with the KUMA event field. The drop-down list contains standard attributes and can be augmented with custom attributes.
- In the KUMA event field to write to column, specify in which field of the KUMA event the ID of the user account imported from LDAP should be placed if the mapping was successful.
You can use the Add row button to add a string to the table, and can use the
button to remove a string. You can use the Apply default mapping button to fill the mapping table with standard values.
Event enrichment rules for data received from LDAP were added to the group of resources for the collector.
If you add an enrichment to an existing collector using LDAP or change the enrichment settings, you must stop and restart the service.
Proceed to the next step of the Installation Wizard.
Page topStep 7. Routing
This is an optional step of the Installation Wizard. On the Routing tab of the Installation Wizard, you can select or create destinations with settings indicating the forwarding destination of events processed by the collector. Typically, events from the collector are routed to two points: to the correlator to analyze and search for threats; and to the storage, both for storage and so that processed events can be viewed later. Events can be sent to other locations as needed. There can be more than one destination point.
To add an existing destination to a collector resource set:
- In the Add destination drop-down list, select the type of destination resource you want to add:
- Select Storage if you want to configure forwarding of processed events to the storage.
- Select Correlator if you want to configure forwarding of processed events to a correlator.
- Select Other if you want to send events to other locations.
This type of resource includes correlator and storage services that were created in previous versions of the program.
The Add destination window opens where you can specify parameters for events forwarding.
- In the Destination drop-down list, select the necessary destination.
The window name changes to Edit destination, and it displays the settings of the selected resource. To open the settings of a destination for editing in a new browser tab, click
. - Click Save.
The selected destination is displayed on the Installation Wizard tab. A destination resource can be removed from the resource set by selecting it and clicking Delete in the opened window.
To add a new destination resource to a collector resource set:
- In the Add destination drop-down list, select the type of destination resource you want to add:
- Select Storage if you want to configure forwarding of processed events to the storage.
- Select Correlator if you want to configure forwarding of processed events to a correlator.
- Select Other if you want to send events to other locations.
This type of resource includes correlator and storage services that were created in previous versions of the program.
The Add destination window opens where you can specify parameters for events forwarding.
- Specify the settings on the Basic settings tab:
- In the Destination drop-down list, select Create new.
- In the Name field, enter a unique name for the destination resource. The name must contain 1 to 128 Unicode characters.
- Use the Disabled toggle button to specify whether events will be sent to this destination. By default, sending events is enabled.
- Select the Type for the destination resource:
- Select storage if you want to configure forwarding of processed events to the storage.
- Select correlator if you want to configure forwarding of processed events to a correlator.
- Select nats-jetstream, tcp, http, kafka, or file if you want to configure sending events to other locations.
- Specify the URL to which events should be sent in the hostname:<API port> format.
You can specify multiple destination addresses using the URL button for all types except nats-jetstream, file, and diode.
- For the nats-jetstream and kafka types, use the Topic field to specify which topic the data should be written to. The topic must contain Unicode characters. The Kafka topic is limited to 255 characters.
- If necessary, specify the settings on the Advanced settings tab. The available settings vary based on the selected destination resource type:
- Compression is a drop-down list where you can enable Snappy compression. By default, compression is disabled.
- Proxy is a drop-down list for proxy server selection.
- The Buffer size field is used to set buffer size (in bytes) for the destination. The default value is 1 MB, and the maximum value is 64 MB.
- Timeout field is used to set the timeout (in seconds) for another service or component response. The default value is
30. - Disk buffer size limit field is used to specify the size of the disk buffer in bytes. The default size is 10 GB.
- Cluster ID is the ID of the NATS cluster.
- TLS mode is a drop-down list where you can specify the conditions for using TLS encryption:
- Disabled (default)—do not use TLS encryption.
- Enabled—encryption is enabled, but without verification.
- With verification—use encryption with verification that the certificate was signed with the KUMA root certificate. The root certificate and key of KUMA are created automatically during program installation and are stored on the KUMA Core server in the folder /opt/kaspersky/kuma/core/certificates/.
When using TLS, it is impossible to specify an IP address as a URL.
- URL selection policy is a drop-down list in which you can select a method for determining which URL to send events to if several URLs have been specified:
- Any. Events are sent to one of the available URLs as long as this URL receives events. If the connection is broken (for example, the receiving node is disconnected) a different URL will be selected as the events destination.
- Prefer first. Events are sent to the first URL in the list of added addresses. If it becomes unavailable, events are sent to the next available node in sequence. When the first URL becomes available again, events start to be sent to it again.
- Balanced means that packages with events are evenly distributed among the available URLs from the list. Because packets are sent either on a destination buffer overflow or on the flush timer, this URL selection policy does not guarantee an equal distribution of events to destinations.
- Delimiter is used to specify the character delimiting the events. By default,
\nis used. - Path—the file path if the file destination type is selected.
- Buffer flush interval—this field is used to set the time interval (in seconds) at which the data is sent to the destination. The default value is
100. - Workers—this field is used to set the number of services processing the queue. By default, this value is equal to the number of vCPUs of the KUMA Core server.
- You can set health checks using the Health check path and Health check timeout fields. You can also disable health checks by selecting the Health Check Disabled check box.
- Debug—a toggle switch that lets you specify whether resource logging must be enabled. By default, this toggle switch is in the Disabled position.
- The Disk buffer disabled drop-down list is used to enable or disable the use of a disk buffer. By default, the disk buffer is disabled.
The disk buffer is used if the collector cannot send normalized events to the destination. The amount of allocated disk space is limited by the value of the Disk buffer size limit setting.
If the disk space allocated for the disk buffer is exhausted, events are rotated as follows: new events replace the oldest events written to the buffer.
- In the Filter section, you can specify the conditions to define events that will be processed by this resource. You can select an existing filter from the drop-down list or create a new filter.
Creating a filter in resources
- In the Filter drop-down list, select Create new.
- If you want to keep the filter as a separate resource, select the Save filter check box.
In this case, you will be able to use the created filter in various services.
This check box is cleared by default.
- If you selected the Save filter check box, enter a name for the created filter resource in the Name field. The name must contain 1 to 128 Unicode characters.
- In the Conditions settings block, specify the conditions that the events must meet:
- Click the Add condition button.
- In the Left operand and Right operand drop-down lists, specify the search parameters.
Depending on the data source selected in the Right operand field, you may see fields of additional parameters that you need to use to define the value that will be passed to the filter. For example, when choosing active list you will need to specify the name of the active list, the entry key, and the entry key field.
- In the operator drop-down list, select the relevant operator.
- If necessary, select the do not match case check box. When this check box is selected, the operator ignores the case of the values.
The selection of this check box does not apply to the InSubnet, InActiveList, InCategory or InActiveDirectoryGroup operators.
This check box is cleared by default.
- If you want to add a negative condition, select If not from the If drop-down list.
- You can add multiple conditions or a group of conditions.
- If you have added multiple conditions or groups of conditions, choose a search condition (and, or, not) by clicking the AND button.
- If you want to add existing filters that are selected from the Select filter drop-down list, click the Add filter button.
You can view the nested filter settings by clicking the
button.
- Click Save.
The created destination is displayed on the Installation Wizard tab. A destination resource can be removed from the resource set by selecting it and clicking Delete in the opened window.
Proceed to the next step of the Installation Wizard.
Page topStep 8. Setup validation
This is the required, final step of the Installation Wizard. At this step, KUMA creates a service resource set, and the Services are created automatically based on this set:
- The set of resources for the collector is displayed under Resources → Collectors. It can be used to create new collector services. When this set of resources changes, all services that operate based on this set of resources will start using the new parameters after the services restart. To do so, you can use the Save and restart services and Save and update service configurations buttons.
A set of resources can be modified, copied, moved from one folder to another, deleted, imported, and exported, like other resources.
- Services are displayed in Resources → Active services. The services created using the Installation Wizard perform functions inside the KUMA program. To communicate with external parts of the network infrastructure, you need to install similar external services on the servers and assets intended for them. For example, an external collector service should be installed on a server intended as an events recipient, external storage services should be installed on servers that have a deployed ClickHouse service, and external agent services should be installed on the Windows assets that must both receive and forward Windows events.
To finish the Installation Wizard:
- Click Create and save service.
The Setup validation tab of the Installation Wizard displays a table of services created based on the set of resources selected in the Installation Wizard. The lower part of the window shows examples of commands that you must use to install external equivalents of these services on their intended servers and assets.
For example:
/opt/kaspersky/kuma/kuma collector --core https://kuma-example:<port used for communication with the KUMA Core> --id <service ID> --api.port <port used for communication with the service> --install
The "kuma" file can be found inside the installer in the /kuma-ansible-installer/roles/kuma/files/ directory.
The port for communication with the KUMA Core, the service ID, and the port for communication with the service are added to the command automatically. You should also ensure the network connectivity of the KUMA system and open the ports used by its components if necessary.
- Close the Wizard by clicking Save collector.
The collector service is created in KUMA. Now you will install a similar service on the server intended for receiving events.
If a wmi or wec connector was selected for collectors, you must also install the automatically created KUMA agents.
Page topInstalling a collector in a KUMA network infrastructure
A collector consists of two parts: one part is created inside the KUMA web interface, and the other part is installed on the network infrastructure server intended for receiving events. The second part of the collector is installed in the network infrastructure.
To install a collector:
- Log in to the server where you want to install the service.
- Create the /opt/kaspersky/kuma/ folder.
- Copy the "kuma" file to the /opt/kaspersky/kuma/ folder. The file is located in the installer in the /kuma-ansible-installer/roles/kuma/files/ folder.
Make sure the kuma file has sufficient rights to run. If the file is not executable, make it executable:
sudo chmod +x /opt/kaspersky/kuma/kuma - Place the LICENSE file from the /kuma-ansible-installer/roles/kuma/files/ directory in the /opt/kaspersky/kuma/ directory and accept the license by running the following command:
sudo /opt/kaspersky/kuma/kuma license - Create the 'kuma' user:
sudo useradd --system kuma && usermod -s /usr/bin/false kuma - Make the 'kuma' user the owner of the /opt/kaspersky/kuma directory and all files inside the directory:
sudo chown -R kuma:kuma /opt/kaspersky/kuma/ - Execute the following command:
sudo /opt/kaspersky/kuma/kuma collector --core https://<FQDN of the KUMA Core server>:<port used by KUMA Core for internal communication (port 7210 is used by default)> --id <service ID copied from the KUMA console> --api.port <port used for communication with the installed component>Example:
sudo /opt/kaspersky/kuma/kuma collector --core https://test.kuma.com:7210 --id XXXX --api.port YYYYIf errors are detected as a result of the command execution, make sure that the settings are correct. For example, the availability of the required access level, network availability between the collector service and the Core, and the uniqueness of the selected API port. After fixing errors, continue installing the collector.
If no errors were found, and the collector status in the KUMA console is changed to green, stop the command execution and proceed to the next step.
The command can be copied at the last step of the installer wizard. It automatically specifies the address and port of the KUMA Core server, the identifier of the collector to be installed, and the port that the collector uses for communication.
When deploying several KUMA services on the same host, during the installation process you must specify unique ports for each component using the
--api.port <port>parameter. The following setting values are used by default:--api.port 7221.Before installation, ensure the network connectivity of KUMA components.
- Run the command again by adding the
--installkey:sudo /opt/kaspersky/kuma/kuma collector --core https://<FQDN of the KUMA Core server>:<port used by KUMA Core for internal communication (port 7210 is used by default)> --id <service ID copied from the KUMA console> --api.port <port used for communication with the installed component> --installExample:
sudo /opt/kaspersky/kuma/kuma collector --core https://kuma.example.com:7210 --id XXXX --api.port YYYY --install - Add KUMA collector port to firewall exclusions.
For the program to run correctly, ensure that the KUMA components are able to interact with other components and programs over the network via the protocols and ports specified during the installation of the KUMA components.
The collector is installed. You can use it to receive data from an event source and forward it for processing.
Page topValidating collector installation
To verify that the collector is ready to receive events:
- In the KUMA console, go to the Resources → Active services section.
- Make sure that the collector you installed has the green status.
If the status of the collector is not green, view the log of this service on the machine where it is installed, in the /opt/kaspersky/kuma/collector/<collector ID>/log/collector directory. Errors are logged regardless of whether debug mode is enabled or disabled.
If the collector is installed correctly and you are sure that data is coming from the event source, the table should display events when you search for events associated with the collector.
To check for normalization errors using the Events section of the KUMA console:
- Make sure that the Collector service is running.
- Make sure that the event source is providing events to the KUMA.
- Make sure that you selected Only errors in the Keep raw event drop-down list of the Normalizer resource in the Resources section of the KUMA console.
- In the Events section of KUMA, search for events with the following parameters:
ServiceID = <ID of the collector to be checked>Raw != ""
If any events are found with this search, it means that there are normalization errors and they should be investigated.
To check for normalization errors using the Grafana Dashboard:
- Make sure that the Collector service is running.
- Make sure that the event source is providing events to the KUMA.
- Open the Metrics section and follow the KUMA Collectors link.
- See if the Errors section of the Normalization widget displays any errors.
If there are any errors, it means that there are normalization errors and they should be investigated.
For WEC and WMI collectors, you must ensure that unique ports are used to connect to their agents. This port is specified in the Transport section of Collector Installation Wizard.
Page topEnsuring uninterrupted collector operation
An uninterrupted event stream from the event source to KUMA is important for protecting the network infrastructure. Continuity can be ensured though automatic forwarding of the event stream to a larger number of collectors:
- On the KUMA side, two or more identical collectors must be installed.
- On the event source side, you must configure control of event streams between collectors using third-party server load management tools, such as rsyslog or nginx.
With this configuration of the collectors in place, no incoming events will be lost if the collector server is unavailable for any reason.
Please keep in mind that when the event stream switches between collectors, each collector will aggregate events separately.
If the KUMA collector fails to start, and its log includes the "panic: runtime error: slice bounds out of range [8:0]" error:
- Stop the collector.
sudo systemctl stop kuma-collector-<collector ID> - Delete the DNS enrichment cache files.
sudo rm -rf /opt/kaspersky/kuma/collector/<collector ID>/cache/enrichment/DNS-* - Delete the event cache files (disk buffer). Run the command only if you can afford to jettison the events in the disk buffers of the collector.
sudo rm -rf /opt/kaspersky/kuma/collector/<collector ID>/buffers/* - Start the collector service.
sudo systemctl start kuma-collector-<collector ID>
Event stream control using rsyslog
To enable rsyslog event stream control on the event source server:
- Create two or more identical collectors that you want to use to ensure uninterrupted reception of events.
- Install rsyslog on the event source server (see the rsyslog documentation).
- Add rules for forwarding the event stream between collectors to the configuration file /etc/rsyslog.conf:
*. * @@ <main collector server FQDN>: <port for incoming events>$ActionExecOnlyWhenPreviousIsSuspended on*. * @@ <backup collector server FQDN>: <port for incoming events>$ActionExecOnlyWhenPreviousIsSuspended off - Restart rsyslog by running the following command:
systemctl restart rsyslog.
Event stream control is now enabled on the event source server.
Page topEvent stream control using nginx
To control event stream using nginx, you need to create and configure a ngnix server to receive events from the event source and then forward these to collectors.
To enable nginx event stream control on the event source server:
- Create two or more identical collectors that you want to use to ensure uninterrupted reception of events.
- Install nginx on the server intended for event stream control.
- Installation command in Oracle Linux 8.6:
$sudo dnf install nginx - Installation command in Ubuntu 20.4:
$sudo apt-get install nginxWhen installing from sources, you must compile with the parameter
-with-streamoption:
$ sudo ./configure -with-stream -without-http_rewrite_module -without-http_gzip_module
- Installation command in Oracle Linux 8.6:
- On the nginx server, add the stream module to the nginx.conf configuration file that contains the rules for forwarding the stream of events between collectors.
- Restart nginx by running the following command:
systemctl restart nginx - On the event source server, forward events to the ngnix server.
Event stream control is now enabled on the event source server.
Nginx Plus may be required to fine-tune balancing, but certain balancing methods, such as Round Robin and Least Connections, are available in the base version of ngnix.
For more details on configuring nginx, please refer to the nginx documentation.
Page topPredefined collectors
The predefined collectors listed in the table below are included in the OSMP distribution kit.
Predefined collectors
Name |
Description |
|---|---|
[OOTB] CEF |
Collects CEF events received over the TCP protocol. |
[OOTB] KSC |
Collects events from Kaspersky Security Center over the Syslog TCP protocol. |
[OOTB] KSC SQL |
Collects events from Kaspersky Security Center using an MS SQL database query. |
[OOTB] Syslog |
Collects events via the Syslog protocol. |
[OOTB] Syslog-CEF |
Collects CEF events that arrive over the UDP protocol and have a Syslog header. |
Creating an agent
A KUMA agent consists of two parts: one part is created inside the KUMA web interface, and the second part is installed on a server or on an asset in the network infrastructure.
An agent is created in several steps:
- Creating a set of resources for an agent in the KUMA console
- Creating an agent service in the KUMA console
- Installing the server portion of the agent to the asset that will forward messages
A KUMA agent for Windows assets can be created automatically when you create a collector with the wmi or wec transport type. Although the set of resources and service of these agents are created in the Collector Installation Wizard, they must still be installed to the asset that will be used to forward a message.
Creating a set of resources for an agent
In the KUMA web interface, an agent service is created based on the set of resources for an agent that unites connectors and destinations.
To create a set of resources for an agent in the KUMA web interface:
- In the KUMA web interface, under Resources → Agents, click Add agent.
This opens a window for creating an agent with the Base settings tab active.
- Specify the settings on the Base settings tab:
- In the Agent name field, enter a unique name for the created service. The name must contain 1 to 128 Unicode characters.
- In the Tenant drop-down list, select the tenant that will own the storage.
- If necessary, move the Debug toggle switch to the active position to enable logging of service operations.
- You can optionally add up to 256 Unicode characters describing the service in the Description field.
- Click
 to create a connection for the agent and switch to the added Connection <number> tab.
You can remove tabs by clicking
. - In the Connector group of settings, add a connector:
- If you want to select an existing connector, select it from the drop-down list.
- If you want to create a new connector, select Create new in the drop-down list and specify the following settings:
- Specify the connector name in the Name field. The name must contain 1 to 128 Unicode characters.
- In the Type drop-down list, select the connector type and specify its settings on the Basic settings and Advanced settings tabs. The available settings depend on the selected type of connector:
The agent type is determined by the connector that is used in the agent. The only exception is for agents with a destination of the diode type. These agents are considered to be diode agents.
When using the tcp or udp connector type at the normalization stage, IP addresses of the assets from which the events were received will be written in the DeviceAddress event field if it is empty.
The ability to edit previously created wec or wmi connections in agents, collectors, and connectors is limited. You can change the connection type from wec to wmi and vice versa, but you cannot change the wec or wmi connection to any other connection type. At the same time, when editing other connection types, you cannot select the wec or wmi types. You can create connections without any restrictions on the types of connectors.
- You can optionally add up to 4,000 Unicode characters describing the resource in the Description field.
The connector is added to the selected connection of the agent's set of resources. The created connector is only available in this resource set and is not displayed in the web interface Resources → Connectors section.
- In the Destinations group of settings, add a destination.
- If you want to select an existing destination, select it from the drop-down list.
- If you want to create a new destination, select Create new in the drop-down list and specify the following settings:
- Specify the destination name in the Name field. The name must contain 1 to 128 Unicode characters.
- In the Type drop-down list, select the destination type and specify its settings on the Basic settings and Advanced settings tabs. The available settings depend on the selected type of destination:
- nats-jetstream—used for NATS communications.
- tcp—used for communications over TCP.
- http—used for HTTP communications.
- diode—used to transmit events using a data diode.
- kafka—used for Kafka communications.
- file—used for writing to a file.
- You can optionally add up to 4,000 Unicode characters describing the resource in the Description field.
The advanced settings for an agent destination (such as TLS mode and compression) must match the advanced destination settings for the collector that you want to link to the agent.
There can be more than one destination point. You can add them by clicking the Add destination button and can remove them by clicking the
button. - Repeat steps 3–5 for each agent connection that you want to create.
- Click Save.
The set of resources for the agent is created and displayed under Resources → Agents. Now you can create an agent service in KUMA.
Page topCreating an agent service in the KUMA console
When a set of resources is created for an agent, you can proceed to create an agent service in KUMA.
To create an agent service in the KUMA console:
- In the KUMA console, under Resources → Active services, click Add service.
- In the opened Choose a service window, select the set of resources that was just created for the agent and click Create service.
The agent service is created in the KUMA console and is displayed under Resources → Active services. Now agent services must be installed to each asset from which you want to forward data to the collector. A service ID is used during installation.
Page topInstalling an agent in a KUMA network infrastructure
When an agent service is created in KUMA, you can proceed to installation of the agent to the network infrastructure assets that will be used to forward data to a collector.
Prior to installation, verify the network connectivity of the system and open the ports used by its components.
Installing a KUMA agent on Linux assets
KUMA agent installed on Linux devices stops when you close the terminal or restart the server. To avoid starting the agents manually, we recommend installing the agent by using a system that automatically starts applications when the server is restarted, such as Supervisor. To start the agents automatically, define the automatic startup and automatic restart settings in the configuration file. For more details on configuring settings, please refer to the official documentation of automatic application startup systems. An example of configuring settings in Supervisor, which you can adapt to your needs:
[program:agent_<agent name>] command=sudo /opt/kaspersky/kuma/kuma agent --core https://<KUMA Core server FQDN>:<port used by KUMA Core
autostart=true
autorestart=true
To install a KUMA agent to a Linux asset:
- Log in to the server where you want to install the service.
- Create the following directories:
- /opt/kaspersky/kuma/
- /opt/kaspersky/agent/
- Copy the "kuma" file to the /opt/kaspersky/kuma/ folder. The file is located in the installer in the /kuma-ansible-installer/roles/kuma/files/ folder.
Make sure the kuma file has sufficient rights to run.
- Execute the following command:
sudo /opt/kaspersky/kuma/kuma agent --core https://<KUMA Core server FQDN>:<port used by KUMA Core server for internal communication (port 7210 by default)> --id <service ID copied from the KUMA console> --wd <path to the directory that will contain the files of the installed agent. If this flag is not specified, the files will be stored in the directory where the kuma file is located>Example:
sudo /opt/kaspersky/kuma/kuma agent --core https://kuma.example.com:7210 --id XXXX --wd /opt/kaspersky/kuma/agent/XXXX
The KUMA agent is installed on the Linux asset. The agent forwards data to KUMA, and you can set up a collector to receive this data.
Page topInstalling a KUMA agent on Windows assets
Prior to installing a KUMA agent to a Windows asset, the server administrator must create a user account with the EventLogReaders and Log on as a service permissions on the Windows asset. This user account must be used to start the agent.
If you want to run the agent under a local account, you will need administrator rights and Log on as a service. If you want to perform the collection remotely and only read logs under a domain account, EventLogReaders rights are sufficient.
To install a KUMA agent to a Windows asset:
- Copy the kuma.exe file to a folder on the Windows asset.
C:\Users\<User name>\Desktop\KUMAfolder is recommended for installation.The kuma.exe file is located inside the installer in the /kuma-ansible-installer/roles/kuma/files/ folder.
- Start the Command Prompt on the Windows asset with Administrator privileges and locate the folder containing the kuma.exe file.
- Execute the following command:
kuma agent --core https://<fullly qualified domain name of the KUMA Core server>:<port used by the KUMA Core server for internal communications (port 7210 by default)> --id <ID of the agent service that was created in KUMA> --user <name of the user account used to run the agent, including the domain> --installExample:
kuma agent --core https://kuma.example.com:7210 --id XXXXX --user domain\username --installYou can get help information by executing the
kuma help agentcommand. - Enter the password of the user account used to run the agent.
The C:\Program Files\Kaspersky Lab\KUMA\agent\<agent ID> folder is created and the KUMA agent service is installed in it. The agent forwards Windows events to KUMA, and you can set up a collector to receive them.
When the agent service is installed, it starts automatically. The service is also configured to restart in case of any failures. The agent can be restarted from the KUMA console, but only when the service is active. Otherwise, the service needs to be manually restarted on the Windows asset.
Removing a KUMA agent from Windows assets
When configuring services, you can check the configuration for errors before installation by running the agent with the following command:
kuma agent --core https://<fullly qualified domain name of the KUMA Core server>:<port used by the KUMA Core server for internal communications (port 7210 by default)> --id <ID of the agent service that was created in KUMA> --user <name of the user account used to run the agent, including the domain>
Automatically created agents
When creating a collector with wec or wmi connectors, agents are automatically created for receiving Windows events.
Automatically created agents have the following special conditions:
- Automatically created agents can have only one connection.
- Automatically created agents are displayed under Resources → Agents, and
auto createdis indicated at the end of their name. Agents can be reviewed or deleted. - The settings of automatically created agents are defined automatically based on the collector settings from the Connect event sources and Transport sections. You can change the settings only for a collector that has a created agent.
- The description of an automatically created agent is taken from the collector description in the Connect event sources section.
- Debugging of an automatically created agent is enabled and disabled in the Connect event sources section of the collector.
- When deleting a collector with an automatically created agent, you will be prompted to choose whether to delete the collector together with the agent or to just delete the collector. When deleting only the collector, the agent will become available for editing.
- When deleting automatically created agents, the type of collector changes to http, and the connection address is deleted from the URL field of the collector.
- If at least one Windows log name in wec or wmi connector is specified incorrectly, the agent will not receive events from any Windows log listed in the connector. At the same time the agent status will be green. Attempts to receive events will be repeated every 60 seconds, and error messages will be added to the service log.
In the KUMA interface, automatically created agents appear at the same time when the collector is created. However, they must still be installed on the asset that will be used to forward a message.
Page topUpdate agents
When updating KUMA versions, the WMI and WEC agents installed on remote machines must also be updated.
To update the agent, use an administrator account and follow these steps:
- In the KUMA console, in the Resources → Active services → Agents section, select the agent that you want to update and copy its ID.
You need the ID to install the new agent with the same ID after removing the old agent.
- In Windows, in the Services section, open the agent and click Stop.
- On the command line, go to the folder where the agent is installed and run the command to remove the agent from the server.
kuma.exe agent --id <
ID of agent service that was created in KUMA> --uninstall - Place the new agent in the same folder.
- On the command line, go to the folder with the new agent and from that folder, run the installation command using the agent ID from step 1.
kuma agent --core https://<
fullly qualified domain name of the KUMA Core server>:<port used by the KUMA Core server for internal communications (port 7210 by default)> --id <ID of the agent service that was created in KUMA> --user <name of the user account used to run the agent, including the domain> --install
The agent is updated.
Page topTransferring events from isolated network segments to KUMA
Data transfer scenario
Data diodes can be used to transfer events from isolated network segments to KUMA. Data transfer is organized as follows:
- KUMA agent that is Installed on a standalone server, with a diode destination receives events and moves them to a directory from which the data diode will pick up the events.
The agent accumulates events in a buffer until it overflows or for a user-defined period after the last write to disk. The events are then written to a file in the temporary directory of the agent. The file is moved to the directory processed by the data diode; its name is a combination of the file contents hash (SHA-256) and the file creation time.
- The data diode moves files from the isolated server directory to the external server directory.
- A KUMA collector with a diode connector installed on an external server reads and processes events from the files of the directory where the data diode places files.
After all events are read from a file, it is automatically deleted. Before reading events, the contents of files are verified based on the hash in the file name. If the contents fail verification, the file is deleted.
In the described scenario, the KUMA components are responsible for moving events to a specific directory within the isolated segment and for receiving events from a specific directory in the external network segment. The data diode transfers files containing events from the directory of the isolated network segment to the directory of the external network segment.
For each data source within an isolated network segment, you must create its own KUMA collector and agent, and configure the data diode to work with separate directories.
Configuring KUMA components
Configuring KUMA components for transferring data from isolated network segments consists of the following steps:
- Creating a collector service in the external network segment.
At this step, you must create and install a collector to receive and process the files that the data diode will transfer from the isolated network segment. You can use the Collector Installation Wizard to create the collector and all the resources it requires.
At the Transport step, you must select or create a connector of the diode type. In the connector, you must specify the directory to which the data diode will move files from the isolated network segment.
The user "kuma" that runs the collector must have read/write/delete permissions in the directory to which the data diode moves data from the isolated network segment.
- Creating a set of resources for a KUMA agent.
At this step, you must create a set of resources for the KUMA agent that will receive events in an isolated network segment and prepare them for transferring to the data diode. The diode agent resource set has the following requirements:
- The destination in the agent must have the diode type. In this resource, you must specify the directory from which the data diode will move files to the external network segment.
- You cannot select connectors of the sql or netflow types for the diode agent.
- TLS mode must be disabled in the connector of the diode agent.
- Downloading the agent configuration file as JSON file.
- The set of agent resources from a diode-type destination must be downloaded as a JSON file.
- If secret resources were used in the agent resource set, you must manually add the secret data to the configuration file.
- Installing the KUMA agent service in the isolated network segment.
At this step, you must install the agent in an isolated network segment based on the agent configuration file that was created at the previous step. It can be installed to Linux and Windows devices.
Configuring a data diode
The data diode must be configured as follows:
- Data must be transferred atomically from the directory of the isolated server (where the KUMA agent places the data) to the directory of the external server (where the KUMA collector reads the data).
- The transferred files must be deleted from the isolated server.
For information on configuring the data diode, please refer to the documentation for the data diode used in your organization.
Special considerations
When working with isolated network segments, operations with SQL and NetFlow are not supported.
When using the scenario described above, the agent cannot be administered through the KUMA console because it resides in an isolated network segment. Such agents are not displayed in the list of active KUMA services.
Diode agent configuration file
A created set of agent resources with a diode-type destination can be downloaded as a configuration file. This file is used when installing the agent in an isolated network segment.
To download the configuration file:
In the KUMA console, under Resources → Agents, select the relevant set of agent resources with a 'diode' destination and click Download config.
The agent settings configuration is downloaded as a JSON file based on the settings of your browser. Secrets used in the agent resource set are downloaded empty. Their IDs are specified in the file in the "secrets" section. To use a configuration file to install an agent in an isolated network segment, you must manually add secrets to the configuration file (for example, specify the URL and passwords used in the agent connector to receive events).
You must use an access control list (ACL) to configure permissions to access the file on the server where the agent will be installed. File read access must be available to the user account that will run the diode agent.
Below is an example of a diode agent configuration file with a kafka connector.
{ "config": { "id": "<ID of the set of agent resources>", "name": "<name of the set of agent resources>", "proxyConfigs": [ { "connector": { "id": "<ID of the connector. This example shows a kafka-type connector, but other types of connectors can also be used in a diode agent. If a connector is created directly in the set of agent resources, the ID is not defined.>", "name": "<name of the connector>", "kind": "kafka", "connections": [ { "kind": "kafka", "urls": [ "localhost:9093" ], "host": "", "port": "", "secretID": "<ID of the secret>", "clusterID": "", "tlsMode": "", "proxy": null, "rps": 0, "maxConns": 0, "urlPolicy": "", "version": "", "identityColumn": "", "identitySeed": "", "pollInterval": 0, "query": "", "stateID": "", "certificateSecretID": "", "authMode": "pfx", "secretTemplateKind": "", "certSecretTemplateKind": "" } ], "topic": "<kafka topic name>", "groupID": "<kafka group ID>", "delimiter": "", "bufferSize": 0, "characterEncoding": "", "query": "", "pollInterval": 0, "workers": 0, "compression": "", "debug": false, "logs": [], "defaultSecretID": "", "snmpParameters": [ { "name": "-", "oid": "", "key": "" } ], "remoteLogs": null, "defaultSecretTemplateKind": "" }, "destinations": [ { "id": "<ID of the destination. If the destination is created directly in the set of agent resources, the ID is not defined.>", "name": "<destination name>", "kind": "diode", "connection": { "kind": "file", "urls": [ "<path to the directory where the destination should place events that the data diode will transmit from the isolated network segment>", "<path to the temporary directory in which events are placed to prepare for data transmission by the diode>" ], "host": "", "port": "", "secretID": "", "clusterID": "", "tlsMode": "", "proxy": null, "rps": 0, "maxConns": 0, "urlPolicy": "", "version": "", "identityColumn": "", "identitySeed": "", "pollInterval": 0, "query": "", "stateID": "", "certificateSecretID": "", "authMode": "", "secretTemplateKind": "", "certSecretTemplateKind": "" }, "topic": "", "bufferSize": 0, "flushInterval": 0, "diskBufferDisabled": false, "diskBufferSizeLimit": 0, "healthCheckPath": "", "healthCheckTimeout": 0, "healthCheckDisabled": false, "timeout": 0, "workers": 0, "delimiter": "", "debug": false, "disabled": false, "compression": "", "filter": null, "path": "" } ] } ], "workers": 0, "debug": false }, "secrets": { "<secret ID>": { "pfx": "<encrypted pfx key>", "pfxPassword": "<password to the encrypted pfx key. The changeit value is exported from KUMA instead of the actual password. In the configuration file, you must manually specify the contents of secrets>" } }, "tenantID": "<ID of the tenant>" } |
Description of secret fields
Secret fields
Field name |
Type |
Description |
|
string |
User name |
|
string |
Password |
|
string |
Token |
|
array of strings |
URL list |
|
string |
Public key (used in PKI) |
|
string |
Private key (used in PKI) |
|
string containing the base64-encoded pfx file |
Base64-encoded contents of the PFX file. In Linux, you can get the base64 encoding of a file by running the following command:
|
|
string |
Password of the PFX |
|
string |
Used in snmp3. Possible values: |
|
string |
Used in snmp1 |
|
string |
Used in snmp3. Possible values: |
|
string |
Used in snmp3. Possible values: |
|
string |
Used in snmp3 |
|
string containing the base64-encoded pem file |
Base64-encoded contents of the PEM file. In Linux, you can get the base64 encoding of a file by running the following command:
|
Installing Linux Agent in an isolated network segment
To install a KUMA agent to a Linux device in an isolated network segment:
- Place the following files on the Linux server in an isolated network segment that will be used by the agent to receive events and from which the data diode will move files to the external network segment:
- Agent configuration file.
You must use an access control list (ACL) to configure access permissions for the configuration file so that only the KUMA user will have file read access.
- Executive file /opt/kaspersky/kuma/kuma (the "kuma" file can located in the installer in the /kuma-ansible-installer/roles/kuma/files/ folder).
- Agent configuration file.
- Execute the following command:
sudo ./kuma agent --cfg <path to the agent configuration file> --wd <path to the directory where the files of the agent being installed will reside. If this flag is not specified, the files will be stored in the directory where the kuma file is located>
The agent service is installed and running on the server in an isolated network segment. It receives events and relays them to the data diode so that they can be sent to an external network segment.
Page topInstalling Windows Agent in an isolated network segment
Prior to installing a KUMA agent to a Windows asset, the server administrator must create a user account with the EventLogReaders and Log on as a service permissions on the Windows asset. This user account must be used to start the agent.
To install a KUMA agent to a Windows device in an isolated network segment:
- Place the following files on the Window server in an isolated network segment that will be used by the agent to receive events and from which the data diode will move files to the external network segment:
- Agent configuration file.
You must use an access control list (ACL) to configure access permissions for the configuration file so that the file can only be read by the user account that will run the agent.
- Kuma.exe executable file. This file can be found inside the installer in the /kuma-ansible-installer/roles/kuma/files/ directory.
It is recommended to use the
C:\Users\<user name>\Desktop\KUMAfolder. - Agent configuration file.
- Start the Command Prompt on the Windows asset with Administrator privileges and locate the folder containing the kuma.exe file.
- Execute the following command:
kuma.exe agent --cfg <path to the agent configuration file> --user <user name that will run the agent, including the domain> --installYou can get installer Help information by running the following command:
kuma.exe help agent - Enter the password of the user account used to run the agent.
The C:\Program Files\Kaspersky Lab\KUMA\agent\<Agent ID> folder is created in which the KUMA agent service is installed. The agent moves events to the folder so that they can be processed by the data diode.
When installing the agent, the agent configuration file is moved to the directory C:\Program Files\Kaspersky Lab\KUMA\agent\<agent ID specified in the configuration file>. The kuma.exe file is moved to the C:\Program Files\Kaspersky Lab\KUMA directory.
When installing an agent, its configuration file must not be located in the directory where the agent is installed.
When the agent service is installed, it starts automatically. The service is also configured to restart in case of any failures.
Removing a KUMA agent from Windows assets
When configuring services, you can check the configuration for errors before installation by running the agent with the following command:
kuma.exe agent --cfg <path to agent configuration file>
Transferring events from Windows machines to KUMA
To transfer events from Windows machines to KUMA, a combination of a KUMA agent and a KUMA collector is used. Data transfer is organized as follows:
- The KUMA agent installed on the machine receives Windows events:
- Using the WEC connector: the agent receives events arriving at the host under a subscription, as well as the server logs.
- Using the WMI connector: the agent connects to remote servers specified in the configuration and receives events.
- The agent sends events (without preprocessing) to the KUMA collector specified in the destination.
You can configure the agent so that different logs are sent to different collectors.
- The collector receives events from the agent, performs a full event processing cycle, and sends the processed events to the destination.
Receiving events from the WEC agent is recommended when using centralized gathering of events from Windows hosts using Windows Event Forwarding (WEF). The agent must be installed on the server that collects events; it acts as the Windows Event Collector (WEC). We do not recommend installing KUMA agents on every endpoint host from which you want to receive events.
The process of configuring the receipt of events using the WEC Agent is described in detail in the appendix: Configuring receipt of events from Windows devices using KUMA Agent (WEC).
For details about the Windows Event Forwarding technology, please refer to the official Microsoft documentation.
We recommend receiving events using the WMI agent in the following cases:
- If it is not possible to use the WEF technology to implement centralized gathering of events, and at the same time, installation of third-party software (for example, the KUMA agent) on the event source server is prohibited.
- If you need to obtain events from a small number of hosts — no more than 500 hosts per one KUMA agent.
For connecting Windows logs as an event source, we recommend using the "Add event source" wizard. When using a wizard to create a collector with WEC or WMI connectors, agents are automatically created for receiving Windows events. You can also manually create the resources necessary for collecting Windows events.
An agent and a collector for receiving Windows events are created and installed in several stages:
- Creating a set of resources for an agent
Agent connector:
When creating an agent, on the Connection tab, you must create or select a connector of the WEC or WMI type.
If at least one Windows log name in a WEC or WMI connector is specified incorrectly, the agent will receive events from all Windows logs listed in the connector, except the problematic log. At the same time the agent status will be green. Attempts to receive events will be repeated every 60 seconds, and error messages will be added to the service log.
Agent destination:
The type of agent destination depends on the data transfer method you use: nats, tcp, http, diode, kafka, file.
You must use the
\0value as the destination separator.The advanced settings for the agent destination (such as separator, compression and TLS mode) must match the advanced destination settings for the collector connector that you want to link to the agent.
- Creating an agent service in the KUMA console
- Installing the KUMA agent on the Windows machine from which you want to receive Windows events.
Before installation, make sure that the system components have access to the network and open the necessary network ports:
- Port 7210, TCP: from server with collectors to the Core.
- Port 7210, TCP: from agent server to the Core.
- The port configured in the URL field when the connector was created: from the agent server to the server with the collector.
- Creating and installing KUMA collector.
When creating a set of collectors, at the Transport step, you must create or select a connector that the collector will use to receive events from the agent. Connector type must match the type of the agent destination.
The advanced settings of the connector (such as delimiter, compression, and TLS mode) must match the advanced settings of the agent destination that you want to link to the agent.
For some playbooks to work correctly, you may need to configure additional enrichment of the collector.
To edit enrichment rule settings in the KUMA collector:
- Add an enrichment rule by clicking Add enrichment rule and specify the following information in the corresponding fields:
- Name: Specify an arbitrary name for the rule.
- Source kind: dns.
- URL: IP address of the domain controller.
- Requests per second: 5.
- Workers: 2.
- Cache TTL: 3600.
- Add an enrichment rule by clicking Add enrichment rule and do the following:
- Fill in the following fields:
- Name: Specify an arbitrary name for the rule.
- Source kind: event.
- Source field: DestinationNTDomain.
- Target field: DestinationNTDomain.
- Click Add conversion and specify the following information in the corresponding fields:
- Type: append.
- Constant:
.RU. - Type: replace.
- Chars:
RU.RU. - With chars:
RU.
- Fill in the following fields:
- Repeat the substeps from step 2 and specify SourceNTDomain as the Source field and Target field.
- Add enrichment with LDAP data and do the following:
- Under LDAP accounts mapping, specify the name of the domain controller.
- Click Apply default mapping to fill the mapping table with standard values.
Configuring event sources
This section provides information on configuring the receipt of events from various sources.
Configuring receipt of Auditd events
KUMA lets you monitor and audit the Auditd events on Linux devices.
Before configuring event receiving, make sure to create a new KUMA collector for the Auditd events.
Configuring the receipt of Auditd events involves the following steps:
- Installation of KUMA collector in the network infrastructure.
- Configuring the event source server.
- Verifying receipt of Auditd events by the KUMA collector.
You can verify that the Auditd event source server is configured correctly by searching for related events in the KUMA console.
Installing KUMA collector for receiving Auditd events
After creating a collector, in order to configure event receiving using rsyslog, you must install a collector on the network infrastructure server intended for receiving events.
For details on installing the KUMA collector, refer to the Installing collector in the network infrastructure section.
Page topConfiguring the event source server
The rsyslog service is used to transmit events from the server to the KUMA collector.
To configure transmission of events from the server to the collector:
- Make sure that the rsyslog service is installed on the event source server. For this purpose, execute the following command:
systemctl status rsyslog.serviceIf the rsyslog service is not installed on the server, install it by executing the following command:
yum install rsyslogsystemctl enable rsyslog.servicesystemctl start rsyslog.service - In the /etc/rsyslog.d folder, create the audit.conf file with the following content:
$ModLoad imfile$InputFileName /var/log/audit/audit.log$InputFileTag tag_audit_log:$InputFileStateFile audit_log$InputFileSeverity info$InputFileFacility local6$InputRunFileMonitor*.* @<KUMA collector IP address>:<KUMA collector port>If you want to send events over TCP, instead of the last line in the file insert the following line:
*.* @@<KUMA collector IP address>:<KUMA collector port>. - Save the changes to the audit.conf file.
- Restart the rsyslog service by executing the following command:
systemctl restart rsyslog.service
The event source server is configured. Data about events is transmitted from the server to the KUMA collector.
Page topConfiguring receipt of KATA/EDR events
You can configure the receipt of Kaspersky Anti Targeted Attack Platform events in the KUMA
.
Before configuring event receipt, make sure to create a KUMA collector for the KATA/EDR events.
When creating a collector in the KUMA console, make sure that the port number matches the port specified in step 4c of Configuring export of Kaspersky Anti Targeted Attack Platform events to KUMA, and that the connector type corresponds to the type specified in step 4d.
To receive Kaspersky Anti Targeted Attack Platform events using Syslog, in the collector Installation wizard, at the Event parsing step, select the [OOTB] KATA normalizer.
Configuring the receipt of KATA/EDR events involves the following steps:
- Configuring the forwarding of KATA/EDR events
- Installing the KUMA collector in the network infrastructure
- Verifying receipt of KATA/EDR events in the KUMA collector
You can verify that the KATA/EDR event source server is configured correctly by searching for related events in the KUMA console. Kaspersky Anti Targeted Attack Platform events are displayed as KATA in the table with search results.
Configuring export of KATA/EDR events to KUMA
To configure export of events from Kaspersky Anti Targeted Attack Platform to KUMA:
- In a browser on any computer with access to the Central Node server, enter the IP address of the server hosting the Central Node component.
A window for entering Kaspersky Anti Targeted Attack Platform user credentials opens.
- In the user credentials entry window, select the Local administrator check box and enter the Administrator credentials.
- Go to the Settings → SIEM system section.
- Specify the following settings:
- Select the Activity log and Detections check boxes.
- In the Host/IP field, enter the IP address or host name of the KUMA collector.
- In the Port field, specify the port number to connect to the KUMA collector.
- In the Protocol field, select TCP or UDP from the list.
- In the Host ID field, specify the server host ID to be indicated in the SIEM systems log as a detection source.
- In the Alert frequency field, enter the interval for sending messages: from 1 to 59 minutes.
- Enable TLS encryption, if necessary.
- Click Apply.
Export of Kaspersky Anti Targeted Attack Platform events to KUMA is configured.
Page topCreating KUMA collector for receiving KATA/EDR events
After configuring the event export settings, you must create a collector for Kaspersky Anti Targeted Attack Platform events in the KUMA console.
For details on creating a KUMA collector, refer to Creating a collector.
When creating a collector in the KUMA console, make sure that the port number matches the port specified in step 4c of Configuring export of Kaspersky Anti Targeted Attack Platform events to KUMA, and that the connector type corresponds to the type specified in step 4d.
To receive Kaspersky Anti Targeted Attack Platform events using Syslog, in the collector Installation wizard, at the Event parsing step, select the [OOTB] KATA normalizer.
Page topInstalling KUMA collector for receiving KATA/EDR events
After creating a collector, to configure receiving Kaspersky Anti Targeted Attack Platform events, install a new collector on the network infrastructure server intended for receiving events.
For details on installing the KUMA collector, refer to the Installing collector in the network infrastructure section.
Page topConfiguring Kaspersky Security Center event receiving in CEF format
KUMA allows you to receive and export events in the CEF format from Kaspersky Security Center Administration Server to the KUMA SIEM system.
Configuring the receipt of Kaspersky Security Center events in the CEF format involves the following steps:
- Configuring the forwarding of Kaspersky Security Center events.
- Configuring the KUMA Collector.
- Installing the KUMA collector in the network infrastructure.
- Verifying receipt of Kaspersky Security Center events in the CEF format in the KUMA collector
You can check if the events from Kaspersky Security Center in the CEF format were correctly exported to the KUMA SIEM system by using the KUMA console to search for related events.
To display Kaspersky Security Center events in CEF format in the table, enter the following search expression:
SELECT * FROM `events` WHERE DeviceProduct = 'OSMP' ORDER BY Timestamp DESC LIMIT 250
Configuring export of Kaspersky Security Center events in CEF format
Kaspersky Security Center allows you to configure the settings for exporting events in the CEF format to a SIEM system.
The function of exporting Kaspersky Security Center events in the CEF format to SIEM systems is available with Kaspersky Endpoint Security for Business Advanced license or above.
To configure export of events from Kaspersky Security Center Administration Server to the KUMA SIEM system:
- In Kaspersky Security Center console tree, select the Administration server node.
- In the workspace of the node, select the Events tab.
- Click the Configure notifications and event export link and select Configure export to SIEM system from the drop-down list.
The Properties: Events window opens. By default the Events export section is displayed.
- In the Events export section, select the Automatically export events to SIEM system database check box.
- In the SIEM system drop-down list select ArcSight (CEF format).
- In the corresponding fields, specify the address of the KUMA SIEM system server and the port for connecting to the server. Select TCP/IP as the protocol.
You can click Export archive and specify the starting date from which pre-existing KUMA events are to be exported to the SIEM system database. By default, Kaspersky Security Center exports events starting from the current date.
- Click OK.
As a result, the Kaspersky Security Center Administration Server automatically exports all events to the KUMA SIEM system.
Page topConfiguring KUMA collector for collecting Kaspersky Security Center events
After configuring the export of events in the CEF format from Kaspersky Security Center, configure the collector in the KUMA console.
To configure the KUMA Collector for Kaspersky Security Center events:
- In the KUMA console, go to the Resources → Collectors section.
- In the list of collectors, find the collector with the [OOTB] KSC normalizer and open it for editing.
- At the Transport step, in the URL field, specify the port to be used by the collector to receive Kaspersky Security Center events.
The port must match the port of the KUMA SIEM system server.
- At the Event parsing step, make sure that the [OOTB] KSC normalizer is selected.
- At the Routing step, make sure that the following destinations are added to the collector resource set:
- Storage. To send processed events to the storage.
- Correlator. To send processed events to the correlator.
If the Storage and Correlator destinations were not added, create them.
- At the Setup validation tab, click Create and save service.
- Copy the command for installing the KUMA collector that appears.
Installing KUMA collector for collecting Kaspersky Security Center events
After configuring the collector for collecting Kaspersky Security Center events in the CEF format, install the KUMA collector on the network infrastructure server intended for receiving events.
For details on installing the KUMA collector, refer to the Installing collector in the network infrastructure section.
Page topConfiguring receiving Kaspersky Security Center event from MS SQL
KUMA allows you to receive information about Kaspersky Security Center events from an MS SQL database.
Before configuring, make sure that you have created the KUMA collector for Kaspersky Security Center events from MS SQL.
When creating the collector in the KUMA console, at the Transport step, select the [OOTB] KSC SQL connector.
To receive Kaspersky Security Center events from the MS SQL database, at the Event parsing step, select the [OOTB] KSC from SQL normalizer.
Configuring event receiving consists of the following steps:
- Creating an account in the MS SQL.
- Configuring the SQL Server Browser service.
- Creating a secret.
- Configuring a connector.
- Installation of collector in the network infrastructure.
- Verifying receipt of events from MS SQL in the KUMA collector.
You can verify that the receipt of events from MS SQL is configured correctly by searching for related events in the KUMA console.
Creating an account in the MS SQL database
To receive Kaspersky Security Center events from MS SQL, a user account is required that has the rights necessary to connect and work with the database.
To create an account for working with MS SQL:
- Log in to the server with MS SQL for Kaspersky Security Center installed.
- Using SQL Server Management Studio, connect to MS SQL using an account with administrator rights.
- In the Object Explorer pane, expand the Security section.
- Right-click the Logins folder and select New Login from the context menu.
The Login - New window opens.
- On the General tab, click the Search button next to the Login name field.
The Select User or Group window opens.
- In the Enter the object name to select (examples) field, specify the object name and click OK.
The Select User or Group window closes.
- In the Login - New window, on the General tab, select the Windows authentication option.
- In the Default database field, select the Kaspersky Security Center database.
The default Kaspersky Security Center database name is KAV.
- On the User Mapping tab, configure the account permissions:
- In the Users mapped to this login section, select the Kaspersky Security Center database.
- In the Database role membership for section, select the check boxes next to the db_datareader and public permissions.
- On the Status tab, configure the permissions for connecting the account to the database:
- In the Permission to connect to database engine section, select Grant.
- In the Login section, select Enabled.
- Click OK.
The Login - New window closes.
To check the account permissions:
- Run SQL Server Management Studio using the created account.
- Go to any MS SQL database table and make a selection based on the table.
Configuring the SQL Server Browser service
After creating an account in MS SQL, you must configure the SQL Server Browser service.
To configure the SQL Server Browser service:
- Open SQL Server Configuration Manager.
- In the left pane, select SQL Server Services.
A list of services opens.
- Open the SQL Server Browser service properties in one of the following ways:
- Double-click the name of the SQL Server Browser service.
- Right-click the name of the SQL Server Browser service and select Properties from the context menu.
- In the SQL Server Browser Properties window that opens, select the Service tab.
- In the Start Mode field, select Automatic.
- Select the Log On tab and click the Start button.
Automatic startup of the SQL Server Browser service is enabled.
- Enable and configure the TCP/IP protocol by doing the following:
- In the left pane, expand the SQL Server Network Configuration section and select the Protocols for <SQL Server name> subsection.
- Right-click the TCP/IP protocol and select Enable from the context menu.
- In the Warning window that opens, click OK.
- Open the TCP/IP protocol properties in one of the following ways:
- Double-click the TCP/IP protocol.
- Right-click the TCP/IP protocol and select Properties from the context menu.
- Select the IP Addresses tab, and then in the IPALL section, specify port 1433 in the TCP Port field.
- Click Apply to save the changes.
- Click OK to close the window.
- Restart the SQL Server (<SQL Server name>) service by doing the following:
- In the left pane, select SQL Server Services.
- In the service list on the right, right-click the SQL Server (<SQL Server name>) service and select Restart from the context menu.
- In Windows Defender Firewall with Advanced Security, allow inbound connections on the server on the TCP port 1433.
Creating a secret in KUMA
After creating and configuring an account in MS SQL, you must add a secret in the KUMA console. This resource is used to store credentials for connecting to MS SQL.
To create a KUMA secret:
- In the KUMA console, open the Resources → Secrets section.
The list of available secrets will be displayed.
- Click the Add secret button to create a new secret.
The secret window is displayed.
- Enter information about the secret:
- In the Name field, choose a name for the added secret.
- In the Tenant drop-down list, select the tenant that will own the created resource.
- In the Type drop-down list, select urls.
- In the URL field, specify a string of the form:
sqlserver://[<domain>%5C]<username>:<password>@<server>:1433/<database_name>where:
domainis a domain name.%5Cis the domain/user separator. Represents the "\" character in URL format.usernameis the name of the created MS SQL account.passwordis the password of the created MS SQL account.serveris the name or IP address of the server where the MS SQL database for Kaspersky Security Center is installed.database_nameis the name of the Kaspersky Security Center database. The default name is KAV.
Example:
sqlserver://test.local%5Cuser:password123@10.0.0.1:1433/KAVIf the MS SQL database account password contains special characters (@ # $ % & * ! + = [ ] : ' , ? / \ ` ( ) ;), convert them to URL format.
- Click Save.
For security reasons, the string specified in the URL field is hidden after the secret is saved.
Configuring a connector
To connect KUMA to an MS SQL database, you must configure the connector.
To configure a connector:
- In the KUMA console, go to the Resources → Connectors section.
- In the list of connectors, find the [OOTB] KSC SQL connector and open it for editing.
If a connector is not available for editing, copy it and open the connector copy for editing.
If the [OOTB] KSC SQL connector is not available, contact your system administrator.
- On the Basic settings tab, in the URL drop-down lists, select the secret created for connecting to the MS SQL database.
- Click Save.
Configuring the KUMA Collector for receiving Kaspersky Security Center events from an MS SQL database
After configuring the event export settings, you must create a collector in the KUMA console for Kaspersky Security Center events received from MS SQL.
For details on creating a KUMA collector, refer to Creating a collector.
When creating the collector in the KUMA console, at the Transport step, select the [OOTB] KSC SQL connector.
To receive Kaspersky Security Center events from MS SQL, at the Event parsing step, select the [OOTB] KSC from SQL normalizer.
Page topInstalling the KUMA Collector for receiving Kaspersky Security Center events from the MS SQL database
After configuring the collector for receiving Kaspersky Security Center events from MS SQL, install the KUMA collector on the network infrastructure server where you intend to receive events.
For details on installing the KUMA collector, refer to the Installing collector in the network infrastructure section.
Page topConfiguring receipt of events from Windows devices using KUMA Agent (WEC)
KUMA allows you to receive information about events from Windows devices using the WEC KUMA Agent.
Configuring event receiving consists of the following steps:
- Configuring policies for receiving events from Windows devices.
- Configuring centralized receipt of events using the Windows Event Collector service.
- Granting permissions to view events.
- Granting permissions to log on as a service.
- Configuring the KUMA Collector.
- Installing KUMA collector.
- Forwarding events from Windows devices to KUMA.
Configuring audit of events from Windows devices
You can configure event audit on Windows devices for an individual device or for all devices in a domain.
This section describes how to configure an audit on an individual device and how to use a domain group policy to configure an audit.
Configuring an audit policy on a Windows device
To configure audit policies on a device:
- Open the Run window by pressing the key combination Win+R.
- In the opened window, type
secpol.mscand click OK.The Local security policy window opens.
- Select Security Settings → Local policies → Audit policy.
- In the pane on the right, double-click to open the properties of the policy for which you want to enable an audit of successful and unsuccessful attempts.
- In the <Policy name> properties window, on the Local security setting tab, select the Success and Failure check boxes to track successful and interrupted attempts.
It is recommended to enable an audit of successful and unsuccessful attempts for the following policies:
- Audit Logon
- Audit Policy Change
- Audit System Events
- Audit Logon Events
- Audit Account Management
Configuration of an audit policy on the device is complete.
Page topConfiguring an audit using a group policy
In addition to configuring an audit policy on an individual device, you can also configure an audit by using a domain group policy.
To configure an audit using a group policy:
- Open the Run window by pressing the key combination Win+R.
- In the opened window, type
gpedit.mscand click OK.The Local Group Policy Editor window opens.
- Select Computer configuration → Windows configuration → Security settings → Local policies → Audit policy.
- In the pane on the right, double-click to open the properties of the policy for which you want to enable an audit of successful and unsuccessful attempts.
- In the <Policy name> properties window, on the Local security setting tab, select the Success and Failure check boxes to track successful and interrupted attempts.
It is recommended to enable an audit of successful and unsuccessful attempts for the following policies:
- Audit Logon
- Audit Policy Change
- Audit System Events
- Audit Logon Events
- Audit Account Management
If you want to receive Windows logs from a large number of servers or if installation of KUMA agents on domain controllers is not allowed, it is recommended to configure Windows log redirection to individual servers that have the Windows Event Collector service configured.
The audit policy is now configured on the server or workstation.
Page topConfiguring centralized receipt of events from Windows devices using the Windows Event Collector service
The Windows Event Collector service allows you to centrally receive data about events on servers and workstations running Windows. You can use the Windows Event Collector service to subscribe to events that are registered on remote devices.
You can configure the following types of event subscriptions:
- Source-initiated subscriptions. Remote devices send event data to the Windows Event Collector server whose address is specified in the group policy. For details on the subscription configuration procedure, please refer to the Configuring data transfer from the event source server section.
- Collector-initiated subscriptions. The Windows Event Collector server connects to remote devices and independently gathers events from local logs. For details on the subscription configuration procedure, please refer to the Configuring the Windows Event Collector service section.
Configuring data transfer from the event source server
You can receive information about events on servers and workstations by configuring data transfer from remote devices to the Windows Event Collector server.
Preliminary steps
- Verify that the Windows Remote Management service is configured on the event source server by running the following command in the PowerShell console:
winrm get winrm/configIf the Windows Remote Management service is not configured, initialize it by running the following command:
winrm quickconfig - If the event source server is a domain controller, make the Windows logs available over the network by running the following command in PowerShell as an administrator:
wevtutil set-log security /ca:’O:BAG:SYD:(A;;0xf0005;;;SY)(A;;0x5;;;BA)(A;;0x1;;;S-1-5-32-573)(A;;0x1;;;S-1-5-20)Verify access by running the following command:
wevtutil get-log security
Configuring the firewall on the event source server
To enable the Windows Event Collector server to receive Windows log entries, inbound connection ports must be opened on the event source server.
To open ports for inbound connections:
- On the event source server, open the Run window by pressing the key combination Win+R.
- In the opened window, type
wf.mscand click OK.The Windows Defender Firewall with Advanced Security window opens.
- Go to the Inbound Rules section and click New Rule in the Actions pane.
The New Inbound Rule Wizard opens.
- At the Rule type step, select Port.
- At the Protocols and ports step, select TCP as the protocol. In the Specific local ports field, indicate the relevant port numbers:
5985(for HTTP access)5986(for HTTPS access)
You can indicate one of the ports, or both.
- At the Action step, select Allow connection (selected by default).
- At the Profile step, clear the Private and Public check boxes.
- At the Name step, specify a name for the new inbound connection rule and click Done.
Configuration of data transfer from the event source server is complete.
The Windows Event Collector server must have the permissions to read Windows logs on the event source server. These permissions can be assigned to both the Windows Event Collector server account and to a special user account. For details on granting permissions, please refer to the Granting user permissions to view the Windows Event Log.
Page topConfiguring the Windows Event Collector service
The Windows Event Collector server can independently connect to devices and gather data on events of any severity.
To configure the receipt of event data by the Windows Event Collector server:
- On the event source server, open the Run window by pressing Win+R.
- In the opened window, type
services.mscand click OK.The Services window opens.
- In the list of services, find and start the Windows Event Collector service.
- Open the Event Viewer snap-in by doing the following:
- Open the Run window by pressing the key combination Win+R.
- In the opened window, type
eventvwrand click OK.
- Go to the Subscriptions section and click Create Subscription in the Actions pane.
- In the opened Subscription Properties window, specify the name and description of the subscription, and define the following settings:
- In the Destination log field, select Forwarded events from the list.
- In the Subscription type and source computers section, click the Select computers button.
- In the opened Computers window, click the Add domain computer button.
The Select computer window opens.
- In the Enter the object names to select (examples) field, list the names of the devices from which you want to receive event information. Click OK.
- In the Computers window, check the list of devices from which the Windows Event Collector server will gather event data and click OK.
- In the Subscription properties window, in the Collected events field, click the Select events button.
- In the opened Request filter window, specify how often and which data about events on devices you want to receive.
- If necessary, in the <All event codes> field, list the codes of the events whose information you want to receive or do not want to receive. Click OK.
- If you want to use a special account to view event data, do the following:
- In the Subscription properties window, click the Advanced button.
- In the opened Advanced subscription settings window, in the user account settings, select Specific user.
- Click the User and password button and enter the account credentials of the selected user.
Configuration of the Event Collector Service is complete.
To verify that the configuration is correct and event data is being received by the Windows Event Collector server:
In the Event Viewer snap-in, go to Event Viewer (Local) → Windows logs → Forwarded events.
Page topGranting permissions to view Windows events
You can grant permissions to view Windows events for a specific device or for all devices in a domain.
To grant permissions to view events on a specific device:
- Open the Run window by pressing the key combination Win+R.
- In the opened window, type
compmgmt.mscand click OK.The Computer Management window opens.
- Go to Computer Management (local) → Local users and groups → Groups.
- In the pane on the right, select the Event Log Readers group and double-click to open the policy properties.
- Click the Add button at the bottom of the Properties: Event Log Readers window.
The Select Users, Computers or Groups window opens.
- In the Enter the object names to select (examples) field, list the names of the users or devices to which you want to grant permissions to view event data. Click OK.
To grant permissions to view events for all devices in a domain:
- Log in to the domain controller with administrator privileges.
- Open the Run window by pressing the key combination Win+R.
- In the opened window, type
dsa.mscand click OK.The Active Directory Users and Computers window opens.
- Go to Active Directory Users and Computers → <Domain name> → Builtin.
- In the pane on the right, select the Event Log Readers group and double-click to open the policy properties.
In the Properties: Event Log Readers window, open the Members tab and click the Add button.
The Select Users, Computers or Groups window opens.
- In the Enter the object names to select (examples) field, list the names of the users or devices to which you want to grant permissions to view event data. Click OK.
Granting permissions to log on as a service
You can grant permission to log on as a service to a specific device or to all devices in a domain. The "Log on as a service" permission allows you to start a process using an account that has been granted this permission.
To grant the "Log on as a service" permission to a device:
- Open the Run window by pressing the key combination Win+R.
- In the opened window, type
secpol.mscand click OK.The Local security policy window opens.
- Go to Security settings → Local policies → User rights assignment.
- In the pane on the right, double-click to open the properties of the Log on as a service policy.
- In the opened Properties: Log on as a Service window, click the Add User or Group button.
The Select Users or Groups window opens.
- In the Enter the object names to select (examples) field, list the names of the accounts or devices to which you want to grant the permission to log on as a service. Click OK.
Before granting the permission, make sure that the accounts or devices to which you want to grant the Log on as a service permission are not listed in the properties of the Deny log on as a service policy.
To grant the "Log on as a service" permission to devices in a domain:
- Open the Run window by pressing the key combination Win+R.
- In the opened window, type
gpedit.mscand click OK.The Local Group Policy Editor window opens.
- Select Computer configuration → Windows configuration → Security settings → Local policies → User rights assignment.
- In the pane on the right, double-click to open the properties of the Log on as a service policy.
- In the opened Properties: Log on as a Service window, click the Add User or Group button.
The Select Users or Groups window opens.
- In the Enter the object names to select (examples) field, list the names of the users or devices to which you want to grant the permission to log on as a service. Click OK.
Before granting the permission, make sure that the accounts or devices to which you want to grant the Log on as a service permission are not listed in the properties of the Deny log on as a service policy.
Page topConfiguring the KUMA Collector for receiving events from Windows devices
After you finish configuring the audit policy on devices, creating subscriptions to events and granting all the necessary permissions, you need to create a collector in the KUMA console for events from Windows devices.
For details on creating a KUMA collector, refer to Creating a collector.
To receive events from Windows devices, define the following collector settings in the KUMA Collector Installation Wizard:
- At the Transport step, define the following settings:
- In the Connector window, select Create.
- In the Type field, select http.
- In the Delimiter field, select \0.
- On the Advanced settings tab, in the TLS mode field, select With verification.
- At the Event parsing step, click the Add event parsing button.
- In the opened Basic event parsing window, in the Normalizer field, select [OOTB] Windows Extended v.1.0 and click OK.
- At the Routing step, add the following destinations:
- Storage. To send processed events to the storage.
- Correlator. To send processed events to the correlator.
If the Storage and Correlator destinations were not added, create them.
- At the Setup validation tab, click Create and save service.
- Copy the command for installing the KUMA collector that appears.
Installing the KUMA Collector for receiving events from Windows devices
After configuring the collector for receiving Windows events, install the KUMA Collector on the server of the network infrastructure intended for receiving events.
For details on installing the KUMA collector, refer to the Installing collector in the network infrastructure section.
Page topConfiguring forwarding of events from Windows devices to KUMA using KUMA Agent (WEC)
To complete the data forwarding configuration, you must create a WEC KUMA agent and then install it on the device from which you want to receive event information.
For more details on creating and installing a WEC KUMA Agent on Windows devices, please refer to the Forwarding events from Windows devices to KUMA section.
Page topConfiguring receipt of events from Windows devices using KUMA Agent (WMI)
KUMA allows you to receive information about events from Windows devices using the WMI KUMA Agent.
Configuring event receiving consists of the following steps:
- Configuring audit settings for managing KUMA.
- Configuring data transfer from the event source server.
- Granting permissions to view events.
- Granting permissions to log on as a service.
- Creating a KUMA collector.
To receive events from Windows devices, in the KUMA Collector Installation Wizard, at the Event parsing step, in the Normalizer field, select [OOTB] Windows Extended v.1.0.
- Installing KUMA collector.
- Forwarding events from Windows devices to KUMA.
To complete the data forwarding configuration, you must create a WMI KUMA agent and then install it on the device from which you want to receive event information.
Configuring audit settings for managing KUMA
You can configure event audit on Windows devices both on a specific device using a local policy or on all devices in a domain using a group policy.
This section describes how to configure an audit on an individual device and how to use a domain group policy to configure an audit.
Configuring an audit using a local policy
To configure an audit using a local policy:
- Open the Run window by pressing the key combination Win+R.
- In the opened window, type
secpol.mscand click OK.The Local security policy window opens.
- Select Security Settings → Local policies → Audit policy.
- In the pane on the right, double-click to open the properties of the policy for which you want to enable an audit of successful and unsuccessful attempts.
- In the <Policy name> properties window, on the Local security setting tab, select the Success and Failure check boxes to track successful and interrupted attempts.
It is recommended to enable an audit of successful and unsuccessful attempts for the following policies:
- Audit Logon
- Audit Policy Change
- Audit System Events
- Audit Logon Events
- Audit Account Management
Configuration of an audit policy on the device is complete.
Page topConfiguring an audit using a group policy
In addition to configuring an audit on an individual device, you can also configure an audit by using a domain group policy.
To configure an audit using a group policy:
- Open the Run window by pressing the key combination Win+R.
- In the opened window, type
gpedit.mscand click OK.The Local Group Policy Editor window opens.
- Select Computer configuration → Windows configuration → Security settings → Local policies → Audit policy.
- In the pane on the right, double-click to open the properties of the policy for which you want to enable an audit of successful and unsuccessful attempts.
- In the <Policy name> properties window, on the Local security setting tab, select the Success and Failure check boxes to track successful and interrupted attempts.
It is recommended to enable an audit of successful and unsuccessful attempts for the following policies:
- Audit Logon
- Audit Policy Change
- Audit System Events
- Audit Logon Events
- Audit Account Management
The audit policy is now configured on the server or workstation.
Page topConfiguring data transfer from the event source server
Preliminary steps
- On the event source server, open the Run window by pressing the key combination Win+R.
- In the opened window, type
services.mscand click OK.The Services window opens.
- In the list of services, find the following services:
- Remote Procedure Call
- RPC Endpoint Mapper
- Check the Status column to confirm that these services have the Running status.
Configuring the firewall on the event source server
The Windows Management Instrumentation server can receive Windows log entries if ports are open for inbound connections on the event source server.
To open ports for inbound connections:
- On the event source server, open the Run window by pressing the key combination Win+R.
- In the opened window, type
wf.mscand click OK.The Windows Defender Firewall with Advanced Security window opens.
- In the Windows Defender Firewall with Advanced Security window, go to the Inbound Rules section and in the Actions pane, click New Rule.
This opens the New Inbound Rule Wizard.
- In the New Inbound Rule Wizard, at the Rule Type step, select Port.
- At the Protocols and ports step, select TCP as the protocol. In the Specific local ports field, indicate the relevant port numbers:
13544549152–65535
- At the Action step, select Allow connection (selected by default).
- At the Profile step, clear the Private and Public check boxes.
- At the Name step, specify a name for the new inbound connection rule and click Done.
Configuration of data transfer from the event source server is complete.
Page topGranting permissions to view Windows events
You can grant permissions to view Windows events for a specific device or for all devices in a domain.
To grant permissions to view events on a specific device:
- Open the Run window by pressing the key combination Win+R.
- In the opened window, type
compmgmt.mscand click OK.The Computer Management window opens.
- Go to Computer Management (local) → Local users and groups → Groups.
- In the pane on the right, select the Event Log Readers group and double-click to open the policy properties.
- Click the Add button at the bottom of the Properties: Event Log Readers window.
The Select Users, Computers or Groups window opens.
- In the Enter the object names to select (examples) field, list the names of the users or devices to which you want to grant permissions to view event data. Click OK.
To grant permissions to view events for all devices in a domain:
- Log in to the domain controller with administrator privileges.
- Open the Run window by pressing the key combination Win+R.
- In the opened window, type
dsa.mscand click OK.The Active Directory Users and Computers window opens.
- In the Active Directory Users and Computers window, go to the Active Directory Users and Computers section → <Domain name> → Builtin.
- In the pane on the right, select the Event Log Readers group and double-click to open the policy properties.
In the Properties: Event Log Readers window, open the Members tab and click the Add button.
The Select Users, Computers or Groups window opens.
- In the Select User, Computer, or Group window, In the Enter the object name to select (examples) field, list the names of the users or devices to which you want to grant permissions to view event data. Click OK.
Granting permissions to log on as a service
You can grant permission to log on as a service to a specific device or to all devices in a domain. The "Log on as a service" permission allows you to start a process using an account that has been granted this permission.
Before granting the permission, make sure that the accounts or devices to which you want to grant the Log on as a service permission are not listed in the properties of the Deny log on as a service policy.
To grant the "Log on as a service" permission to a device:
- Open the Run window by pressing the key combination Win+R.
- In the opened window, type
secpol.mscand click OK.The Local security policy window opens.
- In the Local Security Policy window, go to the Security Settings → Local Policies → User Rights Assignment section.
- In the pane on the right, double-click to open the properties of the Log on as a service policy.
- This opens the Properties: Log on as a Service window; in that window, click Add User or Group.
This opens the Select Users or Groups window.
- In the Enter the object names to select (examples) field, list the names of the accounts or devices to which you want to grant the permission to log on as a service. Click OK.
To grant the "Log on as a service" permission to devices in a domain:
- Open the Run window by pressing the key combination Win+R.
- In the opened window, type
gpedit.mscand click OK.The Local Group Policy Editor window opens.
- Select Computer configuration → Windows configuration → Security settings → Local policies → User rights assignment.
- In the pane on the right, double-click to open the properties of the Log on as a service policy.
- This opens the Properties: Log on as a Service window; in that window, click Add User or Group.
This opens the Select Users or Groups window.
- In the Enter the object names to select (examples) field, list the names of the users or devices to which you want to grant the permission to log on as a service. Click OK.
Configuring receipt of PostgreSQL events
KUMA lets you monitor and audit PostgreSQL events on Linux devices using rsyslog.
Events are audited using the pgAudit plugin. The plugin supports PostgreSQL 9.5 and later. For details about the pgAudit plugin, see https://github.com/pgaudit/pgaudit.
Configuring event receiving consists of the following steps:
- Installing the pdAudit plugin.
- Creating a KUMA collector for PostgreSQL events.
To receive PostgreSQL events using rsyslog, in the collector installation wizard, at the Event parsing step, select the [OOTB] PostgreSQL pgAudit syslog normalizer.
- Installing a collector in the KUMA network infrastructure.
- Configuring the event source server.
- Verifying receipt of PostgreSQL events in the KUMA collector
You can verify that the PostgreSQL event source server is correctly configured in the Searching for related events section of the KUMA console.
Installing the pgAudit plugin
To install the pgAudit plugin:
- On the OS command line, run the following commands as a user with administrator rights:
sudo apt updatesudo apt -y install postgresql-<PostgreSQL version>-pgauditYou must select the plugin version to match the PostgresSQL version. For information about PostgreSQL versions and the matching plugin versions, see https://github.com/pgaudit/pgaudit#postgresql-version-compatibility.
Example:
sudo apt -y install postgresql-12-pgaudit - Find the postgres.conf configuration file. To do so, run the following command on the PostgreSQL command line:
show data_directoryThe response will indicate the location of the configuration file.
- Create a backup copy of the postgres.conf configuration file.
- Open the postgres.conf file and copy or replace the values in it with the values listed below.
```## pgAudit settingsshared_preload_libraries = 'pgaudit'## database logging settingslog_destination = 'syslog'## syslog facilitysyslog_facility = 'LOCAL0'## event identsyslog_ident = 'Postgres'## sequence numbers in syslogsyslog_sequence_numbers = on## split messages in syslogsyslog_split_messages = off## message encodinglc_messages = 'en_US.UTF-8'## min message level for loggingclient_min_messages = log## min error message level for logginglog_min_error_statement = info## log checkpoints (buffers, restarts)log_checkpoints = off## log query durationlog_duration = off## error description levellog_error_verbosity = default## user connections logginglog_connections = on## user disconnections logginglog_disconnections = on## log prefix formatlog_line_prefix = '%m|%a|%d|%p|%r|%i|%u| %e '## log_statementlog_statement = 'none'## hostname logging status. dns bane resolving affect#performance!log_hostname = off## logging collector buffer status#logging_collector = off## pg audit settingspgaudit.log_parameter = onpgaudit.log='ROLE, DDL, MISC, FUNCTION'``` - Restart the PostgreSQL service using the command:
sudo systemctl restart postgresql - To load the pgAudit plugin to PostgreSQL, run the following command on the PostgreSQL command line:
CREATE EXTENSION pgaudit
The pgAudit plugin is installed.
Page topConfiguring a Syslog server to send events
The rsyslog service is used to transmit events from the server to KUMA.
To configure the sending of events from the server where PostgreSQL is installed to the collector:
- To verify that the rsyslog service is installed on the event source server, run the following command as administrator:
sudo systemctl status rsyslog.serviceIf the rsyslog service is not installed on the server, install it by executing the following commands:
yum install rsyslogsudo systemctl enable rsyslog.servicesudo systemctl start rsyslog.service - In the /etc/rsyslog.d/ directory, create a pgsql-to-siem.conf file with the following content:
If $programname contains 'Postgres' then @<IP address of the collector>:<port of the collector>For example:If $programname contains 'Postgres' then @192.168.1.5:1514If you want to send events via TCP, the contents of the file must be as follows:
If $programname contains 'Postgres' then @@192.168.1.5:2514Save changes to the pgsql-to-siem.conf configuration file.
- Add the following lines to the /etc/rsyslog.conf configuration file:
$IncludeConfig /etc/pgsql-to-siem.conf$RepeatedMsgReduction offSave changes to the /etc/rsyslog.conf configuration file.
- Restart the rsyslog service by executing the following command:
sudo systemctl restart rsyslog.service
Configuring receipt of IVK Kolchuga-K events
You can configure the receipt of events from the IVK Kolchuga-K system to the KUMA SIEM system.
Configuring event receiving consists of the following steps:
- Configuring the sending of IVK Kolchuga-K events to KUMA.
- Creating a KUMA collector for receiving events from the IVK Kolchuga-K system.
To receive IVK Kolchuga-K events using Syslog, in the Collector Installation Wizard, at the Event parsing step, select the [OOTB] Kolchuga-K syslog normalizer.
- Installing a KUMA collector for receiving IVK Kolchuga-K events.
- Verifying receipt of IVK Kolchuga-K events in KUMA.
You can verify that the IVK Kolchuga-K event source is configured correctly in the Searching for related events section of the KUMA console.
Configuring export of IVK Kolchuga-K events to KUMA
To configure the export of events of the IVK Kolchuga-K firewall via syslog to the KUMA collector:
- Connect to the firewall over SSH with administrator rights.
- Create a backup copy of the /etc/services and /etc/syslog.conf files.
- In the /etc/syslog.conf configuration file, specify the FQDN or IP address of the KUMA collector. For example:
*.* @kuma.example.com
or
*.* @192.168.0.100
Save changes to the configuration file /etc/syslog.conf.
- In the /etc/services configuration file, specify the port and protocol used by the KUMA collector. For example:
syslog 10514/udp
Save changes to the /etc/services configuration file.
- Restart the syslog server of the firewall:
service syslogd restart
Configuring receipt of CryptoPro NGate events
You can configure the receipt of CryptoPro NGate events in the KUMA SIEM system.
Configuring event receiving consists of the following steps:
- Configuring export of CryptoPro NGate events to KUMA.
- Creating a KUMA collector for receiving CryptoPro NGate events.
To receive CryptoPro NGate events using Syslog, in the collector installation wizard, at the Event parsing step, select the [OOTB] NGate syslog normalizer.
- Creating a KUMA collector for receiving CryptoPro NGate events.
- Verifying receipt of CryptoPro NGate events in the KUMA collector.
You can verify that the CryptoPro NGate event source server is correctly configured in the Searching for related events section of the KUMA console.
Configuring export of CryptoPro NGate events to KUMA
To configure the sending of events from CryptoPro NGate to KUMA:
- Connect to the web interface of the NGate management system.
- Connect remote syslog servers to the management system. To do so:
- Open the page with the list of syslog servers: External Services → Syslog Server → Add Syslog Server.
- Enter the settings of the syslog server and click
 .
.
- Assign syslog servers to the configuration for recording logs of the cluster. To do so:
- In the Clusters → Summary section, select the cluster that you want to configure.
- On the Configurations tab, click the Configuration control for the relevant cluster to go to the configuration settings page.
- In the Syslog Servers field of the configuration being configured, click Assign.
- Select the check boxes for syslog servers that you want to assign and click .
You can assign an unlimited number of servers.
To add new syslog servers, click
 .
. - Publish the configuration to activate the new settings.
- Assign syslog servers to the management system for recording Administrator activity logs. To do so:
- Select the Management Center Settings menu item and on the page that is displayed, under Syslog servers, click Assign.
- In the Assign Syslog Servers to Management Center window, select the check box for those syslog servers that you want to assign, then click
 .
.You can assign an unlimited number of servers.
As a result, events of CryptoPro NGate are sent to KUMA.
Page topConfiguring receipt of Ideco UTM events
You can configure the receipt of Ideco UTM application events in KUMA via the Syslog protocol.
Configuring event receiving consists of the following steps:
- Configuring export of Ideco UTM events to KUMA.
- Creating a KUMA collector for receiving Ideco UTM.
To receive Ideco UTM events, in the Collector Installation Wizard, at the Event parsing step, select the "[OOTB] Ideco UTM syslog" normalizer.
- Creating a KUMA collector for receiving Ideco UTM events.
- Verifying receipt of Ideco UTM events in KUMA.
You can verify that the Ideco UTM event source server is correctly configured in the Searching for related events section of the KUMA console.
Configuring export of Ideco UTM events to KUMA
To configure the sending of events from Ideco UTM to KUMA:
- Connect to the Ideco UTM web interface under a user account that has administrative privileges.
- In the System message forwarding menu, move the Syslog toggle switch to the enabled position.
- For the IP address setting, specify the IP address of the KUMA collector.
- For the Port setting, enter the port that the KUMA collector is listening on.
- Click Save to apply the changes.
The forwarding of Ideco UTM events to KUMA is configured.
Page topConfiguring receipt of KWTS events
You can configure the receipt of events from the Kaspersky Web Traffic Security (KWTS) web traffic analysis and filtering system in KUMA.
Configuring event receiving consists of the following steps:
- Configuring export of KWTS events to KUMA.
- Creating a KUMA collector for receiving KWTS events.
To receive KWTS events, in the Collector Installation Wizard, at the Event parsing step, select the [OOTB] KWTS normalizer.
- Installing a KUMA collector for receiving KWTS events.
- Verifying receipt of KWTS events in the KUMA collector.
You can verify that KWTS event export is correctly configured in the Searching for related events section of the KUMA console.
Configuring export of KWTS events to KUMA
To configure the export of KWTS events to KUMA:
- Connect to the KWTS server over SSH as root.
- Before making changes, create backup copies of the following files:
- /opt/kaspersky/kwts/share/templates/core_settings/event_logger.json.template
- /etc/rsyslog.conf
- Make sure that the settings in the /opt/kaspersky/kwts/share/templates/core_settings/event_logger.json.template configuration file have the following values, and make changes if necessary:
"siemSettings":{"enabled": true,"facility": "Local5","logLevel": "Info","formatting":{ - Save your changes.
- To send events via UDP, make the following changes to the /etc/rsyslog.conf configuration file:
$WorkDirectory /var/lib/rsyslog$ActionQueueFileName ForwardToSIEM$ActionQueueMaxDiskSpace 1g$ActionQueueSaveOnShutdown on$ActionQueueType LinkedList$ActionResumeRetryCount -1local5.* @<<IP address of the KUMA collector>:<port of the collector>>If you want to send events over TCP, the last line should be as follows:
local5.* @@<<IP address of the KUMA collector>:<port of the collector>> - Save your changes.
- Restart the rsyslog service with the following command:
sudo systemctl restart rsyslog.service - Go to the KWTS web interface, to the Settings – Syslog tab and enable the Log information about traffic profile option.
- Click Save.
Configuring receipt of KLMS events
You can configure the receipt of events from the Kaspersky Linux Mail Server (KLMS) mail traffic analysis and filtering system to the KUMA SIEM system.
Configuring event receiving consists of the following steps:
- Configuring export of KLMS events to KUMA
- Creating a KUMA collector for receiving KLMS events
To receive KLMS events, in the Collector Installation Wizard, at the Event parsing step, select the [OOTB] KLMS syslog CEF normalizer.
- Installing a KUMA collector for receiving KLMS events.
- Verifying receipt of KLMS events in the KUMA collector
You can verify that the KLMS event source server is correctly configured in the Searching for related events section of the KUMA console.
Configuring export of KLMS events to KUMA
To configure the export of KLMS events to KUMA:
- Connect to the KLMS server over SSH and go to the Technical Support Mode menu.
- Use the klms-control utility to download the settings to the settings.xml file:
sudo /opt/kaspersky/klms/bin/klms-control --get-settings EventLogger -n -f /tmp/settings.xml - Make sure that the settings in the /tmp/settings.xml file have the following values; make changes if necessary:
<siemSettings><enabled>1</enabled><facility>Local1</facility>...</siemSettings> - Apply settings with the following command:
sudo /opt/kaspersky/klms/bin/klms-control --set-settings EventLogger -n -f /tmp/settings.xml - To send events via UDP, make the following changes to the /etc/rsyslog.conf configuration file:
$WorkDirectory /var/lib/rsyslog$ActionQueueFileName ForwardToSIEM$ActionQueueMaxDiskSpace 1g$ActionQueueSaveOnShutdown on$ActionQueueType LinkedList$ActionResumeRetryCount -1local1.* @<<IP address of the KUMA collector>:<port of the collector>>If you want to send events over TCP, the last line should be as follows:
local1.* @@<<IP address of the KUMA collector>:<port of the collector>> - Save your changes.
- Restart the rsyslog service with the following command:
sudo systemctl restart rsyslog.service
Configuring receipt of KSMG events
You can configure the receipt of events from the Kaspersky Secure Mail Gateway (KSMG) 1.1 mail traffic analysis and filtering system in the KUMA SIEM system.
Configuring event receiving consists of the following steps:
- Configuring export of KSMG events to KUMA
- Creating a KUMA collector for receiving KSMG events
To receive KSMG events, in the Collector Installation Wizard, at the Event parsing step, select the [OOTB] KSMG normalizer.
- Installing a KUMA collector for receiving KSMG events.
- Verifying receipt of KSMG events in the KUMA collector
You can verify that the KSMG event source server is correctly configured in the Searching for related events section of the KUMA console.
Configuring export of KSMG events to KUMA
To configure the export of KSMG events to KUMA:
- Connect to the KSMG server via SSH using an account with administrator rights.
- Use the ksmg-control utility to download the settings to the settings.xml file:
sudo /opt/kaspersky/ksmg/bin/ksmg-control --get-settings EventLogger -n -f /tmp/settings.xml - Make sure that the settings in the /tmp/settings.xml file have the following values; make changes if necessary:
<siemSettings><enabled>1</enabled><facility>Local1</facility> - Apply settings with the following command:
sudo /opt/kaspersky/ksmg/bin/ksmg-control --set-settings EventLogger -n -f /tmp/settings.xml - To send events via UDP, make the following changes to the /etc/rsyslog.conf configuration file:
$WorkDirectory /var/lib/rsyslog$ActionQueueFileName ForwardToSIEM$ActionQueueMaxDiskSpace 1g$ActionQueueSaveOnShutdown on$ActionQueueType LinkedList$ActionResumeRetryCount -1local1.* @<<IP address of the KUMA collector>:<port of the collector>>If you want to send events over TCP, the last line should be as follows:
local1.* @@<<IP address of the KUMA collector>:<port of the collector>> - Save your changes.
- Restart the rsyslog service with the following command:
sudo systemctl restart rsyslog.service
Configuring receipt of PT NAD events
You can configure the receipt of PT NAD events in the KUMA SIEM system.
Configuring event receiving consists of the following steps:
- Configuring export of PT NAD events to KUMA.
- Creating a KUMA collector for receiving PT NAD events.
To receive PT NAD events using Syslog, in the Collector Installation Wizard, at the Event parsing step, select the [OOTB] PT NAD json normalizer.
- Installing a KUMA collector for receiving PT NAD events.
- Verifying receipt of PT NAD events in the KUMA collector.
You can verify that the PT NAD event source server is correctly configured in the Searching for related events section of the KUMA console.
Configuring export of PT NAD events to KUMA
Configuring the export of events from PT NAD 11 to KUMA over Syslog involves the following steps:
- Configuring the ptdpi-worker@notifier module.
- Configuring the sending of syslog messages with information about activities, attacks and indicators of compromise.
Configuring the ptdpi-worker@notifier module.
To enable the sending of information about detected information security threats, you must configure the ptdpi-worker@notifier module.
In a multi-server configuration, these instructions must be followed on the primary server.
To configure the ptdpi-worker@notifier module:
- Open the /opt/ptsecurity/etc/ptdpi.settings.yaml file:
sudo nano /opt/ptsecurity/etc/ptdpi.settings.yaml - In the General settings group of settings, uncomment the 'workers' setting and add 'notifier' to its list of values.
For example:
workers: ad alert dns es hosts notifier - To the end of the file, append a line of the form: notifier.yaml.nad_web_url: <URL of the PT NAD console>
For example:
notifier.yaml.nad_web_url: https://ptnad.example.comThe ptdpi-worker@notifier module uses the specified URL to generate links to session and activity cards when sending messages.
- Restart the sensor:
sudo ptdpictl restart-all
The ptdpi-worker@notifier module is configured.
Configuring the sending of syslog messages with information about activities, attacks and indicators of compromise
The settings listed in the following instructions may not be present in the configuration file. If a setting is missing, you must add it to the file.
In a multi-server PT NAD configuration, edit the settings on the primary server.
To configure the sending of syslog messages with information about activities, attacks and indicators of compromise:
- Open the /opt/ptsecurity/etc/ptdpi.settings.yaml file:
sudo nano /opt/ptsecurity/etc/ptdpi.settings.yaml - By default, PT NAD sends activity information in Russian. To receive information in English, change the value of the notifier.yaml.syslog_notifier.locale setting to "en".
For example:
notifier.yaml.syslog_notifier.locale: en - In the notifier.yaml.syslog_notifier.addresses setting, add a section with settings for sending events to KUMA.
The <Connection name> setting can only contain Latin letters, numerals, and the underscore character.
For the 'address' setting, specify the IP address of the KUMA collector.
Other settings can be omitted, in which case the default values are used.
notifier.yaml.syslog_notifier.addresses:<Connection name>:address: <For sending to a remote server, specify protocol: UDP (default) or TCP, address and port; for local connection, specify Unix domain socket>doc_types: [<Comma-separated message types ('alert' for information about attacks, 'detection' for activities, and 'reputation' for information about indicators of compromise). By default, all types of messages are sent>]facility: <Numeric value of the subject category>ident: <software tag><Connection name>:...The following is a sample configuration of sending syslog messages with information about activities, attacks, and indicators of compromise to two remote servers via TCP and UDP without writing to the local log:
notifier.yaml.syslog_notifier.addresses:remote1:address: tcp://198.51.100.1:1514remote2:address: udp://198.51.100.2:2514 - Save your changes in the /opt/ptsecurity/etc/ptdpi.settings.yaml.
- Restart the ptdpi-worker@notifier module:
sudo ptdpictl restart-worker notifier
The sending of events to KUMA via Syslog is configured.
Page topConfiguring receipt of events using the MariaDB Audit Plugin
KUMA allows auditing events using the MariaDB Audit Plugin. The plugin supports MySQL 5.7 and MariaDB. The audit plugin does not support MySQL 8. Detailed information about the plugin is available on the official MariaDB website.
We recommend using MariaDB Audit Plugin version 1.2 or later.
Configuring event receiving consists of the following steps:
- Configuring the MariaDB Audit Plugin to send MySQL events and configuring the Syslog server to send events.
- Configuring the MariaDB Audit Plugin to send MariaDB events and configuring the Syslog server to send events.
- Creating a KUMA Collector for MySQL 5.7 and MariaDB Events.
To receive MySQL 5.7 and MariaDB events using the MariaDB Audit Plugin, in the KUMA Collector Installation Wizard, at the Event parsing step, in the Normalizer field, select [OOTB] MariaDB Audit Plugin syslog.
- Installing a collector in the KUMA network infrastructure.
- Verifying receipt of MySQL and MariaDB events by the KUMA collector.
To verify that the MySQL and MariaDB event source server is configured correctly, you can search for related events.
Configuring the MariaDB Audit Plugin to send MySQL events
The MariaDB Audit Plugin is supported for MySQL 5.7 versions up to 5.7.30 and is bundled with MariaDB.
To configure MySQL 5.7 event reporting using the MariaDB Audit Plugin:
- Download the MariaDB distribution kit and extract it.
You can download the MariaDB distribution kit from the official MariaDB website. The operating system of the MariaDB distribution must be the same as the operating system on which MySQL 5.7 is running.
- Connect to MySQL 5.7 using an account with administrator rights by running the following command:
mysql -u<username>-p - To get the directory where the MySQL 5.7 plugins are located, on the MySQL 5.7 command line, run the following command:
SHOW GLOBAL VARIABLES LIKE 'plugin_dir' - In the directory obtained at step 3, copy the MariaDB Audit Plugin from
<directory to which the distribution kit was extracted>/mariadb-server-<version>/lib/plugins/server_audit.so. - On the operating system command line, run the following command:
chmod 755<directory to which the distribution kit was extracted>server_audit.soFor example:
chmod 755 /usr/lib64/mysql/plugin/server_audit.so - On the MySQL 5.7 command line, run the following command:
install plugin server_audit soname 'server_audit.so' - Create a backup copy of the /etc/mysql/mysql.conf.d/mysqld.cnf configuration file.
- In the configuration file /etc/mysql/mysql.conf.d/mysqld.cnf, in the
[mysqld]section, add the following lines:server_audit_logging=1server_audit_events=connect,table,query_ddl,query_dml,query_dclserver_audit_output_type=SYSLOGserver_audit_syslog_facility=LOG_SYSLOGIf you want to disable event export for certain audit event groups, remove some of the values from the
server_audit_eventssetting. Descriptions of settings are available on the MariaDB Audit Plugin vendor's website. - Save changes to the configuration file.
- Restart the MariaDB service by running one of the following commands:
systemctl restart mysqldfor a system with systemd initialization.service mysqld restartfor a system with init initialization.
MariaDB Audit Plugin for MySQL 5.7 is configured. If necessary, you can run the following commands on the MySQL 5.7 command line:
show pluginsto check the list of current plugins.SHOW GLOBAL VARIABLES LIKE 'server_audit%'to check the current audit settings.
Configuring the MariaDB Audit Plugin to send MariaDB Events
The MariaDB Audit Plugin is included in the MariaDB distribution kit starting with versions 5.5.37 and 10.0.10.
To configure MariaDB event export using the MariaDB Audit Plugin:
- Connect to MariaDB using an account with administrator rights by running the following command:
mysql -u<username>-p - To check if the plugin is present in the directory where operating system plugins are located, run the following command on the MariaDB command line:
SHOW GLOBAL VARIABLES LIKE 'plugin_dir' - On the operating system command line, run the following command:
ll<directory obtained by the previous command>| grep server_audit.soIf the command output is empty and the plugin is not present in the directory, you can either copy the MariaDB Audit Plugin to that directory or use a newer version of MariaDB.
- On the MariaDB command line, run the following command:
install plugin server_audit soname 'server_audit.so' - Create a backup copy of the /etc/mysql/my.cnf configuration file.
- In the /etc/mysql/my.cnf configuration file, in the
[mysqld]section, add the following lines:server_audit_logging=1server_audit_events=connect,table,query_ddl,query_dml,query_dclserver_audit_output_type=SYSLOGserver_audit_syslog_facility=LOG_SYSLOGIf you want to disable event export for certain audit event groups, remove some of the values from the
server_audit_eventssetting. Descriptions of settings are available on the MariaDB Audit Plugin vendor's website. - Save changes to the configuration file.
- Restart the MariaDB service by running one of the following commands:
systemctl restart mariadbfor a system with systemd initialization.service mariadb restartfor a system with init initialization.
MariaDB Audit Plugin for MariaDB is configured. If necessary, you can run the following commands on the MariaDB command line:
show pluginsto check the list of current plugins.SHOW GLOBAL VARIABLES LIKE 'server_audit%'to check the current audit settings.
Configuring a Syslog server to send events
The rsyslog service is used to transmit events from the server to the collector.
To configure the sending of events from the server where MySQL or MariaDB is installed to the collector:
- Before making any changes, create a backup copy of the /etc/rsyslog.conf configuration file.
- To send events via UDP, add the following line to the /etc/rsyslog.conf configuration file:
*.* @<IP address of the KUMA collector>:<port of the KUMA collector>For example:
*.* @192.168.1.5:1514If you want to send events over TCP, the line should be as follows:
*.* @@192.168.1.5:2514Save changes to the /etc/rsyslog.conf configuration file.
- Restart the rsyslog service by executing the following command:
sudo systemctl restart rsyslog.service
Configuring receipt of Apache Cassandra events
KUMA allows receiving information about Apache Cassandra events.
Configuring event receiving consists of the following steps:
- Configuring Apache Cassandra event logging in KUMA.
- Creating a KUMA collector for Apache Cassandra events.
To receive Apache Cassandra events, in the KUMA Collector Installation Wizard, at the Transport step, select a file type connector; at the Event parsing step, in the Normalizer field, select [OOTB] Apache Cassandra file.
- Installing a collector in the KUMA network infrastructure.
- Verifying receipt of Apache Cassandra events in the KUMA collector.
To verify that the Apache Cassandra event source server is configured correctly, you can search for related events.
Configuring Apache Cassandra event logging in KUMA
To configuring Apache Cassandra event logging in KUMA:
- Make sure that the server where Apache Cassandra is installed has 5 GB of free disk space.
- Connect to the Apache Cassandra server using an account with administrator rights.
- Before making changes, create backup copies of the following configuration files:
- /etc/cassandra/cassandra.yaml
- /etc/cassandra/logback.xml
- Make sure that the settings in the /etc/cassandra/cassandra.yaml configuration file have the following values; make changes if necessary:
- in the
audit_logging_optionssection, set theenabledsetting totrue. - in the
loggersection, set theclass_namesetting toFileAuditLogger.
- in the
- Add the following lines to the /etc/cassandra/logback.xml configuration file:
<!-- Audit Logging (FileAuditLogger) rolling file appender to audit.log --><appender name="AUDIT" class="ch.qos.logback.core.rolling.RollingFileAppender"><file>${cassandra.logdir}/audit/audit.log</file><rollingPolicy class="ch.qos.logback.core.rolling.SizeAndTimeBasedRollingPolicy"><!-- rollover daily --><fileNamePattern>${cassandra.logdir}/audit/audit.log.%d{yyyy-MM-dd}.%i.zip</fileNamePattern><!-- each file should be at most 50MB, keep 30 days worth of history, but at most 5GB --><maxFileSize>50MB</maxFileSize><maxHistory>30</maxHistory><totalSizeCap>5GB</totalSizeCap></rollingPolicy><encoder><pattern>%-5level [%thread] %date{ISO8601} %F:%L - %replace(%msg){'\n', ' '}%n</pattern></encoder></appender><!-- Audit Logging additivity to redirect audt logging events to audit/audit.log --><logger name="org.apache.cassandra.audit" additivity="false" level="INFO"><appender-ref ref="AUDIT"/></logger> - Save changes to the configuration file.
- Restart the Apache Cassandra service using the following commands:
sudo systemctl stop cassandra.servicesudo systemctl start cassandra.service
- After restarting, check the status of Apache Cassandra using the following command:
sudo systemctl status cassandra.serviceMake sure that the command output contains the following sequence of characters:
Active: active (running)
Apache Cassandra event export is configured. Events are located in the /var/log/cassandra/audit/ directory, in the audit.log file (${cassandra.logdir}/audit/audit.log).
Page topConfiguring receipt of FreeIPA events
You can configure the receipt of FreeIPA events in KUMA via the Syslog protocol.
Configuring event receiving consists of the following steps:
- Configuring export of FreeIPA events to KUMA.
- Creating a KUMA collector for receiving FreeIPA events.
To receive FreeIPA events, in the KUMA Collector Setup Wizard, at the Event parsing step, in the Normalizer field, select [OOTB] FreeIPA.
- Installing the KUMA collector in the network infrastructure.
- Verifying receipt of FreeIPA events by KUMA.
To verify that the FreeIPA event source server is configured correctly, you can search for related events.
Configuring export of FreeIPA events to KUMA
To configure the export of FreeIPA events to KUMA via the Syslog protocol in JSON format:
- Connect to the FreeIPA server via SSH using an account with administrator rights.
- In the /etc/rsyslog.d/ directory, create a file named freeipa-to-siem.conf.
- Add the following lines to the /etc/rsyslog.d/freeipa-to-siem.conf configuration file:
template(name="ls_json" type="list" option.json="on"){ constant(value="{")constant(value="\"@timestamp\":\"") property(name="timegenerated" dateFormat="rfc3339")constant(value="\",\"@version\":\"1")constant(value="\",\"message\":\"") property(name="msg")constant(value="\",\"host\":\"") property(name="fromhost")constant(value="\",\"host_ip\":\"") property(name="fromhost-ip")constant(value="\",\"logsource\":\"") property(name="fromhost")constant(value="\",\"severity_label\":\"") property(name="syslogseverity-text")constant(value="\",\"severity\":\"") property(name="syslogseverity")constant(value="\",\"facility_label\":\"") property(name="syslogfacility-text")constant(value="\",\"facility\":\"") property(name="syslogfacility")constant(value="\",\"program\":\"") property(name="programname")constant(value="\",\"pid\":\"") property(name="procid")constant(value="\",\"syslogtag\":\"") property(name="syslogtag")constant(value="\"}\n")}*.* @<IP address of the KUMA collector>:<port of the KUMA collector KUMA>;ls_jsonYou can fill in the last line in accordance with the selected protocol:
*.* @<192.168.1.10>:<1514>;ls_jsonfor sending events over UDP*.* @@<192.168.2.11>:<2514>;ls_jsonfor sending events over TCP - Add the following lines to the /etc/rsyslog.conf configuration file:
$IncludeConfig /etc/freeipa-to-siem.conf$RepeatedMsgReduction off - Save changes to the configuration file.
- Restart the rsyslog service by executing the following command:
sudo systemctl restart rsyslog.service
Configuring receipt of VipNet TIAS events
You can configure the receipt of ViPNet TIAS events in KUMA via the Syslog protocol.
Configuring event receiving consists of the following steps:
- Configuring export of ViPNet TIAS events to KUMA.
- Creating a KUMA collector for receiving ViPNet TIAS events.
To receive ViPNet TIAS events using Syslog, in the Collector Installation Wizard, at the Event parsing step, select the [OOTB] Syslog-CEF normalizer.
- Installing a KUMA collector for receiving ViPNet TIAS events.
- Verifying receipt of ViPNet TIAS events in KUMA.
You can verify that ViPNet TIAS event source server is correctly configured in the Searching for related events section of the KUMA console.
Configuring export of ViPNet TIAS events to KUMA
To configure the export of ViPNet TIAS events to KUMA via the syslog protocol:
- Connect to the ViPNet TIAS web interface under a user account with administrator rights.
- Go to the Management – Integrations section.
- On the Integration page, go to the Syslog tab.
- In the toolbar of the list of receiving servers, click New server.
- This opens the new server card; in that card:
- In the Server address field, enter the IP address or domain name of the KUMA collector.
For example, 10.1.2.3 or syslog.siem.ru
- In the Port field, specify the inbound port of the KUMA collector. The default port number is 514.
- In the Protocol list, select the transport layer protocol that the KUMA collector is listening on. UDP is selected by default.
- In the Organization list, use the check boxes to select the organizations of the ViPNet TIAS infrastructure.
Messages are sent only for incidents detected based on events received from sensors of selected organizations of the infrastructure.
- In the Status list, use check boxes to select incident statuses.
Messages are sent only when selected statuses are assigned to incidents.
- In the Severity level list, use check boxes to select the severity levels of the incidents.
Messages are sent only about incidents with the selected severity levels. By default, only the high severity level is selected in the list.
- In the UI language list, select the language in which you want to receive information about incidents in messages. Russian is selected by default.
- In the Server address field, enter the IP address or domain name of the KUMA collector.
- Click Add.
- In the toolbar of the list, set the Do not send incident information in CEF format toggle switch to enabled.
As a result, when new incidents are detected or the statuses of previously detected incidents change, depending on the statuses selected during configuration, the corresponding information is sent to the specified addresses of receiving servers via the syslog protocol in CEF format.
- Click Save changes.
Export of events to the KUMA collector is configured.
Page topConfiguring receipt of Nextcloud events
You can configure the receipt of Nextcloud 26.0.4 events in KUMA.
Configuring event receiving consists of the following steps:
- Configuring audit of Nextcloud events.
- Configuring a Syslog server to send events.
The rsyslog service is used to transmit events from the server to the collector.
- Creating a KUMA collector for receiving Nextcloud events.
To receive Nextcloud events, in the Collector Installation Wizard, at the Event parsing step, select the [OOTB] Nextcloud syslog normalizer, and at the Transport step select the tcp or udp connector type.
- Installing KUMA collector for receiving Nextcloud events
- Verifying receipt of Nextcloud events in the KUMA collector
You can verify that the Nextcloud event source server is correctly configured in the Searching for related events section of the KUMA web interface.
Configuring audit of Nextcloud events
To configure the export of Nextcloud events to KUMA:
- On the server where Nextcloud is installed, create a backup copy of the /home/localuser/www/nextcloud/config/config.php configuration file.
- Edit the /home/localuser/www/nextcloud/config/config.php Nextcloud configuration file.
- Edit the settings as follows:
'log_type' => 'syslog','syslog_tag' => 'Nextcloud','logfile' => '','loglevel' => 0,'log.condition' => ['apps' => ['admin_audit'],], - Restart the Nextcloud service:
sudo service restart nextcloud
Export of events to the KUMA collector is configured.
Page topConfiguring a Syslog server to send Nextcloud events
To configure the sending of events from the server where Nextcloud is installed to the collector:
- In the /etc/rsyslog.d/ directory, create a Nextcloud-to-siem.conf file with the following content:
If $programname contains 'Nextcloud' then @<IP address of the collector>:<port of the collector>Example:
If $programname contains 'Nextcloud' then @192.168.1.5:1514If you want to send events via TCP, the contents of the file must be as follows:
If $programname contains 'Nextcloud' then @<IP address of the collector>:<port of the collector> - Save changes to the Nextcloud-to-siem.conf configuration file.
- Create a backup copy of the /etc/rsyslog.conf file.
- Add the following lines to the /etc/rsyslog.conf configuration file:
$IncludeConfig /etc/Nextcloud-to-siem.conf$RepeatedMsgReduction off - Save your changes.
- Restart the rsyslog service by executing the following command:
sudo systemctl restart rsyslog.service
The export of Nextcloud events to the collector is configured.
Page topConfiguring receipt of Snort events
You can configure the receipt of Snort 3 events in KUMA.
Configuring event receiving consists of the following steps:
- Configuring logging of Snort events.
- Creating a KUMA collector for receiving Snort events.
To receive Snort events, in the Collector Installation Wizard, at the Event parsing step, select the [OOTB] Snort 3 json file normalizer, and at the Transport step, select the file connector type.
- Installing a KUMA collector for receiving Snort events
- Verifying receipt of Snort events in the KUMA collector
You can verify that the Snort event source server is correctly configured in the Searching for related events section of the KUMA web interface.
Configuring logging of Snort events
Make sure that the server running Snort has at least 500 MB of free disk space for storing a single Snort event log.
When the log reaches 500 MB, Snort automatically creates a new file with a name that includes the current time in unixtime format.
We recommend monitoring disk space usage.
To configure Snort event logging:
- Connect to the server where Snort is installed using an account with administrative privileges.
- Edit the Snort configuration file. To do so, run the following command on the command line:
sudo vi /usr/local/etc/snort/snort.lua - In the configuration file, edit the alert_json block:
alert_json ={file = true,limit = 500,fields = 'seconds action class b64_data dir dst_addr dst_ap dst_port eth_dst eth_len \eth_src eth_type gid icmp_code icmp_id icmp_seq icmp_type iface ip_id ip_len msg mpls \pkt_gen pkt_len pkt_num priority proto rev rule service sid src_addr src_ap src_port \target tcp_ack tcp_flags tcp_len tcp_seq tcp_win tos ttl udp_len vlan timestamp',} - To complete the configuration, run the following command:
sudo /usr/local/bin/snort -c /usr/local/etc/snort/snort.lua -s 65535 -k none -l /var/log/snort -i<name of the interface that Snort is listening on>-m 0x1b
As a result, Snort events are logged to /var/log/snort/alert_json.txt.
Page topConfiguring receipt of Suricata events
You can configure the receipt of Suricata 7.0.1 events in KUMA.
Configuring event receiving consists of the following steps:
- Configuring export of Suricata events to KUMA
- Creating a KUMA collector for receiving Suricata events.
To receive Suricata events, in the Collector Installation Wizard, at the Event parsing step, select the [OOTB] Suricata json file normalizer, and at the Transport step, select the file connector type.
- Installing KUMA collector for receiving Suricata events
- Verifying receipt of Suricata events in the KUMA collector
You can verify that the Suricata event source server is correctly configured in the Searching for related events section of the KUMA web interface.
Configuring logging of Suricata events.
To configure Suricata event logging:
- Connect via SSH to the server that has administrative user accounts.
- Create a backup copy of the /etc/suricata/suricata.yaml file.
- Set the following values in the eve-log section of the /etc/suricata/suricata.yaml configuration file:
- eve-log:enabled: yesfiletype: regular #regular|syslog|unix_dgram|unix_stream|redisfilename: eve.json - Save your changes to the /etc/suricata/suricata.yaml configuration file.
As a result, Suricata events are logged to the /usr/local/var/log/suricata/eve.json file.
Suricata does not support limiting the size of the eve.json event file. If necessary, you can manage the log size by using rotation. For example, to configure hourly log rotation, add the following lines to the configuration file:
outputs:
- eve-log:
filename: eve-%Y-%m-%d-%H:%M.json
rotate-interval: hour
Configuring receipt of FreeRADIUS events
You can configure the receipt of FreeRADIUS 3.0.26 events in KUMA.
Configuring event receiving consists of the following steps:
- Configuring audit of FreeRADIUS events.
- Configuring a Syslog server to send FreeRADIUS events.
- Creating a KUMA collector for receiving FreeRADIUS events.
To receive FreeRADIUS events, in the Collector Installation Wizard, at the Event parsing step, select the [OOTB] FreeRADIUS syslog normalizer, and at the Transport step, select the tcp or udp connector type.
- Installing KUMA collector for receiving FreeRADIUS events.
- Verifying receipt of FreeRADIUS events in the KUMA collector.
You can verify that the FreeRADIUS event source server is correctly configured in the Searching for related events section of the KUMA web interface.
Configuring audit of FreeRADIUS events
To configure event audit in the FreeRADIUS system:
- Connect to the server where the FreeRADIUS system is installed with a user account with administrative privileges.
- Create a backup copy of the FreeRADIUS configuration file:
sudo cp /etc/freeradius/3.0/radiusd.conf /etc/freeradius /3.0/radiusd.conf.bak - Open the FreeRADIUS configuration file for editing:
sudo nano /etc/freeradius/3.0/radiusd.conf - In the 'log' section, edit the settings as follows:
destination = syslogsyslog_facility = daemonstripped_names = noauth = yesauth_badpass = yesauth_goodpass = yes - Save the configuration file.
FreeRADIUS event audit is configured.
Page topConfiguring a Syslog server to send FreeRADIUS events
The rsyslog service is used to transmit events from the FreeRADIUS server to the KUMA collector.
To configure the sending of events from the server where FreeRADIUS is installed to the collector:
- In the /etc/rsyslog.d/ directory, create the FreeRADIUS-to-siem.conf file and add the following line to it:
If $programname contains 'radiusd' then @<IP address of the collector>:<port of the collector>If you want to send events via TCP, the contents of the file must be as follows:
If $programname contains 'radiusd' then @<IP address of the collector>:<port of the collector> - Create a backup copy of the /etc/rsyslog.conf file.
- Add the following lines to the /etc/rsyslog.conf configuration file:
$IncludeConfig /etc/FreeRADIUS-to-siem.conf$RepeatedMsgReduction off - Save your changes.
- Restart the rsyslog service:
sudo systemctl restart rsyslog.service
The export of events from the FreeRADIUS server to the KUMA collector is configured.
Page topConfiguring receipt of VMware vCenter events
You can configure the receipt of VMware vCenter events in the KUMA SIEM system.
Configuring event receiving consists of the following steps:
- Configuring the connection to VMware vCenter.
- Creating a KUMA collector for receiving VMware vCenter events.
To receive VMware vCenter events, in the collector installation wizard, at the Transport step, select the vmware connector type. Specify the required settings:
- The URL at which the VMware API is available, for example, https://vmware-server.com:6440.
- VMware credentials — a secret that specifies the username and password for connecting to the VMware API.
At the Event parsing step, select the [OOTB] VMware vCenter API normalizer.
- Installing a KUMA collector for receiving VMware vCenter events.
- Verifying receipt of VMware vCenter events in the KUMA collector.
You can verify that the VMware vCenter event source server is correctly configured in the Searching for related events section of the KUMA web interface.
Configuring the connection to VMware vCenter
To configure a connection to VMware vCenter to receive events:
- Connect to the VMware vCenter web interface under a user account that has administrative privileges.
- Go to the Security&Users section and select Users.
- Create a user account.
- Go to the Roles section and assign the "Read-only: See details of objects role, but not make changes" role to the created account.
You will use the credentials of this user account in the secret of the collector.
For details about creating user accounts, refer to the VMware vCenter documentation.
The connection to VMware vCenter for receiving events is configured.
Page topConfiguring receipt of zVirt events
You can configure the receipt of zVirt 3.1 events in KUMA.
Configuring event receiving consists of the following steps:
- Configuring export of zVirt events to KUMA.
- Creating a KUMA collector for receiving zVirt events.
To receive zVirt events, in the Collector Installation Wizard, at the Event parsing step, select the [OOTB] OrionSoft zVirt syslog normalizer, and at the Transport step, select the tcp or udp connector type.
- Installing KUMA collector for receiving zVirt events
- Verifying receipt of zVirt events in the KUMA collector
You can verify that the zVirt event source server is correctly configured in the Searching for related events section of the KUMA web interface.
Configuring export of zVirt events
ZVirt can send events to external systems in Hosted Engine installation mode.
To configure the export of zVirt events to KUMA:
- In the zVirt web interface, under Resources, select Virtual machines.
- Select the machine that is running the HostedEngine virtual machine and click Edit.
- In the Edit virtual machine window, go to the Logging section.
- Select the Determine Syslog server address check box.
- In the text box, enter the collector information in the following format:
<IP address or FQDN of the KUMA collector>:<port of the KUMA collector>. - If you want to use TCP instead of UDP for sending logs, select the Use TCP connection check box.
Event export is configured.
Page topConfiguring receipt of Zeek IDS events
You can configure the receipt of Zeek IDS 1.8 events in KUMA.
Configuring event receiving consists of the following steps:
- Conversion of the Zeek IDS event log format.
The KUMA normalizer supports Zeek IDS logs in the JSON format. To send events to the KUMA normalizer, log files must be converted to the JSON format.
- Creating a KUMA collector for receiving Zeek IDS events.
To receive Zeek IDS events, in the Collector Installation Wizard, at the Event parsing step, select the [OOTB] ZEEK IDS json file normalizer, and at the Transport step, select the file connector type.
- Installing KUMA collector for receiving Zeek IDS events
- Verifying receipt of Zeek IDS events in the KUMA collector
You can verify that the Zeek IDS event source server is correctly configured in the Searching for related events section of the KUMA web interface.
Conversion of the Zeek IDS event log format
By default, Zeek IDS events are logged in files in the /opt/zeek/logs/current directory.
The "[OOTB] ZEEK IDS json file" normalizer supports Zeek IDS logs in the JSON format. To send events to the KUMA normalizer, log files must be converted to the JSON format.
This procedure must be repeated every time before receiving Zeek IDS events.
To convert the Zeek IDS event log format:
- Connect to the server where Zeek IDS is installed with a user account with administrative privileges.
- Create the directory where JSON event logs must be stored:
sudo mkdir /opt/zeek/logs/zeek-json - Change to this directory:
sudo cd /opt/zeek/logs/zeek-json - Run the command that uses the jq utility to convert the original event log format to the target format:
jq . -c<path to the log file to be converted to a different format>>><new file name>.logExample:
jq . -c /opt/zeek/logs/current/conn.log >> conn.log
As a result of running the command, a new file is created in the /opt/zeek/logs/zeek-json directory if this file did not exist before. If the file was already present in the current directory, new information is appended to the end of the file.
Page topSource status
In KUMA, you can monitor the state of the sources of data received by collectors. There can be multiple sources of events on one server, and data from multiple sources can be received by one collector. KUMA creates event sources based on the following fields of events (the data in these fields is case sensitive):
- DeviceProduct is a required field.
- One of the DeviceHostname or DeviceAddress fields must be present.
- DeviceProcessName is an optional field.
- Tenant is a required field, which is determined automatically from the tenant of the event that was used to identify the source.
Limitations
- KUMA registers an event source, provided that the DeviceAddress and DeviceProduct fields are contained in a raw event.
If the raw event does not contain the DeviceAddress and DeviceProduct fields, you can do the following:
- Configure enrichment in the normalizer: select the Event data type on the Enrichment tab of the normalizer, specify the Source field setting, select DeviceAddress and DeviceProduct as the Target field, and click OK.
- Use an enrichment rule: select the Event data source type, specify the Source field setting, select DeviceAddress and DeviceProduct as the Target field, and click Create. The created enrichment rule must be linked to the collector at the Event enrichment step.
KUMA will perform enrichment and register the event source.
- If KUMA receives events with identical values of the DeviceProduct + DeviceHostname + DeviceAddress required fields, KUMA registers different sources if the following conditions are satisfied:
- The values of the required fields are identical, but different tenants are determined for the events.
- The values of the required fields are identical, but one of the events has an optional DeviceProcessName field specified.
- The values of the required fields are identical, but the data in these fields have different character case.
If you want KUMA to log such events under the same source, you can further configure the fields in the normalizer.
Lists of sources are generated in collectors, merged in the KUMA Core, and displayed in the program web interface under Source status on the List of event sources tab. Data is updated every minute.
The rate and number of incoming events serve as an important indicator of the state of the observed system. You can configure monitoring policies such that changes are tracked automatically and notifications are automatically created when indicators reach specific boundary values. Monitoring policies are displayed in the KUMA web interface under Source status on the Monitoring policies tab.
When monitoring policies are triggered, monitoring events are created and include data about the source of events.
List of event sources
Sources of events are displayed in the table under Source status → List of event sources. One page can display up to 250 sources. You can sort the table by clicking the column header of the relevant setting. Clicking on a source of events opens an incoming data graph.
You can use the Search field to search for event sources. The search is performed using regular expressions (RE2).
If necessary, you can configure the interval for updating data in the table. Available update periods: 1 minute, 5 minutes, 15 minutes, 1 hour. The default value is No refresh. You may need to configure the update period to track changes made to the list of sources.
The following columns are available:
- Status—status of the event source:
- Green—events are being received within the limits of the assigned monitoring policy.
- Red—the frequency or number of incoming events go beyond the boundaries defined in the monitoring policy.
- Gray—a monitoring policy has not been assigned to the source of events.
The table can be filtered by this setting.
- Name—name of the event source. The name is generated automatically from the following fields of events:
- DeviceProduct
- DeviceAddress and/or DeviceHostName
- DeviceProcessName
- Tenant
You can change the name of an event source. The name can contain no more than 128 Unicode characters.
- Host name or IP address—host name or IP address from which the events were forwarded.
- Monitoring policy—name of the monitoring policy assigned to the event source.
- Stream—frequency at which events are received from the event source.
- Lower limit—lower boundary of the permissible number of incoming events as indicated in the monitoring policy.
- Upper limit—upper boundary of the permissible number of incoming events as indicated in the monitoring policy.
- Tenant—the tenant that owns the events received from the event source.
If you select sources of events, the following buttons become available:
- Save to CSV—you can use this button to export data of the selected event sources to a file named event-source-list.csv in UTF-8 encoding.
- Apply policy and Disable policy—you can use these buttons to enable or disable a monitoring policy for a source of events. When enabling a policy, you must select the policy from the drop-down list. When disabling a policy, you must select how long you want to disable the policy: temporarily or forever.
If there is no policy for the selected event source, the Apply policy button is inactive. This button will also be inactive if sources from different tenants are selected, but the user has no available policies in the shared tenant.
In some rare cases, the status of a disabled policy may change from gray to green a few seconds after it is disabled due to overlapping internal processes of KUMA. If this happens, you need to disable the monitoring policy again.
- Remove event source from the list—you can use this button to remove an event source from the table. The statistics on this source will also be removed. If a collector continues to receive data from the source, the event source will re-appear in the table but its old statistics will not be taken into account.
By default, no more than 250 event sources are displayed and, therefore, available for selection. If there are more event sources, to select them you must load additional event sources by clicking the Show next 250 button in the lower part of the window.
Page topMonitoring policies
The rate and number of incoming events serve as an important indicator of the state of the system. For example, you can detect when there are too many events, too few, or none at all. Monitoring policies are designed to detect such situations. In a policy, you can specify a lower threshold, an optional upper threshold, and the way the events are counted: by frequency or by total number.
The policy must be applied to the event source. After applying the policy, you can monitor the status of the source: green means everything is OK, red means the stream is outside the configured threshold. If the status is red, an event of the Monitoring type generated. You can also configure notifications to be sent to an arbitrary email address. Policies for monitoring the sources of events are displayed in the table under Source status → Monitoring policies. You can sort the table by clicking the column header of the relevant setting. Clicking a policy opens the data area with policy settings. The settings can be edited.
To add a monitoring policy:
- In the KUMA console, under Source status → Monitoring policies, click Add policy and specify the settings in the opened window:
- In the Policy name field, enter a unique name for the policy you are creating. The name must contain 1 to 128 Unicode characters.
- In the Tenant drop-down list, select the tenant that will own the policy. Your tenant selection determines the specific sources of events that can covered by the monitoring policy.
- In the Policy type drop-down list, select one of the following options:
- byCount—by the number of events over a certain period of time.
- byEPS—by the number of events per second over a certain period of time. The average value over the entire period is calculated. You can additionally track spikes during specific periods.
- In the Lower limit and Upper limit fields, set the boundaries representing normal behavior. Deviations from these boundaries will trigger the monitoring policy, create alerts, and forward notifications.
- In the Count interval field, specify the period during which the monitoring policy must take into account the data from the monitoring source. The maximum value is 14 days.
- If necessary, specify the email addresses to which notifications about the activation of the KUMA monitoring policy should be sent. To add each address, click the Email button.
To forward notifications, you must configure a connection to the SMTP server.
- Click Add.
The monitoring policy will be added.
To remove a monitoring policy,
select one or more policies, then click Delete policy and confirm the action.
You cannot remove preinstalled monitoring policies or policies that have been assigned to data sources.
Page topManaging assets
Assets represent the computers of the organization. You can add assets to KUMA; in that case, KUMA automatically adds asset IDs when enriching events, and when you analyze events, you can get additional information about computers in the organization.
You can add assets to KUMA in the following ways:
- Import assets:
- From the MaxPatrol report.
- On a schedule from Kaspersky Security Center and KICS for Networks.
By default, assets are imported every 12 hours, this frequency can be configured. On-demand import of assets is also possible; such on-demand import does not affect the scheduled import time. From the Kaspersky Security Center database, KUMA imports information about devices with installed Kaspersky Security Center Network Agent that has connected to Kaspersky Security Center, that is, has a non-empty 'Connection time' field in the SQL database. KUMA imports the following information about the computer: name, address, time of connection to Kaspersky Security Center, information about hardware and software, including the operating system, as well as vulnerabilities, that is, information received from Kaspersky Security Center Network Agents.
- Create assets manually through the web interface or via the API.
You can add assets manually. In this case, you must manually specify the following information: address, FQDN, name and version of the operating system, hardware information. Information about the vulnerabilities of assets cannot be added through the web interface. You can provide information about vulnerabilities if you add assets using the API.
You can manage KUMA assets: view information about assets, search for assets, add, edit or delete assets, and export asset data to a CSV file.
Asset categories
You can categorize the assets and then use the categories in filter conditions or correlation rules. For example, you can create alerts of a higher severity level for assets from a higher-severity category. By default, all assets fall into the Uncategorized assets category. A device can be added to multiple categories.
By default, KUMA assigns the following severity levels to asset categories: Low, Medium, High, Critical. You can create custom categories, categories can be nested.
Categories can be populated in the following ways:
- Manually
- Active: dynamic if the asset meets the specified conditions. For example, the moment the asset is upgraded to a specified OS version or placed in a specified subnet, the asset is moved to the specified category.
- Reactive—When a correlation rule is triggered, the asset is moved to the specified group.
In KUMA, assets are categorized by tenant and by category. Assets are arranged in a tree structure, where the tenants are located at the root, and the asset categories branch from them. You can view the tree of tenants and categories in the Assets → All assets section of the KUMA web interface. When a tree node is selected, the assets assigned to it are displayed in the right part of the window. Assets from the subcategories of the selected category are displayed if you specify that you want to display assets recursively. You can select the check boxes next to the tenants whose assets you want to view.
To open the context menu of a category, hover the mouse cursor over the category and click the ellipsis icon that is displayed to the right of the category name. The following actions are available in the context menu:
Category context menu items
Action |
Description |
|---|---|
Show assets |
Display assets of the selected category in the right part of the window. |
Show assets recursively |
View assets from subcategories of the selected category. If you want to exit recursive viewing mode, select another category to view. |
Show info |
View information about the selected category in the Category information details area displayed in the right part of the web interface window. |
Start categorization |
Start automatic binding of assets to the selected category. This option is available for categories that have active categorization. |
Add subcategory |
Add a subcategory to the selected category. |
Edit category |
Edit the selected category. |
Delete category |
Delete the selected category. You can only delete categories that have no assets or subcategories. Otherwise the Delete category option is inactive. |
Pin as tab |
Display the selected category on a separate tab. You can undo this action by selecting Unpin as tab in the context menu of the relevant category. |
Adding an asset category
To add an asset category:
- Go to the Assets section of the KUMA console.
- Open the category creation window:
- Click the Add category button.
- If you want to create a subcategory, select Add subcategory in the context menu of the parent category.
The Add category details area appears in the right-hand part of the console window.
- Add information about the category:
- In the Name field, enter the name of the category. The name must contain 1 to 128 Unicode characters.
- In the Parent field, indicate the position of the category within the categories tree hierarchy:
- Click the
 button.
This opens the Select categories window showing the categories tree. If you are creating a new category and not a subcategory, the window may show multiple asset category trees, one for each tenant that you can access. Your tenant selection in this window cannot be undone.
- Select the parent category for the category you are creating.
- Click Save.
Selected category appears in Parent fields.
- Click the
- The Tenant field displays the tenant whose structure contains your selected parent category. The tenant category cannot be changed.
- Assign a severity to the category in the Priority drop-down list.
- If necessary, in the Description field, you can add a note consisting of up to 256 Unicode characters.
- In the Categorization kind drop-down list, select how the category will be populated with assets. Depending on your selection, you may need to specify additional settings:
- Manually—assets can only be manually linked to a category.
- Active—assets will be assigned to a category at regular intervals if they satisfy the defined filter.
- Reactive—the category will be filled with assets by using correlation rules.
- Click Save.
The new category will be added to the asset categories tree.
Page topConfiguring the table of assets
In KUMA, you can configure the contents and order of columns displayed in the assets table. These settings are stored locally on your machine.
To configure the settings for displaying the assets table:
- Go to the Assets section of the KUMA console.
- Click the
 icon in the upper-right corner of the assets table.
 - In the drop-down list, select the check boxes next to the parameters that you want to view in the table:
- FQDN
- IP address
- Asset source
- Owner
- MAC address
- Created by
- Updated
- Tenant
- CII category
When you select a check box, the assets table is updated and a new column is added. When a check box is cleared, the column disappears. The table can be sorted based on multiple columns.
- If you need to change the order of columns, click the left mouse button on the column name and drag it to the desired location in the table.
The assets table display settings are configured.
Page topSearching assets
KUMA has two asset search modes. You can switch between the search modes using the buttons in the upper left part of the window:
 – simple search by the following asset settings: Name, FQDN, IP address, MAC address, and Owner.
 – advanced search for assets using filters by conditions and condition groups.
You can select the check boxes next to the found assets to export their data to a CSV file.
Simple search
To find an asset:
- Make sure that the button is enabled in the upper left part of the Assets section of the KUMA web interface.
The Search field is displayed at the top of the window.
- Enter your search query in the Search field and press ENTER or click the icon.
The table displays the assets with the Name, FQDN, IP address, MAC address, and Owner settings matching the search criteria.
Advanced search
An advanced asset search is performed using the filtering conditions that can be specified in the upper part of the window:
- You can use the Add condition button to add a string containing fields for identifying the condition.
- You can use the Add group button to add a group of filters. Group operators can be switched between AND, OR, and NOT.
- Conditions and condition groups can be dragged with the mouse.
- Conditions, groups, and filters can be deleted by using the button.
- You can collapse the filtering options by clicking the Collapse button. In this case, the resulting search expression is displayed. Clicking it displays the search criteria in full again.
- The filtering options can be reset by clicking the Clear button.
- The condition operators and available values of the right operand depend on the selected left operand:
Left operand
Available operators
Right operand
Build number
=, >, >=, <, <=
An arbitrary value.
OS
=, ilike
An arbitrary value.
IP address
inSubnet, inRange
An arbitrary value or a range of values.
The filtering condition for the inSubnet operator is met if the IP address in the left operand is included in the subnet that is specified in the right operand. For example, the subnet for the IP address 10.80.16.206 should be specified in the right operand using slash notation as follows:
10.80.16.206/25.FQDN
=, ilike
An arbitrary value.
CVE
=, in
An arbitrary value.
Asset source
in
- Kaspersky Security Center
- KICS for Networks
- Imported via API
- Created manually
RAM
=, >, >=, <, <=
Number.
Number of disks
=, >, >=, <, <=
Number.
Number of network cards
=, >, >=, <, <=
Number.
Disk free bytes
=, >, >=, <, <=
Number.
Anti-virus databases last updated
>=, <=
Date.
Last update of the information
>=, <=
Date.
Protection last updated
>=, <=
Date.
System last started
>=, <=
Date.
KSC extended status
in
- The host with the Network Agent installed is connected to the network, but the Network Agent is not active
- The anti-virus application is installed, but real-time protection is not enabled
- Anti-virus application is installed but not running
- The number of detected viruses is too large
- The anti-virus application is installed, but the real-time protection status differs from the one set by the security administrator
- The anti-virus application is not installed
- A full virus scan was performed too long ago
- The anti-virus databases were updated too long ago
- The Network Agent is inactive for too long
- License expired
- The number of untreated objects is too large
- Restart required
- Incompatible applications are installed on the host
- Vulnerabilities are detected on the host
- The last scan for operating system updates on the host was too long ago
- Invalid encryption status of the host
- Mobile device settings do not comply with security policy requirements
- Unprocessed incidents detected
- Host status is suggested by a managed product
- Insufficient disk space on the host. Synchronization errors occur, or not enough disk space
Real-time protection status
=
- Suspended
- Starting
- Running (if the anti-virus application does not support the Running status categories)
- Performed with maximum protection
- Performed with maximum performance
- Performed with recommended settings
- Performed with custom settings
- Error
Encryption status
=
- Encryption rules are not configured on the host.
- Encryption is in progress.
- Encryption was canceled by the user.
- Encryption error occurred.
- All host encryption rules are met.
- Encryption is in progress, the host must be restarted.
- Encrypted files without specified encryption rules are detected on the host.
Spam protection status
=
- Unknown
- Stopped
- Suspended
- Starting
- In progress
- Error
- Not installed
- License is missing
Anti-virus protection status of mail servers
=
- Unknown
- Stopped
- Suspended
- Starting
- In progress
- Error
- Not installed
- License is missing
Data Leakage Prevention status
=
- Unknown
- Stopped
- Suspended
- Starting
- In progress
- Error
- Not installed
- License is missing
KSC extended status ID
=
- OK
- Critical
- Attention required
Endpoint Sensor status
=
- Unknown
- Stopped
- Suspended
- Starting
- In progress
- Error
- Not installed
- License is missing
Last visible
>=, <=
Date
To find an asset:
- Make sure that the button is enabled in the upper left part of the Assets section of the KUMA web interface.
The asset filtering settings are displayed in the upper part of the window.
- Specify the asset filtering settings and click the Search button.
The table displays the assets that meet the search criteria.
Page topExporting asset data
You can export data about the assets displayed in the assets table as a CSV file.
To export asset data:
- Configure the assets table.
Only the data specified in the table is written to the file. The display order of the asset table columns is preserved in the exported file.
- Find the desired assets and select the check boxes next to them.
You can select all the assets in the table at a time by selecting the check box in the left part of the assets table header.
- Click the Export CSV button.
The asset data is written to the assets_<export date>_<export time>.csv file. The file is downloaded according to your browser settings.
Page topViewing asset details
To view information about an asset, open the asset information window in one of the following ways:
- In the KUMA console, select Assets → select a category with the relevant assets → select an asset.
- In the KUMA console, select the Events section → search and filter events → select the relevant event → click the link in one of the following fields: SourceAssetID, DestinationAssetID, or DeviceAssetID.
The following information may be displayed in the asset details window:
- Name—asset name.
Assets imported into KUMA retain the names that were assigned to them at the source. You can change these names in the KUMA console.
- Tenant—the name of the tenant that owns the asset.
- Asset source—source of information about the asset. There may be several sources. For instance, information can be added in the KUMA console or by using the API, or it can be imported from Kaspersky Security Center, KICS for Networks, and MaxPatrol reports.
When using multiple sources to add information about the same asset to KUMA, you should take into account the rules for merging asset data.
- Created—date and time when the asset was added to KUMA.
- Updated—date and time when the asset information was most recently modified.
- Owner—owner of the asset, if provided.
- IP address—IP address of the asset (if any).
If there are several assets with identical IP addresses in KUMA, the asset that was added the latest is returned in all cases when assets are searched by IP address. If assets with identical IP addresses can coexist in your organization's network, plan accordingly and use additional attributes to identify the assets. For example, this may become important during correlation.
- FQDN—Fully Qualified Domain Name of the asset, if provided.
- MAC address—MAC address of the asset (if any).
- Operating system—operating system of the asset.
- Related alerts—alerts associated with the asset (if any).
To view the list of alerts related to an asset, click the Find in Alerts link. The Alerts tab opens with the search expression set to filter all assets with the corresponding asset ID.
- Software info and Hardware info—if the asset software and hardware parameters are provided, they are displayed in this section.
- Asset vulnerability information:
- Open Single Management Platform vulnerabilities—asset vulnerabilities, if any. This information is available for the assets imported from Kaspersky Security Center.
You can learn more about the vulnerability by clicking the
 icon, which opens the Kaspersky Threats portal. You can also update the vulnerabilities list by clicking the Update link and requesting updated information from Kaspersky Security Center.
 - KICS for Networks vulnerabilities—vulnerabilities of the asset, if provided. This information is available for the assets imported from KICS for Networks.
- Open Single Management Platform vulnerabilities—asset vulnerabilities, if any. This information is available for the assets imported from Kaspersky Security Center.
- Asset source information:
- Last visible—time when information about the asset was last received from Kaspersky Security Center. This information is available for the assets imported from Kaspersky Security Center.
- Host ID—ID of the Kaspersky Security Center Network Agent from which the asset information was received. This information is available for the assets imported from Kaspersky Security Center. This ID is used to determine the uniqueness of the asset in Kaspersky Security Center.
- KICS for Networks server IP address and KICS for Networks connector ID—data on the KICS for Networks instance from which the asset was imported.
- Custom fields—data written to the asset custom fields.
- Additional information about the protection settings of an asset with Kaspersky Endpoint Security for Windows or Kaspersky Endpoint Security for Linux installed:
- OSMP extended status ID – asset status. It can have the following values:
- OK
- Critical
- Warning
- OSMP extended status – information about the asset status. For example, "The anti-virus databases were updated too long ago".
- Real-time protection status – status of Kaspersky applications installed on the asset. For example: "Running (if the anti-virus application does not support the Running status categories)".
- Encryption status – information about asset encryption. For example: "Encryption rules are not configured on the host".
- Spam protection status – status of anti-spam protection. For example, "Started".
- Anti-virus protection status of mail servers – status of the virus protection of mail servers. For example, "Started".
- Data Leakage Prevention status – status of data leak protection. For example, "Started".
- Endpoint Sensor status – status of data leak protection. For example, "Started".
- Anti-virus databases last updated – the version of the downloaded anti-virus databases.
- Protection last updated – the time when the anti-virus databases were last updated.
- System last started – the time when the system was last started.
This information is displayed if the asset was imported from Kaspersky Security Center.
- OSMP extended status ID – asset status. It can have the following values:
- Categories—categories associated with the asset (if any).
- CII category—information about whether an asset is a critical information infrastructure (CII) object.
Clicking the OSMP response button starts the Kaspersky Security Center task on the asset, and clicking the Move to OSMP group button moves the asset being viewed between Kaspersky Security Center administration groups.
This is available if KUMA is integrated with Kaspersky Security Center.
Page topAdding assets
You can add asset information in the following ways:
- Manually.
You can add an asset using the KUMA console or the API.
- Import assets.
You can import assets from Kaspersky Security Center, KICS for Networks, and MaxPatrol reports.
When assets are added, assets that already exist in KUMA can be merged with the assets being added.
Asset merging algorithm:
- Checking uniqueness of Kaspersky Security Center or KICS for Networks assets.
- The uniqueness of an asset imported from Kaspersky Security Center is determined by the Host ID parameter, which contains the Kaspersky Security Center Network Agent Network Agent identifier. If two assets' IDs differ, they are considered to be separate assets and are not merged.
- The uniqueness of an asset imported from KICS for Networks is determined by the combination of the IP address, KICS for Networks server IP address, and KICS for Networks connector ID parameters. If any of the parameters of two assets differ they are considered to be separate assets and are not merged.
If the compared assets match, the algorithm is performed further.
- Make sure that the values in the IP, MAC, and FQDN fields match.
If at least two of the specified fields match, the assets are combined, provided that the other fields are blank.
Possible matches:
- The FQDN and IP address of the assets match. The MAC field is blank.
The check is performed against the entire array of IP address values. If the IP address of an asset is included in the FQDN, the values are considered to match.
- The FQDN and MAC address of the assets match. The IP field is blank.
The check is performed against the entire array of MAC address values. If at least one value of the array fully matches the FQDN, the values are considered to match.
- The IP address and MAC address of the assets match. The FQDN field is blank.
The check is performed against the entire array of IP- and MAC address values. If at least one value in the arrays is fully matched, the values are considered to match.
- The FQDN and IP address of the assets match. The MAC field is blank.
- Make sure that the values of at least one of the IP, MAC, or FQDN fields match, provided that the other two fields are not filled in for one or both assets.
Assets are merged if the values in the field match. For example, if the FQDN and IP address are specified for a KUMA asset, but only the IP address with the same value is specified for an imported asset, the fields match. In this case, the assets are merged.
For each field, verification is performed separately and ends on the first match.
You can see examples of asset field comparison here.
Information about assets can be generated from various sources. If the added asset and the KUMA asset contain data received from the same source, this data is overwritten. For example, a Kaspersky Security Center asset receives a fully qualified domain name, software information, and host ID when imported into KUMA. When importing an asset from Kaspersky Security Center with an equivalent fully qualified domain name, all this data will be overwritten (if it has been defined for the added asset). All fields in which the data can be refreshed are listed in the Updatable data table.
Updatable data
Field name |
Update procedure |
|---|---|
Name |
Selected according to the following priority:
|
Owner |
The first value from the sources is selected according to the following priority:
|
IP address |
The data is merged. If the array of addresses contains identical addresses, the copy of the duplicate address is deleted. |
FQDN |
The first value from the sources is selected according to the following priority:
|
MAC address |
The data is merged. If the array of addresses contains identical addresses, one of the duplicate addresses is deleted. |
Operating system |
The first value from the sources is selected according to the following priority:
|
Vulnerabilities |
KUMA asset data is supplemented with information from the added assets. In the asset details, data is grouped by the name of the source. Vulnerabilities are eliminated for each source separately. |
Software info |
Data from KICS for Networks is always recorded (if available). For other sources, the first value is selected according to the following priority:
|
Hardware info |
The first value from the sources is selected according to the following priority:
|
The updated data is displayed in the asset details. You can view asset details in the KUMA console.
This data may be overwritten when new assets are added. If the data used to generate asset information is not updated from sources for more than 30 days, the asset is deleted. The next time you add an asset from the same sources, a new asset is created.
If you are using KUMA console to edit asset information that was received from Kaspersky Security Center or KICS for Networks, you can edit the following asset data:
- Name.
- Category.
If asset information was added manually, you can edit the following asset data when editing these assets in the KUMA console:
- Name.
- Name of the tenant that owns the asset.
- IP address.
- Fully qualified domain name.
- MAC address.
- Owner.
- Category.
- Operating system.
- Hardware info.
Asset data cannot be edited via the REST API. When importing from the REST API, the data is updated according to the rules for merging asset details provided above.
Adding asset information in the KUMA console
To add an asset in the KUMA console:
- In the Assets section of the KUMA console, click Add asset.
The Add asset details area opens in the right part of the window.
- Enter the asset parameters:
- Asset name (required)
- Tenant (required)
- IP address and/or FQDN (required) You can specify multiple FQDNs separated by commas
- MAC address
- Owner
- If required, assign one or multiple categories to the asset:
- Click the button.
Select categories window opens.
- Select the check boxes next to the categories that should be assigned to the asset. You can use the
 and
and  icons to expand or collapse the lists of categories.
 - Click Save.
The selected categories appear in the Categories fields.
- Click the
- If required, add information about the operating system installed on the asset in the Software section.
- If required, add information about asset hardware in the Hardware info section.
- Click Add.
The asset is created and displayed in the assets table in the category assigned to it or in the Uncategorized assets category.
Page topImporting asset information from Kaspersky Security Center
All assets that are protected by this program are registered in Kaspersky Security Center. Information about assets protected by Kaspersky Security Center can be imported into KUMA. To do so, you need to configure integration between the applications in advance.
KUMA supports the following types of asset imports from OSMP:
- Import of information about all assets of all OSMP servers.
- Import of information about assets of the selected OSMP server.
To import information about all assets of all OSMP servers:
- In the KUMA web interface, select the Assets section.
- Click the Import assets button.
This opens the Import Open Single Management Platform assets.
- In the drop-down list, select the tenant for which you want to perform the import.
In this case, the program downloads information about all assets of all OSMP servers that have been configured to connect to the selected tenant.
If you want to import information about all assets of all OSMP servers for all tenants, select All tenants.
- Click OK.
The asset information will be imported.
To import information about the assets of one OSMP server:
- Open the KUMA console and select the Settings → Open Single Management Platform section.
This opens the Kaspersky Open Management Platform integration by tenant window.
- Select the tenant for which you want to import assets.
This opens the Open Single Management Platform integration window.
- Click the connection for the relevant Kaspersky Security Center server.
This opens a window containing the settings of this connection to Kaspersky Security Center.
- Do one of the following:
- If you want to import all assets connected to the selected OSMP server, click the Import assets button.
- If you want to import only assets that are connected to a secondary server or included in one of the groups (for example, the Unassigned devices group), do the following:
- Click the Load hierarchy button.
- Select the check boxes next to the names of the secondary servers or groups from which you want to import asset information.
- Select the Import assets from new groups check box if you want to import assets from new groups.
If no check boxes are selected, information about all assets of the selected OSMP server is uploaded during the import.
- Click the Save button.
- Click the Import assets button.
The asset information will be imported.
Page topImporting asset information from MaxPatrol
You can import asset information from MaxPatrol network device scan reports into KUMA. The import is performed through the API using the maxpatrol-tool on the server where the KUMA Core is installed. Imported assets are displayed in the KUMA console in the Assets section. If necessary, you can edit the settings of assets.
The tool is included in the KUMA distribution kit and is located in the installer archive in the /kuma-ansible-installer/roles/kuma/files directory.
Imports from MaxPatrol 8 are supported.
To import asset information from a MaxPatrol report:
- In MaxPatrol, generate a network asset scan report in XML file format and copy the report file to the KUMA Core server. For more details about scan tasks and output file formats, refer to the MaxPatrol documentation.
Data cannot be imported from reports in SIEM integration file format. The XML file format must be selected.
- Create a file with the token for accessing the KUMA REST API. For convenience, it is recommended to place it into the MaxPatrol report folder. The file must not contain anything except the token.
Requirements imposed on accounts for which the API token is generated:
- Administrator or Analyst role.
- Access to the tenant into which the assets will be imported.
- Permissions for using API requests GET /users/whoami and POST /api/v1/assets/import have been configured.
To import assets from MaxPatrol, it is recommended to create a separate user with the minimum necessary set of rights to use API requests.
- Copy the maxpatrol-tool to the server hosting the KUMA Core and make the tool's file executable by running the following command:
chmod +x <path to the maxpatrol-tool file on the server hosting the KUMA Core> - Run the maxpatrol-tool:
./maxpatrol-tool --kuma-rest <KUMA REST API server address and port> --token <path and name of API token file> --tenant <name of tenant where assets will reside> <path and name of MaxPatrol report file> --cert <path to the KUMA Core certificate file>Example:
./maxpatrol-tool --kuma-rest example.kuma.com:7223 --token token.txt --tenant Main example.xml --cert /opt/kaspersky/kuma/core/certificates/ca.cert
You can use additional flags and commands for import operations. For example, the command --verbose, -v will display a full report on the received assets. A detailed description of the available flags and commands is provided in the table titled Flags and commands of maxpatrol-tool. You can also use the --help command to view information on the available flags and commands.
The asset information will be imported from the MaxPatrol report to KUMA. The console displays information on the number of new and updated assets.
Example: inserted 2 assets; updated 1 asset; errors occurred: [] |
The tool works as follows when importing assets:
- KUMA overwrites the data of assets imported through the API, and deletes information about their resolved vulnerabilities.
- KUMA skips assets with invalid data. Error information is displayed when using the
--verboseflag. - If there are assets with identical IP addresses and fully qualified domain names (FQDN) in the same MaxPatrol report, these assets are merged. The information about their vulnerabilities and software is also merged into one asset.
When uploading assets from MaxPatrol, assets that have equivalent IP addresses and fully qualified domain names (FQDN) that were previously imported from Kaspersky Security Center are overwritten.
To avoid this problem, you must configure range-based asset filtering by running the following command:
--ignore <IP address ranges> or -i <IP address ranges>Assets that satisfy the filtering criteria are not uploaded. For a description of this command, please refer to the table titled Flags and commands of maxpatrol-tool.
Flags and commands of maxpatrol-tool
Flags and commands |
Description |
|---|---|
|
Address (with the port) of KUMA Core server where assets will be imported. For example, Port 7223 is used for API requests by default. You can change the port if necessary. |
|
Path and name of the file containing the token used to access the REST API. This file must contain only the token. The Administrator or Analyst role must be assigned to the user account for which the API token is being generated. |
|
Name of the KUMA tenant in which the assets from the MaxPatrol report will be imported. |
|
This command uses DNS to enrich IP addresses with FQDNs from the specified ranges if the FQDNs for these addresses were not already specified. Example: |
|
Address of the DNS server that the tool must contact to receive FQDN information. Example: |
|
Address ranges of assets that should be skipped during import. Example: |
|
Output of the complete report on received assets and any errors that occurred during the import process. |
|
Get reference information on the tool or a command. Examples:
|
|
Get information about the version of the maxpatrol-tool. |
|
Creation of an autocompletion script for the specified shell. |
|
Path to the KUMA Core certificate. By default, the certificate is located in the folder with the application installed: /opt/kaspersky/kuma/core/certificates/ca.cert. |
Examples:
./maxpatrol-tool --kuma-rest example.kuma.com:7223 --token token.txt --tenant Main example.xml --cert /example-directory/ca.cert– import assets to KUMA from MaxPatrol report example.xml../maxpatrol-tool help—get reference information on the tool.
Possible errors
Error message |
Description |
|---|---|
must provide path to xml file to import assets |
The path to the MaxPatrol report file was not specified. |
incorrect IP address format |
Invalid IP address format. This error may arise when incorrect IP ranges are indicated. |
no tenants match specified name |
No suitable tenants were found for the specified tenant name using the REST API. |
unexpected number of tenants (%v) match specified name. Tenants are: %v |
KUMA returned more than one tenant for the specified tenant name. |
could not parse file due to error: %w |
Error reading the XML file containing the MaxPatrol report. |
error decoding token: %w |
Error reading the API token file. |
error when importing files to KUMA: %w |
Error transferring asset information to KUMA. |
skipped asset with no FQDN and IP address |
One of the assets in the report did not have an FQDN or IP address. Information about this asset was not sent to KUMA. |
skipped asset with invalid FQDN: %v |
One of the assets in the report had an incorrect FQDN. Information about this asset was not sent to KUMA. |
skipped asset with invalid IP address: %v |
One of the assets in the report had an incorrect IP address. Information about this asset was not sent to KUMA. |
KUMA response: %v |
An error occurred with the specified report when importing asset information. |
unexpected status code %v |
An unexpected HTTP code was received when importing asset information from KUMA. |
Importing asset information from KICS for Networks
After configuring KICS for Networks integration, tasks to obtain data about KICS for Networks assets are created automatically. This occurs:
- Immediately after creating a new integration.
- Immediately after changing the settings of an existing integration.
- According to a regular schedule every several hours. Every 12 hours by default. The schedule can be changed.
Account data update tasks can be created manually.
To start a task to update KICS for Networks asset data for a tenant:
- In the KUMA console, open the Settings → Kaspersky Industrial CyberSecurity for Networks section.
- Select the relevant tenant.
The Kaspersky Industrial CyberSecurity for Networks integration window opens.
- Click the Import assets button.
A task to receive account data from the selected tenant is added to the Task manager section of the KUMA console.
Page topExamples of asset field comparison during import
Each imported asset is compared to the matching KUMA asset.
Checking for two-field value match in the IP, MAC, and FQDN fields
Compared assets |
Compared fields |
||
|---|---|---|---|
FQDN |
IP |
MAC |
|
KUMA asset |
Filled in |
Filled in |
Empty |
Imported asset 1 |
Filled in, matching |
Filled in, matching |
Filled in |
Imported asset 2 |
Filled in, matching |
Filled in, matching |
Empty |
Imported asset 3 |
Filled in, matching |
Empty |
Filled in |
Imported asset 4 |
Empty |
Filled in, matching |
Filled in |
Imported asset 5 |
Filled in, matching |
Empty |
Empty |
Imported asset 6 |
Empty |
Empty |
Filled in |
Comparison results:
- Imported asset 1 and KUMA asset: the FQDN and IP fields are filled in and match, no conflict in the MAC fields between the two assets. The assets are merged.
- Imported asset 2 and KUMA asset: the FQDN and IP fields are filled in and match. The assets are merged.
- Imported asset 3 and KUMA asset: the FQDN and MAC fields are filled in and match, no conflict in the IP fields between the two assets. The assets are merged.
- Imported asset 4 and KUMA asset: the IP fields are filled in and match, no conflict in the FQDN and MAC fields between the two assets. The assets are merged.
- Imported asset 5 and KUMA asset: the FQDN fields are filled in and match, no conflict in the IP and MAC fields between the two assets. The assets are merged.
- Imported asset 6 and KUMA asset: no matching fields. The assets are not merged.
Checking for single-field value match in the IP, MAC, and FQDN fields
Compared assets |
Compared fields |
||
|---|---|---|---|
FQDN |
IP |
MAC |
|
KUMA asset |
Empty |
Filled in |
Empty |
Imported asset 1 |
Filled in |
Filled in, matching |
Filled in |
Imported asset 2 |
Filled in |
Filled in, matching |
Empty |
Imported asset 3 |
Filled in |
Empty |
Filled in |
Imported asset 4 |
Empty |
Empty |
Filled in |
Comparison results:
- Imported asset 1 and KUMA asset: the IP fields are filled in and match, no conflict in the FQDN and MAC fields between the two assets. The assets are merged.
- Imported asset 2 and KUMA asset: the IP fields are filled in and match, no conflict in the FQDN and MAC fields between the two assets. The assets are merged.
- Imported asset 3 and KUMA asset: no matching fields. The assets are not merged.
- Imported asset 4 and KUMA asset: no matching fields. The assets are not merged.
Assigning a category to an asset
To assign a category to one asset:
- In the KUMA console, go to the Assets section.
- Select the category with the relevant assets.
The assets table is displayed.
- Select an asset.
- In the opened window, click the Edit button.
- In the Categories field, click the button.
- Select a category.
If you want to move an asset to the Uncategorized assets section, you must delete the existing categories for the asset by clicking the
button. - Click the Save button.
The category will be assigned.
To assign a category to multiple assets:
- In the KUMA console, go to the Assets section.
- Select the category with the relevant assets.
The assets table is displayed.
- Select the check boxes next to the assets for which you want to change the category.
- Click the Link to category button.
- In the opened window, select a category.
- Click the Save button.
The category will be assigned.
Do not assign the Categorized assets category to assets.
Editing the parameters of assets
In KUMA, you can edit asset parameters. All the parameters of manually added assets can be edited. For assets imported from Kaspersky Security Center, you can only change the name of the asset and its category.
To change the parameters of an asset:
- In the Assets section of the KUMA web interface, click the asset that you want to edit.
The Asset details area opens in the right part of the window.
- Click the Edit button.
The Edit asset window opens.
- Make the changes you need in the available fields:
- Asset name (required) This is the only field available for editing if the asset was imported from Kaspersky Security Center or KICS for Networks.
- IP address and/or FQDN (required) You can specify multiple FQDNs separated by commas.
- MAC address
- Owner
- Software info:
- OS name
- OS build
- Hardware info:
- Custom fields.
- CII category.
- Assign or change the category of the asset:
- Click the button.
Select categories window opens.
- Select the check boxes next to the categories that should be assigned to the asset.
- Click Save.
The selected categories appear in the Categories fields.
You can also select the asset and then drag and drop it into the relevant category. This category will be added to the list of asset categories.
Do not assign the
Categorized assetscategory to assets. - Click the
- Click the Save button.
Asset parameters have been changed.
Page topArchiving assets
In KUMA, the archival functionality is available for the following types of assets:
- For assets imported from KSC and KICS.
If KUMA did not receive information about the asset, at the time of import, the asset is automatically archived and is stored in the database for the time specified in the Archived assets retention period setting. The default setting is 0 days. This means that archived assets are stored indefinitely. An archived asset becomes active if KUMA receives information about the asset from the source before the retention period for archived assets expires.
- Combined assets
When importing, KUMA performs a check for uniqueness among assets imported from KSC and KICS, and among manually added assets. If the fields of an imported asset and a manually added asset match, the assets are combined into a single asset, which is considered imported and can become archived.
Assets added manually in the console or using the API are not archived.
An asset becomes archived under the following conditions:
- KUMA did not receive information about the asset from Kaspersky Security Center or KICS for Networks.
- Disabled integration with Kaspersky Security Center.
If you disable integration with Kaspersky Security Center, the asset is considered active for 30 days. After 30 days, the asset is automatically archived and is stored in the database for the time specified in the Archived assets retention period.
An asset is not updated in the following cases:
- Information about the Kaspersky Security Center asset has not been updated for more than the retention period of archived assets.
- Information about the asset does not exist in Kaspersky Security Center or KICS for Networks.
- Connection with the Kaspersky Security Center server has not been established for more than 30 days.
To configure the archived assets retention period:
- In the KUMA web interface, select the Settings → Assets section.
This opens the Assets window.
- Enter the new value in the Archived assets retention period field.
The default setting is 0 days. This means that archived assets are stored indefinitely.
- Click Save.
The retention period for archived assets is configured.
Information about the archived asset remains available for viewing in the alert and incident card.
To view an archived asset card:
- In the KUMA web interface, select the Alerts or Incidents section.
A list of alerts or incidents is displayed.
- Open the alert or incident card linked to the archived asset.
You can view the information in the archived asset card.
Deleting assets
If you no longer need to receive information from an asset or information about the asset has not been updated for a long time, you can have KUMA delete the asset. Deletion is available to all roles except first line analyst. If an asset was deleted, but KUMA once again begins receiving information about that asset from Kaspersky Security Center, KUMA recreates the asset with a new ID.
In KUMA, you can delete assets in the following ways:
- Automatically.
KUMA automatically deletes only archived assets. KUMA deletes an archived asset if the information about the asset has not been updated for longer than the retention period of archived assets.
- Manually.
To delete an asset manually:
- In KUMA console, in the Assets section, click the asset that you want to delete.
This opens the Asset information window in the right-hand part of the console.
- Click the Delete button.
A confirmation window opens.
- Click OK.
The asset is deleted and no longer appears in the alert or incident card.
Page topUpdating third-party applications and fixing vulnerabilities on Kaspersky Security Center assets
You can update third-party applications (including Microsoft applications) that are installed on Kaspersky Security Center assets, and fix vulnerabilities in these applications.
First you need to create the Install required updates and fix vulnerabilities task on the selected Kaspersky Security Center Administration Server with the following settings:
- Application—Kaspersky Security Center.
- Task type—Install required updates and fix vulnerabilities.
- Devices to which the task will be assigned—you need to assign the task to the root administration group.
- Rules for installing updates:
- Install approved updates only.
- Fix vulnerabilities with a severity level equal to or higher than (optional setting).
If this setting is enabled, updates fix only those vulnerabilities for which the severity level set by Kaspersky is equal to or higher than the value selected in the list (Medium, High, or Critical). Vulnerabilities with a severity level lower than the selected value are not fixed.
- Scheduled start—the task run schedule.
For details on how to create a task, please refer to the Kaspersky Security Center Help Guide.
The Install required updates and fix vulnerabilities task is available with a Vulnerability and Patch Management license.
Next, you need to install updates for third-party applications and fix vulnerabilities on assets in KUMA.
To install updates and fix vulnerabilities in third-party applications on an asset in KUMA:
- Open the asset details window in one of the following ways:
- In the KUMA console, select Assets → select a category with the relevant assets → select an asset.
- In the KUMA console, select the Events section → search and filter events → select the relevant event → click the link in one of the following fields: SourceAssetID, DestinationAssetID, or DeviceAssetID.
- In the asset details window, expand the list of Kaspersky Security Center vulnerabilities.
- Select the check boxes next to the applications that you want to update.
- Click the Upload updates link.
- In the opened window, select the check box next to the ID of the vulnerability that you want to fix.
- If No is displayed in the EULA accepted column for the selected ID, click the Approve updates button.
- Click the link in the EULA URL column and carefully read the text of the End User License Agreement.
- If you agree to it, click Accept selected EULAs in the KUMA console.
The ID of the vulnerability for which the EULA was accepted shows Yes in the EULA accepted successfully column.
- Repeat steps 7–10 for each required vulnerability ID.
- Click OK.
Updates will be uploaded and installed on the assets managed by the Administration Server where the task was started, and on the assets of all secondary Administration Servers.
The terms of the End User License Agreement for updates and vulnerability patches must be accepted on each secondary Administration Server separately.
Updates are installed on assets where the vulnerability was detected.
You can update the list of vulnerabilities for an asset in the asset details window by clicking the Update link.
Page topMoving assets to a selected administration group
You can move assets to a selected administration group of Kaspersky Security Center. In this case, the group policies and tasks will be applied to the assets. For more details on Kaspersky Security Center tasks and policies, please refer to the Kaspersky Security Center Help Guide.
Administration groups are added to KUMA when the hierarchy is loaded during import of assets from Kaspersky Security Center. First, you need to configure KUMA integration with Kaspersky Security Center.
To move an asset to a selected administration group:
- Open the asset details window in one of the following ways:
- In the KUMA web interface, select Assets → select a category with the relevant assets → select an asset.
- In the KUMA web interface, select Alerts → click the link with the relevant alert → select the asset in the Related endpoints section.
- In the asset details window, click the Move to KSC group button.
- Click the Move to KSC group button.
- Select the group in the opened window.
The selected group must be owned by the same tenant as the asset.
- Click the Save button.
The selected asset will be moved.
To move multiple assets to a selected administration group:
- In the KUMA web interface, select the Assets section.
- Select the category with the relevant assets.
- Select the check boxes next to the assets that you want to move to the group.
- Click the Move to KSC group button.
The button is active if all selected assets belong to the same Administration Server.
- Select the group in the opened window.
- Click the Save button.
The selected assets will be moved.
You can see the specific group of an asset in the asset details.
Kaspersky Security Center assets information is updated in KUMA when information about assets is imported from Kaspersky Security Center. This means that a situation may arise when assets have been moved between administration groups in Kaspersky Security Center, but this information is not yet displayed in KUMA. When an attempt is made to move such an asset to an administration group in which it is already located, KUMA returns the Failed to move assets to another KSC group error.
Page topAsset audit
KUMA can be configured to generate asset audit events under the following conditions:
- Asset was added to KUMA. The application monitors manual asset creation, as well as creation during import via the REST API and during import from Kaspersky Security Center or KICS for Networks.
- Asset parameters have been changed. A change in the value of the following asset fields is monitored:
- Name
- IP address
- MAC address
- FQDN
- Operating system
Fields may be changed when an asset is updated during import.
- Asset was deleted from KUMA. The program monitors manual deletion of assets, as well as automatic deletion of assets imported from Kaspersky Security Center and KICS for Networks, whose data is no longer being received.
- Vulnerability info was added to the asset. The program monitors the appearance of new vulnerability data for assets. Information about vulnerabilities can be added to an asset, for example, when importing assets from Kaspersky Security Center or KICS for Networks.
- Asset vulnerability was resolved. The program monitors the removal of vulnerability information from an asset. A vulnerability is considered to be resolved if data about this vulnerability is no longer received from any sources from which information about its occurrence was previously obtained.
- Asset was added to a category. The program monitors the assignment of an asset category to an asset.
- Asset was removed from a category. The program monitors the deletion of an asset from an asset category.
By default, if asset audit is enabled, under the conditions described above, KUMA creates not only audit events (Type = 4), but also base events (Type = 1).
Asset audit events can be sent to storage or to correlators, for example.
Configuring an asset audit
To configure an asset audit:
- In the KUMA console, go to the Settings → Asset audit section.
- Perform one of the following actions with the tenant for which you want to configure asset audit:
- Add the tenant by using the Add tenant button if this is the first time you are configuring asset audit for the relevant tenant.
In the opened Asset audit window, select a name for the new tenant.
- Select an existing tenant in the table if asset audit has already been configured for the relevant tenant.
In the opened Asset audit window, the tenant name is already defined and cannot be edited.
- Clone the settings of an existing tenant to create a copy of the conditions configuration for the tenant for which you are configuring asset audit for the first time. To do so, select the check box next to the tenant whose configuration you need to copy and click Clone. In the opened Asset audit window, select the name of the tenant to use the copied configuration.
- Add the tenant by using the Add tenant button if this is the first time you are configuring asset audit for the relevant tenant.
- For each condition for generating asset audit events, select the destination to where the created events will be sent:
- In the settings block of the relevant type of asset audit events, use the Add destination drop-down list to select the type of destination to which the created events should be sent:
- Select Storage if you want events to be sent to storage.
- Select Correlator if you want events to be sent to the correlator.
- Select Other if you want to select a different destination.
This type of resource includes correlator and storage services that were created in previous versions of the program.
In the Add destination window that opens you must define the settings for event forwarding.
- Use the Destination drop-down list to select an existing destination or select Create if you want to create a new destination.
If you are creating a new destination, fill in the settings as indicated in the destination description.
- Click Save.
A destination has been added to the condition for generating asset audit events. Multiple destinations can be added for each condition.
- In the settings block of the relevant type of asset audit events, use the Add destination drop-down list to select the type of destination to which the created events should be sent:
- Click Save.
The asset audit has been configured. Asset audit events will be generated for those conditions for which destinations have been added. Click Save.
Page topStoring and searching asset audit events
Asset audit events are considered to be base events and do not replace audit events. Asset audit events can be searched based on the following parameters:
Event field |
Value |
DeviceVendor |
|
DeviceProduct |
|
DeviceEventCategory |
|
Enabling and disabling an asset audit
You can enable or disable asset audit for a tenant:
To enable or disable an asset audit for a tenant:
- In the KUMA console, open the Settings → Asset audit section and select the tenant for which you want to enable or disable an asset audit.
The Asset audit window opens.
- Select or clear the Disabled check box in the upper part of the window.
- Click Save.
By default, when asset audit is enabled in KUMA, when an audit condition occurs, two types of events are simultaneously created: a base event and an audit event.
You can disable the generation of base events with audit events.
To enable or disable the creation of base events for an individual condition:
- In the KUMA console, open the Settings → Asset audit section and select the tenant for which you want to enable or disable a condition for generating asset audit events.
The Asset audit window opens.
- Select or clear the Disabled check box next to the relevant conditions.
- Click Save.
For conditions with the Disabled check box selected, only audit events are created, and base events are not created.
Page topCustom asset fields
In addition to the existing fields of the asset data model, you can create custom asset fields. Data from the custom asset fields is displayed when you view information about the asset. Custom fields can be filled in with data either manually or using the API.
You can create or edit the custom fields in the KUMA console in the Settings → Assets section, in the Custom fields table. The table has the following columns:
- Name – the name of the custom field that is displayed when you view information about the asset.
- Default value – the value that is written to the custom field when an asset is added to KUMA.
- Mask – a regular expression to which the value in the custom field must match.
To create a custom asset field:
- In the KUMA console, in the Settings → Assets section, click Add field.
An empty row is added to the Custom fields table. You can add multiple rows with the custom field settings at once.
- Fill in the columns with the settings of the custom field:
- Name (required)–from 1 to 128 characters in Unicode encoding.
- Default value–from 1 to 1,024 Unicode characters.
- Mask–from 1 to 1,024 Unicode characters.
- Click Save.
A custom field is added to the asset data model.
To delete or edit a custom asset field:
- In the KUMA console, go to the Settings → Assets section.
- Make the necessary changes in the Custom fields table:
- To delete a custom field, click the icon next to the row with the settings of the required field. Deleting a field also deletes the data written in this field for all assets.
- You can change the values of the field settings. Changing the default value does not affect the data written in the asset fields before.
- To change the display order of the fields, drag the lines with the mouse by the .
- To delete a custom field, click the
- Click Save.
The changes are made.
Page topCritical information infrastructure assets
In KUMA, you can tag assets related to the critical information infrastructure (CII) of the Russian Federation. This allows you to restrict the KUMA users capabilities to handle alerts and incidents, which are associated with the assets related to the CII objects.
You can assign the CII category to assets if the license with the GosSOPKA module is active in KUMA.
General administrators and users with the Access to CII facilities check box selected in their profiles can assign the CII category to an asset. If none of these conditions are met, the following restrictions apply to the user:
- The CII category group of settings is not displayed in the Asset details and Edit asset windows. You cannot view or change the CII category of an asset.
- Alerts and incidents associated with the assets of the CII category are not available for viewing. You cannot perform any actions on such alerts and incidents; they are not displayed in the table of alerts and incidents.
- The CII column is not displayed in the Alerts and Incidents tables.
- Search and closing of the alerts using the REST API is not available.
The CII category of an asset is displayed in the Asset details window in the CII category group of settings.
To change the CII category of an asset:
- In the KUMA console, in the Assets section, select the relevant asset.
The Asset details window opens.
- Click the Edit button and select one of the available values in the drop-down list:
- Information resource is not a CII object – default value, indicating that the asset does not have a CII category. The users with the Access to CII facilities check box cleared in their profiles can work with such assets and the alerts and incidents related to these assets.
- CII object without importance category.
- CII object of the third importance category.
- CII object of the second importance category.
- CII object of the first importance category.
- Click Save.
Integration with other solutions
In this section, you'll learn how to integrate KUMA with other solutions to enrich its functionality.
Integration with Kaspersky Security Center
You can create or edit Kaspersky Security Center integration settings in the OSMP console.
In the KUMA console, you can view the integration with selected Kaspersky Security Center servers for one, several, or all KUMA tenants. If integration with Kaspersky Security Center is enabled, you can manually import assets, edit the automatic scheduled import interval, view the hierarchy of Kaspersky Security Center servers, or temporarily disable scheduled import.
Configuring the data refresh interval for Kaspersky Security Center assets
To configure the data refresh interval for asset data from Kaspersky Security Center:
- Open the KUMA console and select Settings → Kaspersky Security Center.
This opens the Kaspersky Security Center integration window.
- In the Tenant drop-down list, select the tenant for which you want to configure data refresh settings.
- In the Data refresh interval in hours field, specify the time interval at which KUMA updates data about Kaspersky Security Center devices.
The interval is specified in hours and must be an integer.
The default time interval is 12 hours.
- Click the Save button.
Kaspersky Security Center asset data update settings for the selected tenant are configured.
If the tenant you want is missing from the list of tenants, use the OSMP console to add it to the list of tenants.
Page topScheduled import of Kaspersky Security Center assets
To set up a schedule for importing Kaspersky Security Center assets:
- Open the KUMA console and select Settings → Kaspersky Security Center.
This opens the Kaspersky Security Center integration window.
- Select the tenant for which you want to schedule the import of Kaspersky Security Center assets.
The Kaspersky Security Center integration window opens.
- If necessary, clear the Disabled check box to enable integration with Kaspersky Security Center for the selected tenant. This check box is cleared by default.
If you want to temporarily disable integration with Kaspersky Security Center for the selected tenant, select the Disabled check box. This turns off the scheduled import of Kaspersky Security Center assets.
- In the Data refresh interval field, specify the time interval at which you want KUMA to update information about Kaspersky Security Center devices.
The interval is specified in hours and must be an integer.
The default time interval is 12 hours.
- Click the Save button.
The specified settings for the scheduled import of Kaspersky Security Center assets for the selected tenant are applied.
Page topManual import of Kaspersky Security Center assets
To manually import Kaspersky Security Center assets:
- Open the KUMA console and select Settings → Kaspersky Security Center.
This opens the Kaspersky Security Center integration window.
- In the Tenant drop-down list, select the tenant for which you want to manually import Kaspersky Security Center assets.
The Connection parameters window opens.
- In the Connection parameters window:
- For the Disabled check box, do one of the following:
- Clear the check box if you want to enable integration with Kaspersky Security Center for the selected tenant.
- Select the check box if you want to disable integration with Kaspersky Security Center for the selected tenant.
This check box is cleared by default.
- If you want to import assets from new groups created in Kaspersky Security Center, select the Import assets from new groups check box.
- For the Disabled check box, do one of the following:
- Click Import KSC assets.
- Click Save.
Kaspersky Security Center assets for the specified tenant are imported regardless of the configured schedule.
Page topViewing the hierarchy of Kaspersky Security Center servers
To view the hierarchy of Kaspersky Security Center servers:
- Open the KUMA console and select Settings → Kaspersky Security Center.
This opens the Kaspersky Security Center integration window.
- In the Tenant drop-down list, select the tenant for which you want to view the hierarchy.
The Connection parameters window opens.
- In the Connection parameters window, click Load hierarchy.
The hierarchy of Kaspersky Security Center servers for the specified tenant is displayed in the Connection parameters window.
Page topImporting events from the Kaspersky Security Center database
In KUMA, you can receive events from the Kaspersky Security Center SQL database. Events are received using the collector, which uses the following resources:
- Predefined connector: [OOTB] KSC MSSQL or [OOTB] KSC MySQL.
- Predefined [OOTB] KSC from SQL normalizer.
Configuring the import of events from Kaspersky Security Center involves the following steps:
- Create a copy of the predefined connector.
The settings of the predefined connector are not editable, therefore, to configure the connection to the database server, you must create a copy of the predefined connector.
- Creating a collector:
- In the web interface.
- On the server.
To configure the import of events from Kaspersky Security Center:
- Create a copy of the predefined connector corresponding to the type of database used by Kaspersky Security Center:
- In the KUMA console, in the Resources → Connectors section, find the relevant predefined connector in the folder hierarchy, select the check box next to that connector, and click Duplicate.
- This opens the Create connector window; in that window, on the Basic settings tab, in the Default query field, if necessary, replace the KAV database name with the name of the Kaspersky Security Center database you are using.
An example of a query to the Kaspersky Security Center SQL database
- Place the cursor in the URL field and in the displayed list, click
 in the line of the secret that you are using.
 - This opens the Secret window; in that window, in the URL field, specify the server connection address in the following format:
sqlserver://user:password@kscdb.example.com:1433/databasewhere:
user—user account with public and db_datareader rights to the required database.password—user account password.kscdb.example.com:1433—address and port of the database server.database—name of the Kaspersky Security Center database. 'KAV' by default.
Click Save.
- In the Create connector window, in the Connection section, in the Query field, replace the 'KAV' database name with the name of the Kaspersky Security Center database you are using.
You must do this if you want to use the ID column to which the query refers.
Click Save.
- Install the collector in the web interface:
- Start the Collector Installation Wizard in one of the following ways:
- In the KUMA console, in the Resources section, click Add event source.
- In the KUMA console, in the Resources → Collectors section, click Add collector.
- At step 1 of the installation wizard, Connect event sources, specify the collector name and select the tenant.
- At step 2 of the installation wizard, Transport, select the copy of the connector that you created at step 1.
- At step 3 of the installation wizard, Event parsing, on the Parsing schemes tab, click Add event parsing.
- This opens the Basic event parsing window; in that window, on the Normalization scheme tab, select [OOTB] KSC from SQL in the Normalizer drop-down list and click OK.
- If necessary, specify the other settings in accordance with your requirements for the collector. For the purpose of importing events, editing settings at the remaining steps of the Installation Wizard is optional.
- At step 8 of the installation wizard, Setup validation, click Create and save service.
The lower part of the window displays the command that you must use to install the collector on the server. Copy this command to the clipboard.
- Close the Collector Installation Wizard by clicking Save collector.
- Start the Collector Installation Wizard in one of the following ways:
- Install the collector on the server.
To do so, on the server on which you want to receive Kaspersky Security Center events, run the command that you copied to the clipboard after creating the collector in the web interface.
As a result, the collector is installed and can receive events from the SQL database of Kaspersky Security Center.
You can view Kaspersky Security Center events in the Events section of the web interface.
Page topKaspersky Endpoint Detection and Response integration
Kaspersky Endpoint Detection and Response (hereinafter also referred to as "KEDR") is a functional unit of Kaspersky Anti Targeted Attack Platform that protects assets in an enterprise LAN.
You can configure KUMA integration with Kaspersky Endpoint Detection and Response to manage threat response actions on assets connected to Kaspersky Endpoint Detection and Response servers, and on Kaspersky Security Center assets. Commands to perform operations are received by the Kaspersky Endpoint Detection and Response server, which then relays those commands to the Kaspersky Endpoint Agent installed on assets.
You can also import events to KUMA and receive information about Kaspersky Endpoint Detection and Response alerts (for more details about alerts, see the Configuring integration with an SIEM system section of the Kaspersky Anti Targeted Attack Platform Online Help).
When KUMA is integrated with Kaspersky Endpoint Detection and Response, you can perform the following operations on Kaspersky Endpoint Detection and Response assets that have Kaspersky Endpoint Agent:
- Manage network isolation of assets.
- Manage prevention rules.
- Start applications.
To get instructions on configuring integration for response action management, contact your account manager or Technical Support.
Importing Kaspersky Endpoint Detection and Response events using the kafka connector
When importing events from Kaspersky Endpoint Detection and Response, telemetry is transmitted in clear text and may be intercepted by an intruder.
Kaspersky Endpoint Detection and Response 4.0, 4.1, 5.0, and 5.1 events can be imported to KUMA using a Kafka connector.
Several limitations are applicable to the import of events from Kaspersky Endpoint Detection and Response 4.0 and 4.1:
- Import of events is available if the KATA and KEDR license keys are used in Kaspersky Endpoint Detection and Response.
- Import of events is not available if the Sensor component installed on a separate server is used as part of Kaspersky Endpoint Detection and Response.
To import events, perform the actions in Kaspersky Endpoint Detection and Response and in KUMA.
Importing events from Kaspersky Endpoint Detection and Response 4.0 or 4.1
To import Kaspersky Endpoint Detection and Response 4.0 or 4.1 events to KUMA:
In Kaspersky Endpoint Detection and Response:
- Use SSH or a terminal to log in to the management console of the Central Node server from which you want to export events.
- When prompted by the system, enter the administrator account name and the password that was set during installation of Kaspersky Endpoint Detection and Response.
The program component administrator menu is displayed.
- In the program component administrator menu, select Technical Support Mode.
- Press Enter.
The Technical Support Mode confirmation window opens.
- Confirm that you want to operate the application in Technical Support Mode. To do so, select Yes and press Enter.
- Run the following command:
sudo -i - In the
/etc/sysconfig/apt-servicesconfiguration file, in theKAFKA_PORTSfield, delete the value10000.If Secondary Central Node servers or the Sensor component installed on a separate server are connected to the Central Node server, you need to allow the connection with the server where you modified the configuration file via port 10000.
We do not recommend using this port for any external connections other than KUMA. To restrict connections over port 10000 only for KUMA, run the following command:
iptables -I INPUT -p tcp ! -s KUMA_IP_address --dport 10000 -j DROP - In the configuration file
/usr/bin/apt-start-sedr-iptablesadd the value10000in theWEB_PORTSfield, separated by a comma without a space. - Run the following command:
sudo sh /usr/bin/apt-start-sedr-iptables
Preparations for exporting events on the Kaspersky Endpoint Detection and Response side are now complete.
In KUMA:
- On the KUMA server, add the IP address of the Central Node server in the format
<IP address> centralnodeto one of the following files:%WINDIR%\System32\drivers\etc\hosts—for Windows./etc/hosts file—for Linux.
- In the KUMA web interface, create a connector of the Kafka type.
When creating a connector, specify the following parameters:
- In the URL field, specify
<Central Node server IP address>:10000. - In the Topic field, specify
EndpointEnrichedEventsTopic. - In the Consumer group field, specify any unique name.
- In the URL field, specify
- In the KUMA web interface, create a collector.
Use the connector created at the previous step as the transport for the collector. Use "[OOTB] KEDR telemetry" as the normalizer for the collector.
If the collector is successfully created and installed, Kaspersky Endpoint Detection and Response events will be imported into KUMA. You can find and view these events in the events table.
Importing events from Kaspersky Endpoint Detection and Response 5.0 and 5.1
Several limitations apply when importing events from Kaspersky Endpoint Detection and Response 5.0 and 5.1:
- Import of events is available only for the non-high-availability version of Kaspersky Endpoint Detection and Response.
- Import of events is available if the KATA and KEDR license keys are used in Kaspersky Endpoint Detection and Response.
- Import of events is not available if the Sensor component installed on a separate server is used as part of Kaspersky Endpoint Detection and Response.
To import Kaspersky Endpoint Detection and Response 5.0 or 5.1 events to KUMA:
In Kaspersky Endpoint Detection and Response:
- Use SSH or a terminal to log in to the management console of the Central Node server from which you want to export events.
- When prompted by the system, enter the administrator account name and the password that was set during installation of Kaspersky Endpoint Detection and Response.
The program component administrator menu is displayed.
- In the program component administrator menu, select Technical Support Mode.
- Press Enter.
The Technical Support Mode confirmation window opens.
- Confirm that you want to operate the application in Technical Support Mode. To do so, select Yes and press Enter.
- In the
/usr/local/lib/python3.8/dist-packages/firewall/create_iptables_rules.pyconfiguration file, specify the additional port10000for theWEB_PORTSconstant:WEB_PORTS = f'10000,80,{AppPort.APT_AGENT_PORT},{AppPort.APT_GUI_PORT}'You do not need to perform this step for Kaspersky Endpoint Detection and Response 5.1 because the port is specified by default. - Run the following commands:
kata-firewall stopkata-firewall start --cluster-subnet <network mask for addressing cluster servers>
Preparations for exporting events on the Kaspersky Endpoint Detection and Response side are now complete.
In KUMA:
- On the KUMA server, add the IP address of the Central Node server in the format
<IP address> kafka.services.external.dyn.katato one of the following files:%WINDIR%\System32\drivers\etc\hosts—for Windows./etc/hosts file—for Linux.
- In the KUMA web interface, create a connector of the Kafka type.
When creating a connector, specify the following parameters:
- In the URL field, specify
<Central Node server IP address>:10000. - In the Topic field, specify
EndpointEnrichedEventsTopic. - In the Consumer group field, specify any unique name.
- In the URL field, specify
- In the KUMA web interface, create a collector.
Use the connector created at the previous step as the transport for the collector. It is recommended to use the [OOTB] KEDR telemetry normalizer as the normalizer for the collector.
If the collector is successfully created and installed, Kaspersky Endpoint Detection and Response events will be imported into KUMA. You can find and view these events in the events table.
Page topImporting Kaspersky Endpoint Detection and Response events using the kata/edr connector
Importing Kaspersky Endpoint Detection and Response events from hosts using the 'kata/edr' connector involves the following steps:
- Performing configuration the KUMA side to receive events.
To do this, in KUMA, you must create and install a collector with the 'kata/edr' connector or edit an existing collector, then save the modified settings and restart the collector.
- Accepting the KUMA authorization request on the KEDR side to begin sending events to KUMA.
As a result, the integration is configured and KEDR events start arriving in KUMA.
Creating a collector for receiving events from KEDR
To create a collector for receiving events from KEDR:
- Log in to the KUMA console. You can do so in one of the following ways:
- In the main menu of the OSMP console, go to Settings → KUMA.
- In your browser, go to
https://kuma.<smp_domain>:7220.
- Go to Resources→Collectors, select Add collector.
- This opens the Create collector window; in that window, at step 1 "Connect event sources", specify an arbitrary collector name and in the drop-down list, select the appropriate tenant.
- At step 2 "Transport", do the following:
- On the Basic settings tab:
- In the Connector field, select Create or start typing the name of the connector if you want to use a previously created connector.
- In the Connector type drop-down list, select the kata/edr connector.
After you select the kata/edr connector type, more fields to fill in are displayed.
- In the URL field, specify the address for connecting to the KEDR server in the following <
name or IP address of the host>:<connection port, 443 by default> format. If KEDR is deployed in a cluster, you can click Add to add all nodes. KUMA will connect to each specified node in sequence. If KEDR is installed in a distributed configuration, on the KUMA side, you must configure a separate collector for each KEDR server. - In the Secret field, select Create to create a new secret. This opens the Create secret window; in that window, specify the name of the secret and click Generate and download a certificate and private encryption key.
As a result, the certificate.zip archive is downloaded to the browser's Downloads folder; the archive contains the 'key.pem' key file and the 'cert.pem' certificate file. Unpack the archive.
In the KUMA console, click Upload certificate and select the cert.pem file. Click Upload private key and select the key.pem file. Click Create; the secret is added to the Secret drop-down list is automatically selected.
You can also select the created secret from the Secret list. KUMA uses the selected secret to connect to KEDR.
- The External ID field contains the ID for external systems. This ID is displayed in the KEDR web interface when authorizing the KUMA server. KUMA generates an ID automatically and the External ID field is automatically pre-populated.
- If necessary, specify the settings on the Advanced settings tab:
- To get detailed information in the collector log, move the Debug toggle switch to the enabled position.
- In the Character encoding field, select the encoding of the source data to be converted to UTF-8. We only recommend configuring a conversion if you find invalid characters in the fields of the normalized event. By default, no value is selected.
- Specify the maximum Number of events per one request to KEDR. The default value is 0. This means that the value configured on the KEDR server as the default is applied (for details, please refer to the KATA Help). You can specify an arbitrary value that must not exceed the value on the KEDR side. If the value you specify exceeds the value of the Maximum number of events setting specified on the KEDR server, the KUMA collector log will display the error "Bad Request: max_events N is greater than the allowed value".
- Fill in the Events fetch timeout field to receive events after a specified period of time. The default value is 0. This means that the value configured on the KEDR server as the default is applied (for details, please refer to the KATA Help).
The KEDR server uses two parameters: the maximum number of events and the events fetch timeout. Events are sent when the specified number of events is collected or the configured time elapses, whichever happens first. If the specified time has elapsed, but the specified number of events has not been collected, the KEDR server sends the events that it already has, without waiting for more.
- In the Client timeout field, specify how long KUMA must wait for a response from the KEDR server, in seconds. Default value: 1,800 s; displayed as 0. The client-side limit is specified in the Client timeout field. The Client timeout must be greater than the server value Events fetch timeout to wait for the server's response without interrupting the current event collection task with a new request. If the response from the KEDR server does not arrive in the end, KUMA repeats the request.
- In the KEDRQL filter field, specify the conditions for filtering the request. As a result, pre-filtered events are received from KEDR. For details about available filter fields, please refer to the KATA Help.
- On the Basic settings tab:
- At step 3 "Parsing", click Add event parsing and select "[ООТВ] KEDR telemetry" in the Basic event parsing window.
- To finish creating the collector in the web interface, click Create and save service. Then copy the collector installation command from the web interface and run this installation command on the command line on the KUMA destination host where you want to install the collector.
Example of a command to install the collector:
sudo /opt/kaspersky/kuma/kuma collector --core https://<KUMA Core server FQDN>:7210 --id <service ID copied from the KUMA Console> --api.port <port used for communication with the installed component>The default fully qualified domain name of the KUMA Core is
kuma.<smp_domain>. The port used for connecting to the KUMA Core cannot be changed. The default port number is 7210.If you were editing an existing collector, click Save and restart services.
As a result, the collector is created and is ready to send requests. The collector is displayed in the Resources → Active services section with the yellow status until KEDR accepts an authorization request from KUMA.
Authorizing KUMA on the KEDR side
After the collector is created in KUMA, for requests from KUMA to start arriving to KEDR, the KUMA authorization request must be accepted on the KEDR side. With the authorization request accepted, the KUMA collector automatically sends scheduled requests to KEDR and waits for a response. While waiting, the status of the collector is yellow, and after receiving the first response to a request, the status of the collector turns green.
As a result, the integration is configured and you can view events arriving from KEDR in the KUMA → Events section.
The initial request fetches part of the historical events that had occurred before the integration was configured. Current events begin arriving after all of the historical events. If you change the value of the URL setting or the External ID of an existing collector, KEDR treats the next request as an initial request, and after starting the KUMA collector with the modified settings, you will receive part of the historical events all over again. If you do not want to receive historical events, go to the settings of the relevant collector, configure the mapping of the KEDR and KUMA timestamp fields in the normalizer, and specify a filter by timestamp at the 'Event filtering' step of the collector installation wizard — the timestamp of the event must be greater than the timestamp when the collector is started.
Possible errors and solutions
If in the collector log, you see the "Conflict: An external system with the following ip and certificate digest already exists. Either delete it or provide a new certificate" error, create a new secret with the a certificate in the connector of the collector.
If in the collector log, you see the "Continuation token not found" error in response to an event request, create a new connector, attach it to the collector and restart the collector; alternatively, create a new secret with a new certificate in the connector of the collector. If you do not want to receive events generated before the error occurred, configure a timestamp filter in the collector.
Configuring the display of a link to a Kaspersky Endpoint Detection and Response detection in the KUMA alert
When Kaspersky Endpoint Detection and Response detections are received, KUMA creates an alert for each detection. You can configure the display of a link to a Kaspersky Endpoint Detection and Response detection in KUMA alert information.
You can configure the display of a detection link if you use only one Central Node server in Kaspersky Endpoint Detection and Response. If Kaspersky Endpoint Detection and Response is used in a distributed solution mode, it is impossible to configure the display of the links to Kaspersky Endpoint Detection and Response detections in KUMA.
To configure the display of a link to a detection in KUMA alert details, you need to complete steps in the Kaspersky Endpoint Detection and Response web interface and KUMA.
In the Kaspersky Endpoint Detection and Response web interface, you need to configure the integration of the application with KUMA as a SIEM system. For details on configuring integration, refer to the Kaspersky Anti Targeted Attack Platform documentation, Configuring integration with a SIEM system section.
Configuring the display of a link in the KUMA web interface includes the following steps:
- Adding an asset that contains information about the Kaspersky Endpoint Detection and Response Central Node server from which you want to receive detections, and assigning a category to that asset.
- Creating a correlation rule.
- Creating a correlator.
You can use a pre-configured correlation rule. In this case configuring the display of a link in the KUMA web interface includes the following steps:
- Creating a correlator.
Select the
[OOTB] KATA Alertcorrelation rule. - Adding an asset that contains information about the Kaspersky Endpoint Detection and Response Central Node server from which you want to receive detections and assigning a category
KATA standAloneto that asset.
Step 1. Adding an asset and assigning a category to it
First, you need to create a category that will be assigned to the asset being added.
To add a category:
- In the KUMA web interface, select the Assets section.
- On the All assets tab, expand the category list of the tenant by clicking
 next to its name.
 - Select the required category or subcategory and click the Add category button.
The Add category details area appears in the right part of the web interface window.
- Define the category settings:
- In the Name field, enter the name of the category.
- In the Parent field, indicate the position of the category within the categories tree hierarchy. To do so, click the button and select a parent category for the category you are creating.
Selected category appears in Parent fields.
- If required, define the values for the following settings:
- Assign a severity to the category in the Priority drop-down list.
The specified severity is assigned to correlation events and alerts associated with the asset.
- If required, add a description for the category in the Description field.
- In the Categorization kind drop-down list, select how the category will be populated with assets. Depending on your selection, you may need to specify additional settings:
- Manually—assets can only be manually linked to a category.
- Active—assets will be assigned to a category at regular intervals if they satisfy the defined filter.
- Reactive—the category will be filled with assets by using correlation rules.
- Assign a severity to the category in the Priority drop-down list.
- Click the Save button.
To add an asset:
- In the KUMA web interface, select the Assets section.
- Click the Add asset button.
The Add asset details area opens in the right part of the window.
- Define the following asset parameters:
- In the Asset name field, enter an asset name.
- In the Tenant drop-down list, select the tenant that will own the asset.
- In the IP address field, specify the IP address of the Kaspersky Endpoint Detection and Response Central Node server from which you want to receive detections.
- In the Categories field, select the category that you added in the previous step.
If you are using a predefined correlation rule, you need to select the
KATA standAlonecategory. - If required, define the values for the following fields:
- In the FQDN field, specify the Fully Qualified Domain Name of the Kaspersky Endpoint Detection and Response server.
- In the MAC address field, specify the MAC address of the Central Node Kaspersky Endpoint Detection and Response Central Node server.
- In the Owner field, define the name of the asset owner.
- Click the Save button.
Step 2. Adding a correlation rule
To add a correlation rule:
- In the KUMA web interface, select the Resources section.
- Select Correlation rules and click the Create correlation rule button.
- On the General tab, specify the following settings:
- In the Name field, define the rule name.
- In the Type drop-down list, select simple.
- In the Propagated fields field, add the following fields: DeviceProduct, DeviceAddress, EventOutcome, SourceAssetID, DeviceAssetID.
- If required, define the values for the following fields:
- In the Rate limit field, define the maximum number of times per second that the rule will be triggered.
- In the Severity field, define the severity of alerts and correlation events that will be created as a result of the rule being triggered.
- In the Description field, provide any additional information.
- On the Selectors → Settings tab, specify the following settings:
- In the Filter drop-down list, select Create new.
- In the Conditions field, click the Add group button.
- In the operator field for the group you added, select AND.
- Add a condition for filtering by KATA value:
- In the Conditions field, click the Add condition button.
- In the condition field, select If.
- In the Left operand field, select Event field.
- In the Event field field, select DeviceProduct.
- In the operator field, select =.
- In the Right operand field, select constant.
- In the value field, enter KATA.
- Add a category filter condition:
- In the Conditions field, click the Add condition button.
- In the condition field, select If.
- In the Left operand field, select Event field.
- In the Event field field, select DeviceAssetID.
- In the operator field, select inCategory.
- In the Right operand field, select constant.
- Click the button.
- Select the category in which you placed the Kaspersky Endpoint Detection and Response Central Node server asset.
- Click the Save button.
- In the Conditions field, click the Add group button.
- In the operator field for the group you added, select OR.
- Add a condition for filtering by event class identifier:
- In the Conditions field, click the Add condition button.
- In the condition field, select If.
- In the Left operand field, select Event field.
- In the Event field field, select DeviceEventClassID.
- In the operator field, select =.
- In the Right operand field, select constant.
- In the value field, enter taaScanning.
- Repeat steps 1–7 in F for each of the following event class IDs:
- file_web.
- file_mail.
- file_endpoint.
- file_external.
- ids.
- url_web.
- url_mail.
- dns.
- iocScanningEP.
- yaraScanningEP.
- On the Actions tab, specify the following settings:
- In the Actions section, open the On every event drop-down list.
- Select the Output check box.
- In the Enrichment section, click the Add enrichment button.
- In the Source kind drop-down list, select template.
- In the Template field, enter https://{{.DeviceAddress}}:8443/katap/#/alerts?id={{.EventOutcome}}.
- In the Target field drop-down list, select DeviceExternalID.
- If necessary, turn on the Debug toggle switch to log information related to the operation of the resource.
- Click the Save button.
Step 3. Creating a correlator
You need to launch the correlator installation wizard. At step 3 of the wizard, you are required to select the correlation rule that you added by following this guide.
After the correlator is created, a link to these detections will be displayed in the details of alerts created when receiving detections from Kaspersky Endpoint Detection and Response. The link is displayed in the correlation event details (Threat hunting section), in the DeviceExternalID field.
If you want the FQDN of the Kaspersky Endpoint Detection and Response Central Node server to be displayed in the DeviceHostName field, in the detection details, you need to create a DNS record for the server and create a DNS enrichment rule at step 4 of the wizard.
Page topIntegration with Kaspersky CyberTrace
Kaspersky CyberTrace (hereinafter CyberTrace) is a tool that integrates threat data streams with SIEM solutions. It provides users with instant access to analytics data, increasing their awareness of security decisions.
You can integrate CyberTrace with KUMA in one of the following ways:
- Integrate CyberTrace indicator search feature to enrich KUMA events with information from CyberTrace data streams.
- Integrate the entire CyberTrace web interface into KUMA to get full access to CyberTrace.
CyberTrace console integration is available only if your CyberTrace license includes multi-user feature.
Integrating CyberTrace indicator search
To integrate CyberTrace indicator search:
- Configure CyberTrace to receive and process KUMA requests.
You can configure the integration with KUMA immediately after installing CyberTrace in the Quick Start Wizard or later in the CyberTrace web interface.
- Create an event enrichment rule in KUMA.
In the enrichment rule, you can specify which data from CyberTrace you want to enrich the event with.
- Create a collector to receive events that you want to enrich with CyberTrace data.
- Link the enrichment rule to the collector.
- Save and create the service:
- If you linked the rule to a new collector, click Save and create, copy the collector ID in the opened window and use the copied ID to install the collector on the server using the command line interface.
- If you linked the rule to an existing collector, click Save and restart services to apply the settings.
The configuration of the integration of CyberTrace indicator search is complete and KUMA events will be enriched with CyberTrace data.
Example of testing CyberTrace data enrichment.
Configuring CyberTrace to receive and process requests
You can configure CyberTrace to receive and process requests from KUMA immediately after its installation in the Quick Start Wizard or later in the program web interface.
To configure CyberTrace to receive and process requests in the Quick Start Wizard:
- Wait for the CyberTrace Quick Start Wizard to start after the program is installed.
The Welcome to Kaspersky CyberTrace window opens.
- In the <select SIEM> drop-down list, select the type of SIEM system from which you want to receive data and click the Next button.
The Connection Settings window opens.
- Do the following:
- In the Service listens on settings block, select the IP and port option.
- In the IP address field, enter
0.0.0.0. - In the Port field, enter the port for receiving events, the default port is
9999. - Under Service sends events to, specify
127.0.0.1in the IP address or hostname field and in the Port field, specify9998.Leave the default values for everything else.
- Click Next.
The Proxy Settings window opens.
- If a proxy server is being used in your organization, define the settings for connecting to it. If not, leave all the fields blank and click Next.
The Licensing Settings window opens.
- In the Kaspersky CyberTrace license key field, add a license key for CyberTrace.
- In the Kaspersky Threat Data Feeds certificate field, add a certificate that allows you to download updated data feeds from servers, and click Next.
CyberTrace will be configured.
To configure CyberTrace to receive and process requests in the program web interface:
- In the CyberTrace web interface, select Settings – Service.
- In the Connection Settings block:
- Select the IP and port option.
- In the IP address field, enter
0.0.0.0. - In the Port field, specify the port for receiving events, the default port is
9999.
- In the Web interface settings block, in the IP address or hostname field, enter
127.0.0.1. - In the upper toolbar, click Restart the CyberTrace Service.
- Select Settings – Events format.
- In the Alert events format field, enter
%Date% alert=%Alert%%RecordContext%. - In the Detection events format field, enter
Category=%Category%|MatchedIndicator=%MatchedIndicator%%RecordContext%. - In the Records context format field, enter
|%ParamName%=%ParamValue%. - In the Actionable fields context format field, enter
%ParamName%:%ParamValue%.
CyberTrace will be configured.
After updating CyberTrace configuration you have to restart the CyberTrace server.
Page topCreating event Enrichment rules
To create event enrichment rules:
- In the KUMA console, open the Resources → Enrichment rules section and in the left part of the window, select or create a folder for the new rule.
The list of available enrichment rules will be displayed.
- Click Add enrichment rule to create a new rule.
The enrichment rule window will be displayed.
- Enter the rule configuration parameters:
- In the Name field, enter a unique name for the rule. The name must contain 1 to 128 Unicode characters.
- In the Tenant drop-down list, select the tenant that will own this resource.
- In the Source kind drop-down list, select cybertrace.
- Specify the URL of the CyberTrace server to which you want to connect. For example, example.domain.com:9999.
- If necessary, use the Number of connections field to specify the maximum number of connections to the CyberTrace server that can be simultaneously established by KUMA. By default, this value is equal to the number of vCPUs of the KUMA Core server.
- In the RPS field, enter the number of requests to the CyberTrace server per second that KUMA can make. The default value is
1000. - In the Timeout field, specify the maximum number of seconds KUMA should wait for a response from the CyberTrace server. Until a response is received or the time expires, the event is not sent to the Correlator. If a response is received before the timeout, it is added to the
TIfield of the event and the event processing continues. The default value is30. - In the Mapping settings block, you must specify the fields of events to be checked via CyberTrace, and define the rules for mapping fields of KUMA events to CyberTrace indicator types:
- In the KUMA field column, select the field whose value must be sent to CyberTrace.
- In the CyberTrace indicator column, select the CyberTrace indicator type for every field you selected:
- ip
- url
- hash
You must provide at least one string to the table. You can use the Add row button to add a string, and can use the
button to remove a string. - Use the Debug drop-down list to indicate whether or not to enable logging of service operations. Logging is disabled by default.
- If necessary, in the Description field, add up to 4,000 Unicode characters describing the resource.
- In the Filter section, you can specify conditions to identify events that will be processed using the enrichment rule. You can select an existing filter from the drop-down list or create a new filter.
Creating a filter in resources
- In the Filter drop-down list, select Create new.
- If you want to keep the filter as a separate resource, select the Save filter check box.
In this case, you will be able to use the created filter in various services.
This check box is cleared by default.
- If you selected the Save filter check box, enter a name for the created filter resource in the Name field. The name must contain 1 to 128 Unicode characters.
- In the Conditions settings block, specify the conditions that the events must meet:
- Click the Add condition button.
- In the Left operand and Right operand drop-down lists, specify the search parameters.
Depending on the data source selected in the Right operand field, you may see fields of additional parameters that you need to use to define the value that will be passed to the filter. For example, when choosing active list you will need to specify the name of the active list, the entry key, and the entry key field.
- In the operator drop-down list, select the relevant operator.
- If necessary, select the do not match case check box. When this check box is selected, the operator ignores the case of the values.
The selection of this check box does not apply to the InSubnet, InActiveList, InCategory or InActiveDirectoryGroup operators.
This check box is cleared by default.
- If you want to add a negative condition, select If not from the If drop-down list.
- You can add multiple conditions or a group of conditions.
- If you have added multiple conditions or groups of conditions, choose a search condition (and, or, not) by clicking the AND button.
- If you want to add existing filters that are selected from the Select filter drop-down list, click the Add filter button.
You can view the nested filter settings by clicking the
button.
- Click Save.
A new enrichment rule will be created.
CyberTrace indicator search integration is now configured. You can now add the created enrichment rule to a collector. You must restart KUMA collectors to apply the new settings.
If any of the CyberTrace fields in the events details area contains "[{" or "}]" values, it means that information from CyberTrace data feed was processed incorrectly and it's possible that some of the data is not displayed. You can get all data feed information by copying the events TI indicator field value from KUMA and searching for it in the CyberTrace in the indicators section. All relevant information will be displayed in the Indicator context section of CyberTrace.
Integrating CyberTrace interface
You can integrate the CyberTrace web interface with the KUMA console. When this integration is enabled, the KUMA console includes a CyberTrace section that provides access to the CyberTrace web interface. You can configure the integration in the Settings → Kaspersky CyberTrace section of the KUMA console.
To integrate the CyberTrace web interface in KUMA:
- In the KUMA console, open the Resources → Secrets section.
The list of available secrets will be displayed.
- Click the Add secret button to create a new secret. This resource is used to store credentials of the CyberTrace server.
The secret window is displayed.
- Enter information about the secret:
- In the Name field, choose a name for the added secret. The name must contain 1 to 128 Unicode characters.
- In the Tenant drop-down list, select the tenant that will own this resource.
- In the Type drop-down list, select credentials.
- In the User and Password fields, enter credentials for your CyberTrace server.
- If necessary, in the Description field, add up to 4,000 Unicode characters describing the resource.
- Click Save.
The CyberTrace server credentials are now saved and can be used in other KUMA resources.
- In the KUMA console, open the Settings → Kaspersky CyberTrace section.
The window with CyberTrace integration parameters opens.
- Make the necessary changes to the following parameters:
- Disabled—clear this check box if you want to integrate the CyberTrace web interface into the KUMA console.
- Host (required)—enter the address of the CyberTrace server.
- Port (required)—enter the port of the CyberTrace server; the default port for managing the web interface is 443.
- In the Secret drop-down list, select the secret you created before.
- You can configure access to the CyberTrace web interface in the following ways:
- Use hostname or IP when logging into the KUMA console.
To do this, in the Allow hosts section, click Add host and in the field that is displayed, enter the IP or hostname of the device.
- Use FQDN when logging into the KUMA console.
If you are using the Mozilla Firefox browser to manage the console, the CyberTrace section may fail to display data. In this case, configure the data display (see below).
- Use hostname or IP when logging into the KUMA console.
- Click Save.
CyberTrace is now integrated with KUMA, and the CyberTrace section is displayed in the KUMA console.
To configure the data display in the CyberTrace section when using the FQDN to log in to KUMA in Mozilla Firefox:
- Clear your browser cache.
- In the browser's address bar, enter the FQDN of the KUMA console with port number 7222 as follows: https://kuma.example.com:7222.
A window will open to warn you of a potential security threat.
- Click the Details button.
- In the lower part of the window, click the Accept risk and continue button.
An exclusion is created for the URL of the KUMA console.
- In the browser's address bar, enter the URL of the KUMA console with port number 7220.
- Go to the CyberTrace section.
Data will be displayed in this section.
Updating CyberTrace deny list (Internal TI)
When the CyberTrace web interface is integrated into the KUMA console, you can update the CyberTrace denylist or Internal TI with information from KUMA events.
To update CyberTrace Internal TI:
- Open the event details area from the events table, Alert window, or correlation event window and click the link on a domain, web address, IP address, or file hash.
The context menu opens.
- Select Add to Internal TI of CyberTrace.
The selected object is now added to the CyberTrace denylist.
Page topIntegration with Kaspersky Threat Intelligence Portal
The Kaspersky Threat Intelligence Portal combines all of Kaspersky's knowledge about cyberthreats and how they're related into a single web service. When integrated with KUMA, it helps KUMA users to make faster and better-informed decisions, providing them with data about URLs, domains, IP addresses, WHOIS / DNS data.
Access to the Kaspersky Threat Intelligence Portal is provided based on a fee. License certificates are created by Kaspersky experts. To obtain a certificate for Kaspersky Threat Intelligence Portal, contact your Technical Account Manager.
Initializing integration
To integrate Kaspersky Threat Intelligence Portal into KUMA:
- In the KUMA console, open the Resources → Secrets section.
The list of available secrets will be displayed.
- Click the Add secret button to create a new secret. This resource is used to store credentials of your Kaspersky Threat Intelligence Portal account.
The secret window is displayed.
- Enter information about the secret:
- In the Name field, choose a name for the added secret.
- In the Tenant drop-down list, select the tenant that will own the created resource.
- In the Type drop-down list, select ktl.
- In the User and Password fields, enter credentials for your Kaspersky Threat Intelligence Portal account.
- If you want, enter a Description of the secret.
- Upload your Kaspersky Threat Intelligence Portal certificate key:
- Click the Upload PFX button and select the PFX file with your certificate.
The name of the selected file appears to the right of the Upload PFX button.
- Enter the password to the PFX file in the PFX password field.
- Click the Upload PFX button and select the PFX file with your certificate.
- Click Save.
The Kaspersky Threat Intelligence Portal account credentials are now saved and can be used in other KUMA resources.
- In the Settings section of the KUMA console, open the Kaspersky Threat Lookup tab.
The list of available connections will be displayed.
- Make sure the Disabled check box is cleared.
- In the Secret drop-down list, select the secret you created before.
You can create a new secret by clicking the button with the plus sign. The created secret will be saved in the Resources → Secrets section.
- If necessary, select a proxy server in the Proxy drop-down list.
- Click Save.
- After you save the settings, log in to the console and accept the Terms of Use. Otherwise, an error is returned in the API.
The integration process of Kaspersky Threat Intelligence Portal with KUMA is completed.
Once Kaspersky Threat Intelligence Portal and KUMA are integrated, you can request additional information from the event details area about hosts, domains, URLs, IP addresses, and file hashes (MD5, SHA1, SHA256).
Page topRequesting information from Kaspersky Threat Intelligence Portal
To request information from Kaspersky Threat Intelligence Portal:
- Open the event details area from the events table, Alert window, or correlation event window and click the link on a domain, web address, IP address, or file hash.
The Threat Lookup enrichment area opens in the right part of the screen.
- Select check boxes next to the data types you want to request.
If neither check box is selected, all information types are requested.
- In the Maximum number of records in each data group field enter the number of entries per selected information type you want to receive. The default value is
10. - Click Request.
A ktl task has been created. When it is completed, events are enriched with data from Kaspersky Threat Intelligence Portal which can be viewed from the events table, Alert window, or correlation event window.
Page topViewing information from Kaspersky Threat Intelligence Portal
To view information from Kaspersky Threat Intelligence Portal:
Open the event details area from the events table, alert window, or correlation event window and click the link on a domain, web address, IP address, or file hash for which you previously requested information from Kaspersky Threat Intelligence Portal.
The event details area opens in the right part of the screen with data from Kaspersky Threat Intelligence Portal; the time when it was received is indicated at the bottom of the screen.
Information received from Kaspersky Threat Intelligence Portal is cached. If you click a domain, web address, IP address, or file hash in the event details pane for which KUMA has information available, the data from Kaspersky Threat Intelligence Portal opens, with the time it was received indicated at the bottom, instead of the Threat Lookup enrichment window. You can update the data.
Page topUpdating information from Kaspersky Threat Intelligence Portal
To update information, received from Kaspersky Threat Intelligence Portal:
- Open the event details area from the events table, alert window, or correlation event window and click the link on a domain, web address, IP address, or file hash for which you previously requested information from Kaspersky Threat Intelligence Portal.
- Click Update in the event details area containing the data received from the Kaspersky Threat Intelligence Portal.
The Threat Lookup enrichment area opens in the right part of the screen.
- Select the check boxes next to the types of information you want to request.
If neither check box is selected, all information types are requested.
- In the Maximum number of records in each data group field enter the number of entries per selected information type you want to receive. The default value is
10. - Click Update.
The KTL task is created and the new data received from Kaspersky Threat Intelligence Portal is requested.
- Close the Threat Lookup enrichment window and the details area with KTL information.
- Open the event details area from the events table, Alert window or correlation event window and click the link on a domain, URL, IP address, or file hash for which you updated Kaspersky Threat Intelligence Portal information and select Show info from Threat Lookup.
The event details area opens on the right with data from Kaspersky Threat Intelligence Portal, indicating the time when it was received on the bottom of the screen.
Page topConnecting over LDAP
LDAP connections are created and managed under Settings → LDAP server in the KUMA console. The LDAP server integration by tenant section shows the tenants for which LDAP connections were created. Tenants can be created or deleted.
If you select a tenant, the LDAP server integration window opens to show a table containing existing LDAP connections. Connections can be created or edited. In this window, you can change the frequency of queries sent to LDAP servers and set the retention period for obsolete data.
After integration is enabled, information about Active Directory accounts becomes available in the alert window, the correlation events detailed view window, and the incidents window. If you click an account name in the Related users section of the window, the Account details window opens with the data imported from Active Directory.
Data from LDAP can also be used when enriching events in collectors and in analytics.
Imported Active Directory attributes
Enabling and disabling LDAP integration
You can enable or disable all LDAP connections of the tenant at the same time, or enable and disable an LDAP connection individually.
To enable or disable all LDAP connections of a tenant:
- In the KUMA console, open the Settings → LDAP server section and select the tenant for which you want to enable or disable all LDAP connections.
The LDAP server integration by tenant window opens.
- Select or clear the Disabled check box.
- Click Save.
To enable or disable a specific LDAP connection:
- In the KUMA console, open the Settings → LDAP server section and select the tenant for which you want to enable or disable an LDAP connection.
The LDAP server integration window opens.
- Select the relevant connection and either select or clear the Disabled check box in the opened window.
- Click Save.
Adding a tenant to the LDAP server integration list
To add a tenant to the list of tenants for integration with an LDAP server:
- Open the KUMA console and select the Settings → LDAP server section.
The LDAP server integration by tenant window opens.
- Click the Add tenant button.
The LDAP server integration window is displayed.
- In the Tenant drop-down list, select the tenant that you need to add.
- Click Save.
The selected tenant is added to the LDAP server integration list.
To delete a tenant from the list of tenants for integration with an LDAP server:
- Open the KUMA console and select the Settings → LDAP server section.
The LDAP server integration by tenant window is displayed.
- Select the check box next to the tenant that you need to delete, and click Delete.
- Confirm deletion of the tenant.
The selected tenant is deleted from the LDAP server integration list.
Page topCreating an LDAP server connection
To create a new LDAP connection to Active Directory:
- In the KUMA console, open the Settings → LDAP server section.
- Select or create a tenant for which you want to create a LDAP connection.
The LDAP server integration by tenant window opens.
- Click the Add connection button.
The Connection parameters window opens.
- Add a secret containing the account credentials for connecting to the Active Directory server. To do so:
- If you previously added a secret, in the Secret drop-down list, select the existing secret (with the credentials type).
The selected secret can be changed by clicking on the
 button.
 - If you want to create a new secret, click the button.
The Secret window opens.
- In the Name (required) field, enter the name of the secret containing 1 to 128 Unicode characters.
- In the User and Password (required) fields, enter the account credentials for connecting to the Active Directory server.
You can enter the user name in one of the following formats: <user name>@<domain> or <domain><user name>.
- In the Description field, enter a description of up to 4,000 Unicode characters.
- Click the Save button.
- If you previously added a secret, in the Secret drop-down list, select the existing secret (with the credentials type).
- In the Name (required) field, enter the unique name of the LDAP connection.
The length of the string must be 1 to 128 Unicode characters.
- In the URL (required) field, enter the address of the domain controller in the format
<hostname or IP address of server>:<port>.In case of server availability issues, you can specify multiple servers with domain controllers by separating them with commas. All of the specified servers must reside in the same domain.
- If you want to use TLS encryption for the connection with the domain controller, select one of the following options from the Type drop-down list:
- startTLS.
When the
method is used, first it establishes an unencrypted connection over port 389, then it sends an encryption request. If the STARTTLS command ends with an error, the connection is terminated.Make sure that port 389 is open. Otherwise, a connection with the domain controller will be impossible.
- ssl.
When using SSL, an encrypted connection is immediately established over port 636.
- insecure.
When using an encrypted connection, it is impossible to specify an IP address as a URL.
- startTLS.
- If you enabled TLS encryption at the previous step, add a TLS certificate. To do so:
- If you previously uploaded a certificate, select it from the Certificate drop-down list.
If no certificate was previously added, the drop-down list shows No data.
- If you want to upload a new certificate, click the
 button on the right of the Certificate list.
The Secret window opens.
- In the Name field, enter the name that will be displayed in the list of certificates after the certificate is added.
- Click the Upload certificate file button to add the file containing the Active Directory certificate. X.509 certificate public keys in Base64 are supported.
- If necessary, provide any relevant information about the certificate in the Description field.
- Click the Save button.
The certificate will be uploaded and displayed in the Certificate list.
- If you previously uploaded a certificate, select it from the Certificate drop-down list.
- In the Timeout in seconds field, indicate the amount of time to wait for a response from the domain controller server.
If multiple addresses are indicated in the URL field, KUMA will wait the specified number of seconds for a response from the first server. If no response is received during that time, the program will contact the next server, and so on. If none of the indicated servers responds during the specified amount of time, the connection will be terminated with an error.
- In the Base DN field, enter the base distinguished name of the directory where the search request should be performed.
- In the Custom AD Account Attributes field, specify the additional attributes that you want to use to enrich events.
- Select the Disabled check box if you do not want to use this LDAP connection.
This check box is cleared by default.
- Click the Save button.
The LDAP connection to Active Directory will be created and displayed in the LDAP server integration window.
Account information from Active Directory will be requested immediately after the connection is saved, and then it will be updated at the specified frequency.
If you want to use multiple LDAP connections simultaneously for one tenant, you need to make sure that the domain controller address indicated in each of these connections is unique. Otherwise KUMA lets you enable only one of these connections. When checking the domain controller address, the program does not check whether the port is unique.
Page topCreating a copy of an LDAP server connection
You can create an LDAP connection by copying an existing connection. In this case, all settings of the original connection are duplicated in the newly created connection.
To copy an LDAP connection:
- Open the Settings → LDAP section in the KUMA console and select the tenant for which you want to copy an LDAP connection.
The LDAP server integration window opens.
- Select the relevant connection.
- In the opened Connection parameters window, click the Duplicate connection button.
The New Connection window opens. The word
copywill be added to the connection name. - If necessary, change the relevant settings.
- Click the Save button.
The new connection is created.
If you want to use multiple LDAP connections simultaneously for one tenant, you need to make sure that the domain controller address indicated in each of these connections is unique. Otherwise KUMA lets you enable only one of these connections. When checking the domain controller address, the program does not check whether the port is unique.
Page topChanging an LDAP server connection
To change an LDAP server connection:
- Open the KUMA console and select the Settings → LDAP server section.
The LDAP server integration by tenant window opens.
- Select the tenant for which you want to change the LDAP server connection.
The LDAP server integration window opens.
- Click the LDAP server connection that you want to change.
The window with the settings of the selected LDAP server connection opens.
- Make the necessary changes to the settings.
- Click the Save button.
The LDAP server connection is changed. Restart the KUMA services that use LDAP server data enrichment for the changes to take effect.
Page topChanging the data update frequency
KUMA queries the LDAP server to update account data. This occurs:
- Immediately after creating a new connection.
- Immediately after changing the settings of an existing connection.
- According to a regular schedule every several hours. Every 12 hours by default.
- Whenever a user creates a task to update account data.
When querying LDAP servers, a task is created in the Task manager section of the KUMA console.
To change the schedule of KUMA queries to LDAP servers:
- In the KUMA console, open the Settings → LDAP server → LDAP server integration by tenant section.
- Select the relevant tenant.
The LDAP server integration window opens.
- In the Data refresh interval field, specify the required frequency in hours. The default value is 12.
The query schedule has been changed.
Page topChanging the data storage period
Received user account data is stored in KUMA for 90 days by default if information about these accounts is no longer received from the Active Directory server. After this period, the data is deleted.
After KUMA account data is deleted, new and existing events are no longer enriched with this information. Account information will also be unavailable in alerts. If you want to view information about accounts throughout the entire period of alert storage, you must set the account data storage period to be longer than the alert storage period.
To change the storage period for the account data:
- In the KUMA console, open the Settings → LDAP server → LDAP server integration by tenant section.
- Select the relevant tenant.
The LDAP server integration window opens.
- In the Data storage time field, specify the number of days you need to store data received from the LDAP server.
The account data storage period is changed.
Page topStarting account data update tasks
After a connection to an Active Directory server is created, tasks to obtain account data are created automatically. This occurs:
- Immediately after creating a new connection.
- Immediately after changing the settings of an existing connection.
- According to a regular schedule every several hours. Every 12 hours by default. The schedule can be changed.
Account data update tasks can be created manually. You can download data for all connections or for one connection of the required tenant.
To start an account data update task for all LDAP connections of a tenant:
- In the KUMA console, open the Settings → LDAP server → LDAP server integration by tenant section.
- Select the relevant tenant.
The LDAP server integration window opens.
- Click the Import accounts button.
A task to receive account data from the selected tenant is added to the Task manager section of the KUMA console.
To start an account data update task for one LDAP connection of a tenant:
- In the KUMA console, open the Settings → LDAP server → LDAP server integration by tenant section.
- Select the relevant tenant.
The LDAP server integration window opens.
- Select the relevant LDAP server connection.
The Connection parameters window opens.
- Click the Import accounts button.
A task to receive account data from the selected connection of the tenant is added to the Task manager section of the KUMA console.
Page topDeleting an LDAP server connection
To delete LDAP connection to Active Directory:
- In the KUMA console, go to the Settings → LDAP server section and select the tenant that owns the relevant LDAP connection.
The LDAP server integration window opens.
- Click the LDAP connection that you want to delete and click the Delete button.
- Confirm deletion of the connection.
The LDAP connection to Active Directory will be deleted.
Page topKaspersky Industrial CyberSecurity for Networks integration
Kaspersky Industrial CyberSecurity for Networks (hereinafter referred to as "KICS for Networks") is an application designed to protect the industrial enterprise infrastructure from information security threats, and to ensure uninterrupted operation. The application analyzes industrial network traffic to identify deviations in the values of process parameters, detect signs of network attacks, and monitor the operation and current state of network devices.
KICS for Networks version 4.0 or later can be integrated with KUMA. After configuring integration, you can perform the following tasks in KUMA:
- Import asset information from KICS for Networks to KUMA.
- Send asset status change commands from KUMA to KICS for Networks.
Unlike KUMA, KICS for Networks refers to assets as devices.
The integration of KICS for Networks and KUMA must be configured in both applications:
- In KICS for Networks, you need to create a KUMA connector and save the communication data package of this connector.
- In KUMA, the communication data package of the connector is used to create a connection to KICS for Networks.
The integration described in this section applies to importing asset information. KICS for Networks can also be configured to send events to KUMA. To do so, you need to create a SIEM/Syslog connector in KICS for Networks, and configure a collector on the KUMA side.
Configuring integration in KICS for Networks
The program supports integration with KICS for Networks version 4.0 or later.
It is recommended to configure integration of KICS for Networks and KUMA after ending Process Control rules learning mode. For more details, please refer to the documentation on KICS for Networks.
On the KICS for Networks side, integration configuration consists of creating a KUMA-type connector. In KICS for Networks, connectors are specialized application modules that enable KICS for Networks to exchange data with recipient systems, including KUMA. For more details on creating connectors, please refer to the documentation on KICS for Networks.
When a connector is added to KICS for Networks, a communication data package is automatically created for this connector. This is an encrypted configuration file for connecting to KICS for Networks that is used when configuring integration on the KUMA side.
Page topConfiguring integration in KUMA
It is recommended to configure integration of KICS for Networks and KUMA after ending Process Control rules learning mode. For more details, please refer to the documentation on KICS for Networks.
To configure integration with KICS for Networks in KUMA:
- Open the KUMA console and select Settings → Kaspersky Industrial CyberSecurity for Networks.
The Kaspersky Industrial CyberSecurity for Networks integration by tenant window opens.
- Select or create a tenant for which you want to create an integration with KICS for Networks.
The Kaspersky Industrial CyberSecurity for Networks integration window opens.
- Click the Communication data package field and select the communication data package that was created in KICS for Networks.
- In the Communication data package password field, enter the password of the communication data package.
- Select the Enable response check box if you want to change the statuses of KICS for Networks assets by using KUMA response rules.
- Click Save.
Integration with KICS for Networks is configured in KUMA, and the window shows the IP address of the node where the KICS for Networks connector will be running and its ID.
Page topEnabling and disabling integration with KICS for Networks
To enable or disable KICS for Networks integration for a tenant:
- In the KUMA console, open Settings → Kaspersky Industrial CyberSecurity for Networks and select the tenant for which you want to enable or disable KICS for Networks integration.
The Kaspersky Industrial CyberSecurity for Networks integration window opens.
- Select or clear the Disabled check box.
- Click Save.
Changing the data update frequency
KUMA queries KICS for Networks to update its asset information. This occurs:
- Immediately after creating a new integration.
- Immediately after changing the settings of an existing integration.
- According to a regular schedule every several hours. This occurs every 3 hours by default.
- Whenever a user creates a task for updating asset data.
When querying KICS for Networks, a task is created in the Task manager section of the KUMA console.
To edit the schedule for importing information about KICS for Networks assets:
- In the KUMA console, open the Settings → Kaspersky Industrial CyberSecurity for Networks section.
- Select the relevant tenant.
The Kaspersky Industrial CyberSecurity for Networks integration window opens.
- In the Data refresh interval field, specify the required frequency in hours. The default value is 3.
The import schedule has been changed.
Page topSpecial considerations when importing asset information from KICS for Networks
Importing assets
Assets are imported according to the asset import rules. Only assets with the Authorized and Unauthorized statuses are imported.
KICS for Networks assets are identified by a combination of the following parameters:
- IP address of the KICS for Networks instance with which the integration is configured.
- KICS for Networks connector ID is used to configure the integration.
- ID assigned to the asset (or "device") in the KICS for Networks instance.
Importing vulnerability information
When importing assets, KUMA also receives information about active vulnerabilities in KICS for Networks. If a vulnerability has been flagged as Remediated or Negligible in KICS for Networks, the information about this vulnerability is deleted from KUMA during the next import.
Information about asset vulnerabilities is displayed in the localization language of KICS for Networks in the Asset details window in the Vulnerabilities settings block.
In KICS for Networks, vulnerabilities are referred to as risks and are divided into several types. All types of risks are imported into KUMA.
Imported data storage period
If information about a previously imported asset is no longer received from KICS for Networks, the asset is deleted after 30 days.
Page topChanging the status of a KICS for Networks asset
After configuring integration, you can change the statuses of KICS for Networks assets from KUMA. Statuses can be changed either automatically or manually.
Asset statuses can be changed only if you enabled a response in the settings for connecting to KICS for Networks.
Manually changing the status of a KICS for Networks asset
Users with the General Administrator, Administrator, and Analyst roles in the tenants available to them can manually change the statuses of assets imported from KICS for Networks.
To manually change a KICS for Networks asset status:
- In the Assets section of the KUMA console, click the asset that you want to edit.
The Asset details area opens in the right part of the window.
- In the Status in KICS for Networks drop-down list, select the status that you need to assign to the KICS for Networks asset. The Authorized or Unauthorized statuses are available.
The asset status is changed. The new status is displayed in KICS for Networks and in KUMA.
Automatically changing the status of a KICS for Networks asset
Automatic changes to the statuses of KICS for Networks assets are implemented using response rules. The rules must be added to the correlator, which will determine the conditions for triggering these rules.
Page topIntegration with Neurodat SIEM IM
Neurodat SIEM IM is an information security monitoring system.
You can configure the export of KUMA events to Neurodat SIEM IM. Based on incoming events and correlation rules, Neurodat SIEM IM automatically generates information security incidents.
To configure integration with Neurodat SIEM IM:
- Connect to the Neurodat SIEM IM server over SSH using an account with administrative privileges.
- Create a backup copy of the /opt/apache-tomcat-<server version>/conf/neurodat/soz_settings.properties configuration file.
- In the /opt/apache-tomcat-<server version>/conf/neurodat/soz_settings.properties configuration file, edit the following settings as follows:
kuma.on=trueThis setting is an attribute of Neurodat SIEM IM interaction with KUMA.
job_kuma=com.cbi.soz.server.utils.scheduler.KumaIncidentsJobjobDelay_kuma=5000jobPeriod_kuma=60000
- Save changes of the configuration file.
- Run the following command to restart the tomcat service:
sudo systemctl restart tomcat - Obtain a token for the user in KUMA. To do so:
- Open the KUMA console and click the user account name in the lower-left corner of the window and in the menu that is displayed, click Profile.
The User window with your user account parameters opens.
- Click the Generate token button.
The New token window opens.
- If necessary, set the token expiration date:
- Select the No expiration date check box.
- In the Expiration date field, use the calendar to specify the date and time when the created token will expire.
- Click the Generate token button.
The Token field with an automatically generated token is displayed in the user details area. Copy it.
When the window is closed, the token is no longer displayed. If you did not copy the token before closing the window, you will have to generate a new token.
- Click Save.
- Open the KUMA console and click the user account name in the lower-left corner of the window and in the menu that is displayed, click Profile.
- Log in to Neurodat SIEM IM using the 'admin' account or another account that has the Administrator role for the organization you are configuring or the Administrator role for all organizations.
- In the Administration → Organization structure menu item, select or create an organization that you want to receive incidents from KUMA.
- On the organization form, do the following:
- Select the Configure integration with KUMA check box.
- In the KUMA IP address and port field, specify the KUMA API address, for example,
https://192.168.58.27:7223/api/v1/. - In the KUMA API key field, specify the user token obtained at step 6.
- Save the organization information.
Integration with KUMA is configured.
Neurodat SIEM IM tests access to KUMA and, if successful, displays a message about being ready to receive data from KUMA.
Page topKaspersky Automated Security Awareness Platform
Kaspersky Automated Security Awareness Platform (hereinafter also referred to as "ASAP") is an online learning platform that allows users to learn the rules of information security and threats related to it in their daily work, as well as to practice using real examples.
ASAP can be integrated with KUMA. After configuring integration, you can perform the following tasks in KUMA:
- Change user learning groups.
- View information about the courses taken by the users and the certificates they received.
Integration between ASAP and KUMA includes configuring API connection to ASAP. The process takes place in both solutions:
- In ASAP, create an authorization token and obtain an address for API requests.
- In KUMA, specify the address for API requests in ASAP, add an authorization token for API requests, and specify the email address of the ASAP administrator to receive notifications.
Creating a token in ASAP and getting a link for API requests
In order to be authorized, the API requests from KUMA to ASAP must be signed by a token created in ASAP. Only the company administrators can create tokens.
Creating a token
To create a token:
- Sign in to the ASAP web interface.
- In the Control panel section, click the Import and synchronization button, and then open the Open API tab.
- Click the New token button and select the API methods used for integration in the window that opens:
- GET /openapi/v1/groups
- POST /openapi/v1/report
- PATCH /openapi/v1/user/:userid
- Click the Generate token button.
- Copy the token and save it in any convenient way. This token is required to configure integration in KUMA.
The token is not stored in the ASAP system in the open form. After you close the Get token window, the token is unavailable for viewing. If you close the window without copying the token, you will need to click the New token button again for the system to generate a new token.
The issued token is valid for 12 months. After this period, the token is revoked. The issued token is also revoked if it is not used for 6 months.
Getting a link for API requests
To get the link used in ASAP for API requests:
- Log in to the ASAP platform console.
- In the Control panel section, click the Import and synchronization button, and then open the Open API tab.
- A link for accessing ASAP using the Open API is located at the bottom part of the window. Copy the link and save it in any convenient way. This link is required to configure integration in KUMA.
Configuring integration in KUMA
To configure KUMA integration with ASAP:
- Open the KUMA console and go to the Settings → Kaspersky Automated Security Awareness Platform section.
The Kaspersky Automated Security Awareness Platform window opens.
- In the Secret field click the button to create a secret of the token by entering the token received from ASAP:
- In the Name field, enter the name of the secret. Must contain 1 to 128 Unicode characters.
- In the Token field, enter the authorization token for API requests to ASAP.
- If necessary, add the secret description in the Description field.
- Click Save.
- In the ASAP Open API URL field, specify the address used by ASAP for API requests.
- In the ASAP administrator email field, specify the email address of the ASAP administrator who receives notifications when users are added to the learning groups using KUMA.
- If necessary, in the Proxy drop-down list select the proxy server resource to be used to connect to ASAP.
- To disable or enable integration with ASAP, select or clear the Disabled check box.
- Click Save.
Integration with ASAP is configured in KUMA. When viewing information about alerts and incidents, you can select associated users to view which learning courses they have taken and to change their learning group.
Page topViewing information about the users from ASAP and changing learning groups
After configuring the integration between ASAP and KUMA, the following information from ASAP becomes available in alerts and incidents when you view data about associated users:
- The learning group to which the user belongs.
- The trainings passed by the user.
- The planned trainings and the current progress.
- The received certificates.
To view data about the user from ASAP:
- In the KUMA console, in the Alerts or Incidents section, select the relevant alert or incident.
- In the Related users section, click the desired account.
The Account details window opens on the right side of the screen.
- Select the ASAP courses details tab.
The window displays information about the user from ASAP.
You can change the learning group of a user in ASAP.
To change a user learning group in ASAP:
- In the KUMA console, in the Alerts or Incidents section, select the relevant alert or incident.
- In the Related users section, click the desired account.
The Account details window opens on the right side of the screen.
- In the Assign ASAP group drop-down list, select the ASAP learning group you want to assign the user to.
- Click Apply.
The user is moved to the selected ASAP group, the ASAP company administrator is notified of the change in the learning group, and the study plan is recalculated for the selected learning group.
For details on learning groups and how to get started, refer to the ASAP documentation.
Page topSending notifications to Telegram
This integration is an example and may require additional configuration depending on the versions used and the specifics of the infrastructure.
The terms and conditions of premium technical support do not apply to this integration; support requests are processed without a guaranteed response time.
You can configure sending notifications to Telegram when KUMA correlation rules are triggered. This can reduce the response time to threats and, if necessary, make more persons informed.
Configure Telegram notifications involves the following steps:
- Creating and configuring a Telegram bot
A special bot sends notifications about triggered correlation rules. It can send notifications to a private or group Telegram chat.
- Creating a script for sending notifications
You must create a script and save it on the server where the correlator is installed.
- Configuring notifications in KUMA
Configure a KUMA response rule that starts a script to send notifications and add this rule to the correlator.
Creating and configuring a Telegram bot
To create and configure a Telegram bot:
- In the Telegram application, find the BotFather bot and open a chat with it.
- In the chat, click Start.
- Create a new bot using the following command:
/newbot - Enter the name of the bot.
- Enter the login name of the bot.
The bot is created. You receive a link to the chat that looks like t.me/<bot login> and a token for contacting the bot.
- If you want to use the bot in a group chat, and not in private messages, edit privacy settings:
- In the BotFather chat, enter the command:
/mybots - Select the relevant bot from the list.
- Click Bot Settings → Group Privacy and select Turn off.
The bot can now send messages to group chats.
- In the BotFather chat, enter the command:
- To open a chat with the bot you created, use the t.me/<botlogin> link that you obtained at step 5, and click Start.
- If you want the bot to send private messages to the user:
- In the chat with the bot, send any message.
- Follow the https://t.me/getmyid_bot link and click Start.
- The response contains the
Current chat ID. You need this value to configure the sending of messages.
- If you want the bot to send messages to the group chat:
- Add https://t.me/getmyid_bot to the group chat for receiving notifications from KUMA.
The bot sends a message to the group chat, the message contains the
Current chat IDvalue. You need this value to configure the sending of messages. - Remove the bot from the group.
- Add https://t.me/getmyid_bot to the group chat for receiving notifications from KUMA.
- Send a test message through the bot. To do so, paste the following link into the address bar of your browser:
https://api.telegram.org/bot<token>/sendMessage?chat_id=<chat_id>&text=testwhere
<token>is the value obtained at step 5, and<chat_id>is the value obtained at step 8 or 9.
As a result, a test message should appear in the personal or group chat, and the JSON in the browser response should be free of errors.
Page topCreating a script for sending notifications
To create a script:
- In the console of the server on which the correlator is installed, create a script file and add the following lines to it:
#!/bin/bash
set -eu
CHAT_ID=
<Current chat ID value obtained at step 8 or 9 of the Telegram bot setup instructions>TG_TOKEN=
<token value obtained at step 5 of the Telegram bot setup instructions>RULE=$1
TEXT="<b>$RULE</b> rule triggered."
curl --data-urlencode "chat_id=$CHAT_ID" --data-urlencode "text=$TEXT" --data-urlencode "parse_mode=HTML" https://api.telegram.org/bot$TG_TOKEN/sendMessage
If the correlator server does not have Internet access, you can use a proxy server:
#!/bin/bash
set -eu
CHAT_ID=
<Current chat ID value obtained at step 8 or 9 of the Telegram bot setup instructions>TG_TOKEN=
<token value obtained at step 5 of the Telegram bot setup instructions>RULE=$1
TEXT="<b>$RULE</b> rule triggered."
PROXY=<
address and port of the proxy server>curl --proxy $PROXY --data-urlencode "chat_id=$CHAT_ID" --data-urlencode "text=$TEXT" --data-urlencode "parse_mode=HTML" https://api.telegram.org/bot$TG_TOKEN/sendMessage
- Save the script to the correlator directory at /opt/kaspersky/kuma/correlator/<
ID of the correlator that must respond to events>/scripts/.For information about obtaining the correlator ID, see the Getting service identifier section.
- Make the 'kuma' user the owner of the file and grant execution rights:
chown kuma:kuma /opt/kaspersky/kuma/correlator/<ID of the correlator that must respond>/scripts/<script name>.shchmod +x /opt/kaspersky/kuma/correlator/<ID of the correlator that must respond>/scripts/<script name>.sh
Configuring notifications in KUMA
To configure the sending of KUMA notifications to Telegram:
- Create a response rule:
- In the KUMA web interface, select the Resources → Response rules section and click Add response rule.
- This opens the Create response rule window; in that window, in the Name field, enter the name of the rule.
- In the Tenant drop-down list, select the tenant that owns the resource.
- In the Type drop-down list, select Run script.
- In the Script name field, enter the name of the script..
- In the Script arguments field, enter
{{.Name}}.This passes the name of the correlation event as the argument of the script.
- Click Save.
- Add the response rule to the correlator:
- In the Resources → Correlators section, select the correlator in whose folder you placed the created script for sending notifications.
- In the steps tree, select Response rules.
- Click Add.
- In the Response rule drop-down list, select the rule added at step 1 of these instructions.
- In the steps tree, select Setup validation.
- Click the Save and restart services button.
- Click the Save button.
Sending notifications about triggered KUMA rules to Telegram is configured.
Page topUserGate integration
This integration is an example and may require additional configuration depending on the versions used and the specifics of the infrastructure.
The terms and conditions of premium technical support do not apply to this integration; support requests are processed without a guaranteed response time.
UserGate is a network infrastructure security solution that protects personal information from the risks of external intrusions, unauthorized access, viruses, and malware.
Integration with UserGate allows automatically blocking threats by IP address, URL, or domain name whenever KUMA response rules are triggered.
Configuring the integration involves the following steps:
- Configuring integration in UserGate
- Preparing a script for the response rule
- Configuring the KUMA response rule
Configuring integration in UserGate
To configure integration in UserGate:
- Connect to the UserGate web interface under an administrator account.
- Go to UserGate → Administrators → Administrator profiles, and click Add.
- In the Profile settings window, specify the profile name, for example,
API. - On the API Permissions tab, add read and write permissions for the following objects:
- content
- core
- firewall
- nlists
- Click Save.
- In the UserGate → Administrators section, click Add → Add local administrator.
- In the Administrator properties window, specify the login and password of the administrator.
In the Administrator profile field, select the profile created at step 3.
- Click Save.
- In the address bar of your browser, after the address and port of UserGate, add
?features=zone-xml-rpcand press ENTER. - Go to the Network → Zones section and for the zone of the interface that you want to use for API interaction, go to the Access Control tab and select the check box next to the XML-RPC for management service.
If necessary, you can add the IP address of the KUMA correlator whose correlation rules must trigger blocking in UserGate, to the list of allowed addresses.
- Click Save.
Preparing a script for integration with UserGate
To prepare a script for use:
- Copy the ID of the correlator whose correlation rules you want to trigger blocking of URL, IP address, or domain name in UserGate:
- In the KUMA web interface, go to the Resources → Active services.
- Select the check box next to the correlator whose ID you want to obtain, and click Copy ID.
The correlator ID is copied to the clipboard.
- Download the script:
- Open the script file and in the Enter UserGate Parameters section, in the login and password parameters, specify the credentials of the UserGate administrator account that was created at step 7 of configuring the integration in UserGate.
- Place the downloaded script on the KUMA correlator server at the following path: /opt/kaspersky/kuma/correlator/<
correlator ID from step 1>/scripts/. - Connect to the correlator server via SSH and go to the path from step 4:
cd /opt/kaspersky/kuma/correlator/<correlator ID from step 1>/scripts/ - Run the following command:
chmod +x ug.py && chown kuma:kuma ug.py
The script is ready to use.
Page topConfiguring a response rule for integration with UserGate
To configure a response rule:
- Create a response rule:
- In the KUMA web interface, select the Resources → Response rules section and click Add response rule.
- This opens the Create response rule window; in that window, in the Name field, enter the name of the rule.
- In the Tenant drop-down list, select the tenant that owns the resource.
- In the Type drop-down list, select Run script.
- In the Script name field, enter the name of the script.
ug.py. - In the Script arguments field, specify:
- one of the operations depending on the type of the object being blocked:
blockurlto block access by URLblockipto block access by IP addressblockdomainto block access by domain name
-i {{<KUMA field from which the value of the blocked object must be taken, depending on the operation>}}Example:
blockurl -i {{.RequetstUrl}}
- one of the operations depending on the type of the object being blocked:
- In the Conditions section, add conditions corresponding to correlation rules that require blocking in UserGate when triggered.
- Click Save.
- Add the response rule to the correlator:
- In the Resources → Correlators section, select the correlator that must respond and in whose directory you placed the script.
- In the steps tree, select Response rules.
- Click Add.
- In the Response rule drop-down list, select the rule added at step 1 of these instructions.
- In the steps tree, select Setup validation.
- Click Save and reload services.
- Click the Save button.
The response rule is linked to the correlator and ready to use.
Page topIntegration with Kaspersky Web Traffic Security
This integration is an example and may require additional configuration depending on the versions used and the specifics of the infrastructure.
The terms and conditions of premium technical support do not apply to this integration; support requests are processed without a guaranteed response time.
You can configure integration with the Kaspersky Web Traffic Security web traffic analysis and filtering system (hereinafter also referred to as "KWTS").
Configuring the integration involves creating KUMA response rules that allow running KWTS tasks. Tasks must be created in advance in the KWTS web interface.
Configuring the integration involves the following steps:
- Configuring integration in KWTS
- Preparing a script for the response rule
- Configuring the KUMA response rule
Configuring integration in KWTS
To prepare the integration in KWTS:
- Connect to the KWTS web interface under an administrator account and create a role with permissions to view and create/edit a rule.
For more details on creating a role, see the Kaspersky Web Traffic Security Help.
- Assign the created role to a user with NTML authentication.
You can use a local administrator account instead.
- In the Rules section, go to the Access tab and click Add rule.
- In the Action drop-down list, select Block.
- In the Traffic filtering drop-down list, select the URL value, and in the field on the right, enter a nonexistent or known malicious address.
- In the Name field, enter the name of the rule.
- Enable the rule using the Status toggle switch.
- Click Add.
- In the KWTS web interface, open the rule you just created.
- Make a note of the ID value that is displayed at the end of the page address in the browser address bar.
You must use this value when configuring the response rule in KUMA.
The integration is prepared on the KWTS side.
Page topPreparing a script for integration with KWTS
To prepare a script for use:
- Copy the ID of the correlator whose correlation rules you want to trigger blocking of URL, IP address, or domain name in KWTS:
- In the KUMA web interface, go to the Resources → Active services.
- Select the check box next to the correlator whose ID you want to obtain, and click Copy ID.
The correlator ID is copied to the clipboard.
- Download the script and library:
- Place the downloaded script on the KUMA correlator server at the following path: /opt/kaspersky/kuma/correlator/<
correlator ID from step 1>/scripts/. - Connect to the correlator server via SSH and go to the path from step 3:
cd /opt/kaspersky/kuma/correlator/<correlator ID from step 1>/scripts/ - Run the following command:
chmod +x kwts.py kwtsWebApiV6.py && chown kuma:kuma kwts.py kwtsWebApiV6.py
The script is ready to use.
Page topConfiguring a response rule for integration with KWTS
To configure a response rule:
- Create a response rule:
- In the KUMA web interface, select the Resources → Response rules section and click Add response rule.
- This opens the Create response rule window; in that window, in the Name field, enter the name of the rule.
- In the Tenant drop-down list, select the tenant that owns the resource.
- In the Type drop-down list, select Run script.
- In the Script name field, enter the name of the script. kwts.py.
- In the Script arguments field, specify:
--host— address of the KWTS server.--username— name of the user account created in KWTS or local administrator.--password— KWTS user account password.--rule_id— ID of the rule created in KWTS.- Specify one of the options depending on the type of the object being blocked:
--url— specify the field of the KUMA event from which you want to obtain the URL, for example,{{.RequestUrl}}.--ip— specify the field of the KUMA event from which you want to obtain the IP address, for example,{{.DestinationAddress}}.--domain— specify the field of the KUMA event from which you want to obtain the domain name, for example,{{.DestinationHostName}}.
--ntlm— specify this option if the KWTS user was created with NTLM authentication.Example:
--host <address> --username <user> --password <pass> --rule_id <id> --url {{.RequestUrl}}
- In the Conditions section, add conditions corresponding to correlation rules that require blocking in KWTS when triggered.
- Click Save.
- Add the response rule to the correlator:
- In the Resources → Correlators section, select the correlator that must respond and in whose directory you placed the script.
- In the steps tree, select Response rules.
- Click Add.
- In the Response rule drop-down list, select the rule added at step 1 of these instructions.
- In the steps tree, select Setup validation.
- Click Save and reload services.
- Click the Save button.
The response rule is linked to the correlator and ready to use.
Page topIntegration with Kaspersky Secure Mail Gateway
This integration is an example and may require additional configuration depending on the versions used and the specifics of the infrastructure.
The terms and conditions of premium technical support do not apply to this integration; support requests are processed without a guaranteed response time.
You can configure integration with the Kaspersky Secure Mail Gateway mail traffic analysis and filtering system (hereinafter also referred to as "KSMG").
Configuring the integration involves creating KUMA response rules that allow running KSMG tasks. Tasks must be created in advance in the KSMG web interface.
Configuring the integration involves the following steps:
- Configuring integration in KSMG
- Preparing a script for the response rule
- Configuring the KUMA response rule
Configuring integration in KSMG
To prepare the integration in KSMG:
- Connect to the KSMG web interface under an administrator account and create a role with permissions to view and create/edit a rule.
For more details on creating a role, see the Kaspersky Secure Mail Gateway Help.
- Assign the created role to a user with NTML authentication.
You can use the 'Administrator' local administrator account.
- In the Rules section, click Create.
- In the left pane, select the General section.
- Enable the rule using the Status toggle switch.
- In the Rule name field, enter the name of the new rule.
- Under Mode, select one of the message processing options that meets the criteria of this rule.
- Under Sender on the Email addresses tab, enter a nonexistent or known malicious sender address.
- Under Recipient on the Email addresses tab, specify the relevant recipients or the "*" character to select all recipients.
- Click the Save button.
- In the KSMG web interface, open the rule you just created.
- Make a note of the ID value that is displayed at the end of the page address in the browser address bar.
You must use this value when configuring the response rule in KUMA.
The integration is prepared on the KSMG side.
Page topPreparing a script for integration with KSMG
To prepare a script for use:
- Copy the ID of the correlator whose correlation rules must trigger the blocking of the IP address or email address of the message sender in KSMG:
- In the KUMA web interface, go to the Resources → Active services.
- Select the check box next to the correlator whose ID you want to obtain, and click Copy ID.
The correlator ID is copied to the clipboard.
- Download the script and library:
- Place the downloaded script on the KUMA correlator server at the following path: /opt/kaspersky/kuma/correlator/<
correlator ID from step 1>/scripts/. - Connect to the correlator server via SSH and go to the path from step 3:
cd /opt/kaspersky/kuma/correlator/<correlator ID from step 1>/scripts/ - Run the following command:
chmod +x ksmg.py ksmgWebApiV2.py && chown kuma:kuma ksmg.py ksmgWebApiV2.py
The script is ready to use.
Page topImporting asset information from RedCheck
This integration is an example and may require additional configuration depending on the versions used and the specifics of the infrastructure.
The terms and conditions of premium technical support do not apply to this integration; support requests are processed without a guaranteed response time.
RedCheck is a system for monitoring and managing the information security of an organization.
You can import asset information from RedCheck network device scan reports into KUMA.
Import is available from simple "Vulnerabilities" and "Inventory" reports in CSV format, grouped by hosts.
Imported assets are displayed in the KUMA console in the Assets section. If necessary, you can edit the settings of assets.
Data is imported through the API using the redcheck-tool.py utility. The utility requires Python 3.6 or later and the following libraries:
- csv
- re
- json
- requests
- argparse
- sys
To import asset information from a RedCheck report:
- Generate a network asset scan report in RedCheck in CSV format and copy the report file to the server where the script is located.
For more details about scan tasks and output file formats, refer to the RedCheck documentation.
- Create a file with the token for accessing the KUMA REST API.
The account for which the token is created must satisfy the following requirements:
- Administrator or Analyst role.
- Access to the tenant into which the assets will be imported.
- Rights to use API requests: GET /assets, GET /tenants, POST/assets/import.
- Download the script:
- Copy the redcheck-tool.py tool to the server hosting the KUMA Core and make the tool's file executable:
chmod +x <path to the redcheck-tool.py file> - Run the redcheck-tool.py utility:
python3 redcheck-tool.py --kuma-rest <address and port of the KUMA REST API server> --token <API token> --tenant <name of the tenant in which the assets must be placed> --vuln-report <full path to the "Vulnerabilities" report file> --inventory-report <full path to the "Inventory" report file>Example:
python3 --kuma-rest example.kuma.com:7223 --token 949fc03d97bad5d04b6e231c68be54fb --tenant Main --vuln-report /home/user/vuln.csv --inventory-report /home/user/inventory.csvYou can use additional flags and commands for import operations. For example, the
-vcommand displays an extended report on the received assets. A detailed description of the available flags and commands is provided in the "Flags and commands of redcheck-tool.py" table. You can also use the--helpcommand to view information on the available flags and commands.
The asset information is imported from the RedCheck report to KUMA. The console displays information on the number of new and updated assets.
Example:
|
Example of extended import information:
|
The tool works as follows when importing assets:
- KUMA overwrites the data of assets imported through the API, and deletes information about their resolved vulnerabilities.
- KUMA skips assets with invalid data.
Flags and commands of redcheck-tool.py
Flags and commands
Mandatory
Description
--kuma-rest <address and port of the KUMA server>Yes
Port 7223 is used for API requests by default. You can change the port if necessary.
--token <token>Yes
The value of the option must contain only the token.
The Administrator or Analyst role must be assigned to the user account for which the API token is being generated.
--tenant <tenant name>Yes
Name of the KUMA tenant in which the assets from the RedCheck report will be imported.
--vuln-report <full path to the "Vulnerabilities" report>Yes
"Vulnerabilities" report file in CSV format.
--inventory-report <full path to the "Inventory" report file>No
"Inventory" report file in CSV format.
-vNo
Display extended information about the import of assets.
Possible errors
Error message
Description
Tenant %w not found
The tenant name was not found.
Tenant search error: Unexpected status Code: %d
An unexpected HTTP response code was received while searching for the tenant.
Asset search error: Unexpected status Code: %d
An unexpected HTTP response code was received while searching for an asset.
[%w import][error] Host: %w Skipped asset with FQDNlocalhost or IP 127.0.0.1
When importing inventory/vulnerabilities information, host cfqdn=localhost or ip=127.0.0.1 was skipped.
Configuring receipt of Sendmail events
You can configure the receipt of Sendmail mail agent events in the KUMA SIEM system.
Configuring event receiving consists of the following steps:
- Configuring Sendmail logging.
- Configuring the event source server.
- Creating a KUMA collector.
To receive Sendmail events, use the following values in the Collector Installation Wizard:
- At the Event parsing step, select the [OOTB] Sendmail syslog normalizer.
- At the Transport step, select the tcp or udp connector type.
- Installing KUMA collector.
- Verifying receipt of Sendmail events in the KUMA collector
You can verify that the Sendmail event source server is correctly configured in the Searching for related events section of the KUMA console.
Configuring Sendmail logging
By default, events of the Sendmail system are logged to syslog.
To make sure that logging is configured correctly:
- Connect via SSH to the server on which the Sendmail system is installed.
- Run the following command:
cat /etc/rsyslog.d/50-default.confThe command should return the following string:
mail.* -/var/log/mail.log
If logging is configured correctly, you can proceed to configuring the export of Sendmail events.
Page topConfiguring export of Sendmail events
Events are sent from the Sendmail mail agent server to the KUMA collector using the rsyslog service.
To configure transmission of Sendmail events to the collector:
- Connect to the server where Sendmail is installed using an account with administrative privileges.
- In the /etc/rsyslog.d/ directory, create the Sendmail-to-siem.conf file and add the following line to it:
If $programname contains 'sendmail' then @<<IP address of the collector>:<port of the collector>>Example:
If $programname contains 'sendmail' then @192.168.1.5:1514If you want to send events via TCP, the contents of the file must be as follows:
If $programname contains 'sendmail' then @@<<IP address of the collector>:<port of the collector>> - Create a backup copy of the /etc/rsyslog.conf file.
- Add the following lines to the /etc/rsyslog.conf configuration file:
$IncludeConfig /etc/Sendmail-to-siem.conf$RepeatedMsgReduction off - Save your changes.
- Restart the rsyslog service by executing the following command:
sudo systemctl restart rsyslog.service
Viewing KUMA metrics
Comprehensive information about the performance of the KUMA Core, storage, collectors, and correlators is available in the Metrics section of the KUMA console. Selecting this section opens the Grafana portal deployed as part of KUMA Core installation and is updated automatically. If the Metrics section shows core: <port number>, this means that KUMA is deployed in a high availability configuration and the metrics were received from the host on which the Core was installed. In other configurations, the name of the host from which KUMA receives metrics is displayed.
The default Grafana user name and password are admin and admin.
Available metrics
Collector indicators:
- IO—metrics related to the service input and output.
- Processing EPS—the number of processed events per second.
- Processing Latency—the time required to process a single event (the median is displayed).
- Output EPS—the number of events, sent to the destination per second.
- Output Latency—the time required to send a batch of events to the destination and receive a response from it (the median is displayed).
- Output Errors—the number or errors when sending event batches to the destination per second. Network errors and errors writing the disk buffer are displayed separately.
- Output Event Loss—the number of lost events per second. Events can be lost due to network errors or errors writing the disk buffer. Events are also lost if the destination responded with an error code (for example, if the request was invalid).
- Normalization—metrics related to the normalizers.
- Raw & Normalized event size—the size of the raw event and size of the normalized event (the median is displayed).
- Errors—the number of normalization errors per second.
- Filtration—metrics related to the filters.
- EPS—the number of events rejected by the Collector per second. The collector only rejects events if the user has added a filter into the collector service configuration.
- Aggregation—metrics related to the aggregation rules.
- EPS—the number of events received and created by the aggregation rule per second. This metric helps determine the effectiveness of aggregation rules.
- Buckets—the number of buckets in the aggregation rule.
- Enrichment—metrics related to the enrichment rules.
- Cache RPS—the number requests to the local cache per second.
- Source RPS—the number of requests to the enrichment source (for example, the Dictionary resource).
- Source Latency—the time required to send a request to the enrichment source and receive a response from it (the median is displayed).
- Queue—the enrichment requests queue size. This metric helps to find bottleneck enrichment rules.
- Errors—the number of enrichment source request errors per second.
Correlator metrics:
- IO—metrics related to the service input and output.
- Processing EPS—the number of processed events per second.
- Processing Latency—the time required to process a single event (the median is displayed).
- Output EPS—the number of events, sent to the destination per second.
- Output Latency—the time required to send a batch of events to the destination and receive a response from it (the median is displayed).
- Output Errors—the number or errors when sending event batches to the destination per second. Network errors and errors writing the disk buffer are displayed separately.
- Output Event Loss—the number of lost events per second. Events can be lost due to network errors or errors writing the disk buffer. Events are also lost if the destination responded with an error code (for example, if the request was invalid).
- Correlation—metrics related to the correlation rules.
- EPS—the number of correlation events created per second.
- Buckets—the number of buckets in the correlation rule (only for the standard kind of correlation rules).
- Active lists—metrics related to the active lists.
- RPS—the number of requests (and their type) to the Active list per second.
- Records—the number of entries in the Active list.
- WAL Size—the size of the Write-Ahead-Log. This metric helps determine the size of the Active list.
Storage indicators:
- IO—metrics related to the service input and output.
- RPS—the number of requests to the Storage service per second.
- Latency—the time of proxying a single request to the ClickHouse node (the median is displayed).
Core service metrics:
- IO—metrics related to the service input and output.
- RPS—the number of requests to the Core service per second.
- Latency—the time of processing a single request (the median is displayed).
- Errors—the number of request errors per second.
- Notification Feed—metrics related to user activity.
- Subscriptions—the number of clients, connected to the Core via SSE to receive server messages in real time. This number usually correlates with the number of clients using the KUMA console.
- Errors—the number of message sending errors per second.
- Schedulers—metrics related to Core tasks.
- Active—the number of repeating active system tasks. The tasks created by the user are ignored.
- Latency—the time of processing a single request (the median is displayed).
- Position—the position (timestamp) of the alert creation task. The next ClickHouse scan for correlation events will start from this position.
- Errors—the number of task errors per second.
General metrics common for all services:
- Process—general process metrics.
- CPU—CPU usage.
- Memory—RAM usage (RSS).
- DISK IOPS—the number of disk read/write operations per second.
- DISK BPS—the number of bytes read/written to the disk per second.
- Network BPS—the number of bytes received/sent per second.
- Network Packet Loss—the number of network packets lost per second.
- GC Latency—the time of the GO Garbage Collector cycle (the median is displayed).
- Goroutines—the number of active goroutines. This number differs from the thread count.
- OS—metrics related to the operating system.
- Load—the average load.
- CPU—CPU usage.
- Memory—RAM usage (RSS).
- Disk—disk space usage.
Metrics storage period
KUMA operation data is saved for 3 months by default. This storage period can be changed.
To change the storage period for KUMA metrics:
- Log in to the OS of the server where the KUMA Core is installed.
- In the file /etc/systemd/system/multi-user.target.wants/kuma-victoria-metrics.service, in the ExecStart parameter, edit the
--retentionPeriod=<metrics storage period, in months>flag by inserting the necessary period. For example,--retentionPeriod=4means that the metrics will be stored for 4 months. - Restart KUMA by running the following commands in sequence:
- systemctl daemon-reload
- systemctl restart kuma-victoria-metrics
The storage period for metrics has been changed.
Page topManaging KUMA tasks
When managing the program console, you can use tasks to perform various operations. For example, you can import assets or export KUMA event information to a TSV file.
Viewing the tasks table
The task table contains a list of created tasks and is located in the Task manager section of the program console window. You can view the tasks that were created by you (current user).
A user with the General Administrator role can view the tasks of all users.
The tasks table contains the following information:
- State—the state of the task. One of the following statuses can be assigned to a task:
- Green dot blinking—the task is active.
- Completed—the task is complete.
- Cancel—the task was canceled by the user.
- Error—the task was not completed because of an error. The error message is displayed if you hover the mouse over the exclamation mark icon.
- Task—the task type. The program provides the following types of tasks:
- Events export—export KUMA events.
- Threat Lookup—request data from the Kaspersky Threat Intelligence Portal.
- Retroscan—task for replaying events.
- OSMP assets import—imports asset data from Kaspersky Security Center servers.
- Accounts import—imports user data from Active Directory.
- KICS for Networks assets import—imports asset data from KICS for Networks.
- Repository update—updates the KUMA repository to receive the resource packages from the source specified in settings.
- Created by—the user who created the task. If the task was created automatically, the column will show Scheduled task.
This column is displayed only for users with the General administrator and Tenant administrator roles.
- Created—task creation time.
- Updated—time when the task was last updated.
- Tenant—the name of the tenant in which the task was started.
The task date format depends on the localization language selected in the application settings. Possible date format options:
- English localization: YYYY-MM-DD.
- Russian localization: DD.MM.YYYY.
Configuring the display of the tasks table
You can customize the display of columns and the order in which they appear in the tasks table.
To customize the display and order of columns in the tasks table:
- In the KUMA console, select the Task manager section.
The tasks table is displayed.
- In the table header, click the button.
- In the opened window, do the following:
- If you want to enable display of a column in the table, select the check box next to the name of the parameter that you want to display in the table.
- If you do not want the parameter to be displayed in the table, clear the check box.
At least one check box must be selected.
- If you want to reset the settings, click the Default link.
- If you want to change the order in which the columns are displayed in the table, move the mouse cursor over the name of the column, hold down the left mouse button and drag the column to the necessary position.
The display of columns in the tasks table will be configured.
Page topViewing task run results
To view the results of a task:
- In the KUMA console, select the Task manager section.
The tasks table is displayed.
- Click the link containing the task type in the Task column.
A list of the operations available for this task type will be displayed.
- Select Show results.
The task results window opens.
Page topRestarting a task
To restart a task:
- In the KUMA console, select the Task manager section.
The tasks table is displayed.
- Click the link containing the task type in the Task column.
A list of the operations available for this task type will be displayed.
- Select Restart.
The task will be restarted.
Page topProxies
Proxy servers are used to store proxy server configuration settings, for example, in destinations. The http type is supported.
Available settings:
- Name (required)—unique name of the proxy server. Must contain 1 to 128 Unicode characters.
- Tenant (required)—name of the tenant that owns the resource.
- Use URL from the secret (required)—drop-down list to select a secret resource that stores URLs of proxy servers. If required, a secret can be created in the proxy server creation window by using the button. The selected secret can be changed by clicking on the button.
- Do not use for domains—one or more domains that require direct access.
- Description—up to 4,000 Unicode characters.
Connecting to an SMTP server
KUMA can be configured to send email notifications using an SMTP server. Users will receive notifications if the Receive email notifications check box is selected in their profile settings.
Only one SMTP server can be added to process KUMA notifications. An SMTP server connection is managed in the KUMA console under Settings → General → SMTP server settings.
To configure SMTP server connection:
- Open the KUMA console and select the Settings → General section.
- In the SMTP server settings block, change the relevant settings:
- Disabled—select this check box if you want to disable connection to the SMTP server.
- Host (required)—SMTP host in one of the following formats: hostname, IPv4, IPv6.
- Port (required)—SMTP port. The value must be an integer from 1 to 65,535.
- From (required)—email address of the message sender. For example,
kuma@company.com. - Alias for KUMA Core server—name of the KUMA Core server that is used in your network. Must be different from the FQDN.
- If necessary, use the Secret drop-down list to select a secret of the credentials type that contains the account credentials for connecting to the SMTP server.
- If you previously created a secret, select it from the Secret drop-down list.
If no secret was previously added, the drop-down list shows No data.
- If you want to add a new secret, click the button on the right of the Secret list.
The Secret window opens.
- In the Name field, enter the name that will be used to display the secret in the list of available secrets.
- In the User and Password fields, enter the credentials of the user account that the Agent will use to connect to the connector.
- If necessary, add any other information about the secret in the Description field.
- Click the Save button.
The secret will be added and displayed in the Secret list.
- If you previously created a secret, select it from the Secret drop-down list.
- Select the necessary frequency of notifications in the Monitoring notifications interval drop-down list.
Notifications from the source about a monitoring policy triggering are repeated after the selected period until the status of the source becomes green again.
If the Notify once setting is selected, you receive a notification about monitoring policy activation only once.
- Turn on the Disable monitoring notifications toggle button if you do not want to receive notifications about the state of event sources. The toggle switch is turned off by default.
- Click Save.
The SMTP server connection is now configured, and users can receive email messages from KUMA.
Page topWorking with Kaspersky Security Center tasks
You can connect Kaspersky Security Center assets to KUMA and download database and application module updates to these assets, or run an anti-virus scan on them by using Kaspersky Security Center tasks. Tasks are started in the KUMA console.
To run Kaspersky Security Center tasks on assets connected to KUMA, it is recommended to use the following script:
- Creating a user account in the Kaspersky Security Center Administration Console
The credentials of this account are used when creating a secret to establish a connection with Kaspersky Security Center, and can be used to create a task.
For more details about creating a user account and assigning permissions to a user, please refer to the Kaspersky Security Center Help Guide.
- Creating KUMA tasks in Kaspersky Security Center
- Configuring KUMA integration with Kaspersky Security Center
- Importing asset information from Kaspersky Security Center into KUMA
- Assigning a category to the imported assets
After import, the assets are automatically placed in the Uncategorized devices group. You can assign one of the existing categories to the imported assets, or create a category and assign it to the assets.
- Running tasks on assets
You can manually start tasks in the asset information or configure tasks to start automatically.
Creating KUMA tasks in Kaspersky Security Center
You can run the anti-virus database and application module update task, and the virus scan task on Kaspersky Security Center assets connected to KUMA. The assets must have Kaspersky Endpoint Security for Windows or Kaspersky Endpoint Security for Linux installed. The tasks are created in OSMP Console.
For more details about creating the Update and Virus scan tasks on the assets with Kaspersky Endpoint Security for Windows, refer to the Kaspersky Endpoint Security for Windows Help Guide.
For more details about creating the Update and Virus scan tasks on the assets with Kaspersky Endpoint Security for Linux, refer to the Kaspersky Endpoint Security for Linux Help Guide.
Task names must begin with "kuma" (not case-sensitive and without quotations). For example, KUMA antivirus check. Otherwise, the task is not displayed in the list of available tasks in the KUMA console.
Starting Kaspersky Security Center tasks manually
You can manually run the anti-virus database, application module update task, and the anti-virus scan task on Kaspersky Security Center assets connected to KUMA. The assets must have Kaspersky Endpoint Security for Windows or Kaspersky Endpoint Security for Linux installed.
First, you need to configure the integration of Kaspersky Security Center with KUMA and create tasks in Kaspersky Security Center.
To manually start a Kaspersky Security Center task:
- In the Assets section of the KUMA console, select the asset that was imported from Kaspersky Security Center.
The Asset details window opens.
- Click OSMP response.
This button is displayed if the connection to the Kaspersky Security Center that owns the selected asset is enabled.
- In the opened Select task window, select the check boxes next to the tasks that you want to start, and click the Start button.
Kaspersky Security Center starts the selected tasks.
Some types of tasks are available only for certain assets.
You can obtain vulnerability and software information only for assets running a Windows operating system.
Page topStarting Kaspersky Security Center tasks automatically
You can configure the automatic start of the anti-virus database and application module update task and the virus scan task for Kaspersky Security Center assets connected to KUMA. The assets must have Kaspersky Endpoint Security for Windows or Kaspersky Endpoint Security for Linux installed.
First, you need to configure the integration of Kaspersky Security Center with KUMA and create tasks in Kaspersky Security Center.
Configuring automatic start of Kaspersky Security Center tasks includes the following steps:
Step 1. Adding a correlation rule
To add a correlation rule:
- In the KUMA console, select the Resources section.
- Select Correlation rules and click the Add correlation rule button.
- On the General tab, define the following settings:
- In the Name field, define the rule name.
- In the Tenant drop-down list, select the tenant that owns the resource.
- In the Type drop-down list, select simple.
- In the Propagated fields field, add the following fields: DestinationAssetID.
- If required, define the values for the following fields:
- In the Rate limit field, define the maximum number of times per second that the rule will be triggered.
- In the Severity field, define the severity of alerts and correlation events that will be created as a result of the rule being triggered.
- In the Description field, provide any additional information.
- On the Selectors → Settings tab, do the following:
- In the Filter drop-down list, select Create new.
- In the Conditions field, click the Add group button.
- In the operator field for the group you added, select AND.
- Add a condition for filtering by the DeviceProduct field value:
- In the Conditions field, click the Add condition button.
- In the condition field, select If.
- In the Left operand field, select event field.
- In the 'Event field' field, select DeviceProduct.
- In the Operator field, select =.
- In the Right operand field, select constant.
- In the Value field, enter "OSMP".
- Add a condition for filtering by the Name field value:
- In the Conditions field, click the Add condition button.
- In the condition field, select If.
- In the Left operand field, select event field.
- In the event field, select Name.
- In the Operator field, select =.
- In the Right operand field, select constant.
- In the value field, enter the name of the event. When this event is detected, the task is started automatically.
For example, if you want the Virus scan task to start when Kaspersky Security Center registers the Malicious object detected event, specify this name in the Value field.
You can view the event name in the Name field of the event details.
- On the Actions tab, define the following settings:
- In the Actions section, open the On every event drop-down list.
- Select the Output check box.
You do not need to fill in other fields.
- Click the Save button.
The correlation rule will be created.
Step 2. Creating a correlator
You need to launch the correlator installation wizard. At step 3 of the wizard, you are required to select the correlation rule that you added by following this guide.
The DeviceHostName field must display the domain name (FQDN) of the asset. If it is not displayed, create a DNS record for this asset and create a DNS enrichment rule at Step 4 of the wizard.
Step 3. Adding a filter
To add a filter:
- In the KUMA console, select the Resources section.
- Select Filters and click the Add filter button.
- In the Name field, specify the filter name.
- In the Tenant drop-down list, select the tenant that owns the resource.
- In the Conditions field, click the Add group button.
- In the operator field for the group you added, select AND.
- Add a condition for filtering by the DeviceProduct field value:
- In the Conditions field, click the Add condition button.
- In the condition field, select If.
- In the Left operand field, select event field.
- In the 'Event field' field, select Type.
- In the Operator field, select =.
- In the Right operand field, select constant.
- In the Value field, enter 3.
- Add a condition for filtering by the Name field value:
- In the Conditions field, click the Add condition button.
- In the condition field, select If.
- In the Left operand field, select event field.
- In the event field, select Name.
- In the Operator field, select =.
- In the Right operand field, select constant.
- In the Value field, enter the name of the correlation rule created at Step 1.
Step 4. Adding a response rule
To add a response rule:
- In the KUMA console, select the Resources section.
- Select Response rules and click the Add response rule button.
- In the Name field, define the rule name.
- In the Tenant drop-down list, select the tenant that owns the resource.
- In the Type drop-down list, select Response via OSMP.
- In the Open Single Management Platform task drop-down list, select the Kaspersky Security Center task you want to start.
- In the Event field drop-down list, select the DestinationAssetID.
- In the Workers field, specify the number of processes that the service can run simultaneously.
By default, the number of work processes is the same as the number of virtual processors on the server where the correlator service is installed.
- In the Description field, you can add up to 4,000 Unicode characters.
- In the Filter drop-down list, select the filter added at Step 3 of this instruction.
To send requests to Kaspersky Security Center, you must ensure that Kaspersky Security Center is available over the UDP protocol.
If a response rule is owned by the shared tenant, the displayed Kaspersky Security Center tasks that are available for selection are from the Kaspersky Security Center server that the main tenant is connected to.
If a response rule has a selected task that is absent from the Kaspersky Security Center server that the tenant is connected to, the task is not performed for assets of this tenant. This situation could arise when two tenants are using a common correlator, for example.
Step 5. Adding a response rule to the correlator
To add a response rule to the correlator:
- In the KUMA console, select the Resources section.
- Select Correlators.
- In the list of correlators, select the correlator added at Step 2 of this instruction.
- In the steps tree, select Response rules.
- Click Add.
- In the Response rule drop-down list, select the rule added at step 4 of these instructions.
- In the steps tree, select Setup validation.
- Click the Save and restart services button.
- Click the Save button.
The response rule will be added to the correlator.
The automatic start will be configured for the anti-virus database and application module update task and the virus scan task on Kaspersky Security Center assets connected to KUMA. The tasks are started when a threat is detected on the assets and KUMA receives the corresponding events.
Page topChecking the status of Kaspersky Security Center tasks
In the KUMA console, you can check whether a Kaspersky Security Center task was started or whether a search for events owned by the collector listening for Kaspersky Security Center events was completed.
To check the status of Kaspersky Security Center tasks:
- In KUMA, select Resources → Active services.
- Select the collector that is configured to receive events from the Kaspersky Security Center server and click the Go to Events button.
A new browser tab will open in the Events section of KUMA. The table displays events from the Kaspersky Security Center server. The status of the tasks can be seen in the Name column.
Kaspersky Security Center event fields:
- Name—status or type of the task.
- Message—message about the task or event.
- FlexString<number>Label—name of the attribute received from Kaspersky Security Center. For example,
FlexString1Label=TaskName. - FlexString<number>—value of the FlexString<number>Label attribute. For example,
FlexString1=Download updates. - DeviceCustomNumber<number>Label—name of the attribute related to the task state. For example,
DeviceCustomNumber1Label=TaskOldState. - DeviceCustomNumber<number>—value related to the task state. For example,
DeviceCustomNumber1=1means the task is executing. - DeviceCustomString<number>Label—name of the attribute related to the detected vulnerability: for example, a virus name, affected application.
- DeviceCustomString<number>—value related to the detected vulnerability. For example, the attribute-value pairs
DeviceCustomString1Label=VirusNameandDeviceCustomString1=EICAR-Test-Filemean that the EICAR test virus was detected.
KUMA logs
Component logs
By default, only errors are logged for all KUMA components. To receive detailed data in logs, configure Debug mode in the component settings.
The log is appended until it reaches 5 GB. When the log reaches 5 GB, it is archived and new events are written to a new log. Archives are kept in the log folder for 7 days, after 7 days the archive is deleted. A maximum of four archived logs are stored on the server at the same time. Whenever a new log archive is created, if the total number of archives becomes greater than four, the oldest log archive is deleted.
Debug mode is available for the following components:
Services:
|
To enable it, use the Debug toggle switch in the settings of the service. Storage location: the service installation directory. For example, /opt/kaspersky/kuma/<service name>/log/<service name>. You can download the service logs from the KUMA web interface, in the Resources → Active services section by selecting the desired service and clicking Log. Logs residing on Linux machines can be viewed by running the journalctl and tail command. For example:
|
Resources:
|
To enable it, use the Debug toggle switch in the settings of the service to which the resource is linked. The logs are stored on the machine hosting the installed service that uses the relevant resource. Detailed data for resources can be viewed in the log of the service linked to a resource. |
KUMA notifications
Standard notifications
KUMA can be configured to send email notifications using an SMTP server. To do so, configure a connection to an SMTP server and select the Receive email notifications check box for users who should receive notifications.
KUMA automatically notifies users about the following events:
- A report was created (the users listed in the report template receive a notification).
- A task was performed (the users who created the task receive a notification).
- New resource packages are available. They can be obtained by updating the KUMA repository (the users whose email address is specified in the task settings are notified).
Working with geographic data
A list of mappings of IP addresses or ranges of IP addresses to geographic data can be uploaded to KUMA for use in event enrichment.
Geodata format
Geodata can be uploaded to KUMA as a CSV file in UTF-8 encoding. A comma is used as the delimiter. The first line of the file contains the field headers: Network,Country,Region,City,Latitude,Longitude.
CSV file description
Field header name in CSV |
Field description |
Example |
|
IP address in one of the following formats:
Mixing of IPv4 and IPv6 addresses is allowed. Required field. |
|
|
Country designation used by your organization. For example, this could be its name or code. Required field. |
|
|
Regional designation used by your organization. For example, this could be its name or code. |
|
|
City designation used by your organization. For example, this could be its name or code. |
|
|
Latitude of the described location in decimal format. This field can be empty, in which case the value 0 will be used when importing data into KUMA. |
|
|
Longitude of the described location in decimal format. This field can be empty, in which case the value 0 will be used when importing data into KUMA. |
|
Converting geographic data from MaxMind to IP2Location
Geographic data obtained from MaxMind and IP2Location can be used in KUMA if the data files are first converted to a format supported by KUMA. Conversion can be done using the script below. Make sure that the files do not contain duplicate records. For example, if a file has few columns, different records may contain data from the same network with the same geodata. Such files cannot be converted. To successfully perform the conversion, make sure that there are no duplicate rows and that every row has at least one unique field.
Python 2.7 or later is required to run the script.
Script start command:
python converter.py --type <type of geographic data being processed: "maxmind" or "ip2location"> --out <directory where a CSV file containing geographic data in KUMA format will be placed> --input <path to the ZIP archive containing geographic data from MaxMind or IP2location>
When the script is run with the --help flag, help is displayed for the available script parameters: python converter.py --help
Command for converting a file containing a Russian database of IP address ranges from a MaxMind ZIP archive:
python converter.py --type maxmind --lang ru --input MaxMind.zip --out geoip_maxmind_ru.csv
If the --lang parameter is not specified, the script receives information from the GeoLite2-City-Locations-en.csv file from the ZIP archive by default.
Absence of the --lang parameter for MaxMind is equivalent to the following command:
python converter.py --type maxmind --input MaxMind.zip --out geoip_maxmind.csv
Command for converting a file from an IP2Location ZIP archive:
python converter.py --type ip2location --input IP2LOCATION-LITE-DB11.CSV.ZIP --out geoip_ip2location.csv
Command for converting a file from several IP2Location ZIP archives:
python converter.py --type ip2location --input IP2LOCATION-LITE-DB11.CSV.ZIP IP2LOCATION-LITE-DB11.IPV6.CSV.ZIP --out geoip_ip2location_ipv4_ipv6.csv
The --lang parameter is not used for IP2Location.
Required sets of fields
The MaxMind source files GeoLite2-City-Blocks-IPv4.csv and GeoLite2-City-Blocks-IPv6.csv must contain the following set of fields:
network,geoname_id,registered_country_geoname_id,represented_country_geoname_id,
is_anonymous_proxy,is_satellite_provider,postal_code,latitude,longitude,accuracy_radius
Example set of source data:
network,geoname_id,registered_country_geoname_id,represented_country_geoname_id,is_anonymous_proxy,is_satellite_provider,postal_code,latitude,longitude,accuracy_radius
1.0.0.0/24,2077456,2077456,,0,0,,-33.4940,143.2104,1000
1.0.1.0/24,1814991,1814991,,0,0,,34.7732,113.7220,1000
The remaining CSV files with the locale code must contain the following set of fields:
geoname_id,locale_code,continent_code,continent_name,country_iso_code,country_name,
subdivision_1_iso_code,subdivision_1_name,subdivision_2_iso_code,subdivision_2_name,
city_name,metro_code,time_zone,is_in_european_union
Example set of source data:
geoname_id,locale_code,continent_code,continent_name,country_iso_code,country_name,subdivision_1_iso_code,subdivision_1_name,subdivision_2_iso_code,subdivision_2_name,city_name,metro_code,time_zone,is_in_european_union
1392,de,AS,Asien,IR,Iran,02,Mazandaran,,,,,Asia/Tehran,0
7240,de,AS,Asien,IR,Iran,28,Nord-Chorasan,,,,,Asia/Tehran,0
The source IP2Location files must contain data on the network ranges, Country, Region, City, Latitude, and Longitude
Example set of source data:
"0","16777215","-","-","-","-","0.000000","0.000000","-","-"
"16777216","16777471","US","United States of America","California","Los Angeles","34.052230","-118.243680","90001","-07:00"
"16777472","16778239","CN","China","Fujian","Fuzhou","26.061390","119.306110","350004","+08:00"
If the source files contain a different set of fields than the one indicated in this section, or if some fields are missing, the missing fields in the target CSV file will be empty after conversion.
Page topImporting and exporting geographic data
If necessary, you can manually import and export geographic data into KUMA. Geographic data is imported and exported in a CSV file. If the geographic data import is successful, the previously added data is overwritten and an audit event is generated in KUMA.
To import geographic data into KUMA:
- Prepare a CSV file containing geographic data.
Geographic data received from MaxMind and IP2Location must be converted to a format supported by KUMA.
- In the KUMA console, open Settings → General.
- In the Geographic data settings block, click the Import from file button and select a CSV file containing geographic data.
Wait for the geographic data import to finish. The data import is interrupted if the page is refreshed.
The geographic data is uploaded to KUMA.
To export geographic data from KUMA:
- In the KUMA console, open Settings → General.
- In the Geographic data settings block, click the Export button.
Geographic data will be downloaded as a CSV file named geoip.csv (in UTF-8 encoding) based on the settings of your browser.
The data is exported in the same format as it was uploaded, with the exception of IP address ranges. If a range of addresses was indicated in the format 1.0.0.0/24 in a file imported into KUMA, the range will be displayed in the format 1.0.0.0-1.0.0.255 in the exported file.
Default mapping of geographic data
If you select the SourceAddress, DestinationAddress and DeviceAddress event fields as the IP address source when configuring a geographic data enrichment rule, the Apply default mapping button becomes available. You can use this button to add preconfigured mapping pairs of geographic data attributes and event fields as described below.
Default mappings for the SourceAddress event field
Geodata attribute |
Event field |
Country |
|
Region |
|
City |
|
Latitude |
|
Longitude |
|
Default mappings for the DestinationAddress event field
Geodata attribute |
Event field |
Country |
|
Region |
|
City |
|
Latitude |
|
Longitude |
|
Default mappings for the DeviceAddress event field
Geodata attribute |
Event field |
Country |
|
Region |
|
City |
|
Latitude |
|
Longitude |
|