Contents
- Integration with other solutions
- Integration with Open Single Management Platform
- Configuring Open Single Management Platform integration settings
- Adding a tenant to the list for Open Single Management Platform integration
- Creating Open Single Management Platform connection
- Editing Open Single Management Platform connection
- Deleting Open Single Management Platform connection
- Importing events from the Open Single Management Platform database
- Kaspersky Endpoint Detection and Response integration
- Integration with Kaspersky CyberTrace
- Integration with Kaspersky Threat Intelligence Portal
- Connecting over LDAP
- Enabling and disabling LDAP integration
- Adding a tenant to the LDAP server integration list
- Creating an LDAP server connection
- Creating a copy of an LDAP server connection
- Changing an LDAP server connection
- Changing the data update frequency
- Changing the data storage period
- Starting account data update tasks
- Deleting an LDAP server connection
- Integration with the Security Orchestration Automation and Response Platform (SOAR)
- Integration with KICS/KATA
- Integration with Neurodat SIEM IM
- Kaspersky Automated Security Awareness Platform
- Sending notifications to Telegram
- UserGate integration
- Integration with Kaspersky Web Traffic Security
- Integration with Kaspersky Secure Mail Gateway
- Importing asset information from RedCheck
- Configuring receipt of Sendmail events
- Integration with Open Single Management Platform
Integration with other solutions
In this section, you'll learn how to integrate KUMA with other solutions to enrich its functionality.
Integration with Open Single Management Platform
You can configure integration with selected Open Single Management Platform servers for one, several, or all KUMA tenants. If Open Single Management Platform integration is enabled, you can import information about the assets protected by this application, manage assets using tasks, and import events from the Open Single Management Platform event database.
First, you need to make sure that the relevant Open Single Management Platform server allows an incoming connection for the server hosting KUMA.
Configuring KUMA integration with Open Single Management Platform includes the following steps:
- Creating a user account in the Open Single Management Platform Administration Console
The credentials of this account are used when creating a secret to establish a connection with Open Single Management Platform. Different tasks may require different access rights.
For more details about creating a user account and assigning permissions to a user, please refer to the Open Single Management Platform Help Guide.
- Creating a secret of the credentials type for connecting to Open Single Management Platform
- Configuring Open Single Management Platform integration settings
- Creating a connection to the Open Single Management Platform server for importing information about assets
If you want to import information about assets registered on Open Single Management Platform servers into KUMA, you need to create a separate connection to each Open Single Management Platform server for each selected tenant.
If integration is disabled for the tenant or there is no connection to Open Single Management Platform, an error is displayed in the KUMA Console when attempting to import information about assets. In this case, the import process does not start.
Configuring Open Single Management Platform integration settings
To configure the settings for integration with Open Single Management Platform:
- Open the web interface of Kaspersky Unified Monitoring and Analysis Platform and select the Settings → Open Single Management Platform section.
The Open Single Management Platform integration by tenant window opens.
- Select the tenant for which you want to configure integration with Open Single Management Platform.
The Open Single Management Platform integration window opens.
- Enable or disable integration with Open Single Management Platform for the tenant:
- If you want to enable integration, clear the Disabled check box.
- If you want to disable integration, select the Disabled check box.
This check box is cleared by default.
- Specify intervals for automatic import of asset information and asset vulnerability information from Open Single Management Platform:
- In the KSC assets, hardware information field, enter the interval in hours for the automatic import of information about the basic attributes of assets (protection status, anti-virus database version, hardware). and must be an integer. The default setting is
1(1 hour). - In the KSC assets attributes (vulnerabilities, software, owners) field, enter the interval in hours for automatic import of information about other attributes of assets (vulnerabilities, software, owners). and must be an integer. The default setting is
12(12 hours).Importing the information about asset attributes (vulnerabilities, software, owners) may involve downloading a large amount of data, which may take a longer time to complete, we recommend setting a longer interval than for the hardware information import.
If necessary, you can manually import asset information and asset vulnerability information from Open Single Management Platform.
- In the KSC assets, hardware information field, enter the interval in hours for the automatic import of information about the basic attributes of assets (protection status, anti-virus database version, hardware). and must be an integer. The default setting is
- Click the Save button.
The Open Single Management Platform integration settings for the selected tenant will be configured.
If the tenant you need is missing from the list of tenants, you need to add the tenant to the list of tenants.
Page topAdding a tenant to the list for Open Single Management Platform integration
To add a tenant to the list of tenants for integration with Open Single Management Platform:
- Open the KUMA web console and select Settings → Open Single Management Platform.
The Open Single Management Platform integration by tenant appears.
- Click the Add tenant button.
The Open Single Management Platform integration window appears.
- In the Tenant drop-down list, select the tenant that you need to add.
- Click the Save button.
The selected tenant will be added to the list of tenants for integration with Open Single Management Platform.
Page topCreating Open Single Management Platform connection
To create a new Open Single Management Platform connection:
- Open the web interface of Kaspersky Unified Monitoring and Analysis Platform and select the Settings → Open Single Management Platform section.
The Open Single Management Platform integration by tenant window opens.
- Select the tenant for which you want to create a connection to Open Single Management Platform.
- Click the Add connection button and define the values for the following settings:
- Name (required)—the name of the connection. The name can contain 1 to 128 Unicode characters.
- URL (required)—the URL of the Open Single Management Platform server in hostname:port or IPv4:port format.
- In the Secret drop-down list, select the secret with the Open Single Management Platform account credentials or create a new secret.
- Click the
 button.
The secret window is displayed.
- Enter information about the secret:
- In the Name field, choose a name for the added secret.
- In the Tenant drop-down list, select the tenant that will own the Open Single Management Platform account credentials.
- In the Type drop-down list, select credentials.
- In the User and Password fields, enter credentials for your Open Single Management Platform server.
- If you want, enter a Description of the secret.
- Click Save.
You can change the selected secret by clicking
 .
. - Click the
- Disabled—the state of the connection to the selected Open Single Management Platform server. If the check box is selected, the connection to the selected server is inactive. If this is the case, you cannot use this connection to connect to the Open Single Management Platform server.
This check box is cleared by default.
- If you want Kaspersky Unified Monitoring and Analysis Platform to import only assets that are connected to secondary servers or included in groups:
- Click the Load hierarchy button.
- Select the check boxes next to the names of the secondary servers and groups from which you want to import asset information.
- If you want to import assets only from new groups, select the Import assets from new groups check box.
If no check boxes are selected, information about all assets of the selected Open Single Management Platform server is uploaded during the import.
- Click the Save button.
The connection to the Open Single Management Platform server is now created. You can use it to import asset information from Open Single Management Platform to Kaspersky Unified Monitoring and Analysis Platform or to create tasks related to assets in Open Single Management Platform from Kaspersky Unified Monitoring and Analysis Platform.
Page topEditing Open Single Management Platform connection
To edit a Open Single Management Platform connection:
- Open the web interface of Kaspersky Unified Monitoring and Analysis Platform and select the Settings → Open Single Management Platform section.
The Open Single Management Platform integration by tenant window opens.
- Select the tenant for which you want to configure integration with Open Single Management Platform.
The Open Single Management Platform integration window opens.
- Click the Open Single Management Platform connection you want to change.
The window with the selected Open Single Management Platform connection parameters opens.
- Make the necessary changes to the settings.
- Click the Save button.
The Open Single Management Platform connection will be changed.
Page topDeleting Open Single Management Platform connection
To delete a Open Single Management Platform connection:
- Open the web interface of Kaspersky Unified Monitoring and Analysis Platform and select the Settings → Open Single Management Platform section.
The Open Single Management Platform integration by tenant window opens.
- Select the tenant for which you want to configure integration with Open Single Management Platform.
The Open Single Management Platform integration window opens.
- Select the Open Single Management Platform connection that you want to delete.
- Click the Delete button.
The Open Single Management Platform connection will be deleted.
Page topImporting events from the Open Single Management Platform database
In KUMA, you can receive events from the Open Single Management Platform SQL database. Events are received using the collector, which uses the following resources:
- Predefined [OOTB] KSC MSSQL, [OOTB] KSC MySQL, or [OOTB] KSC PostgreSQL connector.
- Predefined [OOTB] KSC from SQL normalizer.
Configuring the import of events from Open Single Management Platform proceeds in stages:
- Create a copy of the predefined connector.
The settings of the predefined connector are not editable, therefore, to configure the connection to the database server, you must create a copy of the predefined connector.
- Creating a collector:
- In the web interface.
- On the server.
To configure the import of events from Open Single Management Platform:
- Create a copy of the predefined connector corresponding to the type of database used by Open Single Management Platform:
- In the KUMA Console, in the Resources → Connectors section, find the relevant predefined connector in the folder hierarchy, select the check box next to that connector, and click Duplicate.
- This opens the Create connector window; in that window, on the Basic settings tab, in the Default query field, if necessary, replace the KAV database name with the name of the Open Single Management Platform database you are using.
An example of a query to the Open Single Management Platform SQL database
- Place the cursor in the URL field and in the displayed list, click
 in the line of the secret that you are using.
 - This opens the Secret window; in that window, in the URL field, specify the server connection address in the following format:
sqlserver://user:password@kscdb.example.com:1433/databasewhere:
user—user account with public and db_datareader rights to the required database.password—user account password.kscdb.example.com:1433—address and port of the database server.database—name of the Open Single Management Platform database. 'KAV' by default.
Click Save.
- In the Create connector window, in the Connection section, in the Query field, replace the 'KAV' database name with the name of the Open Single Management Platform database you are using.
You must do this if you want to use the ID column to which the query refers.
Click Save.
- Install the collector in the web interface:
- Start the Collector Installation Wizard in one of the following ways:
- In the web interface of Kaspersky Unified Monitoring and Analysis Platform, in the Resources section, click Add event source.
- In the web interface of Kaspersky Unified Monitoring and Analysis Platform, in the Resources → Collectors section, click Add collector.
- At step 1 of the installation wizard, Connect event sources, specify the collector name and select the tenant.
- At step 2 of the installation wizard, Transport, select the copy of the connector that you created at step 1.
- At step 3 of the installation wizard, Event parsing, on the Parsing schemes tab, click Add event parsing.
- This opens the Basic event parsing window; in that window, on the Normalization scheme tab, select [OOTB] KSC from SQL in the Normalizer drop-down list and click OK.
- If necessary, specify the other settings in accordance with your requirements for the collector. For the purpose of importing events, editing settings at the remaining steps of the Installation Wizard is optional.
- At step 8 of the installation wizard, Setup validation, click Create and save service.
The lower part of the window displays the command that you must use to install the collector on the server. Copy this command to the clipboard.
- Close the Collector Installation Wizard by clicking Save collector.
- Start the Collector Installation Wizard in one of the following ways:
- Install the collector on the server.
To do so, on the server on which you want to receive Open Single Management Platform events, run the command that you copied to the clipboard after creating the collector in the web interface.
As a result, the collector is installed and can receive events from the SQL database of Open Single Management Platform.
You can view Open Single Management Platform events in the Events section of the web interface.
Page topKaspersky Endpoint Detection and Response integration
Kaspersky Endpoint Detection and Response (hereinafter also referred to as "KEDR") is a functional unit of Kaspersky Anti Targeted Attack Platform that protects assets in an enterprise LAN.
You can configure KUMA integration with Kaspersky Endpoint Detection and Response 4.1 and 5.0 to manage threat response actions on assets connected to Kaspersky Endpoint Detection and Response servers, and on Open Single Management Platform assets. Commands to perform operations are received by the Kaspersky Endpoint Detection and Response server, which then relays those commands to the Kaspersky Endpoint Agent installed on assets.
You can also import events to KUMA and receive information about Kaspersky Endpoint Detection and Response alerts (for more details, see the Configuring integration with an SIEM system section of the Kaspersky Anti Targeted Attack Platform online help).
When KUMA is integrated with Kaspersky Endpoint Detection and Response, you can perform the following operations on Kaspersky Endpoint Detection and Response assets that have Kaspersky Endpoint Agent:
- Manage network isolation of assets.
- Manage prevention rules.
- Start applications.
To get instructions on configuring integration for response action management, contact your account manager or Technical Support.
Importing Kaspersky Endpoint Detection and Response events using the kafka connector
When importing events from Kaspersky Endpoint Detection and Response, telemetry is transmitted in clear text and may be intercepted by an intruder.
Kaspersky Endpoint Detection and Response 4.0, 4.1, 5.0, and 5.1 events can be imported to KUMA using a Kafka connector.
Several limitations are applicable to the import of events from Kaspersky Endpoint Detection and Response 4.0 and 4.1:
- Import of events is available if the KATA and KEDR license keys are used in Kaspersky Endpoint Detection and Response.
- Import of events is not available if the Sensor component installed on a separate server is used as part of Kaspersky Endpoint Detection and Response.
To import events, perform the actions in Kaspersky Endpoint Detection and Response and in KUMA.
Importing events from Kaspersky Endpoint Detection and Response 4.0 or 4.1
To import Kaspersky Endpoint Detection and Response 4.0 or 4.1 events to KUMA:
In Kaspersky Endpoint Detection and Response:
- Use SSH or a terminal to log in to the management console of the Central Node server from which you want to export events.
- When prompted by the system, enter the administrator account name and the password that was set during installation of Kaspersky Endpoint Detection and Response.
The program component administrator menu is displayed.
- In the program component administrator menu, select Technical Support Mode.
- Press Enter.
The Technical Support Mode confirmation window opens.
- Confirm that you want to operate the application in Technical Support Mode. To do so, select Yes and press Enter.
- Run the following command:
sudo -i - In the
/etc/sysconfig/apt-servicesconfiguration file, in theKAFKA_PORTSfield, delete the value10000.If Secondary Central Node servers or the Sensor component installed on a separate server are connected to the Central Node server, you need to allow the connection with the server where you modified the configuration file via port 10000.
We do not recommend using this port for any external connections other than KUMA. To restrict connections over port 10000 only for KUMA, run the following command:
iptables -I INPUT -p tcp ! -s KUMA_IP_address --dport 10000 -j DROP - In the configuration file
/usr/bin/apt-start-sedr-iptablesadd the value10000in theWEB_PORTSfield, separated by a comma without a space. - Run the following command:
sudo sh /usr/bin/apt-start-sedr-iptables
Preparations for exporting events on the Kaspersky Endpoint Detection and Response side are now complete.
In KUMA:
- On the KUMA server, add the IP address of the Central Node server in the format
<IP address> centralnodeto one of the following files:%WINDIR%\System32\drivers\etc\hosts—for Windows./etc/hosts file—for Linux.
- In the KUMA Console, create a connector of the Kafka type.
When creating a connector, specify the following parameters:
- In the URL field, specify
<Central Node server IP address>:10000. - In the Topic field, specify
EndpointEnrichedEventsTopic. - In the Consumer group field, specify any unique name.
- In the URL field, specify
- In the KUMA Console, create a collector.
Use the connector created at the previous step as the transport for the collector. Use "[OOTB] KEDR telemetry" as the normalizer for the collector.
If the collector is successfully created and installed, Kaspersky Endpoint Detection and Response events will be imported into KUMA. You can find and view these events in the events table.
Importing events from Kaspersky Endpoint Detection and Response 5.0 and 5.1
Several limitations apply when importing events from Kaspersky Endpoint Detection and Response 5.0 and 5.1:
- Import of events is available only for the non-high-availability version of Kaspersky Endpoint Detection and Response.
- Import of events is available if the KATA and KEDR license keys are used in Kaspersky Endpoint Detection and Response.
- Import of events is not available if the Sensor component installed on a separate server is used as part of Kaspersky Endpoint Detection and Response.
To import Kaspersky Endpoint Detection and Response 5.0 or 5.1 events to KUMA:
In Kaspersky Endpoint Detection and Response:
- Use SSH or a terminal to log in to the management console of the Central Node server from which you want to export events.
- When prompted by the system, enter the administrator account name and the password that was set during installation of Kaspersky Endpoint Detection and Response.
The program component administrator menu is displayed.
- In the program component administrator menu, select Technical Support Mode.
- Press Enter.
The Technical Support Mode confirmation window opens.
- Confirm that you want to operate the application in Technical Support Mode. To do so, select Yes and press Enter.
- In the
/usr/local/lib/python3.8/dist-packages/firewall/create_iptables_rules.pyconfiguration file, specify the additional port10000for theWEB_PORTSconstant:WEB_PORTS = f'10000,80,{AppPort.APT_AGENT_PORT},{AppPort.APT_GUI_PORT}'You do not need to perform this step for Kaspersky Endpoint Detection and Response 5.1 because the port is specified by default. - Run the following commands:
kata-firewall stopkata-firewall start --cluster-subnet <network mask for addressing cluster servers>
Preparations for exporting events on the Kaspersky Endpoint Detection and Response side are now complete.
In KUMA:
- On the KUMA server, add the IP address of the Central Node server in the format
<IP address> kafka.services.external.dyn.katato one of the following files:%WINDIR%\System32\drivers\etc\hosts—for Windows./etc/hosts file—for Linux.
- In the KUMA Console, create a connector of the Kafka type.
When creating a connector, specify the following parameters:
- In the URL field, specify
<Central Node server IP address>:10000. - In the Topic field, specify
EndpointEnrichedEventsTopic. - In the Consumer group field, specify any unique name.
- In the URL field, specify
- In the KUMA Console, create a collector.
Use the connector created at the previous step as the transport for the collector. It is recommended to use the [OOTB] KEDR telemetry normalizer as the normalizer for the collector.
If the collector is successfully created and installed, Kaspersky Endpoint Detection and Response events will be imported into KUMA. You can find and view these events in the events table.
Page topImporting Kaspersky Endpoint Detection and Response events using the kata/edr connector
To import Kaspersky Endpoint Detection and Response 5.1 events from hosts using the kata/edr connector:
- Configure event receipt on the KUMA side. To do this, in KUMA, create and install a collector with the 'kata/edr' connector or edit an existing collector, then save the modified settings and restart the collector.
- On the KEDR side, accept the authorization request from KUMA to begin receiving events in KUMA.
As a result, the integration is configured and KEDR events start arriving in KUMA.
Creating a collector for receiving events from KEDR
To create a collector for receiving events from KEDR:
- In KUMA → Resources → Collectors, select Add collector.
- This opens the Create collector window; in that window, at step 1 "Connect event sources", specify an arbitrary Collector name and in the drop-down list, select the appropriate Tenant.
- At step 2 "Transport", do the following:
- On the Basic settings tab:
- In the Connector field, select Create or start typing the name of the connector if you want to use a previously created connector.
- In the Connector type drop-down list, select the kata/edr connector. After you select the kata/edr connector type, more fields to fill in are displayed.
- In the URL field, specify the address for connecting to the KEDR server in the following <
name or IP address of the host>:<connection port, 443 by default> format. If the KEDR solution is deployed in a cluster, you can click Add to add all nodes. KUMA will connect to each specified node in sequence. If the KEDR solution is installed in a distributed configuration, on the KUMA side, you must configure a separate collector for each KEDR server. - In the Secret field, select Create to create a new secret. This opens the Create secret window; in that window, specify the Name and click Generate and download a certificate and private encryption key.
As a result, the certificate.zip archive is downloaded to the browser's Downloads folder; the archive contains the 'key.pem' key file and the 'cert.pem' certificate file. Unpack the archive. Click Upload certificate and select the cert.pem file. Click Upload private key and select the key.pem file. Click Create; the secret is added to the Secret drop-down list and automatically selected.
You can also select the created secret from the Secret list. KUMA uses the selected secret to connect to KEDR.
- The External ID field contains the ID for external systems. This ID is displayed in the KEDR web interface when authorizing the KUMA server. KUMA generates an ID automatically and the External ID field is automatically pre-populated.
- On the Advanced settings tab:
- To get detailed information in the collector log, move the Debug toggle switch to the enabled position.
- If necessary, in the Character encoding field, select the encoding of the source data to be converted to UTF-8. We only recommend configuring a conversion if you find invalid characters in the fields of the normalized event. By default, no value is selected.
- Specify the maximum Number of events per one request to KEDR. The default value is 0, which means that KUMA uses the value specified on the KEDR server. For details, please refer to KATA Help. You can specify an arbitrary value that must not exceed the value on the KEDR side. If the value you specify exceeds the value of the Maximum number of events setting specified on the KEDR server, the KUMA collector log will display the error "Bad Request: max_events N is greater than the allowed value".
- Fill in the Events fetch timeout field to receive events after a specified period of time. The default value is 0. This means that the default value of the KEDR server is applied. For details, please refer to KATA Help. This field specifies the time after which the KEDR server must send events to KUMA. The KEDR server uses two parameters: the maximum number of events and the events fetch timeout. Events are sent when the specified number of events is collected or the configured time elapses, whichever happens first. If the specified time has elapsed, but the specified number of events has not been collected, the KEDR server sends the events that it already has, without waiting for more.
- In the Client timeout field, specify how long KUMA must wait for a response from the KEDR server, in seconds. Default value: 1,800 s; displayed as 0. The client-side limit is specified in the Client timeout field. The Client timeout must be greater than the Events fetch timeout of the server to wait for the server's response without interrupting the current event collection task with a new request. If the response from the KEDR server does not arrive in the end, KUMA repeats the request.
- In the KEDRQL filter field, specify the conditions for filtering the request. As a result, pre-filtered events are received from KEDR. For details about available filter fields, please refer to the KATA Help.
- On the Basic settings tab:
- At step 3 "Parsing", click Add event parsing and select "[ООТВ] KEDR telemetry" in the Basic event parsing window.
- To finish creating the collector in the web interface, click Create and save service. Then copy the collector installation command from the web interface and run this installation command on the command line on the server where you want to install the collector.
If you were editing an existing collector, click Save and restart services.
As a result, the collector is created and is ready to send requests; the collector is displayed in the Resources → Active services section with the yellow status until KEDR accepts an authorization request from KUMA.
Authorizing KUMA on the KEDR side
After the collector is created in KUMA, for requests from KUMA to start arriving to KEDR, the KUMA authorization request must be accepted on the KEDR side. With the authorization request accepted, the KUMA collector automatically sends scheduled requests to KEDR and waits for a response. While waiting, the status of the collector is yellow, and after receiving the first response to a request, the status of the collector turns green.
As a result, the integration is configured and you can view events arriving from KEDR in the KUMA → Events section.
The initial request fetches part of the historical events that had occurred before the integration was configured. Current events begin arriving after all of the historical events. If you change the value of the URL setting or the External ID of an existing collector, KEDR treats the next request as an initial request, and after starting the KUMA collector with the modified settings, you will receive part of the historical events all over again. If you do not want to receive historical events, go to the settings of the relevant collector, configure the mapping of the KEDR and KUMA timestamp fields in the normalizer, and specify a filter by timestamp at the 'Event filtering' step of the collector installation wizard — the timestamp of the event must be greater than the timestamp when the collector is started.
Possible errors and solutions
If in the collector log, you see the "Conflict: An external system with the following ip and certificate digest already exists. Either delete it or provide a new certificate" error, create a new secret with the a certificate in the connector of the collector.
If in the collector log, you see the "Continuation token not found" error in response to an event request, create a new connector, attach it to the collector and restart the collector; alternatively, create a new secret with a new certificate in the connector of the collector. If you do not want to receive events generated before the error occurred, configure a Timestamp filter in the collector.
Page topConfiguring the display of a link to a Kaspersky Endpoint Detection and Response detection in KUMA event details
When Kaspersky Endpoint Detection and Response detections are received, KUMA creates an alert for each detection. You can configure the display of a link to a Kaspersky Endpoint Detection and Response detection in KUMA alert information.
You can configure the display of a detection link if you use only one Central Node server in Kaspersky Endpoint Detection and Response. If Kaspersky Endpoint Detection and Response is used in a distributed solution mode, it is impossible to configure the display of the links to Kaspersky Endpoint Detection and Response detections in KUMA.
To configure the display of a link to a detection in KUMA alert details, you need to complete steps in the Kaspersky Endpoint Detection and Response web interface and KUMA.
In the Kaspersky Endpoint Detection and Response web interface, you need to configure the integration of the application with KUMA as a SIEM system. For details on configuring integration, refer to the Kaspersky Anti Targeted Attack Platform documentation, Configuring integration with a SIEM system section.
Configuring the display of a link in the KUMA Console includes the following steps:
- Adding an asset that contains information about the Kaspersky Endpoint Detection and Response Central Node server from which you want to receive detections, and assigning a category to that asset.
- Creating a correlation rule.
- Creating a correlator.
You can use a pre-configured correlation rule. In this case configuring the display of a link in the KUMA Console includes the following steps:
- Creating a correlator.
Select the
[OOTB] KATA Alertcorrelation rule. - Adding an asset that contains information about the Kaspersky Endpoint Detection and Response Central Node server from which you want to receive detections and assigning a category
KATA standAloneto that asset.
Step 1. Adding an asset and assigning a category to it
First, you need to create a category that will be assigned to the asset being added.
To add a category:
- In the KUMA Console, select the Assets section.
- On the All assets tab, expand the category list of the tenant by clicking
 next to its name.
 - Select the required category or subcategory and click the Add category button.
The Add category details area appears in the right part of the web interface window.
- Define the category settings:
- In the Name field, enter the name of the category.
- In the Parent field, indicate the position of the category within the categories tree hierarchy. To do so, click the button
 and select a parent category for the category you are creating.
Selected category appears in Parent fields.
- If required, define the values for the following settings:
- Assign a severity to the category in the Priority drop-down list.
The specified severity is assigned to correlation events and alerts associated with the asset.
- If required, add a description for the category in the Description field.
- In the Categorization kind drop-down list, select how the category will be populated with assets. Depending on your selection, you may need to specify additional settings:
- Manually—assets can only be manually linked to a category.
- Active—assets will be assigned to a category at regular intervals if they satisfy the defined filter.
- Reactive—the category will be filled with assets by using correlation rules.
- Assign a severity to the category in the Priority drop-down list.
- Click the Save button.
To add an asset:
- In the KUMA Console, select the Assets section.
- Click the Add asset button.
The Add asset details area opens in the right part of the window.
- Define the following asset parameters:
- In the Asset name field, enter an asset name.
- In the Tenant drop-down list, select the tenant that will own the asset.
- In the IP address field, specify the IP address of the Kaspersky Endpoint Detection and Response Central Node server from which you want to receive detections.
- In the Categories field, select the category that you added in the previous step.
If you are using a predefined correlation rule, you need to select the
KATA standAlonecategory. - If required, define the values for the following fields:
- In the FQDN field, specify the Fully Qualified Domain Name of the Kaspersky Endpoint Detection and Response server.
- In the MAC address field, specify the MAC address of the Central Node Kaspersky Endpoint Detection and Response Central Node server.
- In the Owner field, define the name of the asset owner.
- Click the Save button.
Step 2. Adding a correlation rule
To add a correlation rule:
- In the KUMA Console, select the Resources section.
- Select Correlation rules and click the Create correlation rule button.
- On the General tab, specify the following settings:
- In the Name field, define the rule name.
- In the Type drop-down list, select simple.
- In the Propagated fields field, add the following fields: DeviceProduct, DeviceAddress, EventOutcome, SourceAssetID, DeviceAssetID.
- If required, define the values for the following fields:
- In the Rate limit field, define the maximum number of times per second that the rule will be triggered.
- In the Severity field, define the severity of alerts and correlation events that will be created as a result of the rule being triggered.
- In the Description field, provide any additional information.
- On the Selectors → Settings tab, specify the following settings:
- In the Filter drop-down list, select Create new.
- In the Conditions field, click the Add group button.
- In the operator field for the group you added, select AND.
- Add a condition for filtering by KATA value:
- In the Conditions field, click the Add condition button.
- In the condition field, select If.
- In the Left operand field, select Event field.
- In the Event field field, select DeviceProduct.
- In the operator field, select =.
- In the Right operand field, select constant.
- In the value field, enter KATA.
- Add a category filter condition:
- In the Conditions field, click the Add condition button.
- In the condition field, select If.
- In the Left operand field, select Event field.
- In the Event field field, select DeviceAssetID.
- In the operator field, select inCategory.
- In the Right operand field, select constant.
- Click the button.
- Select the category in which you placed the Kaspersky Endpoint Detection and Response Central Node server asset.
- Click the Save button.
- In the Conditions field, click the Add group button.
- In the operator field for the group you added, select OR.
- Add a condition for filtering by event class identifier:
- In the Conditions field, click the Add condition button.
- In the condition field, select If.
- In the Left operand field, select Event field.
- In the Event field field, select DeviceEventClassID.
- In the operator field, select =.
- In the Right operand field, select constant.
- In the value field, enter taaScanning.
- Repeat steps 1–7 in F for each of the following event class IDs:
- file_web.
- file_mail.
- file_endpoint.
- file_external.
- ids.
- url_web.
- url_mail.
- dns.
- iocScanningEP.
- yaraScanningEP.
- On the Actions tab, specify the following settings:
- In the Actions section, open the On every event drop-down list.
- Select the Output check box.
- In the Enrichment section, click the Add enrichment button.
- In the Source kind drop-down list, select template.
- In the Template field, enter https://{{.DeviceAddress}}:8443/katap/#/alerts?id={{.EventOutcome}}.
- In the Target field drop-down list, select DeviceExternalID.
- If necessary, turn on the Debug toggle switch to log information related to the operation of the resource.
- Click the Save button.
Step 3. Creating a correlator
You need to launch the correlator installation wizard. At step 3 of the wizard, you are required to select the correlation rule that you added by following this guide.
After the correlator is created, a link to these detections will be displayed in the details of alerts created when receiving detections from Kaspersky Endpoint Detection and Response. The link is displayed in the correlation event details (Related events section), in the DeviceExternalID field.
If you want the FQDN of the Kaspersky Endpoint Detection and Response Central Node server to be displayed in the DeviceHostName field, in the detection details, you need to create a DNS record for the server and create a DNS enrichment rule at step 4 of the wizard.
Page topIntegration with Kaspersky CyberTrace
Kaspersky CyberTrace (hereinafter CyberTrace) is a tool that integrates threat data streams with SIEM solutions. It provides users with instant access to analytics data, increasing their awareness of security decisions.
You can integrate CyberTrace with KUMA in one of the following ways:
- Integrate CyberTrace indicator search feature to enrich KUMA events with information from CyberTrace data streams.
- Integrate the entire CyberTrace web interface into KUMA to get full access to CyberTrace.
Integration with the CyberTrace web interface requires the CyberTrace TIP Enterprise license.
Integrating CyberTrace indicator search
To integrate CyberTrace indicator search:
- Configure CyberTrace to receive and process KUMA requests.
You can configure the integration with KUMA immediately after installing CyberTrace in the Quick Start Wizard or later in the CyberTrace web interface.
- Create an event enrichment rule in KUMA.
In the enrichment rule, you can specify which data from CyberTrace you want to enrich the event with. We recommend selecting cybertrace-http as the source kind.
- Create a collector to receive events that you want to enrich with CyberTrace data.
- Link the enrichment rule to the collector.
- Save and create the service:
- If you linked the rule to a new collector, click Save and create, copy the collector ID in the opened window and use the copied ID to install the collector on the server using the command line interface.
- If you linked the rule to an existing collector, click Save and restart services to apply the settings.
The configuration of the integration of CyberTrace indicator search is complete and KUMA events will be enriched with CyberTrace data.
Example of testing CyberTrace data enrichment.
Configuring CyberTrace to receive and process requests
You can configure CyberTrace to receive and process requests from KUMA immediately after its installation in the Quick Start Wizard or later in the program web interface.
To configure CyberTrace to receive and process requests in the Quick Start Wizard:
- Wait for the CyberTrace Quick Start Wizard to start after the program is installed.
The wizard starts at step 1, Welcome to Kaspersky CyberTrace. You can go to the next step of the wizard by clicking Next.
- At step 2, Proxy settings, if your organization uses a proxy server, enter its connection settings. If your organization does not use a proxy server, leave all fields blank.
- At step 3, Licensing settings, select the method for adding a license key for CyberTrace: an activation code or a license key file. Depending on the selected method, specify the activation code or upload a license key file.
- At step 4, Service settings, keep default settings.
- At step 5, Data management settings:
- In the SIEM system drop-down list, select KUMA.
- Under Listen on, select the IP and port option.
- In the IP address field, enter
0.0.0.0. - In the Port field, enter the port to listen on for events. The default port is
9999. - Under Send detection alerts, in the IP address field, enter
127.0.0.1, and in the Port field, enter9998.
Leave the default values for everything else.
- At step 6, Certificate settings, select Commercial certificate and add a certificate that allows you to download data feeds from update servers.
- At step 7, Feeds settings, keep default settings.
CyberTrace is configured.
To configure CyberTrace to receive and process requests in the program web interface:
- In the window of the CyberTrace web interface, switch Data management mode: in the left menu, select System, and then in the displayed menu, select General.
- Select the Settings → General section.
- Under Listen on:
- Select IP and port.
- In the IP address field, enter
0.0.0.0. - In the Port field, enter the port to listen on for events. The default port is
9999.
- Select the Settings → Service alerts section.
- In the Service alert format field, enter
%Date% alert=%Alert%%RecordContext%. - In the Records context format field, enter
|%ParamName%=%ParamValue%. - Select the Settings → Detection alerts section.
- In the Alert format field, enter
Category=%Category%|MatchedIndicator=%MatchedIndicator%%RecordContext%. - On the Context tab, in the Actionable fields field, enter
%ParamName%:%ParamValue%. - Switch to the System management mode: in the left menu, select General, then in the displayed menu, select System.
- Select the Settings → Service section.
- Under Web interface, in the IP address or host name, enter
127.0.0.1. - In the upper toolbar, click Restart service.
- Restart the CyberTrace server.
CyberTrace is configured.
Page topCreating event Enrichment rules
To create event enrichment rules:
- In the KUMA Console, open the Resources → Enrichment rules section and in the left part of the window, select or create a folder for the new rule.
The list of available enrichment rules will be displayed.
- Click Add enrichment rule to create a new rule.
The enrichment rule window will be displayed.
- Enter the rule configuration parameters:
- In the Name field, enter a unique name for the rule. The name must contain 1 to 128 Unicode characters.
- In the Tenant drop-down list, select the tenant that will own this resource.
- In the Source kind drop-down list, select cybertrace-http.
- Specify the URL of the CyberTrace server to which you want to connect. For example, example.domain.com:9999.
- If necessary, use the Number of connections field to specify the maximum number of connections to the CyberTrace server that can be simultaneously established by KUMA. By default, this value is equal to the number of vCPUs of the KUMA Core server.
- In the RPS field, enter the number of requests to the CyberTrace server per second that KUMA can make. The default value is
1000. - In the Timeout field, specify the maximum number of seconds KUMA should wait for a response from the CyberTrace server. Until a response is received or the time expires, the event is not sent to the Correlator. If a response is received before the timeout, it is added to the
TIfield of the event and the event processing continues. The default value is30. - In the Mapping settings block, you must specify the fields of events to be checked via CyberTrace, and define the rules for mapping fields of KUMA events to CyberTrace indicator types:
- In the KUMA field column, select the field whose value must be sent to CyberTrace.
- In the CyberTrace indicator column, select the CyberTrace indicator type for every field you selected:
- ip
- url
- hash
You must provide at least one string to the table. You can use the Add row button to add a string, and can use the
 button to remove a string.
 - Use the Debug toggle switch to indicate whether or not to enable logging of service operations. Logging is disabled by default.
- If necessary, in the Description field, add up to 4,000 Unicode characters describing the resource.
- In the Filter section, you can specify conditions to identify events that will be processed using the enrichment rule. You can select an existing filter from the drop-down list or create a new filter.
Creating a filter in resources
To create a filter:
- In the Filter drop-down list, select Create new.
- If you want to keep the filter as a separate resource, select the Save filter check box. In this case, you will be able to use the created filter in various services. This check box is cleared by default.
- If you selected the Save filter check box, enter a name for the created filter resource in the Name field. Maximum length of the name: 128 Unicode characters.
- In the Conditions settings block, specify the conditions that the events must meet:
- Click the Add condition button.
- In the Left operand and Right operand drop-down lists, specify the search parameters. Depending on the data source selected in the Right operand field, there may be fields of additional parameters for identifying the value to be passed to the filter. For example, when you select active list, you must specify the name of the active list, the entry key, and the entry key field.
- In the operator drop-down list, select an operator.
- If you want the operator to be case-insensitive, select the do not match case check box. The selection of this check box does not apply to the InSubnet, InActiveList, InCategory or InActiveDirectoryGroup operators. This check box is cleared by default.
- If you want to add a negative condition, select If not from the If drop-down list.
You can add multiple conditions or a group of conditions.
- If you have added multiple conditions or groups of conditions, choose a selection condition (and, or, not) by clicking the AND button.
- If you want to add existing filters that are selected from the Select filter drop-down list, click the Add filter button. You can view the nested filter settings by clicking the
 button.
- Click Save.
A new enrichment rule will be created.
CyberTrace indicator search integration is now configured. You can now add the created enrichment rule to a collector. You must restart KUMA collectors to apply the new settings.
If any of the CyberTrace fields in the events details area contains "[{" or "}]" values, it means that information from CyberTrace data feed was processed incorrectly and it's possible that some of the data is not displayed. You can get all data feed information by copying the TI indicator field value from the KUMA event and searching for this value on the CyberTrace portal in the Indicators section. All information about the found indicator is displayed on the Indicator details page.
Integrating CyberTrace interface
You can integrate the CyberTrace web interface into the KUMA Console. When this integration is enabled, the KUMA Console includes a CyberTrace section that provides access to the CyberTrace web interface. You can configure the integration in the Settings → Kaspersky CyberTrace section of the KUMA Console.
To integrate the CyberTrace web interface in KUMA:
- In the KUMA Console, open Resources → Secrets.
The list of available secrets will be displayed.
- Click the Add secret button to create a new secret. This resource is used to store credentials of the CyberTrace server.
The secret window is displayed.
- Enter information about the secret:
- In the Name field, choose a name for the added secret. The name must contain 1 to 128 Unicode characters.
- In the Tenant drop-down list, select the tenant that will own this resource.
- In the Type drop-down list, select credentials.
- In the User and Password fields, enter credentials for your CyberTrace server.
- If necessary, in the Description field, add up to 4,000 Unicode characters describing the resource.
- Click Save.
The CyberTrace server credentials are now saved and can be used in other KUMA resources.
- In the KUMA Console, open Settings → Kaspersky CyberTrace.
The window with CyberTrace integration parameters opens.
- Make the necessary changes to the following parameters:
- Disabled—clear this check box if you want to integrate the CyberTrace web interface into the KUMA Console.
- Host (required)—enter the address of the CyberTrace server.
- Port (required)—enter the port of the CyberTrace server; the default port for managing the web interface is 443.
- In the Secret drop-down list, select the secret you created before.
- You can configure access to the CyberTrace web interface in the following ways:
- Use hostname or IP when logging into the KUMA Console.
To do so, in the Allow hosts section, click Add host and in the field that appears, enter the IP or hostname of the device
on which the KUMA Console is deployed
. - Use the FQDN when logging into the KUMA Console.
If you are using the Mozilla Firefox browser to work with the program web interface, the CyberTrace section may fail to display data. In this case, configure the data display (see below).
- Use hostname or IP when logging into the KUMA Console.
- Click Save.
CyberTrace is now integrated with KUMA, and the CyberTrace section is displayed in the KUMA Console.
To configure the data display in the CyberTrace section when using the FQDN to log in to KUMA in Mozilla Firefox:
- Clear your browser cache.
- In the browser's address bar, enter the FQDN of the KUMA Console with port number 7222 as follows: https://kuma.example.com:7222.
A window will open to warn you of a potential security threat.
- Click the Details button.
- In the lower part of the window, click the Accept risk and continue button.
An exclusion will be created for the URL of the KUMA Console.
- In the browser's address bar, enter the URL of the KUMA Console with port number 7220.
- Go to the CyberTrace section.
Data will be displayed in this section.
Updating CyberTrace deny list (Internal TI)
When the CyberTrace web interface is integrated into the KUMA Console, you can update the CyberTrace denylist or Internal TI with information from KUMA events.
To update CyberTrace Internal TI:
- Open the event details area from the events table, Alert window, or correlation event window and click the link on a domain, web address, IP address, or file hash.
The context menu opens.
- Select Add to Internal TI of CyberTrace.
A confirmation window opens.
- If you want to confirm your actions and update the Internal TI with data from KUMA events, click Yes.
The selected object is now added to the CyberTrace denylist.
Page topIntegration with Kaspersky Threat Intelligence Portal
The Kaspersky Threat Intelligence Portal combines all of Kaspersky's knowledge about cyberthreats and how they're related into a single web service. When integrated with KUMA, it helps KUMA users to make faster and better-informed decisions, providing them with data about URLs, domains, IP addresses, WHOIS / DNS data.
Access to the Kaspersky Threat Intelligence Portal is provided based on a fee. License certificates are created by Kaspersky experts. To obtain a certificate for Kaspersky Threat Intelligence Portal, contact your Technical Account Manager.
Initializing integration
To integrate Kaspersky Threat Intelligence Portal into KUMA:
- In the KUMA Console, open Resources → Secrets.
The list of available secrets will be displayed.
- Click the Add secret button to create a new secret. This resource is used to store credentials of your Kaspersky Threat Intelligence Portal account.
The secret window is displayed.
- Enter information about the secret:
- In the Name field, choose a name for the added secret.
- In the Tenant drop-down list, select the tenant that will own the created resource.
- In the Type drop-down list, select ktl.
- In the User and Password fields, enter credentials for your Kaspersky Threat Intelligence Portal account.
- If you want, enter a Description of the secret.
- Upload your Kaspersky Threat Intelligence Portal certificate key:
- Click the Upload PFX button and select the PFX file with your certificate.
The name of the selected file appears to the right of the Upload PFX button.
- Enter the password to the PFX file in the PFX password field.
- Click the Upload PFX button and select the PFX file with your certificate.
- Click Save.
The Kaspersky Threat Intelligence Portal account credentials are now saved and can be used in other KUMA resources.
- In the Settings section of the KUMA Console, open the Kaspersky Threat Lookup tab.
The list of available connections will be displayed.
- Make sure the Disabled check box is cleared.
- In the Secret drop-down list, select the secret you created before.
You can create a new secret by clicking the button with the plus sign. The created secret will be saved in the Resources → Secrets section.
- If necessary, select a proxy server in the Proxy drop-down list.
- Click Save.
- After you save the settings, log in to the web interface and accept the Terms of Use. Otherwise, an error will be returned in the API.
The integration process of Kaspersky Threat Intelligence Portal with KUMA is completed.
Once Kaspersky Threat Intelligence Portal and KUMA are integrated, you can request additional information from the event details area about hosts, domains, URLs, IP addresses, and file hashes (MD5, SHA1, SHA256).
Page topRequesting information from Kaspersky Threat Intelligence Portal
To request information from Kaspersky Threat Intelligence Portal:
- Open the event details area from the events table, Alert window, or correlation event window, and click the link on a domain, web address, IP address, or file hash.
The Threat Lookup enrichment area opens in the right part of the screen.
- Select check boxes next to the data types you want to request.
If neither check box is selected, all information types are requested.
- In the Maximum number of records in each data group field enter the number of entries per selected information type you want to receive. The default value is
10. - Click Request.
A ktl task has been created. When it is completed, events are enriched with data from Kaspersky Threat Intelligence Portal which can be viewed from the events table, Alert window, or correlation event window.
Page topViewing information from Kaspersky Threat Intelligence Portal
To view information from Kaspersky Threat Intelligence Portal:
Open the event details area from the events table, alert window, or correlation event window and click the link on a domain, web address, IP address, or file hash for which you previously requested information from Kaspersky Threat Intelligence Portal.
The event details area opens in the right part of the screen with data from Kaspersky Threat Intelligence Portal; the time when it was received is indicated at the bottom of the screen.
Information received from Kaspersky Threat Intelligence Portal is cached. If you click a domain, web address, IP address, or file hash in the event details pane for which KUMA has information available, the data from Kaspersky Threat Intelligence Portal opens, with the time it was received indicated at the bottom, instead of the Threat Lookup enrichment window. You can update the data.
Page topUpdating information from Kaspersky Threat Intelligence Portal
To update information, received from Kaspersky Threat Intelligence Portal:
- Open the event details area from the events table, alert window, or correlation event window and click the link on a domain, web address, IP address, or file hash for which you previously requested information from Kaspersky Threat Intelligence Portal.
- Click Update in the event details area containing the data received from the Kaspersky Threat Intelligence Portal.
The Threat Lookup enrichment area opens in the right part of the screen.
- Select the check boxes next to the types of information you want to request.
If neither check box is selected, all information types are requested.
- In the Maximum number of records in each data group field enter the number of entries per selected information type you want to receive. The default value is
10. - Click Update.
The KTL task is created and the new data received from Kaspersky Threat Intelligence Portal is requested.
- Close the Threat Lookup enrichment window and the details area with KTL information.
- Open the event details area from the events table, Alert window or correlation event window and click the link on a domain, URL, IP address, or file hash for which you updated Kaspersky Threat Intelligence Portal information and select Show info from Threat Lookup.
The event details area opens on the right with data from Kaspersky Threat Intelligence Portal, indicating the time when it was received on the bottom of the screen.
Page topConnecting over LDAP
LDAP connections are created and managed under Settings → LDAP server in the KUMA Console. The LDAP server integration by tenant section shows the tenants for which LDAP connections were created. Tenants can be created or deleted.
If you select a tenant, the LDAP server integration window opens to show a table containing existing LDAP connections. Connections can be created or edited. In this window, you can change the frequency of queries sent to LDAP servers and set the retention period for obsolete data.
After integration is enabled, information about Active Directory accounts becomes available in the alert window, the correlation events detailed view window, and the incidents window. If you click an account name in the Related users section of the window, the Account details window opens with the data imported from Active Directory.
Data from LDAP can also be used when enriching events in collectors and in analytics.
Imported Active Directory attributes
Enabling and disabling LDAP integration
You can enable or disable all LDAP connections of the tenant at the same time, or enable and disable an LDAP connection individually.
To enable or disable all LDAP connections of a tenant:
- In the KUMA Console, open Settings → LDAP server and select the tenant for which you want to enable or disable all LDAP connections.
The LDAP server integration by tenant window opens.
- Select or clear the Disabled check box.
- Click Save.
To enable or disable a specific LDAP connection:
- In the KUMA Console, open Settings → LDAP server and select the tenant for which you want to enable or disable an LDAP connection.
The LDAP server integration window opens.
- Select the relevant connection and either select or clear the Disabled check box in the opened window.
- Click Save.
Adding a tenant to the LDAP server integration list
To add a tenant to the list of tenants for integration with an LDAP server:
- Open the KUMA Console and select Settings → LDAP server.
The LDAP server integration by tenant window opens.
- Click the Add tenant button.
The LDAP server integration window is displayed.
- In the Tenant drop-down list, select the tenant that you need to add.
- Click Save.
The selected tenant is added to the LDAP server integration list.
To delete a tenant from the list of tenants for integration with an LDAP server:
- Open the KUMA Console and select Settings → LDAP server.
The LDAP server integration by tenant window is displayed.
- Select the check box next to the tenant that you need to delete, and click Delete.
- Confirm deletion of the tenant.
The selected tenant is deleted from the LDAP server integration list.
Page topCreating an LDAP server connection
To create a new LDAP connection to Active Directory:
- In the KUMA Console, open the Settings → LDAP server section.
- Select or create a tenant for which you want to create a LDAP connection.
The LDAP server integration by tenant window opens.
- Click the Add connection button.
The Connection parameters window opens.
- Add a secret containing the account credentials for connecting to the Active Directory server. To do so:
- If you previously added a secret, in the Secret drop-down list, select the existing secret (with the credentials type).
The selected secret can be changed by clicking on the
button. - If you want to create a new secret, click the button.
The Secret window opens.
- In the Name (required) field, enter the name of the secret containing 1 to 128 Unicode characters.
- In the User and Password (required) fields, enter the account credentials for connecting to the Active Directory server.
You can enter the user name in one of the following formats: <user name>@<domain> or <domain><user name>.
- In the Description field, enter a description of up to 4,000 Unicode characters.
- Click the Save button.
- If you previously added a secret, in the Secret drop-down list, select the existing secret (with the credentials type).
- In the Name (required) field, enter the unique name of the LDAP connection.
The length of the string must be 1 to 128 Unicode characters.
- In the URL (required) field, enter the address of the domain controller in the format
<hostname or IP address of server>:<port>.In case of server availability issues, you can specify multiple servers with domain controllers by separating them with commas. All of the specified servers must reside in the same domain.
- If you want to use TLS encryption for the connection with the domain controller, select one of the following options from the Type drop-down list:
- startTLS.
When the
method is used, first it establishes an unencrypted connection on port 389, then it sends an encryption request. If the STARTTLS command ends with an error, the connection is terminated.Make sure that port 389 is open. Otherwise, a connection with the domain controller will be impossible.
- LDAPS.
When using LDAPS, an encrypted connection is immediately established over port 636.
- insecure.
When using an encrypted connection, it is impossible to specify an IP address as a URL.
- startTLS.
- If you enabled TLS encryption at the previous step, add a TLS certificate. You must use the certificate of the certification authority that signed the LDAP server certificate. You may not use custom certificates. To add a certificate:
- If you previously uploaded a certificate, select it from the Certificate drop-down list.
If no certificate was previously added, the drop-down list shows No data.
- If you want to upload a new certificate, click the
 button on the right of the Certificate list.
The Secret window opens.
- In the Name field, enter the name that will be displayed in the list of certificates after the certificate is added.
- Click the Upload certificate file button to add the file containing the Active Directory certificate. X.509 certificate public keys in Base64 are supported.
- If necessary, provide any relevant information about the certificate in the Description field.
- Click the Save button.
The certificate will be uploaded and displayed in the Certificate list.
- If you previously uploaded a certificate, select it from the Certificate drop-down list.
- In the Timeout in seconds field, indicate the amount of time to wait for a response from the domain controller server.
If multiple addresses are indicated in the URL field, KUMA will wait the specified number of seconds for a response from the first server. If no response is received during that time, the program will contact the next server, and so on. If none of the indicated servers responds during the specified amount of time, the connection will be terminated with an error.
- In the Base DN field, enter the base distinguished name of the directory where the search request should be performed.
- In the Custom AD Account Attributes field, specify the additional attributes that you want to use to enrich events.
- Select the Disabled check box if you do not want to use this LDAP connection.
This check box is cleared by default.
- Click the Save button.
The LDAP connection to Active Directory will be created and displayed in the LDAP server integration window.
Account information from Active Directory will be requested immediately after the connection is saved, and then it will be updated at the specified frequency.
If you want to use multiple LDAP connections simultaneously for one tenant, you need to make sure that the domain controller address indicated in each of these connections is unique. Otherwise KUMA lets you enable only one of these connections. When checking the domain controller address, the program does not check whether the port is unique.
Page topCreating a copy of an LDAP server connection
You can create an LDAP connection by copying an existing connection. In this case, all settings of the original connection are duplicated in the newly created connection.
To copy an LDAP connection:
- In the KUMA Console, open Settings → LDAP server and select the tenant for which you want to copy an LDAP connection.
The LDAP server integration window opens.
- Select the relevant connection.
- In the opened Connection parameters window, click the Duplicate connection button.
The New Connection window opens. The word
copywill be added to the connection name. - If necessary, change the relevant settings.
- Click the Save button.
The new connection is created.
If you want to use multiple LDAP connections simultaneously for one tenant, you need to make sure that the domain controller address indicated in each of these connections is unique. Otherwise KUMA lets you enable only one of these connections. When checking the domain controller address, the program does not check whether the port is unique.
Page topChanging an LDAP server connection
To change an LDAP server connection:
- Open the KUMA Console and select Settings → LDAP server.
The LDAP server integration by tenant window opens.
- Select the tenant for which you want to change the LDAP server connection.
The LDAP server integration window opens.
- Click the LDAP server connection that you want to change.
The window with the settings of the selected LDAP server connection opens.
- Make the necessary changes to the settings.
- Click the Save button.
The LDAP server connection is changed. Restart the KUMA services that use LDAP server data enrichment for the changes to take effect.
Page topChanging the data update frequency
KUMA queries the LDAP server to update account data. This occurs:
- Immediately after creating a new connection.
- Immediately after changing the settings of an existing connection.
- According to a regular schedule every several hours. Every 12 hours by default.
- Whenever a user creates a task to update account data.
When querying LDAP servers, a task is created in the Task manager section of the KUMA Console.
To change the schedule of KUMA queries to LDAP servers:
- In the KUMA Console, open Settings → LDAP server → LDAP server integration by tenant.
- Select the relevant tenant.
The LDAP server integration window opens.
- In the Data refresh interval field, specify the required frequency in hours. The default value is 12.
The query schedule has been changed.
Page topChanging the data storage period
Received user account data is stored in KUMA for 90 days by default if information about these accounts is no longer received from the Active Directory server. After this period, the data is deleted.
After KUMA account data is deleted, new and existing events are no longer enriched with this information. Account information will also be unavailable in alerts. If you want to view information about accounts throughout the entire period of alert storage, you must set the account data storage period to be longer than the alert storage period.
To change the storage period for the account data:
- In the KUMA Console, open Settings → LDAP server → LDAP server integration by tenant.
- Select the relevant tenant.
The LDAP server integration window opens.
- In the Data storage time field, specify the number of days you need to store data received from the LDAP server.
The account data storage period is changed.
Page topStarting account data update tasks
After a connection to an Active Directory server is created, tasks to obtain account data are created automatically. This occurs:
- Immediately after creating a new connection.
- Immediately after changing the settings of an existing connection.
- According to a regular schedule every several hours. Every 12 hours by default. The schedule can be changed.
Account data update tasks can be created manually. You can download data for all connections or for one connection of the required tenant.
To start an account data update task for all LDAP connections of a tenant:
- In the KUMA Console, open Settings → LDAP server → LDAP server integration by tenant.
- Select the relevant tenant.
The LDAP server integration window opens.
- Click the Import accounts button.
A task to receive account data from the selected tenant is added to the Task manager section of the KUMA Console.
To start an account data update task for one LDAP connection of a tenant:
- In the KUMA Console, open Settings → LDAP server → LDAP server integration by tenant.
- Select the relevant tenant.
The LDAP server integration window opens.
- Select the relevant LDAP server connection.
The Connection parameters window opens.
- Click the Import accounts button.
A task to receive account data from the selected connection of the tenant is added to the Task manager section of the KUMA Console.
Page topDeleting an LDAP server connection
To delete LDAP connection to Active Directory:
- In the KUMA Console, open Settings → LDAP server and select the tenant that owns the relevant LDAP connection.
The LDAP server integration window opens.
- Click the LDAP connection that you want to delete and click the Delete button.
- Confirm deletion of the connection.
The LDAP connection to Active Directory will be deleted.
Page topIntegration with the Security Orchestration Automation and Response Platform (SOAR)
Security Orchestration, Automation and Response Platform (hereinafter referred to as SOAR) is a software platform used for automation of monitoring, processing, and responding to information security incidents. It aggregates cyberthreat data from various sources into a single database for further analysis and investigation to facilitate incident response capabilities.
SOAR can be integrated with KUMA. After configuring integration, you can perform the following tasks in SOAR:
- Request information about alerts from KUMA. In SOAR, incidents are created based on received data.
- Send requests to KUMA to close alerts.
Integration is implemented by using the KUMA REST API. On the Security Vision IRP side, integration is carried out by using the preconfigured Kaspersky KUMA connector. Contact your SOAR vendor to learn more about the methods and conditions for obtaining a Kaspersky KUMA connector.
Managing SOAR incidents
SOAR incidents generated from KUMA alert data can be viewed in SOAR under Incidents → Incidents (2 lines) → All incidents (2 lines). Events related to KUMA alerts are logged in each SOAR incident. Imported events can be viewed on the Response tab.
KUMA alert imported into SOAR as an incident
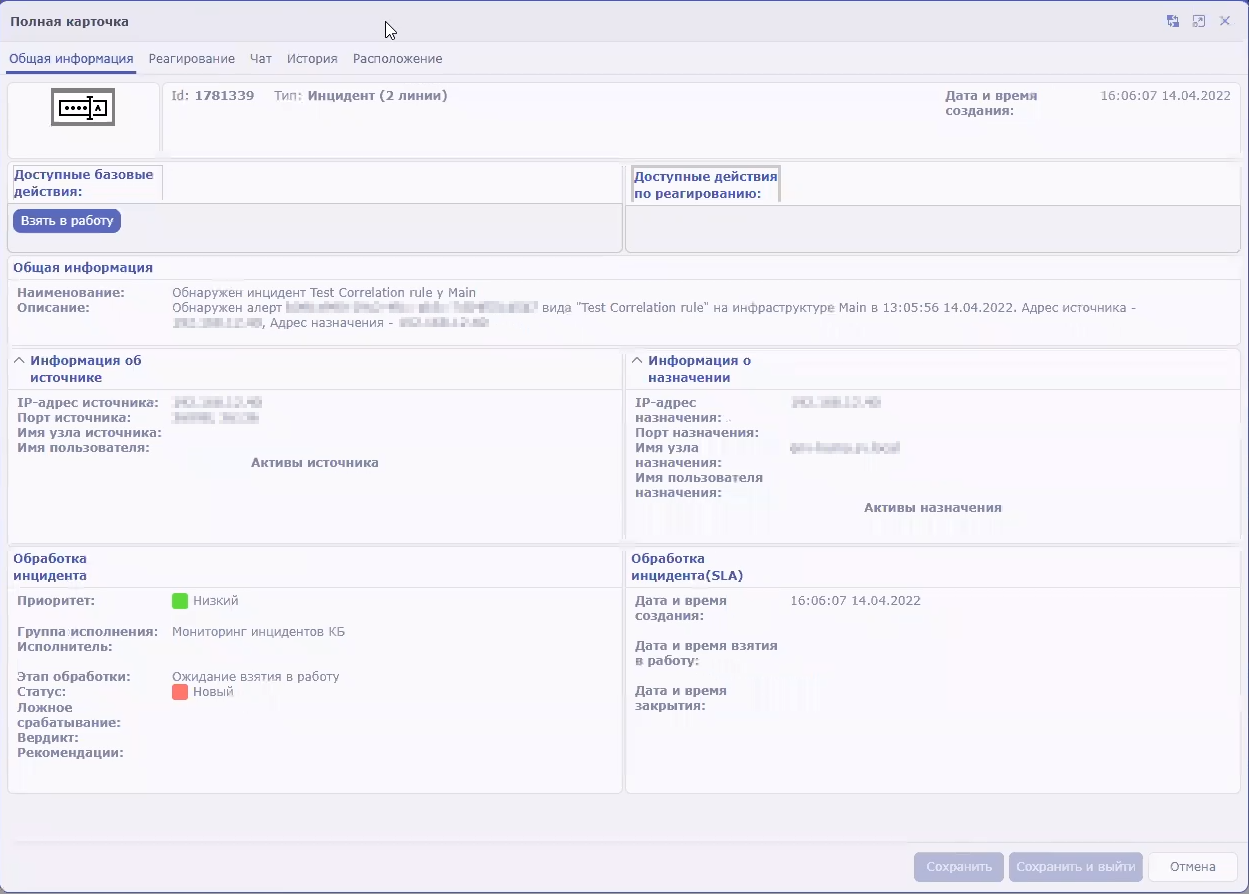
Security Vision IRP incident that was created based on KUMA alert
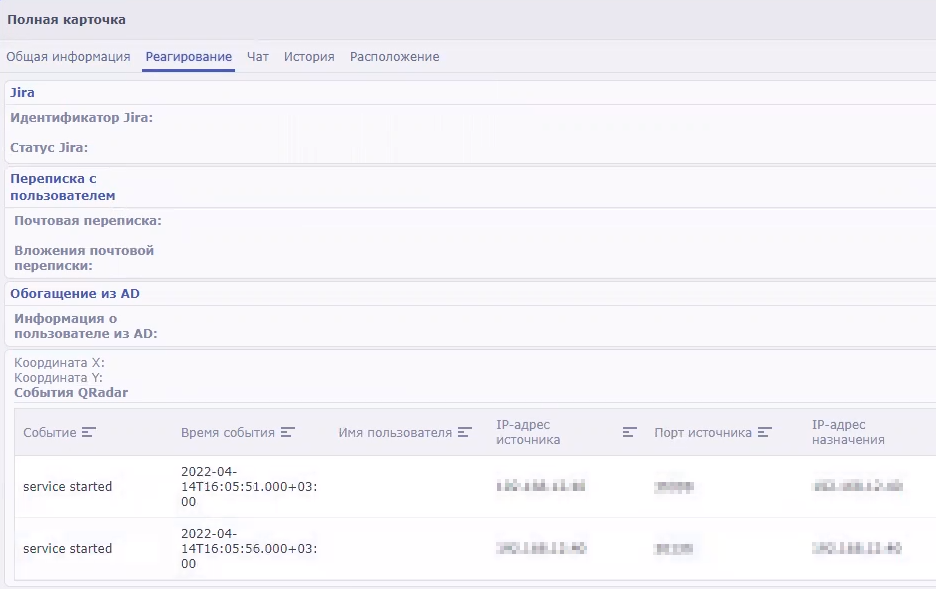
Events from KUMA alert that were imported to Security Vision IRP
Configuring integration in KUMA
To configure KUMA integration with SOAR, you must configure authorization of API requests in KUMA. To do so, you need to create a token for the KUMA user on whose behalf the API requests will be processed on KUMA side.
A token can be generated in your account profile. Users with the General Administrator role can generate tokens in the accounts of other users. You can always generate a new token.
To generate a token in your account profile:
- In the KUMA Console, click the user account name in the lower-left corner of the window and click the Profile button in the opened menu.
The User window with your user account parameters opens.
- Click the Generate token button.
- Copy the generated token displayed in the opened window. You will need it to configure SOAR.
When the window is closed, the token is no longer displayed. If you did not copy the token before closing the window, you will have to generate a new token.
The generated token must be specified in the SOAR connector settings.
Configuring integration in SOAR
Configuration of integration in SOAR consists of importing and configuring a connector. If necessary, you can also change other SOAR settings related to KUMA data processing, such as the data processing schedule and worker.
For more detailed information about configuring SOAR, please refer to the product documentation.
Importing and configuring a connector
Adding a connector to SOAR
Integration of SOAR and KUMA is performed using the Kaspersky KUMA connector. Contact your SOAR vendor to learn more about the methods and conditions for obtaining a Kaspersky KUMA connector.
To import the Kaspersky KUMA connector to SOAR:
- In SOAR, open the Settings → Connectors → Connectors section.
A list of connectors added to SOAR is displayed.
- At the top of the screen, click the import button and select the ZIP archive containing the Kaspersky KUMA connector.
The connector is imported into SOAR and is ready to be configured.
Configuring a connector for a connection to KUMA
To use a connector, you need to configure its connection to KUMA.
To configure a connection to KUMA in SOAR using the Kaspersky KUMA connector:
- In SOAR, open the Settings → Connectors → Connectors section.
A list of connectors added to your SOAR is displayed.
- Select the Kaspersky KUMA connector.
The general settings of the connector will be displayed.
- Under Connector settings, click the Edit button.
The connector configuration will be displayed.
- In the URL field, specify the address and port of KUMA. For example,
kuma.example.com:7223. - In the Token field, specify KUMA user API token.
The connection to KUMA is configured in the SOAR connector.
Security Vision IRP connector settings
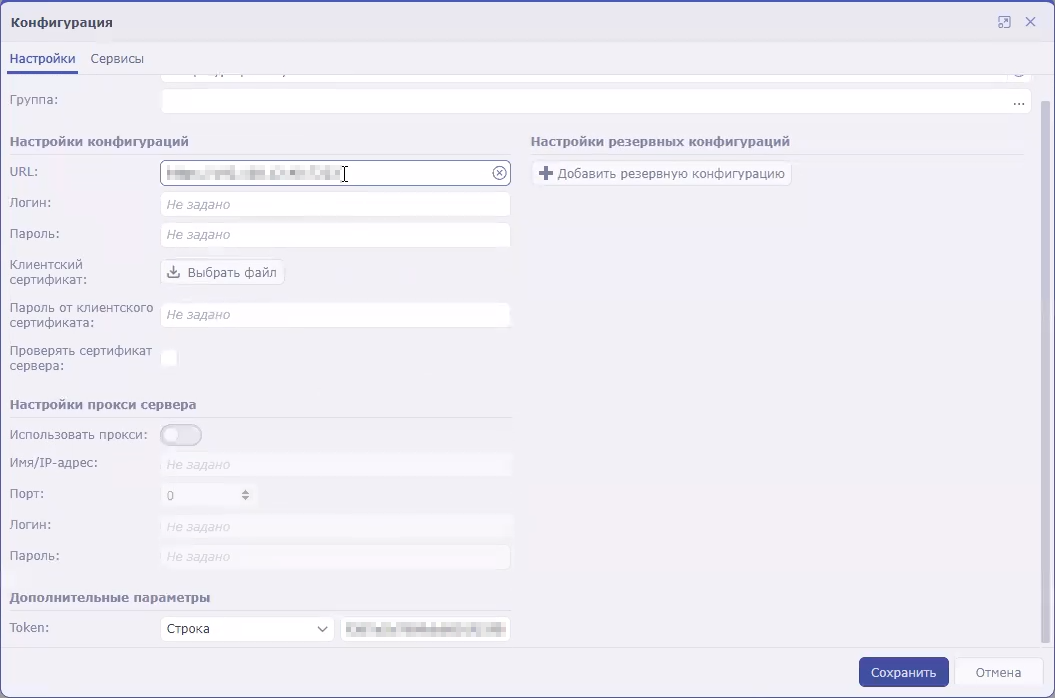
Configuring commands for interaction with KUMA in the SOAR connector
You can use SOAR to receive information about KUMA alerts (referred to as incidents in SOAR terminology) and send requests to close these alerts. To perform these actions, you need to configure the appropriate commands in the SOAR connector.
The instructions below describe how to add commands to receive and close alerts. However, if you need to implement more complex logic of interaction between SOAR and KUMA, you can similarly create your own commands containing other API requests.
To configure a command to receive alert information from KUMA:
- In SOAR, open the Settings → Connectors → Connectors section.
A list of connectors added to SOAR is displayed.
- Select the Kaspersky KUMA connector.
The general settings of the connector will be displayed.
- Click the +Command button.
The command creation window opens.
- Specify the command settings for receiving alerts:
- In the Name field, enter the command name:
Receive incidents. - In the Request type drop-down list, select GET.
- In the Called method field, enter the API request to search for alerts:
api/v1/alerts/?withEvents&status=new - Under Request headers, in the Name field, indicate
authorization. In the Value field, indicate Bearer <token>. - In the Content type drop-down list, select application/json.
- In the Name field, enter the command name:
- Save the command and close the window.
The connector command is configured. When this command is executed, the SOAR connector queries KUMA for information about all alerts with the New status and all events related to those alerts. The received data is sent to the SOAR processor, which uses it to create SOAR incidents. If new data appears in an alert that has been already imported into SOAR, incident information is updated in SOAR.
To configure a command to close KUMA alerts:
- In SOAR, open the Settings → Connectors → Connectors section.
A list of connectors added to SOAR is displayed.
- Select the Kaspersky KUMA connector.
The general settings of the connector will be displayed.
- Click the +Command button.
The command creation window will be displayed.
- Specify the command settings for receiving alerts:
- In the Name field, enter the command name:
Close incident. - In the Request type drop-down list, select POST.
- In the Called method field, enter API request to close an alert:
api/v1/alerts/close - In the Request field, enter the contents of the sent API request:
{"id":"<Alert ID>","reason":"responded"}You can create multiple commands for different reasons for closing alerts, such as responded, incorrect data, and incorrect correlation rule.
- Under Request headers, in the Name field, indicate
authorization. In the Value field, indicate Bearer <token>. - In the Content type drop-down list, select application/json.
- In the Name field, enter the command name:
- Save the command and close the window.
The connector command is configured. When this command is executed, the incident is closed in SOAR and the corresponding alert is closed in KUMA.
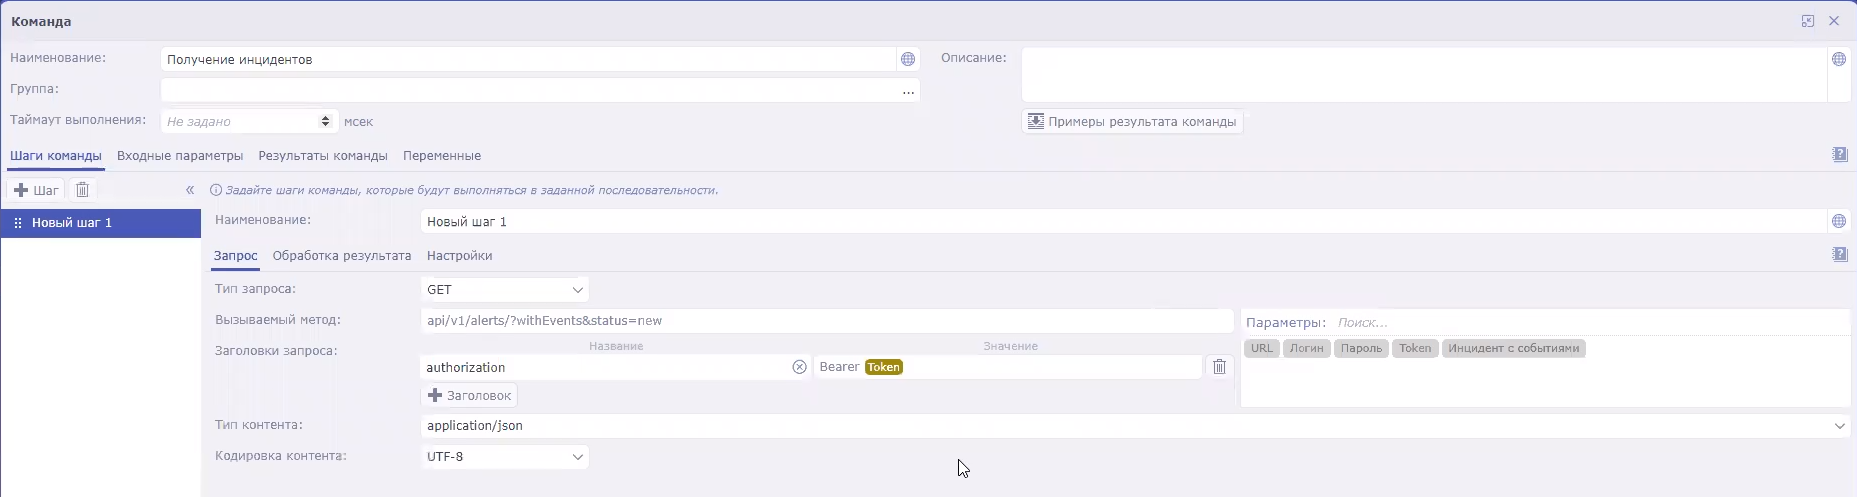
After the SOAR connector is configured, KUMA alerts are sent to the platform as SOAR incidents. Then you need to configure incident handling in SOAR based on the security policies of your organization.
Page topConfiguring the handler, schedule, and worker process
SOAR handler
The SOAR handler receives information about KUMA alerts from the SOAR connector and uses the information to create SOAR incidents. A predefined KUMA (Incidents) handler is used for processing data. The settings of the KUMA (Incidents) handler are available in SOAR under Settings → Event processing → Event handlers:
- You can view the rules for processing KUMA alerts in the handler settings on the Normalization tab.
- You can view the actions available when creating new objects in the handler settings on the Actions tab for creating objects of the Incident (2 lines) type.
Handler run schedule
The connector and handler are started according to a predefined KUMA schedule. This schedule can be configured in SOAR under Settings → Event processing → Schedule:
- In the Connector settings block, you can configure the settings for starting the connector.
- In the Handler settings block, you can configure the settings for starting the handler.
SOAR workflow
The life cycle of SOAR incidents created based on KUMA alerts follows the preconfigured Incident processing (2 lines) worker. The worker can be configured in SOAR under Settings → Workers → Worker templates: select the Incident processing (2 lines) worker and click the transaction or state that you need to change.
Page topIntegration with KICS/KATA
Kaspersky Industrial CyberSecurity for Networks (hereinafter referred to as "KICS/KATA") is an application designed to protect the industrial enterprise infrastructure from information security threats, and to ensure uninterrupted operation. The application analyzes industrial network traffic to identify deviations in the values of process parameters, detect signs of network attacks, and monitor the operation and current state of network devices.
KICS/KATA version 4.0 or later can be integrated with KUMA. After configuring integration, you can perform the following tasks in KUMA:
- Import asset information from KICS/KATA to KUMA.
- Send asset status change commands from KUMA to KICS/KATA.
Unlike KUMA, KICS/KATA refers to assets as devices.
The integration of KICS/KATA and KUMA must be configured in both applications:
- In KICS for Networks, you need to create a KUMA connector and save the communication data package of this connector.
- In KUMA, the communication data package of the connector is used to create a connection to KICS/KATA.
The integration described in this section applies to importing asset information. KICS/KATA can also be configured to send events to KUMA. To do so, you need to create a SIEM/Syslog connector in KICS/KATA and configure a collector on the KUMA side.
Configuring integration in KICS for Networks
The program supports integration with KICS for Networks version 4.0 or later.
It is recommended to configure integration of KICS for Networks and KUMA after ending Process Control rules learning mode. For more details, please refer to the documentation on KICS for Networks.
On the KICS for Networks side, integration configuration consists of creating a KUMA-type connector. In KICS for Networks, connectors are specialized application modules that enable KICS for Networks to exchange data with recipient systems, including KUMA. For more details on creating connectors, please refer to the KICS for Networks documentation.
When a connector is added to KICS for Networks, a communication data package is automatically created for this connector. This is an encrypted configuration file for connecting to KICS for Networks that is used when configuring integration on the KUMA side.
Page topConfiguring integration in KUMA
It is recommended to configure integration of KICS for Networks and KUMA after ending Process Control rules learning mode. For more details, please refer to the documentation on KICS for Networks.
To configure integration with KICS/KATA in KUMA:
- Open the KUMA Console and select Settings → Kaspersky Industrial CyberSecurity for Networks.
This opens the KICS/KATA server integration by tenant window.
- Select or create a tenant for which you want to create an integration with KICS for Networks.
This opens the KICS/KATA server integration window.
- Click the Communication data package field and select the communication data package that was created in KICS for Networks.
- In the Communication data package password field, enter the password of the communication data package.
- Select the Enable response check box if you want to change the statuses of KICS for Networks assets by using KUMA response rules.
- Click Save.
Integration with KICS/KATA is configured in KUMA, and the window displays the IP address of the node where the KICS/KATA connector will be running and its ID.
Page topEnabling and disabling integration with KICS for Networks
To enable or disable KICS for Networks integration for a tenant:
- In the KUMA Console, open the Settings → KICS/KATA section and select the tenant for which you want to enable or disable KICS for Networks integration.
This opens the KICS/KATA server integration window.
- Select or clear the Disabled check box.
- Click Save.
Changing the data update frequency
KUMA queries KICS for Networks to update its asset information. This occurs:
- Immediately after creating a new integration.
- Immediately after changing the settings of an existing integration.
- According to a regular schedule every several hours. This occurs every 3 hours by default.
- Whenever a user creates a task for updating asset data.
When querying KICS for Networks, a task is created in the Task manager section of the KUMA Console.
To edit the schedule for importing information about KICS for Networks assets:
- In the KUMA Console, open the Settings → KICS/KATA section.
- Select the relevant tenant.
This opens the KICS/KATA server integration window.
- In the Data refresh interval field, specify the required frequency in hours. The default value is 3.
The import schedule has been changed.
Special considerations when importing asset information from KICS for Networks
Importing assets
Assets are imported according to the asset import rules. Only assets with the Authorized and Unauthorized statuses are imported.
KICS for Networks assets are identified by a combination of the following parameters:
- IP address of the KICS for Networks instance with which the integration is configured.
- KICS for Networks connector ID is used to configure the integration.
- ID assigned to the asset (or "device") in the KICS for Networks instance.
Importing vulnerability information
When importing assets, KUMA also receives information about active vulnerabilities in KICS for Networks. If a vulnerability has been flagged as Remediated or Negligible in KICS for Networks, the information about this vulnerability is deleted from KUMA during the next import.
Information about asset vulnerabilities is displayed in the localization language of KICS for Networks in the Asset details window in the Vulnerabilities settings block.
In KICS for Networks, vulnerabilities are referred to as risks and are divided into several types. All types of risks are imported into KUMA.
Imported data storage period
If information about a previously imported asset is no longer received from KICS for Networks, the asset is deleted after 30 days.
Page topChanging the status of a KICS for Networks asset
After configuring integration, you can change the statuses of KICS for Networks assets from KUMA. Statuses can be changed either automatically or manually.
Asset statuses can be changed only if you enabled a response in the settings for connecting to KICS for Networks.
Manually changing the status of a KICS for Networks asset
Users with the General administrator, Tenant administrator, and Tier 2 analyst roles can manually change the statuses of assets imported from KICS for Networks in the tenants available to them.
To manually change a KICS for Networks asset status:
- In the Assets section of the KUMA Console, click the asset that you want to edit.
The Asset details area opens in the right part of the window.
- In the Status in KICS/KATA drop-down list, select the status that you want to assign to the KICS for Networks asset. The Authorized or Unauthorized statuses are available.
The asset status is changed. The new status is displayed in KICS for Networks and in KUMA.
Automatically changing the status of a KICS for Networks asset
Automatic changes to the statuses of KICS for Networks assets are implemented using response rules. The rules must be added to the correlator, which will determine the conditions for triggering these rules.
Page topIntegration with Neurodat SIEM IM
Neurodat SIEM IM is an information security monitoring system.
You can configure the export of KUMA events to Neurodat SIEM IM. Based on incoming events and correlation rules, Neurodat SIEM IM automatically generates information security incidents.
To configure integration with Neurodat SIEM IM:
- Connect to the Neurodat SIEM IM server over SSH using an account with administrative privileges.
- Create a backup copy of the /opt/apache-tomcat-<server version>/conf/neurodat/soz_settings.properties configuration file.
- In the /opt/apache-tomcat-<server version>/conf/neurodat/soz_settings.properties configuration file, edit the following settings as follows:
kuma.on=trueThis setting is an attribute of Neurodat SIEM IM interaction with KUMA.
job_kuma=com.cbi.soz.server.utils.scheduler.KumaIncidentsJobjobDelay_kuma=5000jobPeriod_kuma=60000
- Save changes of the configuration file.
- Run the following command to restart the tomcat service:
sudo systemctl restart tomcat - Obtain a token for the user in KUMA. To do so:
- Open the KUMA Console, click the name of your user account in the bottom-left corner of the window and click the Profile button in the opened menu.
The User window with your user account parameters opens.
- Click the Generate token button.
The New token window opens.
- If necessary, set the token expiration date:
- Select the No expiration date check box.
- In the Expiration date field, use the calendar to specify the date and time when the created token will expire.
- Click the Generate token button.
The Token field with an automatically generated token is displayed in the user details area. Copy it.
When the window is closed, the token is no longer displayed. If you did not copy the token before closing the window, you will have to generate a new token.
- Click Save.
- Open the KUMA Console, click the name of your user account in the bottom-left corner of the window and click the Profile button in the opened menu.
- Log in to Neurodat SIEM IM using the 'admin' account or another account that has the Administrator role for the organization you are configuring or the Administrator role for all organizations.
- In the Administration → Organization structure menu item, select or create an organization that you want to receive incidents from KUMA.
- On the organization form, do the following:
- Select the Configure integration with KUMA check box.
- In the KUMA IP address and port field, specify the KUMA API address, for example,
https://192.168.58.27:7223/api/v1/. - In the KUMA API key field, specify the user token obtained at step 6.
- Save the organization information.
Integration with KUMA is configured.
Neurodat SIEM IM tests access to KUMA and, if successful, displays a message about being ready to receive data from KUMA.
Page topKaspersky Automated Security Awareness Platform
Kaspersky Automated Security Awareness Platform (hereinafter also referred to as "ASAP") is an online learning platform that allows users to learn the rules of information security and threats related to it in their daily work, as well as to practice using real examples.
ASAP can be integrated with KUMA. After configuring integration, you can perform the following tasks in KUMA:
- Change user learning groups.
- View information about the courses taken by the users and the certificates they received.
Integration between ASAP and KUMA includes configuring API connection to ASAP. The process takes place in both solutions:
- In ASAP, create an authorization token and obtain an address for API requests.
- In KUMA, specify the address for API requests in ASAP, add an authorization token for API requests, and specify the email address of the ASAP administrator to receive notifications.
Creating a token in ASAP and getting a link for API requests
In order to be authorized, the API requests from KUMA to ASAP must be signed by a token created in ASAP. Only the company administrators can create tokens.
Creating a token
To create a token:
- Sign in to the ASAP web interface.
- In the Control panel section, click Import and synchronization, and then open the Open API tab.
- Click the New token button and select the API methods used for integration in the window that opens:
- GET /openapi/v1/groups
- POST /openapi/v1/report
- PATCH /openapi/v1/user/:userid
- Click the Generate token button.
- Copy the token and save it in any convenient way. This token is required to configure integration in KUMA.
The token is not stored in the ASAP system in the open form. After you close the Get token window, the token is unavailable for viewing. If you close the window without copying the token, you will need to click the New token button again for the system to generate a new token.
The issued token is valid for 12 months. After this period, the token is revoked. The issued token is also revoked if it is not used for 6 months.
Getting a link for API requests
To get the link used in ASAP for API requests:
- Sign in to the ASAP web interface.
- In the Control panel section, click Import and synchronization, and then open the Open API tab.
- A link for accessing ASAP using the Open API is located at the bottom part of the window. Copy the link and save it in any convenient way. This link is required to configure integration in KUMA.
Configuring integration in KUMA
To configure KUMA integration with ASAP:
- Open the KUMA Console and select Settings → Kaspersky Automated Security Awareness Platform.
The Kaspersky Automated Security Awareness Platform window opens.
- In the Secret field click the button to create a secret of the token by entering the token received from ASAP:
- In the Name field, enter the name of the secret. Must contain 1 to 128 Unicode characters.
- In the Token field, enter the authorization token for API requests to ASAP.
- If necessary, add the secret description in the Description field.
- Click Save.
- In the ASAP Open API URL field, specify the address used by ASAP for API requests.
- In the ASAP administrator email field, specify the email address of the ASAP administrator who receives notifications when users are added to the learning groups using KUMA.
- If necessary, in the Proxy drop-down list select the proxy server resource to be used to connect to ASAP.
- To disable or enable integration with ASAP, select or clear the Disabled check box.
- Click Save.
Integration with ASAP is configured in KUMA. When viewing information about alerts and incidents, you can select associated users to view which learning courses they have taken and to change their learning group.
Page topViewing information about the users from ASAP and changing learning groups
After configuring the integration between ASAP and KUMA, the following information from ASAP becomes available in alerts and incidents when you view data about associated users:
- The learning group to which the user belongs.
- The trainings passed by the user.
- The planned trainings and the current progress.
- The received certificates.
To view data about the user from ASAP:
- In the KUMA Console, in the Alerts or Incidents section, select the required alert or incident.
- In the Related users section, click the desired account.
The Account details window opens on the right side of the screen.
- Select the ASAP courses details tab.
The window displays information about the user from ASAP.
You can change the learning group of a user in ASAP.
To change a user learning group in ASAP:
- In the KUMA Console, in the Alerts or Incidents section, select the required alert or incident.
- In the Related users section, click the desired account.
The Account details window opens on the right side of the screen.
- In the Assign ASAP group drop-down list, select the ASAP learning group you want to assign the user to.
- Click Apply.
The user is moved to the selected ASAP group, the ASAP company administrator is notified of the change in the learning group, and the study plan is recalculated for the selected learning group.
For details on learning groups and how to get started, refer to the ASAP documentation.
Page topSending notifications to Telegram
This integration is an example and may require additional configuration depending on the versions used and the specifics of the infrastructure.
Compatibility is confirmed only for KUMA 2.0 and later.
The terms and conditions of premium technical support do not apply to this integration; support requests are processed without a guaranteed response time.
You can configure sending notifications to Telegram when KUMA correlation rules are triggered. This can reduce the response time to threats and, if necessary, make more persons informed.
Configure Telegram notifications proceeds in stages:
- Creating and configuring a Telegram bot
A special bot sends notifications about triggered correlation rules. It can send notifications to a private or group Telegram chat.
- Creating a script for sending notifications
You must create a script and save it on the server where the correlator is installed.
- Configuring notifications in KUMA
Configure a KUMA response rule that starts a script to send notifications and add this rule to the correlator.
Creating and configuring a Telegram bot
To create and configure a Telegram bot:
- In the Telegram application, find the BotFather bot and open a chat with it.
- In the chat, click Start.
- Create a new bot using the following command:
/newbot - Enter the name of the bot.
- Enter the login name of the bot.
The bot is created. You receive a link to the chat that looks like t.me/<bot login> and a token for contacting the bot.
- If you want to use the bot in a group chat, and not in private messages, edit privacy settings:
- In the BotFather chat, enter the command:
/mybots - Select the relevant bot from the list.
- Click Bot Settings → Group Privacy and select Turn off.
The bot can now send messages to group chats.
- In the BotFather chat, enter the command:
- To open a chat with the bot you created, use the t.me/<botlogin> link that you obtained at step 5, and click Start.
- If you want the bot to send private messages to the user:
- In the chat with the bot, send any message.
- Follow the https://t.me/getmyid_bot link and click Start.
- The response contains the
Current chat ID. You need this value to configure the sending of messages.
- If you want the bot to send messages to the group chat:
- Add https://t.me/getmyid_bot to the group chat for receiving notifications from KUMA.
The bot sends a message to the group chat, the message contains the
Current chat IDvalue. You need this value to configure the sending of messages. - Remove the bot from the group.
- Add https://t.me/getmyid_bot to the group chat for receiving notifications from KUMA.
- Send a test message through the bot. To do so, paste the following link into the address bar of your browser:
https://api.telegram.org/bot<token>/sendMessage?chat_id=<chat_id>&text=testwhere
<token>is the value obtained at step 5, and<chat_id>is the value obtained at step 8 or 9.
As a result, a test message should appear in the personal or group chat, and the JSON in the browser response should be free of errors.
Page topCreating a script for sending notifications
To create a script:
- In the console of the server on which the correlator is installed, create a script file and add the following lines to it:
#!/bin/bash
set -eu
CHAT_ID=
<Current chat ID value obtained at step 8 or 9 of the Telegram bot setup instructions>TG_TOKEN=
<token value obtained at step 5 of the Telegram bot setup instructions>RULE=$1
TEXT="<b>$RULE</b> rule triggered"
curl --data-urlencode "chat_id=$CHAT_ID" --data-urlencode "text=$TEXT" --data-urlencode "parse_mode=HTML" https://api.telegram.org/bot$TG_TOKEN/sendMessage
If the correlator server does not have Internet access, you can use a proxy server:
#!/bin/bash
set -eu
CHAT_ID=
<Current chat ID value obtained at step 8 or 9 of the Telegram bot setup instructions>TG_TOKEN=
<token value obtained at step 5 of the Telegram bot setup instructions>RULE=$1
TEXT="<b>$RULE</b> rule triggered"
PROXY=<
address and port of the proxy server>curl --proxy $PROXY --data-urlencode "chat_id=$CHAT_ID" --data-urlencode "text=$TEXT" --data-urlencode "parse_mode=HTML" https://api.telegram.org/bot$TG_TOKEN/sendMessage
- Save the script to the correlator directory at /opt/kaspersky/kuma/correlator/<
ID of the correlator that must respond to events>/scripts/.For information about obtaining the correlator ID, see the Getting service identifier section.
- Make the 'kuma' user the owner of the file and grant execution rights:
chown kuma:kuma /opt/kaspersky/kuma/correlator/<ID of the correlator that must respond>/scripts/<script name>.shchmod +x /opt/kaspersky/kuma/correlator/<ID of the correlator that must respond>/scripts/<script name>.sh
Configuring notifications in KUMA
To configure the sending of KUMA notifications to Telegram:
- Create a response rule:
- In the KUMA Console, select the Resources → Response rules section and click Add response rule.
- This opens the Create response rule window; in that window, in the Name field, enter the name of the rule.
- In the Tenant drop-down list, select the tenant that owns the resource.
- In the Type drop-down list, select Run script.
- In the Script name field, enter the name of the script.
- In the Script arguments field, enter
{{.Name}}.This passes the name of the correlation event as the argument of the script.
- Click Save.
- Add the response rule to the correlator:
- In the Resources → Correlators section, select the correlator in whose folder you placed the created script for sending notifications.
- In the steps tree, select Response rules.
- Click Add.
- In the Response rule drop-down list, select the rule added at step 1 of these instructions.
- In the steps tree, select Setup validation.
- Click the Save and restart services button.
- Click the Save button.
Sending notifications about triggered KUMA rules to Telegram is configured.
UserGate integration
This integration is an example and may require additional configuration depending on the versions used and the specifics of the infrastructure.
Compatibility is confirmed only for KUMA 2.0 or later and UserGate 6.0 or later.
The terms and conditions of premium technical support do not apply to this integration; support requests are processed without a guaranteed response time.
UserGate is a network infrastructure security solution that protects personal information from the risks of external intrusions, unauthorized access, viruses, and malware.
Integration with UserGate allows automatically blocking threats by IP address, URL, or domain name whenever KUMA response rules are triggered.
Configuring the integration proceeds in stages:
- Configuring integration in UserGate
- Preparing a script for the response rule
- Configuring the KUMA response rule
Configuring integration in UserGate
To configure integration in UserGate:
- Connect to the UserGate web interface under an administrator account.
- Go to UserGate → Administrators → Administrator profiles, and click Add.
- In the Profile settings window, specify the profile name, for example,
API. - On the API Permissions tab, add read and write permissions for the following objects:
- content
- core
- firewall
- nlists
- Click Save.
- In the UserGate → Administrators section, click Add → Add local administrator.
- In the Administrator properties window, specify the login and password of the administrator.
In the Administrator profile field, select the profile created at step 3.
- Click Save.
- In the address bar of your browser, after the address and port of UserGate, add
?features=zone-xml-rpcand press ENTER. - Go to the Network → Zones section and for the zone of the interface that you want to use for API interaction, go to the Access Control tab and select the check box next to the XML-RPC for management service.
If necessary, you can add the IP address of the KUMA correlator whose correlation rules must trigger blocking in UserGate, to the list of allowed addresses.
- Click Save.
Preparing a script for integration with UserGate
To prepare a script for use:
- Copy the ID of the correlator whose correlation rules you want to trigger blocking of URL, IP address, or domain name in UserGate:
- In the KUMA Console, go to the Resources → Active services.
- Select the check box next to the correlator whose ID you want to obtain, and click Copy ID.
The correlator ID is copied to the clipboard.
- Download the script:
- Open the script file and in the Enter UserGate Parameters section, in the login and password parameters, specify the credentials of the UserGate administrator account that was created at step 7 of configuring the integration in UserGate.
- Place the downloaded script on the KUMA correlator server at the following path: /opt/kaspersky/kuma/correlator/<
correlator ID from step 1>/scripts/. - Connect to the correlator server via SSH and go to the path from step 4:
cd /opt/kaspersky/kuma/correlator/<correlator ID from step 1>/scripts/ - Run the following command:
chmod +x ug.py && chown kuma:kuma ug.py
The script is ready to use.
Page topConfiguring a response rule for integration with UserGate
To configure a response rule:
- Create a response rule:
- In the KUMA Console, select the Resources → Response rules section and click Add response rule.
- This opens the Create response rule window; in that window, in the Name field, enter the name of the rule.
- In the Tenant drop-down list, select the tenant that owns the resource.
- In the Type drop-down list, select Run script.
- In the Script name field, enter the name of the script.
ug.py. - In the Script arguments field, specify:
- one of the operations depending on the type of the object being blocked:
blockurlto block access by URLblockipto block access by IP addressblockdomainto block access by domain name
-i {{<KUMA field from which the value of the blocked object must be taken, depending on the operation>}}Example:
blockurl -i {{.RequetstUrl}}
- one of the operations depending on the type of the object being blocked:
- In the Conditions section, add conditions corresponding to correlation rules that require blocking in UserGate when triggered.
- Click Save.
- Add the response rule to the correlator:
- In the Resources → Correlators section, select the correlator that must respond and in whose directory you placed the script.
- In the steps tree, select Response rules.
- Click Add.
- In the Response rule drop-down list, select the rule added at step 1 of these instructions.
- In the steps tree, select Setup validation.
- Click Save and reload services.
- Click the Save button.
The response rule is linked to the correlator and ready to use.
Page topIntegration with Kaspersky Web Traffic Security
This integration is an example and may require additional configuration depending on the versions used and the specifics of the infrastructure.
Compatibility is confirmed only for KUMA 2.0 or later and Kaspersky Web Traffic Security 6.0 or later.
The terms and conditions of premium technical support do not apply to this integration; support requests are processed without a guaranteed response time.
You can configure integration with the Kaspersky Web Traffic Security web traffic analysis and filtering system (hereinafter also referred to as "KWTS").
Configuring the integration involves creating KUMA response rules that allow running KWTS tasks. Tasks must be created in advance in the KWTS web interface.
Configuring the integration proceeds in stages:
- Configuring integration in KWTS
- Preparing a script for the response rule
- Configuring the KUMA response rule
Configuring integration in KWTS
To prepare the integration in KWTS:
- Connect to the KWTS web interface under an administrator account and create a role with permissions to view and create/edit a rule.
For more details on creating a role, see the Kaspersky Web Traffic Security Help.
- Assign the created role to a user with NTML authentication.
You can use a local administrator account instead.
- In the Rules section, go to the Access tab and click Add rule.
- In the Action drop-down list, select Block.
- In the Traffic filtering drop-down list, select the URL value, and in the field on the right, enter a nonexistent or known malicious address.
- In the Name field, enter the name of the rule.
- Enable the rule using the Status toggle switch.
- Click Add.
- In the KWTS web interface, open the rule you just created.
- Make a note of the ID value that is displayed at the end of the page address in the browser address bar.
You must use this value when configuring the response rule in KUMA.
The integration is prepared on the KWTS side.
Page topPreparing a script for integration with KWTS
To prepare a script for use:
- Copy the ID of the correlator whose correlation rules you want to trigger blocking of URL, IP address, or domain name in KWTS:
- In the KUMA Console, go to the Resources → Active services.
- Select the check box next to the correlator whose ID you want to obtain, and click Copy ID.
The correlator ID is copied to the clipboard.
- To get the script and the library, please contact Technical Support.
- Place the script provided by Technical Support on the KUMA correlator server at the following path: /opt/kaspersky/kuma/correlator/<
correlator ID from step 1>/scripts/. - Connect to the correlator server via SSH and go to the path from step 3:
cd /opt/kaspersky/kuma/correlator/<correlator ID from step 1>/scripts/ - Run the following command:
chmod +x kwts.py kwtsWebApiV6.py && chown kuma:kuma kwts.py kwtsWebApiV6.py
The script is ready to use.
Page topConfiguring a response rule for integration with KWTS
To configure a response rule:
- Create a response rule:
- In the KUMA Console, select the Resources → Response rules section and click Add response rule.
- This opens the Create response rule window; in that window, in the Name field, enter the name of the rule.
- In the Tenant drop-down list, select the tenant that owns the resource.
- In the Type drop-down list, select Run script.
- In the Script name field, enter the name of the script. kwts.py.
- In the Script arguments field, specify:
--host— address of the KWTS server.--username— name of the user account created in KWTS or local administrator.--password— KWTS user account password.--rule_id— ID of the rule created in KWTS.- Specify one of the options depending on the type of the object being blocked:
--url— specify the field of the KUMA event from which you want to obtain the URL, for example,{{.RequestUrl}}.--ip— specify the field of the KUMA event from which you want to obtain the IP address, for example,{{.DestinationAddress}}.--domain— specify the field of the KUMA event from which you want to obtain the domain name, for example,{{.DestinationHostName}}.
--ntlm— specify this option if the KWTS user was created with NTLM authentication.Example:
--host <address> --username <user> --password <pass> --rule_id <id> --url {{.RequestUrl}}
- In the Conditions section, add conditions corresponding to correlation rules that require blocking in KWTS when triggered.
- Click Save.
- Add the response rule to the correlator:
- In the Resources → Correlators section, select the correlator that must respond and in whose directory you placed the script.
- In the steps tree, select Response rules.
- Click Add.
- In the Response rule drop-down list, select the rule added at step 1 of these instructions.
- In the steps tree, select Setup validation.
- Click Save and reload services.
- Click the Save button.
The response rule is linked to the correlator and ready to use.
Page topIntegration with Kaspersky Secure Mail Gateway
This integration is an example and may require additional configuration depending on the versions used and the specifics of the infrastructure.
Compatibility is confirmed only for KUMA 2.0 or later and Kaspersky Secure Mail Gateway 2.0 or later.
The terms and conditions of premium technical support do not apply to this integration; support requests are processed without a guaranteed response time.
You can configure integration with the Kaspersky Secure Mail Gateway mail traffic analysis and filtering system (hereinafter also referred to as "KSMG").
Configuring the integration involves creating KUMA response rules that allow running KSMG tasks. Tasks must be created in advance in the KSMG web interface.
Configuring the integration proceeds in stages:
- Configuring integration in KSMG
- Preparing a script for the response rule
- Configuring the KUMA response rule
Configuring integration in KSMG
To prepare the integration in KSMG:
- Connect to the KSMG web interface under an administrator account and create a role with permissions to view and create/edit a rule.
For more details on creating a role, see the Kaspersky Secure Mail Gateway Help.
- Assign the created role to a user with NTML authentication.
You can use the 'Administrator' local administrator account.
- In the Rules section, click Create.
- In the left pane, select the General section.
- Enable the rule using the Status toggle switch.
- In the Rule name field, enter the name of the new rule.
- Under Mode, select one of the message processing options that meets the criteria of this rule.
- Under Sender on the Email addresses tab, enter a nonexistent or known malicious sender address.
- Under Recipient on the Email addresses tab, specify the relevant recipients or the "*" character to select all recipients.
- Click the Save button.
- In the KSMG web interface, open the rule you just created.
- Make a note of the ID value that is displayed at the end of the page address in the browser address bar.
You must use this value when configuring the response rule in KUMA.
The integration is prepared on the KSMG side.
Page topPreparing a script for integration with KSMG
To prepare a script for use:
- Copy the ID of the correlator whose correlation rules must trigger the blocking of the IP address or email address of the message sender in KSMG:
- In the KUMA Console, go to the Resources → Active services.
- Select the check box next to the correlator whose ID you want to obtain, and click Copy ID.
The correlator ID is copied to the clipboard.
- To get the script and the library, please contact Technical Support.
- Place the script provided by Technical Support on the KUMA correlator server at the following path: /opt/kaspersky/kuma/correlator/<
correlator ID from step 1>/scripts/. - Connect to the correlator server via SSH and go to the path from step 3:
cd /opt/kaspersky/kuma/correlator/<correlator ID from step 1>/scripts/ - Run the following command:
chmod +x ksmg.py ksmgWebApiV2.py && chown kuma:kuma ksmg.py ksmgWebApiV2.py
The script is ready to use.
Page topConfiguring a response rule for integration with KSMG
To configure a response rule:
- Create a response rule:
- In the KUMA Console, select the Resources → Response rules section and click Add response rule.
- This opens the Create response rule window; in that window, in the Name field, enter the name of the rule.
- In the Tenant drop-down list, select the tenant that owns the resource.
- In the Type drop-down list, select Run script.
- In the Script name field, enter the name of the script. ksmg.py.
- In the Script arguments field, specify:
--host— address of the KSMG server.--username— name of the user account created in KSMG.You can specify the Administrator account.
--password— KSMG user account password.--rule_id— ID of the rule created in KSMG.- Specify one of the options depending on the type of the object being blocked:
--email— specify the field of the KUMA event from which you want to obtain the URL, for example,{{.SourceUserName}}.--ip— specify the field of the KUMA event from which you want to obtain the IP address, for example,{{.SourceAddress}}.
--ntlm— specify this option if the KSMG user was created with NTLM authentication.Example:
--host <address> --username <user> --password <pass> --ntlm --rule_id <id> --email {{.SourceUserName}}
- In the Conditions section, add conditions corresponding to the correlation rules that when triggered require blocking the IP address or email address of the message sender in KSMG.
- Click Save.
- Add the response rule to the correlator:
- In the Resources → Correlators section, select the correlator that must respond and in whose directory you placed the script.
- In the steps tree, select Response rules.
- Click Add.
- In the Response rule drop-down list, select the rule added at step 1 of these instructions.
- In the steps tree, select Setup validation.
- Click Save and reload services.
- Click the Save button.
The response rule is linked to the correlator and ready to use.
Page topImporting asset information from RedCheck
This integration is an example and may require additional configuration depending on the versions used and the specifics of the infrastructure.
Compatibility is confirmed only for KUMA 2.0 or later and RedCheck 2.6.8 or later.
The terms and conditions of premium technical support do not apply to this integration; support requests are processed without a guaranteed response time.
RedCheck is a system for monitoring and managing the information security of an organization.
You can import asset information from RedCheck network device scan reports into KUMA.
Import is available from simple "Vulnerabilities" and "Inventory" reports in CSV format, grouped by hosts.
Imported assets are displayed in the KUMA Console in the Assets section. If necessary, you can edit the settings of assets.
Data is imported through the API using the redcheck-tool.py utility. The utility requires Python 3.6 or later and the following libraries:
- csv
- re
- json
- requests
- argparse
- sys
To import asset information from a RedCheck report:
- Generate a network asset scan report in RedCheck in CSV format and copy the report file to the server where the script is located.
For more details about scan tasks and output file formats, refer to the RedCheck documentation.
- Create a file with the token for accessing the KUMA REST API.
The account for which the token is created must satisfy the following requirements:
- Tenant administrator or Tier 2 analyst role.
- Access to the tenant into which the assets will be imported.
- Rights to use API requests: GET /assets, GET /tenants, POST/assets/import.
- Download the script:
- Copy the redcheck-tool.py tool to the server hosting the KUMA Core and make the tool's file executable:
chmod +x <path to the redcheck-tool.py file> - Run the redcheck-tool.py utility:
python3 redcheck-tool.py --kuma-rest <address and port of the KUMA REST API server> --token <API token> --tenant <name of the tenant in which the assets must be placed> --vuln-report <full path to the "Vulnerabilities" report file> --inventory-report <full path to the "Inventory" report file>Example:
python3 --kuma-rest example.kuma.com:7223 --token 949fc03d97bad5d04b6e231c68be54fb --tenant Main --vuln-report /home/user/vuln.csv --inventory-report /home/user/inventory.csvYou can use additional flags and commands for import operations. For example, the
-vcommand displays an extended report on the received assets. A detailed description of the available flags and commands is provided in the "Flags and commands of redcheck-tool.py" table. You can also use the--helpcommand to view information on the available flags and commands.
The asset information is imported from the RedCheck report to KUMA. The console displays information on the number of new and updated assets.
Example:
|
Example of extended import information:
|
The tool works as follows when importing assets:
- KUMA overwrites the data of assets imported through the API, and deletes information about their resolved vulnerabilities.
- KUMA skips assets with invalid data.
Flags and commands of redcheck-tool.py
Flags and commands
Mandatory
Description
--kuma-rest <address and port of the KUMA server>Yes
Port 7223 is used for API requests by default. You can change the port if necessary.
--token <token>Yes
The value of the option must contain only the token.
The Tenant administrator or Tier 2 analyst role must be assigned to the user account for which the API token is being generated.
--tenant <tenant name>Yes
Name of the KUMA tenant in which the assets from the RedCheck report will be imported.
--vuln-report <full path to the "Vulnerabilities" report>Yes
"Vulnerabilities" report file in CSV format.
--inventory-report <full path to the "Inventory" report file>No
"Inventory" report file in CSV format.
-vNo
Display extended information about the import of assets.
Possible errors
Error message
Description
Tenant %w not found
The tenant name was not found.
Tenant search error: Unexpected status Code: %d
An unexpected HTTP response code was received while searching for the tenant.
Asset search error: Unexpected status Code: %d
An unexpected HTTP response code was received while searching for an asset.
[%w import][error] Host: %w Skipped asset with FQDNlocalhost or IP 127.0.0.1
When importing inventory/vulnerabilities information, host cfqdn=localhost or ip=127.0.0.1 was skipped.
Configuring receipt of Sendmail events
You can configure the receipt of Sendmail mail agent events in the KUMA
.
Configuring event receiving consists of the following steps:
- Configuring Sendmail logging.
- Configuring the event source server.
- Creating a KUMA collector.
To receive Sendmail events, use the following values in the Collector Installation Wizard:
- At the Event parsing step, select the [OOTB] Sendmail syslog normalizer.
- At the Transport step, select the tcp or udp connector type.
- Installing the KUMA collector.
- Verifying receipt of Sendmail events in the KUMA collector
You can verify that the Sendmail event source server is correctly configured in the Searching for related events section of the KUMA Console.
Configuring Sendmail logging
By default, events of the Sendmail system are logged to syslog.
To make sure that logging is configured correctly:
- Connect via SSH to the server on which the Sendmail system is installed.
- Run the following command:
cat /etc/rsyslog.d/50-default.confThe command should return the following string:
mail.* -/var/log/mail.log
If logging is configured correctly, you can proceed to configuring the export of Sendmail events.
Page topConfiguring export of Sendmail events
Events are sent from the Sendmail mail agent server to the KUMA collector using the rsyslog service.
To configure transmission of Sendmail events to the collector:
- Connect to the server where Sendmail is installed using an account with administrative privileges.
- In the /etc/rsyslog.d/ directory, create the Sendmail-to-siem.conf file and add the following line to it:
If $programname contains 'sendmail' then @<<IP address of the collector>:<port of the collector>>Example:
If $programname contains 'sendmail' then @192.168.1.5:1514If you want to send events via TCP, the contents of the file must be as follows:
If $programname contains 'sendmail' then @@<<IP address of the collector>:<port of the collector>> - Create a backup copy of the /etc/rsyslog.conf file.
- Add the following lines to the /etc/rsyslog.conf configuration file:
$IncludeConfig /etc/Sendmail-to-siem.conf$RepeatedMsgReduction off - Save your changes.
- Restart the rsyslog service by executing the following command:
sudo systemctl restart rsyslog.service