Contents
- Configuring event sources
- Configuring receipt of Auditd events
- Configuring receipt of KATA/EDR events
- Configuring Open Single Management Platform for export of events to the KUMA SIEM-system
- Configuring receiving Open Single Management Platform event from MS SQL
- Creating an account in the MS SQL database
- Configuring the SQL Server Browser service
- Creating a secret in KUMA
- Configuring a connector
- Configuring the KUMA Collector for receiving Open Single Management Platform events from an MS SQL database
- Installing the KUMA Collector for receiving Open Single Management Platform events from the MS SQL database
- Configuring receipt of events from Windows devices using KUMA Agent (WEC)
- Configuring audit of events from Windows devices
- Configuring centralized receipt of events from Windows devices using the Windows Event Collector service
- Granting permissions to view Windows events
- Granting permissions to log on as a service
- Configuring the KUMA Collector for receiving events from Windows devices
- Installing the KUMA Collector for receiving events from Windows devices
- Configuring forwarding of events from Windows devices to KUMA using KUMA Agent (WEC)
- Configuring receipt of events from Windows devices using KUMA Agent (WMI)
- Configuring receipt of DNS server events using the ETW agent
- Configuring receipt of PostgreSQL events
- Configuring receipt of IVK Kolchuga-K events
- Configuring receipt of CryptoPro NGate events
- Configuring receipt of Ideco UTM events
- Configuring receipt of KWTS events
- Configuring receipt of KLMS events
- Configuring receipt of KSMG events
- Configuring the receipt of KICS for Networks events
- Configuring receipt of PT NAD events
- Configuring receipt of events using the MariaDB Audit Plugin
- Configuring receipt of Apache Cassandra events
- Configuring receipt of FreeIPA events
- Configuring receipt of VipNet TIAS events
- Configuring receipt of Nextcloud events
- Configuring receipt of Snort events
- Configuring receipt of Suricata events
- Configuring receipt of FreeRADIUS events
- Configuring receipt of VMware vCenter events
- Configuring receipt of zVirt events
- Configuring receipt of Zeek IDS events
- Configuring Windows event reception using Kaspersky Endpoint Security for Windows
- Configuring receipt of Codemaster Mirada events
- Configuring receipt of Postfix events
- Configuring receipt of CommuniGate Pro events
- Configuring receipt of Yandex Cloud events
- Configuring receipt of Microsoft 365 events
Configuring event sources
This section provides information on configuring the receipt of events from various sources.
Configuring receipt of Auditd events
KUMA lets you monitor and audit the Auditd events on Linux devices.
Before configuring event receiving, make sure to create a new KUMA collector for the Auditd events.
Configuring the receipt of Auditd events proceeds in stages:
- Configuring the KUMA collector for receiving Auditd events.
- Configuring the event source server.
- Verifying receipt of Auditd events by the KUMA collector.
You can verify that the Auditd event source server is configured correctly by searching for related events in the KUMA Console.
Configuring the KUMA collector for receiving Auditd events
At the Transport step, make the Auditd option active.
After creating a collector, in order to configure event receiving using rsyslog, you must install a collector on the network infrastructure server intended for receiving events.
For details on installing the KUMA collector, refer to the Installing collector in the network infrastructure section.
Page topConfiguring the event source server
The rsyslog service is used to transmit events from the server to the KUMA collector.
To configure transmission of events from the server to the collector:
- Make sure that the rsyslog service is installed on the event source server. For this purpose, execute the following command:
systemctl status rsyslog.serviceIf the rsyslog service is not installed on the server, install it by executing the following command:
yum install rsyslogsystemctl enable rsyslog.servicesystemctl start rsyslog.service - Edit the audit.service configuration file /etc/audit/auditd.conf and change the value of the
name_formatparameter toNONE:name_format=NONEAfter editing the settings, restart the auditd service:
sudo systemctl restart auditd.service - In the /etc/rsyslog.d directory, create the audit.conf file with the following content, depending on your protocol:
- To send events over TCP:
$ModLoad imfile$InputFileName /var/log/audit/audit.log$InputFileTag tag_audit_log:$InputFileStateFile audit_log$InputFileSeverity info$InputFileFacility local6$InputRunFileMonitor*.* @@<KUMA collector IP address>:<KUMA collector port>For example:*.* @@192.1.3.4:5858 To send events over UDP:$ModLoad imfile$InputFileName /var/log/audit/audit.log$InputFileTag tag_audit_log:$InputFileStateFile audit_log$InputFileSeverity info$InputFileFacility local6$InputRunFileMonitortemplate(name="AuditFormat" type="string" string="<%PRI%>%TIMESTAMP:::date-rfc3339% %HOSTNAME% %syslogtag% %msg%\n")*.* @<KUMA collector IP address>:<KUMA collector port>For example:*.* @192.1.3.4:5858;AuditFormat
- To send events over TCP:
- Save the changes to the audit.conf file.
- Restart the rsyslog service by executing the following command:
systemctl restart rsyslog.service
The event source server is configured. Data about events is transmitted from the server to the KUMA collector.
Page topConfiguring receipt of KATA/EDR events
You can configure the receipt of Kaspersky Anti Targeted Attack Platform events in the KUMA
.
Before configuring event receipt, make sure to create a KUMA collector for the KATA/EDR events.
When creating a collector in the KUMA Console, make sure that the port number matches the port specified in step 4c of Configuring export of Kaspersky Anti Targeted Attack Platform events to KUMA, and that the connector type corresponds to the type specified in step 4d.
To receive Kaspersky Anti Targeted Attack Platform events using Syslog, in the collector Installation wizard, at the Event parsing step, select the [OOTB] KATA normalizer.
Configuring the receipt of KATA/EDR events proceeds in stages:
- Configuring the forwarding of KATA/EDR events
- Installing the KUMA collector in the network infrastructure
- Verifying receipt of KATA/EDR events in the KUMA collector
You can verify that the KATA/EDR event source server is configured correctly by searching for related events in the KUMA Console. Kaspersky Anti Targeted Attack Platform events are displayed as KATA in the table with search results.
Configuring export of KATA/EDR events to KUMA
To configure export of events from Kaspersky Anti Targeted Attack Platform to KUMA:
- In a browser on any computer with access to the Central Node server, enter the IP address of the server hosting the Central Node component.
A window for entering Kaspersky Anti Targeted Attack Platform user credentials opens.
- In the user credentials entry window, select the Local administrator check box and enter the Administrator credentials.
- Go to the Settings → SIEM system section.
- Specify the following settings:
- Select the Activity log and Detections check boxes.
- In the Host/IP field, enter the IP address or host name of the KUMA collector.
- In the Port field, specify the port number to connect to the KUMA collector.
- In the Protocol field, select TCP or UDP from the list.
- In the Host ID field, specify the server host ID to be indicated in the SIEM systems log as a detection source.
- In the Alert frequency field, enter the interval for sending messages: from 1 to 59 minutes.
- Enable TLS encryption, if necessary.
- Click Apply.
Export of Kaspersky Anti Targeted Attack Platform events to KUMA is configured.
Page topCreating KUMA collector for receiving KATA/EDR events
After configuring the event export settings, you must create a collector for Kaspersky Anti Targeted Attack Platform events in the KUMA Console.
For details on creating a KUMA collector, refer to Creating a collector.
When creating a collector in the KUMA Console, make sure that the port number matches the port specified in step 4c of Configuring export of Kaspersky Anti Targeted Attack Platform events to KUMA, and that the connector type corresponds to the type specified in step 4d.
To receive Kaspersky Anti Targeted Attack Platform events using Syslog, in the collector Installation wizard, at the Event parsing step, select the [OOTB] KATA normalizer.
Page topInstalling KUMA collector for receiving KATA/EDR events
After creating a collector, to configure receiving Kaspersky Anti Targeted Attack Platform events, install a new collector on the network infrastructure server intended for receiving events.
For details on installing the KUMA collector, refer to the Installing collector in the network infrastructure section.
Page topConfiguring Open Single Management Platform for export of events to the KUMA SIEM-system
KUMA allows you to receive and export events from Open Single Management Platform Administration Server to the KUMA SIEM system.
Configuring the export and receipt of Open Single Management Platform events proceeds in stages:
- Configuring the export of Open Single Management Platform events.
- Configuring the KUMA Collector.
- Installing the KUMA collector in the network infrastructure.
- Verifying receipt of Open Single Management Platform events in the KUMA collector
You can verify if the events from Open Single Management Platform Administration Server were correctly exported to the KUMA SIEM system by using the KUMA Console to search for related events.
To display Open Single Management Platform events in CEF format in the table, enter the following search expression:
SELECT * FROM `events` WHERE DeviceProduct = 'KSC' ORDER BY Timestamp DESC LIMIT 250
Configuring KUMA collector for collecting Open Single Management Platform events
After configuring the export of events in the CEF format from Open Single Management Platform Administration Server, configure the collector in the KUMA Console.
To configure the KUMA Collector for Open Single Management Platform events:
- In the KUMA Console, select Resources → Collectors.
- In the list of collectors, find the collector with the [OOTB] KSC normalizer and open it for editing.
- At the Transport step, in the URL field, specify the port to be used by the collector to receive Open Single Management Platform events.
The port must match the port of the KUMA SIEM system server.
- At the Event parsing step, make sure that the [OOTB] KSC normalizer is selected.
- At the Routing step, make sure that the following destinations are added to the collector resource set:
- Storage. To send processed events to the storage.
- Correlator. To send processed events to the correlator.
If the Storage and Correlator destinations were not added, create them.
- At the Setup validation tab, click Create and save service.
- Copy the command for installing the KUMA collector that appears.
Installing KUMA collector for collecting Open Single Management Platform events
After configuring the collector for collecting Open Single Management Platform events in the CEF format, install the KUMA collector on the network infrastructure server intended for receiving events.
For details on installing the KUMA collector, refer to the Installing collector in the network infrastructure section.
Page topConfiguring receiving Open Single Management Platform event from MS SQL
KUMA allows you to receive information about Open Single Management Platform events from an MS SQL database.
Before configuring, make sure that you have created the KUMA collector for Open Single Management Platform events from MS SQL.
When creating the collector in the KUMA Console, at the Transport step, select the [OOTB] KSC SQL connector.
To receive Open Single Management Platform events from the MS SQL database, at the Event parsing step, select the [OOTB] KSC from SQL normalizer.
Configuring event receiving consists of the following steps:
- Creating an account in the MS SQL.
- Configuring the SQL Server Browser service.
- Creating a secret.
- Configuring a connector.
- Installation of collector in the network infrastructure.
- Verifying receipt of events from MS SQL in the KUMA collector.
You can verify that the receipt of events from MS SQL is configured correctly by searching for related events in the KUMA Console.
Creating an account in the MS SQL database
To receive Open Single Management Platform events from MS SQL, a user account is required that has the rights necessary to connect and work with the database.
To create an account for working with MS SQL:
- Log in to the server with MS SQL for Open Single Management Platform installed.
- Using SQL Server Management Studio, connect to MS SQL using an account with administrator rights.
- In the Object Explorer pane, expand the Security section.
- Right-click the Logins folder and select New Login from the context menu.
The Login - New window opens.
- On the General tab, click the Search button next to the Login name field.
The Select User or Group window opens.
- In the Enter the object name to select (examples) field, specify the object name and click OK.
The Select User or Group window closes.
- In the Login - New window, on the General tab, select the Windows authentication option.
- In the Default database field, select the Open Single Management Platform database.
The default Open Single Management Platform database name is KAV.
- On the User Mapping tab, configure the account permissions:
- In the Users mapped to this login section, select the Open Single Management Platform database.
- In the Database role membership for section, select the check boxes next to the db_datareader and public permissions.
- On the Status tab, configure the permissions for connecting the account to the database:
- In the Permission to connect to database engine section, select Grant.
- In the Login section, select Enabled.
- Click OK.
The Login - New window closes.
To check the account permissions:
- Run SQL Server Management Studio using the created account.
- Go to any MS SQL database table and make a selection based on the table.
Configuring the SQL Server Browser service
After creating an account in MS SQL, you must configure the SQL Server Browser service.
To configure the SQL Server Browser service:
- Open SQL Server Configuration Manager.
- In the left pane, select SQL Server Services.
A list of services opens.
- Open the SQL Server Browser service properties in one of the following ways:
- Double-click the name of the SQL Server Browser service.
- Right-click the name of the SQL Server Browser service and select Properties from the context menu.
- In the SQL Server Browser Properties window that opens, select the Service tab.
- In the Start Mode field, select Automatic.
- Select the Log On tab and click the Start button.
Automatic startup of the SQL Server Browser service is enabled.
- Enable and configure the TCP/IP protocol by doing the following:
- In the left pane, expand the SQL Server Network Configuration section and select the Protocols for <SQL Server name> subsection.
- Right-click the TCP/IP protocol and select Enable from the context menu.
- In the Warning window that opens, click OK.
- Open the TCP/IP protocol properties in one of the following ways:
- Double-click the TCP/IP protocol.
- Right-click the TCP/IP protocol and select Properties from the context menu.
- Select the IP Addresses tab, and then in the IPALL section, specify port 1433 in the TCP Port field.
- Click Apply to save the changes.
- Click OK to close the window.
- Restart the SQL Server (<SQL Server name>) service by doing the following:
- In the left pane, select SQL Server Services.
- In the service list on the right, right-click the SQL Server (<SQL Server name>) service and select Restart from the context menu.
- In Windows Defender Firewall with Advanced Security, allow inbound connections on the server on the TCP port 1433.
Creating a secret in KUMA
After creating and configuring an account in MS SQL, you must add a secret in the KUMA Console. This resource is used to store credentials for connecting to MS SQL.
To create a KUMA secret:
- In the KUMA Console, open Resources → Secrets.
The list of available secrets will be displayed.
- Click the Add secret button to create a new secret.
The secret window is displayed.
- Enter information about the secret:
- In the Name field, choose a name for the added secret.
- In the Tenant drop-down list, select the tenant that will own the created resource.
- In the Type drop-down list, select urls.
- In the URL field, specify a string of the following form:
sqlserver://[<domain>%5C]<username>:<password>@<server>:1433/<database_name>where:
domainis a domain name.%5Cis the domain/user separator. Represents the "\" character in URL format.usernameis the name of the created MS SQL account.passwordis the password of the created MS SQL account.serveris the name or IP address of the server where the MS SQL database for Open Single Management Platform is installed.database_nameis the name of the Open Single Management Platform database. The default name is KAV.
Example:
sqlserver://test.local%5Cuser:password123@10.0.0.1:1433/KAVIf the MS SQL database account password contains special characters (@ # $ % & * ! + = [ ] : ' , ? / \ ` ( ) ;), convert them to URL format.
- Click Save.
For security reasons, the string specified in the URL field is hidden after the secret is saved.
Configuring a connector
To connect KUMA to an MS SQL database, you must configure the connector.
To configure a connector:
- In the KUMA Console, select Resources → Connectors.
- In the list of connectors, find the [OOTB] KSC SQL connector and open it for editing.
If a connector is not available for editing, copy it and open the connector copy for editing.
If the [OOTB] KSC SQL connector is not available, contact your system administrator.
- On the Basic settings tab, in the URL drop-down lists, select the secret created for connecting to the MS SQL database.
- Click Save.
Configuring the KUMA Collector for receiving Open Single Management Platform events from an MS SQL database
After configuring the event export settings, you must create a collector in the KUMA Console for Open Single Management Platform events received from MS SQL.
For details on creating a KUMA collector, refer to Creating a collector.
When creating the collector in the KUMA Console, at the Transport step, select the [OOTB] KSC SQL connector.
To receive Open Single Management Platform events from MS SQL, at the Event parsing step, select the [OOTB] KSC from SQL normalizer.
Page topInstalling the KUMA Collector for receiving Open Single Management Platform events from the MS SQL database
After configuring the collector for receiving Open Single Management Platform events from MS SQL, install the KUMA collector on the network infrastructure server where you intend to receive events.
For details on installing the KUMA collector, refer to the Installing collector in the network infrastructure section.
Page topConfiguring receipt of events from Windows devices using KUMA Agent (WEC)
KUMA allows you to receive information about events from Windows devices using the WEC KUMA Agent.
Configuring event receiving consists of the following steps:
- Configuring policies for receiving events from Windows devices.
- Configuring centralized receipt of events using the Windows Event Collector service.
- Granting permissions to view events.
- Granting permissions to log on as a service.
- Configuring the KUMA Collector.
- Installing KUMA collector.
- Forwarding events from Windows devices to KUMA.
Configuring audit of events from Windows devices
You can configure event audit on Windows devices for an individual device or for all devices in a domain.
This section describes how to configure an audit on an individual device and how to use a domain group policy to configure an audit.
Configuring an audit policy on a Windows device
To configure audit policies on a device:
- Open the Run window by pressing the key combination Win+R.
- In the opened window, type
secpol.mscand click OK.The Local security policy window opens.
- Select Security Settings → Local policies → Audit policy.
- In the pane on the right, double-click to open the properties of the policy for which you want to enable an audit of successful and unsuccessful attempts.
- In the <Policy name> properties window, on the Local security setting tab, select the Success and Failure check boxes to track successful and interrupted attempts.
It is recommended to enable an audit of successful and unsuccessful attempts for the following policies:
- Audit Logon
- Audit Policy Change
- Audit System Events
- Audit Logon Events
- Audit Account Management
Configuration of an audit policy on the device is complete.
Page topConfiguring an audit using a group policy
In addition to configuring an audit policy on an individual device, you can also configure an audit by using a domain group policy.
To configure an audit using a group policy:
- Open the Run window by pressing the key combination Win+R.
- In the opened window, type
gpedit.mscand click OK.The Local Group Policy Editor window opens.
- Select Computer configuration → Windows configuration → Security settings → Local policies → Audit policy.
- In the pane on the right, double-click to open the properties of the policy for which you want to enable an audit of successful and unsuccessful attempts.
- In the <Policy name> properties window, on the Local security setting tab, select the Success and Failure check boxes to track successful and interrupted attempts.
It is recommended to enable an audit of successful and unsuccessful attempts for the following policies:
- Audit Logon
- Audit Policy Change
- Audit System Events
- Audit Logon Events
- Audit Account Management
If you want to receive Windows logs from a large number of servers or if installation of KUMA agents on domain controllers is not allowed, it is recommended to configure Windows log redirection to individual servers that have the Windows Event Collector service configured.
The audit policy is now configured on the server or workstation.
Page topConfiguring centralized receipt of events from Windows devices using the Windows Event Collector service
The Windows Event Collector service allows you to centrally receive data about events on servers and workstations running Windows. You can use the Windows Event Collector service to subscribe to events that are registered on remote devices.
You can configure the following types of event subscriptions:
- Source-initiated subscriptions. Remote devices send event data to the Windows Event Collector server whose address is specified in the group policy. For details on the subscription configuration procedure, please refer to the Configuring data transfer from the event source server section.
- Collector-initiated subscriptions. The Windows Event Collector server connects to remote devices and independently gathers events from local logs. For details on the subscription configuration procedure, please refer to the Configuring the Windows Event Collector service section.
Configuring data transfer from the event source server
You can receive information about events on servers and workstations by configuring data transfer from remote devices to the Windows Event Collector server.
Preliminary steps
- Verify that the Windows Remote Management service is configured on the event source server by running the following command in the PowerShell console:
winrm get winrm/configIf the Windows Remote Management service is not configured, initialize it by running the following command:
winrm quickconfig - If the event source server is a domain controller, make the Windows logs available over the network by running the following command in PowerShell as an administrator:
wevtutil set-log security /ca:’O:BAG:SYD:(A;;0xf0005;;;SY)(A;;0x5;;;BA)(A;;0x1;;;S-1-5-32-573)(A;;0x1;;;S-1-5-20)Verify access by running the following command:
wevtutil get-log security
Configuring the firewall on the event source server
To enable the Windows Event Collector server to receive Windows log entries, inbound connection ports must be opened on the event source server.
To open ports for inbound connections:
- On the event source server, open the Run window by pressing the key combination Win+R.
- In the opened window, type
wf.mscand click OK.The Windows Defender Firewall with Advanced Security window opens.
- Go to the Inbound Rules section and click New Rule in the Actions pane.
The New Inbound Rule Wizard opens.
- At the Rule type step, select Port.
- At the Protocols and ports step, select TCP as the protocol. In the Specific local ports field, indicate the relevant port numbers:
5985(for HTTP access)5986(for HTTPS access)
You can indicate one of the ports, or both.
- At the Action step, select Allow connection (selected by default).
- At the Profile step, clear the Private and Public check boxes.
- At the Name step, specify a name for the new inbound connection rule and click Done.
Configuration of data transfer from the event source server is complete.
The Windows Event Collector server must have the permissions to read Windows logs on the event source server. These permissions can be assigned to both the Windows Event Collector server account and to a special user account. For details on granting permissions, please refer to the Granting user permissions to view the Windows Event Log.
Page topConfiguring the Windows Event Collector service
The Windows Event Collector server can independently connect to devices and gather data on events of any severity.
To configure the receipt of event data by the Windows Event Collector server:
- On the event source server, open the Run window by pressing Win+R.
- In the opened window, type
services.mscand click OK.The Services window opens.
- In the list of services, find and start the Windows Event Collector service.
- Open the Event Viewer snap-in by doing the following:
- Open the Run window by pressing the key combination Win+R.
- In the opened window, type
eventvwrand click OK.
- Go to the Subscriptions section and click Create Subscription in the Actions pane.
- In the opened Subscription Properties window, specify the name and description of the subscription, and define the following settings:
- In the Destination log field, select Forwarded events from the list.
- In the Subscription type and source computers section, click the Select computers button.
- In the opened Computers window, click the Add domain computer button.
The Select computer window opens.
- In the Enter the object names to select (examples) field, list the names of the devices from which you want to receive event information. Click OK.
- In the Computers window, check the list of devices from which the Windows Event Collector server will gather event data and click OK.
- In the Subscription properties window, in the Collected events field, click the Select events button.
- In the opened Request filter window, specify how often and which data about events on devices you want to receive.
- If necessary, in the <All event codes> field, list the codes of the events whose information you want to receive or do not want to receive. Click OK.
- If you want to use a special account to view event data, do the following:
- In the Subscription properties window, click the Advanced button.
- In the opened Advanced subscription settings window, in the user account settings, select Specific user.
- Click the User and password button and enter the account credentials of the selected user.
Configuration of the Event Collector Service is complete.
To verify that the configuration is correct and event data is being received by the Windows Event Collector server:
In the Event Viewer snap-in, go to Event Viewer (Local) → Windows logs → Forwarded events.
Page topGranting permissions to view Windows events
You can grant permissions to view Windows events for a specific device or for all devices in a domain.
To grant permissions to view events on a specific device:
- Open the Run window by pressing the key combination Win+R.
- In the opened window, type
compmgmt.mscand click OK.The Computer Management window opens.
- Go to Computer Management (local) → Local users and groups → Groups.
- In the pane on the right, select the Event Log Readers group and double-click to open the policy properties.
- Click the Add button at the bottom of the Properties: Event Log Readers window.
The Select Users, Computers or Groups window opens.
- In the Enter the object names to select (examples) field, list the names of the users or devices to which you want to grant permissions to view event data. Click OK.
To grant permissions to view events for all devices in a domain:
- Log in to the domain controller with administrator privileges.
- Open the Run window by pressing the key combination Win+R.
- In the opened window, type
dsa.mscand click OK.The Active Directory Users and Computers window opens.
- Go to Active Directory Users and Computers → <Domain name> → Builtin.
- In the pane on the right, select the Event Log Readers group and double-click to open the policy properties.
In the Properties: Event Log Readers window, open the Members tab and click the Add button.
The Select Users, Computers or Groups window opens.
- In the Enter the object names to select (examples) field, list the names of the users or devices to which you want to grant permissions to view event data. Click OK.
Granting permissions to log on as a service
You can grant permission to log on as a service to a specific device or to all devices in a domain. The "Log on as a service" permission allows you to start a process using an account that has been granted this permission.
To grant the "Log on as a service" permission to a device:
- Open the Run window by pressing the key combination Win+R.
- In the opened window, type
secpol.mscand click OK.The Local security policy window opens.
- Go to Security settings → Local policies → User rights assignment.
- In the pane on the right, double-click to open the properties of the Log on as a service policy.
- In the opened Properties: Log on as a Service window, click the Add User or Group button.
The Select Users or Groups window opens.
- In the Enter the object names to select (examples) field, list the names of the accounts or devices to which you want to grant the permission to log on as a service. Click OK.
Before granting the permission, make sure that the accounts or devices to which you want to grant the Log on as a service permission are not listed in the properties of the Deny log on as a service policy.
To grant the "Log on as a service" permission to devices in a domain:
- Open the Run window by pressing the key combination Win+R.
- In the opened window, type
gpedit.mscand click OK.The Local Group Policy Editor window opens.
- Select Computer configuration → Windows configuration → Security settings → Local policies → User rights assignment.
- In the pane on the right, double-click to open the properties of the Log on as a service policy.
- In the opened Properties: Log on as a Service window, click the Add User or Group button.
The Select Users or Groups window opens.
- In the Enter the object names to select (examples) field, list the names of the users or devices to which you want to grant the permission to log on as a service. Click OK.
Before granting the permission, make sure that the accounts or devices to which you want to grant the Log on as a service permission are not listed in the properties of the Deny log on as a service policy.
Page topConfiguring the KUMA Collector for receiving events from Windows devices
After you finish configuring the audit policy on devices, creating subscriptions to events and granting all the necessary permissions, you need to create a collector in the KUMA Console for events from Windows devices.
For details on creating a KUMA collector, refer to Creating a collector.
To receive events from Windows devices, define the following collector settings in the KUMA Collector Installation Wizard:
- At the Transport step, define the following settings:
- In the Connector window, select Create.
- In the Type field, select http.
- In the Delimiter field, select \0.
- On the Advanced settings tab, in the TLS mode field, select With verification.
- At the Event parsing step, click the Add event parsing button.
- This opens the Basic event parsing window; in that window, in the Normalizer field, select [OOTB] Microsoft Products and click OK.
- At the Routing step, add the following destinations:
- Storage. To send processed events to the storage.
- Correlator. To send processed events to the correlator.
If the Storage and Correlator destinations were not added, create them.
- At the Setup validation tab, click Create and save service.
- Copy the command for installing the KUMA collector that appears.
Installing the KUMA Collector for receiving events from Windows devices
After configuring the collector for receiving Windows events, install the KUMA Collector on the server of the network infrastructure intended for receiving events.
For details on installing the KUMA collector, refer to the Installing collector in the network infrastructure section.
Page topConfiguring forwarding of events from Windows devices to KUMA using KUMA Agent (WEC)
To complete the data forwarding configuration, you must create a WEC KUMA agent and then install it on the device from which you want to receive event information.
For more details on creating and installing a WEC KUMA Agent on Windows devices, please refer to the Forwarding events from Windows devices to KUMA section.
Page topConfiguring receipt of events from Windows devices using KUMA Agent (WMI)
KUMA allows you to receive information about events from Windows devices using the WMI KUMA Agent.
Configuring event receiving consists of the following steps:
- Configuring audit settings for managing KUMA.
- Configuring data transfer from the event source server.
- Granting permissions to view events.
- Granting permissions to log on as a service.
- Creating a KUMA collector.
To receive Windows device events, in the KUMA Collector Setup Wizard, at the Event parsing step, in the Normalizer field, select [OOTB] Microsoft Products.
- Installing KUMA collector.
- Forwarding events from Windows devices to KUMA.
To complete the data forwarding configuration, you must create a WMI KUMA agent and then install it on the device from which you want to receive event information.
Configuring audit settings for managing KUMA
You can configure event audit on Windows devices both on a specific device using a local policy or on all devices in a domain using a group policy.
This section describes how to configure an audit on an individual device and how to use a domain group policy to configure an audit.
Configuring an audit using a local policy
To configure an audit using a local policy:
- Open the Run window by pressing the key combination Win+R.
- In the opened window, type
secpol.mscand click OK.The Local security policy window opens.
- Select Security Settings → Local policies → Audit policy.
- In the pane on the right, double-click to open the properties of the policy for which you want to enable an audit of successful and unsuccessful attempts.
- In the <Policy name> properties window, on the Local security setting tab, select the Success and Failure check boxes to track successful and interrupted attempts.
It is recommended to enable an audit of successful and unsuccessful attempts for the following policies:
- Audit Logon
- Audit Policy Change
- Audit System Events
- Audit Logon Events
- Audit Account Management
Configuration of an audit policy on the device is complete.
Page topConfiguring an audit using a group policy
In addition to configuring an audit on an individual device, you can also configure an audit by using a domain group policy.
To configure an audit using a group policy:
- Open the Run window by pressing the key combination Win+R.
- In the opened window, type
gpedit.mscand click OK.The Local Group Policy Editor window opens.
- Select Computer configuration → Windows configuration → Security settings → Local policies → Audit policy.
- In the pane on the right, double-click to open the properties of the policy for which you want to enable an audit of successful and unsuccessful attempts.
- In the <Policy name> properties window, on the Local security setting tab, select the Success and Failure check boxes to track successful and interrupted attempts.
It is recommended to enable an audit of successful and unsuccessful attempts for the following policies:
- Audit Logon
- Audit Policy Change
- Audit System Events
- Audit Logon Events
- Audit Account Management
The audit policy is now configured on the server or workstation.
Page topConfiguring data transfer from the event source server
Preliminary steps
- On the event source server, open the Run window by pressing the key combination Win+R.
- In the opened window, type
services.mscand click OK.The Services window opens.
- In the list of services, find the following services:
- Remote Procedure Call
- RPC Endpoint Mapper
- Check the Status column to confirm that these services have the Running status.
Configuring the firewall on the event source server
The Windows Management Instrumentation server can receive Windows log entries if ports are open for inbound connections on the event source server.
To open ports for inbound connections:
- On the event source server, open the Run window by pressing the key combination Win+R.
- In the opened window, type
wf.mscand click OK.The Windows Defender Firewall with Advanced Security window opens.
- In the Windows Defender Firewall with Advanced Security window, go to the Inbound Rules section and in the Actions pane, click New Rule.
This opens the New Inbound Rule Wizard.
- In the New Inbound Rule Wizard, at the Rule Type step, select Port.
- At the Protocols and ports step, select TCP as the protocol. In the Specific local ports field, indicate the relevant port numbers:
13544549152–65535
- At the Action step, select Allow connection (selected by default).
- At the Profile step, clear the Private and Public check boxes.
- At the Name step, specify a name for the new inbound connection rule and click Done.
Configuration of data transfer from the event source server is complete.
Page topGranting permissions to view Windows events
You can grant permissions to view Windows events for a specific device or for all devices in a domain.
To grant permissions to view events on a specific device:
- Open the Run window by pressing the key combination Win+R.
- In the opened window, type
compmgmt.mscand click OK.The Computer Management window opens.
- Go to Computer Management (local) → Local users and groups → Groups.
- In the pane on the right, select the Event Log Readers group and double-click to open the policy properties.
- Click the Add button at the bottom of the Properties: Event Log Readers window.
The Select Users, Computers or Groups window opens.
- In the Enter the object names to select (examples) field, list the names of the users or devices to which you want to grant permissions to view event data. Click OK.
To grant permissions to view events for all devices in a domain:
- Log in to the domain controller with administrator privileges.
- Open the Run window by pressing the key combination Win+R.
- In the opened window, type
dsa.mscand click OK.The Active Directory Users and Computers window opens.
- In the Active Directory Users and Computers window, go to the Active Directory Users and Computers section → <Domain name> → Builtin.
- In the pane on the right, select the Event Log Readers group and double-click to open the policy properties.
In the Properties: Event Log Readers window, open the Members tab and click the Add button.
The Select Users, Computers or Groups window opens.
- In the Select User, Computer, or Group window, In the Enter the object name to select (examples) field, list the names of the users or devices to which you want to grant permissions to view event data. Click OK.
Granting permissions to log on as a service
You can grant permission to log on as a service to a specific device or to all devices in a domain. The "Log on as a service" permission allows you to start a process using an account that has been granted this permission.
Before granting the permission, make sure that the accounts or devices to which you want to grant the Log on as a service permission are not listed in the properties of the Deny log on as a service policy.
To grant the "Log on as a service" permission to a device:
- Open the Run window by pressing the key combination Win+R.
- In the opened window, type
secpol.mscand click OK.The Local security policy window opens.
- In the Local Security Policy window, go to the Security Settings → Local Policies → User Rights Assignment section.
- In the pane on the right, double-click to open the properties of the Log on as a service policy.
- This opens the Properties: Log on as a Service window; in that window, click Add User or Group.
This opens the Select Users or Groups window.
- In the Enter the object names to select (examples) field, list the names of the accounts or devices to which you want to grant the permission to log on as a service. Click OK.
To grant the "Log on as a service" permission to devices in a domain:
- Open the Run window by pressing the key combination Win+R.
- In the opened window, type
gpedit.mscand click OK.The Local Group Policy Editor window opens.
- Select Computer configuration → Windows configuration → Security settings → Local policies → User rights assignment.
- In the pane on the right, double-click to open the properties of the Log on as a service policy.
- This opens the Properties: Log on as a Service window; in that window, click Add User or Group.
This opens the Select Users or Groups window.
- In the Enter the object names to select (examples) field, list the names of the users or devices to which you want to grant the permission to log on as a service. Click OK.
Configuring receipt of DNS server events using the ETW agent
The Event Tracing for Windows connector (hereinafter also referred to as the ETW connector) is a mechanism for logging events generated by applications and drivers on the DNS server. You can use the ETW connector to troubleshoot errors during development or to look for malicious activity.
The impact of the ETW connector on DNS server performance is insignificant. For example, a DNS server running on modern hardware and getting up to 100,000 queries per second (QPS) may experience a 5% performance drop while using the ETW connector. If the DNS server gets up to 50,000 requests per second, no performance drop is observed. We recommend monitoring DNS server performance when using the ETW connector, regardless of the number of requests per second.
By default, you can use the ETW connector on Windows Server 2016 or later. The ETW connector is also supported by Windows Server 2012 R2 if the update for event logging and change auditing is installed. The update is available on the Microsoft Support website.
The ETW connector consists of the following components:
- Providers are elements of the system that generate events and send them to the ETW connector. For example, Windows kernels or device drivers can act as providers. When working with code, developers must specify which events the providers must send to the ETW connector. An event may represent the execution of a function that the developer considers important, for example, a function that allows access to the Security Account Manager (SAM).
- Consumers are software systems that receive events generated by providers from the ETW connector, and use these events in some way. For example, KUMA can act as a consumer.
- Controllers are pieces of software that manage the interaction between providers and consumers. For example, the Logman or Wevtutil utilities can be controllers. Providers register with the controller to send events to consumers. The controller can enable or disable a provider. If a provider is disabled, it does not generate events.
Controllers use trace sessions for communication between providers and consumers. Trace sessions are also used for filtering data based on specified parameters because consumers may need different events.
Configuring DNS server event reception using the ETW connector proceeds in stages:
- Configuration on the Windows side.
- Creating a KUMA collector.
When creating a KUMA collector, follow these steps:
- At step 2 of the Collector Installation Wizard:
- In the Type drop-down list, select the tcp connector type. You can also specify the http connector type and other connector types with verification for secure transmission.
- In the URL field, enter the FQDN and port number on which the KUMA collector will listen for a connection from the KUMA agent. You can specify any unoccupied port number.
- In the Delimiter field, enter
\n.
- At step 3 of the Collector Installation Wizard, in the Normalizer drop-down list, select a normalizer. We recommend selecting the predefined extended normalizer for Windows events, [OOTB] Microsoft DNS ETW logs json.
- At step 7 of the Collector Installation Wizard, add a Storage type destination for storing events. If you plan to use event correlation, you also need to add a Correlator type destination.
- At step 8 of the Collector Installation Wizard, click Create and save service, and in the lower part of the window, copy the command for installing the KUMA collector on the server.
- At step 2 of the Collector Installation Wizard:
- Installing the KUMA collector on the server.
Do the following:
- Connect to the KUMA command line interface using a user account with root privileges.
- Install the KUMA collector by running the command that you copied at step 8 of the Collector Installation Wizard.
- If you want to add the KUMA collector port to the firewall exclusions and update the firewall settings, run the following commands:
firewall-cmd --add-port=<collector port number>/tcp --permanentfirewall-cmd --reload
The KUMA collector is installed and the status of the KUMA collector service changes to green in the KUMA Console.
- Creating a KUMA agent.
When creating a KUMA agent, follow these steps:
- Go to the Connection 1 tab.
- Under Connector, in the Connector drop-down list, select Create and specify the following settings:
- In the Type drop-down list, select the etw connector type.
- In the Session name field, enter the provider name that you specified when you configured the reception of DNS server events using the ETW connector on the Windows side.
- Under Destinations, in the Destination drop-down list, select Create and specify the following settings:
- In the Type drop-down list, select the tcp destination type.
- In the URL field, enter the FQDN and port number on which the KUMA collector will listen for a connection from the KUMA agent. The value must match the value that you specified at step 2 of the Collector Installation Wizard.
- Go to the Advanced settings tab, and in the Disk buffer size limit field, enter
1073741824.
- Creating a KUMA agent service.
You need to copy the ID of the created KUMA agent service. To do so, right-click next to the KUMA agent service and select Copy ID in the context menu.
- Creating an account for the KUMA agent.
Create a domain or local Windows user account for running the KUMA agent and reading the analytic log. You need to add the created user account to the Performance Log Users group and grant the Log on service permission to that user account.
- Installing a KUMA agent on a Windows server.
You need to install the KUMA agent on the Windows server that will be receiving events from the provider. To do so:
- Add the FQDN of the KUMA Core server to the hosts file on the Windows server or to the DNS server.
- Create the C:\Users\<
user name>\Desktop\KUMA folder on the Windows server. - Copy the kuma.exe file from the KUMA installation package archive to the C:\Users\<
user name>\Desktop\KUMA folder.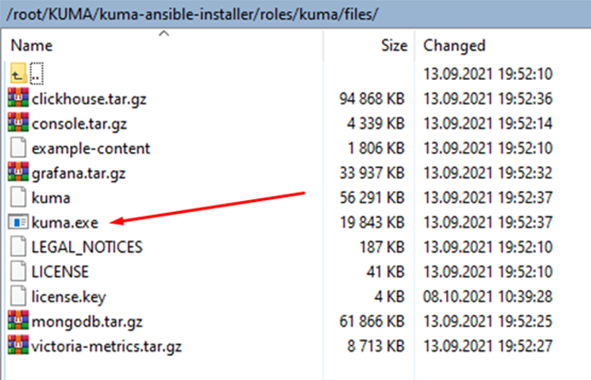
- Run the command interpreter as administrator.
- Change to the C:\Users\<user name>\Desktop\KUMA folder and run the following command:
C:\Users\<user name>\Desktop\KUMA>kuma.exe agent --core https://<DOMAIN-NAME-KUMA-CORE-Server>:7210 --id <KUMA agent service ID>In the KUMA Console, in the Resources → Active services section, make sure that the KUMA agent service is running and its status is now green, and then abort the command.
- Start the KUMA Agent installation in one of the following ways:
- If you want to start the KUMA agent installation using a domain user account, run the following command:
C:\Users\<user name>\Desktop\KUMA>kuma.exe agent --core https://<DOMAIN-NAME-KUMA-CORE-Server>:7210 --id <KUMA agent service ID> –-user <domain>\<user account name for the KUMA agent> --install - If you want to start the agent installation using a local user account, run the following command:
C:\Users\<user name>\Desktop\KUMA>kuma.exe agent --core https://<DOMAIN-NAME-KUMA-CORE-Server>:7210 --id <KUMA agent service ID> –-user <user account name for the KUMA agent> --install
You will need to enter the password of the KUMA agent user account.
- If you want to start the KUMA agent installation using a domain user account, run the following command:
The KUMA Windows Agent service <KUMA agent service ID> is installed on the Windows server. In the KUMA Console, in the Resources → Active services section, if the KUMA agent service is not running and has the red status, you need to make sure that port 7210 is available, as well as the Windows collector port in the direction from the KUMA agent to the KUMA collector.
To remove the KUMA agent service on the Windows server, run the following command:
C:\Users\<user name>\Desktop\KUMA>kuma.exe agent --id <KUMA agent service ID> --uninstall - Verifying receipt of DNS server events in the KUMA collector.
You can verify that you have correctly configured the reception of DNS server events using the ETW connector in the Searching for related events section of the KUMA Console.
Configuration on the Windows side
To configure the reception of DNS server events using the ETW connector on the Windows side:
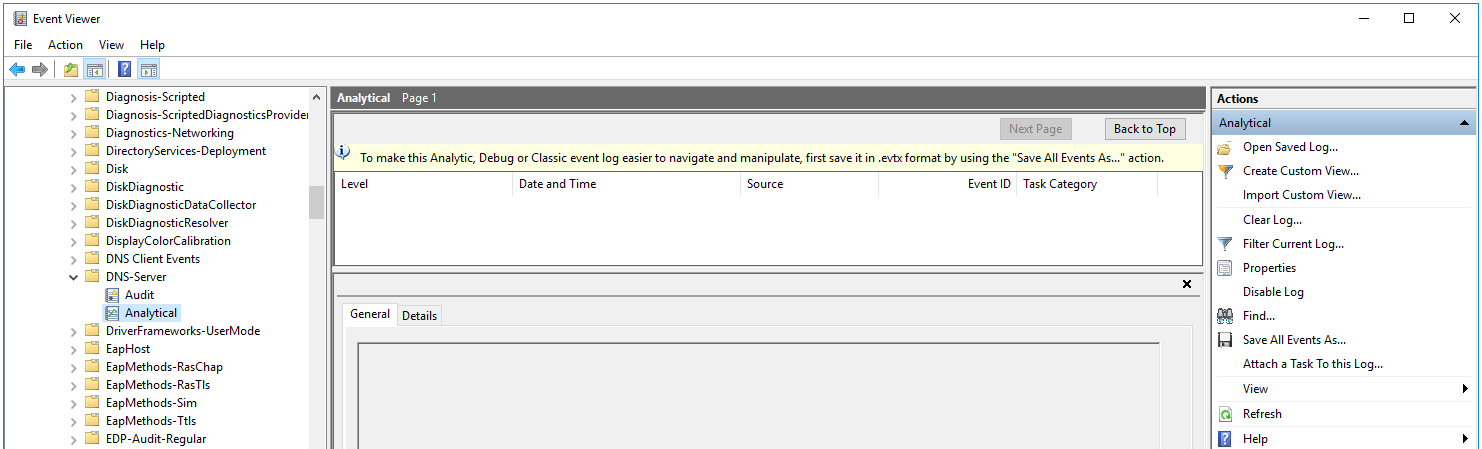
- Start the Event viewer by running the following command:
eventvwr.msc - This opens a window; in that window, go to the Applications and Services Logs → Microsoft → Windows → DNS-Server folder.
- Open the context menu of the DNS-Server folder and select View → Show Analytic and Debug Logs.
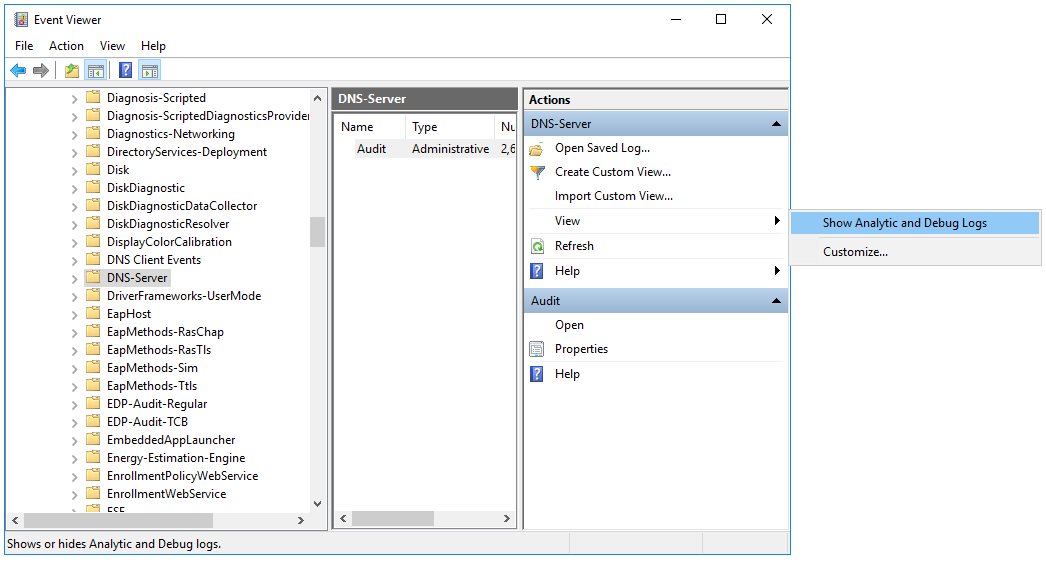
The Audit debug log and Analytical log are displayed.
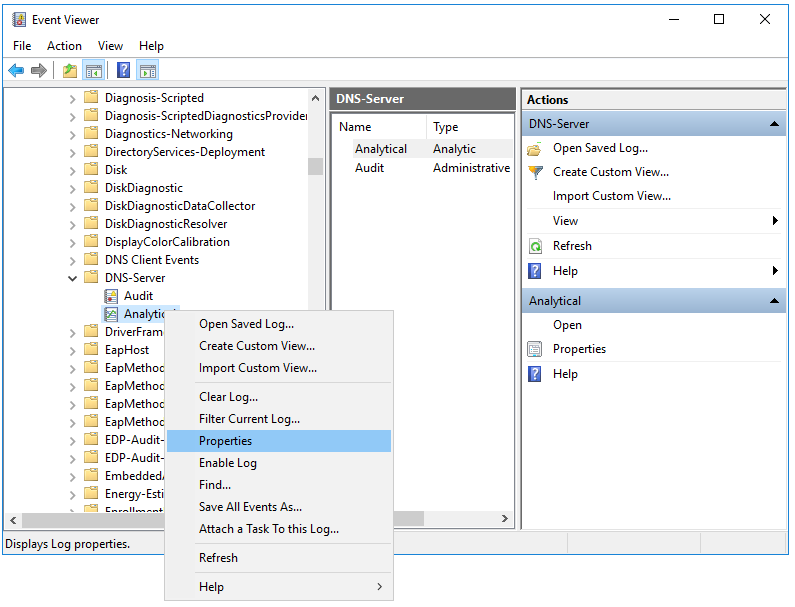
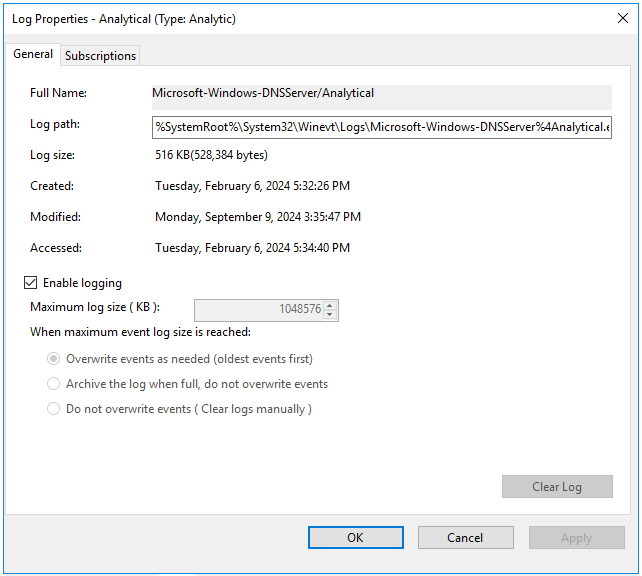
- Configure the analytic log:
- Open the context menu of the Analytical log and select Properties.
- This opens a window; in that window, make sure that in the Max Log Size (KB) field, the value is
1048576.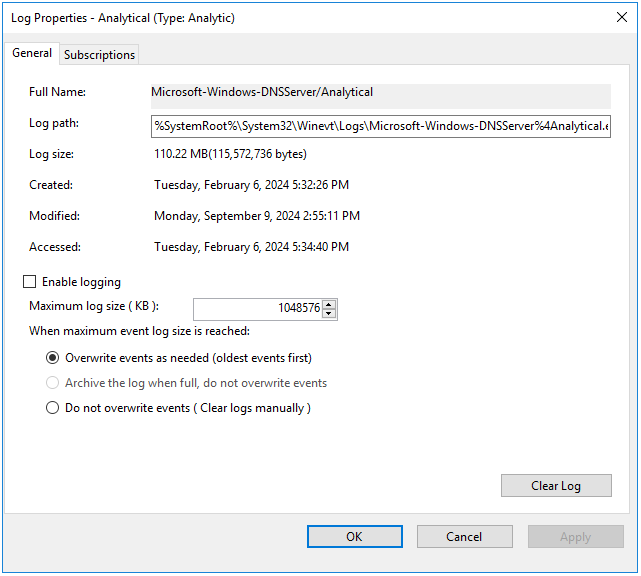
- Select the Enable logging check box and in the confirmation window, click OK.
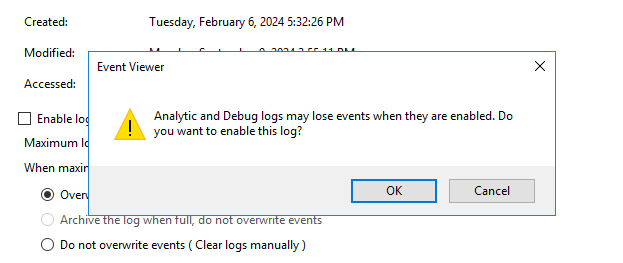
The analytic log must be configured as follows:
- Click Apply, then click OK.
An error window is displayed.
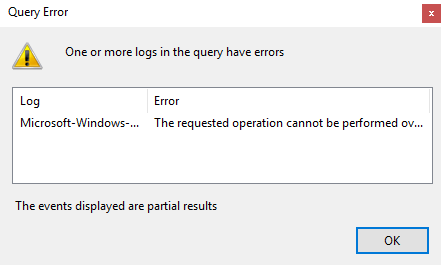
When analytic log rotation is enabled, events are not displayed. To view events, in the Actions pane, click Stop logging.
- Open the context menu of the Analytical log and select Properties.
- Start Computer management as administrator.
- This opens a window; in that window, go to the System Tools → Performance → Startup Event Trace Sessions folder.
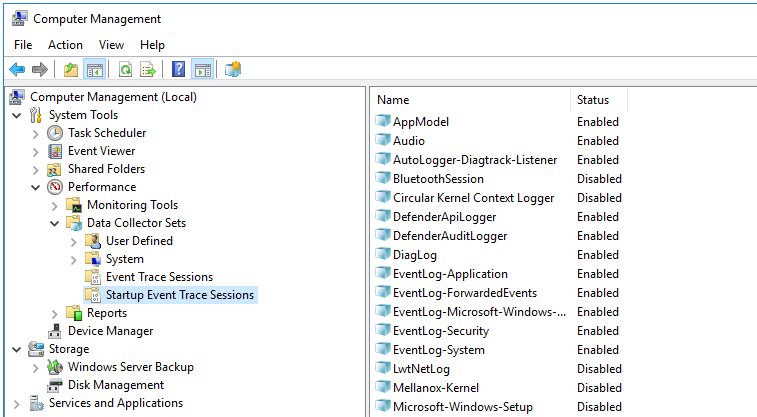
- Create a provider:
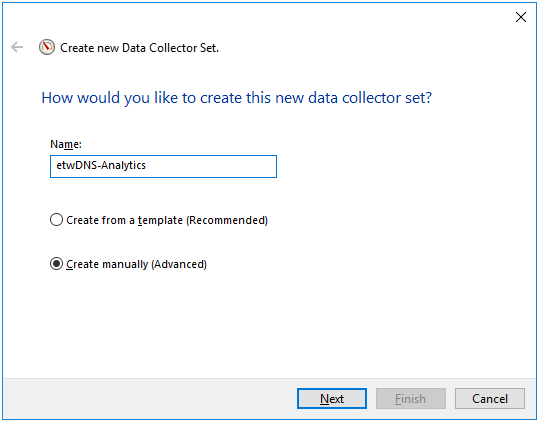
- Open the context menu of the Startup Event Trace Sessions folder and select Create → Data Collector Set.
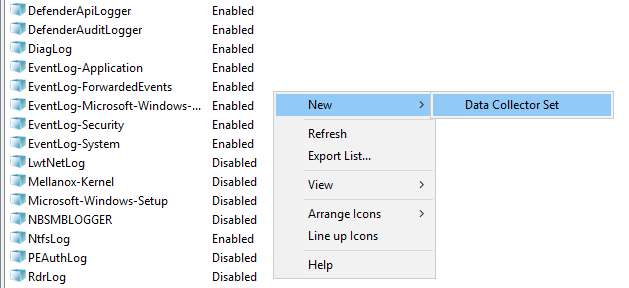
- This opens a window; in that window, enter the name of the provider and click Next.
- Click Add... and in the displayed window, select the Microsoft-Windows-DNSServer provider.
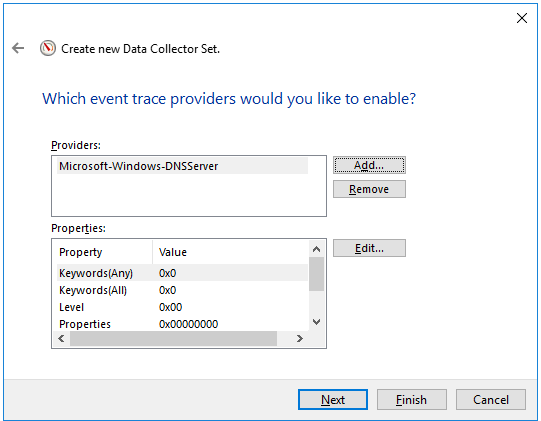
The KUMA agent with the ETW connector works only with System.Provider.Guid: {EB79061A-A566-4698-9119-3ED2807060E7} - Microsoft-Windows-DNSServer.
- Click Next twice, then click Finish.
- Open the context menu of the Startup Event Trace Sessions folder and select Create → Data Collector Set.
- Open the context menu of the created provider and select Start As Event Trace Session.
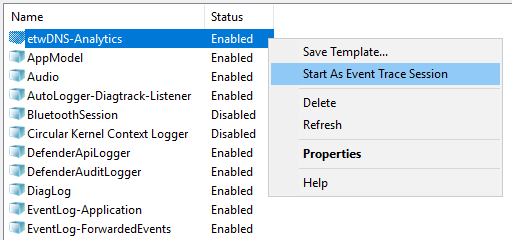
- Go to the Event Trace Sessions folder.
Event trace sessions are displayed.
- Open the context menu of the created event trace session and select Properties.
- This opens a window; in that window, select the Trace Sessions tab and in the Stream Mode drop-down list, select Real Time.
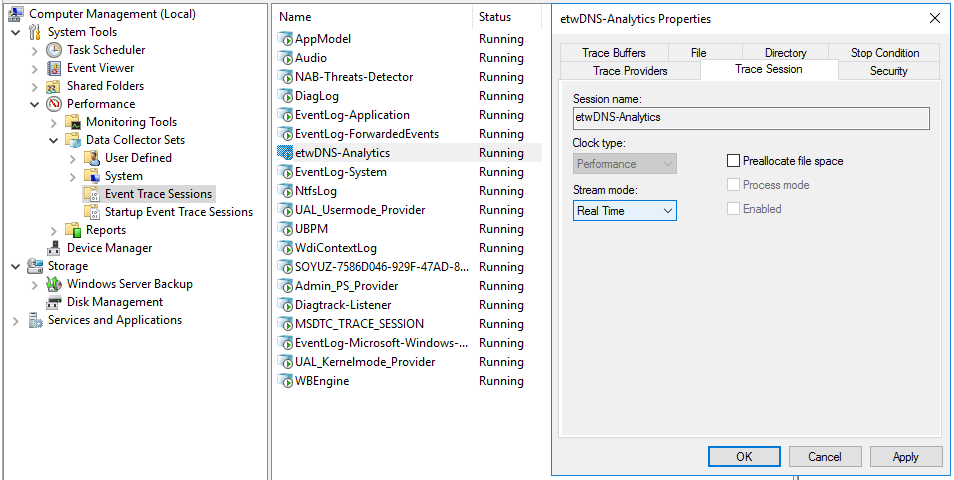
- Click Apply, then click OK.
DNS server event reception using the ETW connector is configured.
Page topConfiguring receipt of PostgreSQL events
KUMA lets you monitor and audit PostgreSQL events on Linux devices using rsyslog.
Events are audited using the pgAudit plugin. The plugin supports PostgreSQL 9.5 and later. For details about the pgAudit plugin, see https://github.com/pgaudit/pgaudit.
Configuring event receiving consists of the following steps:
- Installing the pdAudit plugin.
- Creating a KUMA collector for PostgreSQL events.
To receive PostgreSQL events using rsyslog, in the collector installation wizard, at the Event parsing step, select the [OOTB] PostgreSQL pgAudit syslog normalizer.
- Installing a collector in the KUMA network infrastructure.
- Configuring the event source server.
- Verifying receipt of PostgreSQL events in the KUMA collector
You can verify that the PostgreSQL event source server is correctly configured in the Searching for related events section of the KUMA Console.
Installing the pgAudit plugin
To install the pgAudit plugin:
- On the OS command line, run the following commands as a user with administrator rights:
sudo apt updatesudo apt -y install postgresql-<PostgreSQL version>-pgauditYou must select the plugin version to match the PostgresSQL version. For information about PostgreSQL versions and the matching plugin versions, see https://github.com/pgaudit/pgaudit#postgresql-version-compatibility.
Example:
sudo apt -y install postgresql-12-pgaudit - Find the postgres.conf configuration file. To do so, run the following command on the PostgreSQL command line:
show data_directoryThe response will indicate the location of the configuration file.
- Create a backup copy of the postgres.conf configuration file.
- Open the postgres.conf file and copy or replace the values in it with the values listed below.
```## pgAudit settingsshared_preload_libraries = 'pgaudit'## database logging settingslog_destination = 'syslog'## syslog facilitysyslog_facility = 'LOCAL0'## event identsyslog_ident = 'Postgres'## sequence numbers in syslogsyslog_sequence_numbers = on## split messages in syslogsyslog_split_messages = off## message encodinglc_messages = 'en_US.UTF-8'## min message level for loggingclient_min_messages = log## min error message level for logginglog_min_error_statement = info## log checkpoints (buffers, restarts)log_checkpoints = off## log query durationlog_duration = off## error description levellog_error_verbosity = default## user connections logginglog_connections = on## user disconnections logginglog_disconnections = on## log prefix formatlog_line_prefix = '%m|%a|%d|%p|%r|%i|%u| %e '## log_statementlog_statement = 'none'## hostname logging status. dns bane resolving affect#performance!log_hostname = off## logging collector buffer status#logging_collector = off## pg audit settingspgaudit.log_parameter = onpgaudit.log='ROLE, DDL, MISC, FUNCTION'``` - Restart the PostgreSQL service using the command:
sudo systemctl restart postgresql - To load the pgAudit plugin to PostgreSQL, run the following command on the PostgreSQL command line:
CREATE EXTENSION pgaudit
The pgAudit plugin is installed.
Page topConfiguring a Syslog server to send events
The rsyslog service is used to transmit events from the server to KUMA.
To configure the sending of events from the server where PostgreSQL is installed to the collector:
- To verify that the rsyslog service is installed on the event source server, run the following command as administrator:
sudo systemctl status rsyslog.serviceIf the rsyslog service is not installed on the server, install it by executing the following commands:
yum install rsyslogsudo systemctl enable rsyslog.servicesudo systemctl start rsyslog.service - In the /etc/rsyslog.d/ directory, create a pgsql-to-siem.conf file with the following content:
If $programname contains 'Postgres' then @<IP address of the collector>:<port of the collector>For example:If $programname contains 'Postgres' then @192.168.1.5:1514If you want to send events via TCP, the contents of the file must be as follows:
If $programname contains 'Postgres' then @@<IP address of the collector>:<port of the collector>Save changes to the pgsql-to-siem.conf configuration file.
- Add the following lines to the /etc/rsyslog.conf configuration file:
$IncludeConfig /etc/pgsql-to-siem.conf$RepeatedMsgReduction offSave changes to the /etc/rsyslog.conf configuration file.
- Restart the rsyslog service by executing the following command:
sudo systemctl restart rsyslog.service
Configuring receipt of IVK Kolchuga-K events
You can configure the receipt of events from the IVK Kolchuga-K system to the KUMA SIEM system.
Configuring event receiving consists of the following steps:
- Configuring the sending of IVK Kolchuga-K events to KUMA.
- Creating a KUMA collector for receiving events from the IVK Kolchuga-K system.
To receive IVK Kolchuga-K events using Syslog, in the Collector Installation Wizard, at the Event parsing step, select the [OOTB] Kolchuga-K syslog normalizer.
- Installing a KUMA collector for receiving IVK Kolchuga-K events.
- Verifying receipt of IVK Kolchuga-K events in KUMA.
You can verify that the IVK Kolchuga-K event source is configured correctly in the Searching for related events section of the KUMA Console.
Configuring export of IVK Kolchuga-K events to KUMA
To configure the export of events of the IVK Kolchuga-K firewall via syslog to the KUMA collector:
- Connect to the firewall over SSH with administrator rights.
- Create a backup copy of the /etc/services and /etc/syslog.conf files.
- In the /etc/syslog.conf configuration file, specify the FQDN or IP address of the KUMA collector. For example:
*.* @kuma.example.com
or
*.* @192.168.0.100
Save changes to the configuration file /etc/syslog.conf.
- In the /etc/services configuration file, specify the port and protocol used by the KUMA collector. For example:
syslog 10514/udp
Save changes to the /etc/services configuration file.
- Restart the syslog server of the firewall:
service syslogd restart
Configuring receipt of CryptoPro NGate events
You can configure the receipt of CryptoPro NGate events in the KUMA SIEM system.
Configuring event receiving consists of the following steps:
- Configuring export of CryptoPro NGate events to KUMA.
- Creating a KUMA collector for receiving CryptoPro NGate events.
To receive CryptoPro NGate events using Syslog, in the collector installation wizard, at the Event parsing step, select the [OOTB] NGate syslog normalizer.
- Creating a KUMA collector for receiving CryptoPro NGate events.
- Verifying receipt of CryptoPro NGate events in the KUMA collector.
You can verify that the CryptoPro NGate event source server is correctly configured in the Searching for related events section of the KUMA Console.
Configuring export of CryptoPro NGate events to KUMA
To configure the sending of events from CryptoPro NGate to KUMA:
- Connect to the web interface of the NGate management system.
- Connect remote syslog servers to the management system. To do so:
- Open the page with the list of syslog servers: External Services → Syslog Server → Add Syslog Server.
- Enter the settings of the syslog server and click
 .
.
- Assign syslog servers to the configuration for recording logs of the cluster. To do so:
- In the Clusters → Summary section, select the cluster that you want to configure.
- On the Configurations tab, click the Configuration control for the relevant cluster to go to the configuration settings page.
In the
Syslog Serversfield of the configured configuration, click the
Assignbutton.
Select the check boxes for syslog servers that you want to assign and click
.You can assign an unlimited number of servers.
To add new syslog servers, click
 .
.Publish the configuration to activate the new settings.
Assign syslog servers to the management system for recording Administrator activity logs. To do so:
- Select the Management Center Settings menu item and on the page that is displayed, under Syslog servers, click Assign.
- In the Assign Syslog Servers to Management Center window, select the check box for those syslog servers that you want to assign, then click
 .
.You can assign an unlimited number of servers.
As a result, events of CryptoPro NGate are sent to KUMA.
Page topConfiguring receipt of Ideco UTM events
You can configure the receipt of Ideco UTM application events in KUMA via the Syslog protocol.
Configuring event receiving consists of the following steps:
- Configuring the export of Ideco UTM events to KUMA.
- Creating a KUMA collector for receiving Ideco UTM.
To receive Ideco UTM events, in the Collector Installation Wizard, at the Event parsing step, select the "[OOTB] Ideco UTM syslog" normalizer.
- Creating a KUMA collector for receiving Ideco UTM events.
- Verifying receipt of Ideco UTM events in KUMA.
You can verify that the Ideco UTM event source server is correctly configured in the Searching for related events section of the KUMA Console.
Configuring export of Ideco UTM events to KUMA
To configure the sending of events from Ideco UTM to KUMA:
- Connect to the Ideco UTM web interface under a user account that has administrative privileges.
- In the System message forwarding menu, move the Syslog toggle switch to the enabled position.
- For the IP address setting, specify the IP address of the KUMA collector.
- For the Port setting, enter the port that the KUMA collector is listening on.
- Click Save to apply the changes.
The forwarding of Ideco UTM events to KUMA is configured.
Page topConfiguring receipt of KWTS events
You can configure the receipt of events from the Kaspersky Web Traffic Security (KWTS) web traffic analysis and filtering system in KUMA.
Configuring event receiving consists of the following steps:
- Configuring export of KWTS events to KUMA.
- Creating a KUMA collector for receiving KWTS events.
To receive KWTS events, in the Collector Installation Wizard, at the Event parsing step, select the [OOTB] KWTS normalizer.
- Installing a KUMA collector for receiving KWTS events.
- Verifying receipt of KWTS events in the KUMA collector.
You can verify that KWTS event export is correctly configured in the Searching for related events section of the KUMA Console.
Configuring export of KWTS events to KUMA
To configure the export of KWTS events to KUMA:
- Connect to the KWTS server over SSH as root.
- Before making changes, create backup copies of the following files:
- /opt/kaspersky/kwts/share/templates/core_settings/event_logger.json.template
- /etc/rsyslog.conf
- Make sure that the settings in the /opt/kaspersky/kwts/share/templates/core_settings/event_logger.json.template configuration file have the following values, and make changes if necessary:
"siemSettings":{"enabled": true,"facility": "Local5","logLevel": "Info","formatting":{ - Save your changes.
- To send events via UDP, make the following changes to the /etc/rsyslog.conf configuration file:
$WorkDirectory /var/lib/rsyslog$ActionQueueFileName ForwardToSIEM$ActionQueueMaxDiskSpace 1g$ActionQueueSaveOnShutdown on$ActionQueueType LinkedList$ActionResumeRetryCount -1local5.* @<<IP address of the KUMA collector>:<port of the collector>>If you want to send events over TCP, the last line should be as follows:
local5.* @@<<IP address of the KUMA collector>:<port of the collector>> - Save your changes.
- Restart the rsyslog service with the following command:
sudo systemctl restart rsyslog.service - Go to the KWTS web interface, to the Settings → Syslog tab and enable the Log information about traffic profile option.
- Click Save.
Configuring receipt of KLMS events
You can configure the receipt of events from the Kaspersky Linux Mail Server (KLMS) mail traffic analysis and filtering system to the KUMA SIEM system.
Configuring event receiving consists of the following steps:
- Depending on the version of KLMS you are using, select one of the following options:
- Creating a KUMA collector for receiving KLMS events
To receive KLMS events, in the Collector Installation Wizard, at the Event parsing step, select the [OOTB] KLMS syslog CEF normalizer.
- Installing a KUMA collector for receiving KLMS events.
- Verifying receipt of KLMS events in the KUMA collector
You can verify that the KLMS event source server is correctly configured in the Searching for related events section of the KUMA Console.
Configuring export of KLMS events to KUMA
To configure the export of KLMS events to KUMA:
- Connect to the KLMS server over SSH and go to the Technical Support Mode menu.
- Use the klms-control utility to download the settings to the settings.xml file:
sudo /opt/kaspersky/klms/bin/klms-control --get-settings EventLogger -n -f /tmp/settings.xml - Make sure that the settings in the /tmp/settings.xml file have the following values; make changes if necessary:
<siemSettings><enabled>1</enabled><facility>Local1</facility>...</siemSettings> - Apply settings with the following command:
sudo /opt/kaspersky/klms/bin/klms-control --set-settings EventLogger -n -f /tmp/settings.xml - To send events via UDP, make the following changes to the /etc/rsyslog.conf configuration file:
$WorkDirectory /var/lib/rsyslog$ActionQueueFileName ForwardToSIEM$ActionQueueMaxDiskSpace 1g$ActionQueueSaveOnShutdown on$ActionQueueType LinkedList$ActionResumeRetryCount -1local1.* @<<IP address of the KUMA collector>:<port of the collector>>If you want to send events over TCP, the last line should be as follows:
local1.* @@<<IP address of the KUMA collector>:<port of the collector>> - Save your changes.
- Restart the rsyslog service with the following command:
sudo systemctl restart rsyslog.service
Configuring receipt of KSMG events
You can configure the receipt of events from the Kaspersky Secure Mail Gateway (KSMG) 1.1 mail traffic analysis and filtering system in the KUMA SIEM system.
Configuring event receiving consists of the following steps:
- Configuring export of KSMG events to KUMA
- Creating a KUMA collector for receiving KSMG events
To receive KSMG events, in the Collector Installation Wizard, at the Event parsing step, select the [OOTB] KSMG normalizer.
- Installing a KUMA collector for receiving KSMG events.
- Verifying receipt of KSMG events in the KUMA collector
You can verify that the KSMG event source server is correctly configured in the Searching for related events section of the KUMA Console.
Configuring export of KSMG events to KUMA
To configure the export of KSMG events to KUMA:
- Connect to the KSMG server via SSH using an account with administrator rights.
- Use the ksmg-control utility to download the settings to the settings.xml file:
sudo /opt/kaspersky/ksmg/bin/ksmg-control --get-settings EventLogger -n -f /tmp/settings.xml - Make sure that the settings in the /tmp/settings.xml file have the following values; make changes if necessary:
<siemSettings><enabled>1</enabled><facility>Local1</facility> - Apply settings with the following command:
sudo /opt/kaspersky/ksmg/bin/ksmg-control --set-settings EventLogger -n -f /tmp/settings.xml - To send events via UDP, make the following changes to the /etc/rsyslog.conf configuration file:
$WorkDirectory /var/lib/rsyslog$ActionQueueFileName ForwardToSIEM$ActionQueueMaxDiskSpace 1g$ActionQueueSaveOnShutdown on$ActionQueueType LinkedList$ActionResumeRetryCount -1local1.* @<<IP address of the KUMA collector>:<port of the collector>>If you want to send events over TCP, the last line should be as follows:
local1.* @@<<IP address of the KUMA collector>:<port of the collector>> - Save your changes.
- Restart the rsyslog service with the following command:
sudo systemctl restart rsyslog.service
Configuring the receipt of KICS for Networks events
You can configure the receipt of events from Kaspersky Industrial CyberSecurity for Networks (KICS for Networks) 4.2 in KUMA.
Configuring event receiving consists of the following steps:
- Creating a KICS for Networks connector for sending events to KUMA.
- Configuring export of KICS for Networks events to KUMA.
- Creating and installing a KUMA collector to receive KICS for Networks events.
- Verifying receipt of KICS for Networks events in the KUMA collector.
You can verify that KICS for Networks event export is correctly configured in the Searching for related events section of the KUMA Console.
Creating a KICS for Networks connector for sending events to KUMA
To create a connector for sending events in the web interface of KICS for Networks:
- Log in to the KICS for Networks web interface using an administrator account.
- Go to the Settings → Connectors section.
- Click the Add connector button.
- Specify the following settings:
- In the Connector type drop-down list, select SIEM.
- In the Connector name field, specify a name for the connector.
- In the Server address field, enter the IP address of the KICS for Networks Server.
- In the Connector deployment node drop-down list, select the node on which you are installing the connector.
You can specify any name.
- In the User name field, specify the user name for KUMA to use for connecting to the application through the connector. You must specify the name of one of the KICS for Networks users.
- In the SIEM server address field, enter the IP address of the KUMA collector server.
- In the Port number field, enter the port number of the KUMA collector.
- In the Transport protocol drop-down list, select TCP or UDP.
- Select the Allow sending audit entries check box.
- Select the Allow sending application entries check box.
- Click the Save button.
The connector is created. It is displayed in the table of KICS for Networks connectors with the Running status.
The KICS for Networks connector for sending events to KUMA is ready for use.
Page topConfiguring export of KICS for Networks events to KUMA
To configure the sending of security events from KICS for Networks to KUMA:
- Log in to the KICS for Networks web interface using an administrator account.
- Go to the Settings → Event types section.
- Select the check boxes for the types of events that you want to send to KUMA.
- Click Select connectors.
- This opens a window; in that window, select the connector that you created for sending events to KUMA.
- Click OK.
Events of selected types will be sent to KUMA. In the Event types table, such events are marked with a check box in the column with the connector name.
Page topCreating a KUMA collector to receive KICS for Networks events
After configuring the event export settings, you must create a collector for KICS for Networks events in the KUMA Console.
For details on creating a KUMA collector, refer to Creating a collector.
When creating a collector in the KUMA Console, you must:
- At the Transport step, select the transport protocol type matching the type you selected when you created the connector in KICS for Networks at step 4i (TCP or UDP) and the port number matching the port number you specified at step 4h.
- At the Event parsing step, select the [OOTB] KICS4Net v3.х normalizer.
- At the Routing step, make sure that the following destinations are added to the collector resource set:
- storage—used to transmit data to the storage.
- correlator—used to transmit data to the correlator.
If destinations have not been added to the collector, you must create them.
- At the last step of the wizard, a command is displayed in the lower part of the window, which you can use to install the service on the server that you want to receive events. Copy this command and use it when installing the second part of the collector.
Configuring receipt of PT NAD events
You can configure the receipt of PT NAD events in the KUMA SIEM system.
Configuring event receiving consists of the following steps:
- Configuring export of PT NAD events to KUMA.
- Creating a KUMA collector for receiving PT NAD events.
To receive PT NAD events using Syslog, in the Collector Installation Wizard, at the Event parsing step, select the [OOTB] PT NAD json normalizer.
- Installing a KUMA collector for receiving PT NAD events.
- Verifying receipt of PT NAD events in the KUMA collector.
You can verify that the PT NAD event source server is correctly configured in the Searching for related events section of the KUMA Console.
Configuring export of PT NAD events to KUMA
Configuring the export of events from PT NAD 11 to KUMA over Syslog proceeds in stages:
- Configuring the ptdpi-worker@notifier module.
- Configuring the sending of syslog messages with information about activities, attacks and indicators of compromise.
Configuring the ptdpi-worker@notifier module.
To enable the sending of information about detected information security threats, you must configure the ptdpi-worker@notifier module.
In a multi-server configuration, these instructions must be followed on the primary server.
To configure the ptdpi-worker@notifier module:
- Open the /opt/ptsecurity/etc/ptdpi.settings.yaml file:
sudo nano /opt/ptsecurity/etc/ptdpi.settings.yaml - In the General settings group of settings, uncomment the 'workers' setting and add 'notifier' to its list of values.
For example:
workers: ad alert dns es hosts notifier - To the end of the file, append a line of the form: notifier.yaml.nad_web_url: <URL of the PT NAD web interface>
For example:
notifier.yaml.nad_web_url: https://ptnad.example.comThe ptdpi-worker@notifier module uses the specified URL to generate links to session and activity cards when sending messages.
- Restart the sensor:
sudo ptdpictl restart-all
The ptdpi-worker@notifier module is configured.
Configuring the sending of syslog messages with information about activities, attacks and indicators of compromise
The settings listed in the following instructions may not be present in the configuration file. If a setting is missing, you must add it to the file.
In a multi-server PT NAD configuration, edit the settings on the primary server.
To configure the sending of syslog messages with information about activities, attacks and indicators of compromise:
- Open the /opt/ptsecurity/etc/ptdpi.settings.yaml file:
sudo nano /opt/ptsecurity/etc/ptdpi.settings.yaml - By default, PT NAD sends activity information in Russian. To receive information in English, change the value of the notifier.yaml.syslog_notifier.locale setting to "en".
For example:
notifier.yaml.syslog_notifier.locale: en - In the notifier.yaml.syslog_notifier.addresses setting, add a section with settings for sending events to KUMA.
The <Connection name> setting can only contain Latin letters, numerals, and the underscore character.
For the 'address' setting, specify the IP address of the KUMA collector.
Other settings can be omitted, in which case the default values are used.
notifier.yaml.syslog_notifier.addresses:<Connection name>:address: <For sending to a remote server, specify protocol: UDP (default) or TCP, address and port; for local connection, specify Unix domain socket>doc_types: [<Comma-separated message types ('alert' for information about attacks, 'detection' for activities, and 'reputation' for information about indicators of compromise). By default, all types of messages are sent>]facility: <Numeric value of the subject category>ident: <software tag><Connection name>:...The following is a sample configuration of sending syslog messages with information about activities, attacks, and indicators of compromise to two remote servers via TCP and UDP without writing to the local log:
notifier.yaml.syslog_notifier.addresses:remote1:address: tcp://198.51.100.1:1514remote2:address: udp://198.51.100.2:2514 - Save your changes in the /opt/ptsecurity/etc/ptdpi.settings.yaml.
- Restart the ptdpi-worker@notifier module:
sudo ptdpictl restart-worker notifier
The sending of events to KUMA via Syslog is configured.
Page topConfiguring receipt of events using the MariaDB Audit Plugin
KUMA allows auditing events using the MariaDB Audit Plugin. The plugin supports MySQL 5.7 and MariaDB. The audit plugin does not support MySQL 8. Detailed information about the plugin is available on the official MariaDB website.
We recommend using MariaDB Audit Plugin version 1.2 or later.
Configuring event receiving consists of the following steps:
- Configuring the MariaDB Audit Plugin to send MySQL events and configuring the Syslog server to send events.
- Configuring the MariaDB Audit Plugin to send MariaDB events and configuring the Syslog server to send events.
- Creating a KUMA Collector for MySQL 5.7 and MariaDB Events.
To receive MySQL 5.7 and MariaDB events using the MariaDB Audit Plugin, in the KUMA Collector Installation Wizard, at the Event parsing step, in the Normalizer field, select [OOTB] MariaDB Audit Plugin syslog.
- Installing a collector in the KUMA network infrastructure.
- Verifying receipt of MySQL and MariaDB events by the KUMA collector.
To verify that the MySQL and MariaDB event source server is configured correctly, you can search for related events.
Configuring the MariaDB Audit Plugin to send MySQL events
The MariaDB Audit Plugin is supported for MySQL 5.7 versions up to 5.7.30 and is bundled with MariaDB.
To configure MySQL 5.7 event reporting using the MariaDB Audit Plugin:
- Download the MariaDB distribution kit and extract it.
You can download the MariaDB distribution kit from the official MariaDB website. The operating system of the MariaDB distribution must be the same as the operating system on which MySQL 5.7 is running.
- Connect to MySQL 5.7 using an account with administrator rights by running the following command:
mysql -u<username>-p - To get the directory where the MySQL 5.7 plugins are located, on the MySQL 5.7 command line, run the following command:
SHOW GLOBAL VARIABLES LIKE 'plugin_dir' - In the directory obtained at step 3, copy the MariaDB Audit Plugin from
<directory to which the distribution kit was extracted>/mariadb-server-<version>/lib/plugins/server_audit.so. - On the operating system command line, run the following command:
chmod 755<directory to which the distribution kit was extracted>server_audit.soFor example:
chmod 755 /usr/lib64/mysql/plugin/server_audit.so - On the MySQL 5.7 command line, run the following command:
install plugin server_audit soname 'server_audit.so' - Create a backup copy of the /etc/mysql/mysql.conf.d/mysqld.cnf configuration file.
- In the configuration file /etc/mysql/mysql.conf.d/mysqld.cnf, in the
[mysqld]section, add the following lines:server_audit_logging=1server_audit_events=connect,table,query_ddl,query_dml,query_dclserver_audit_output_type=SYSLOGserver_audit_syslog_facility=LOG_SYSLOGIf you want to disable event export for certain audit event groups, remove some of the values from the
server_audit_eventssetting. Descriptions of settings are available on the MariaDB Audit Plugin vendor's website. - Save changes to the configuration file.
- Restart the MariaDB service by running one of the following commands:
systemctl restart mysqldfor a system with systemd initialization.service mysqld restartfor a system with init initialization.
MariaDB Audit Plugin for MySQL 5.7 is configured. If necessary, you can run the following commands on the MySQL 5.7 command line:
show pluginsto check the list of current plugins.SHOW GLOBAL VARIABLES LIKE 'server_audit%'to check the current audit settings.
Configuring the MariaDB Audit Plugin to send MariaDB Events
The MariaDB Audit Plugin is included in the MariaDB distribution kit starting with versions 5.5.37 and 10.0.10.
To configure MariaDB event export using the MariaDB Audit Plugin:
- Connect to MariaDB using an account with administrator rights by running the following command:
mysql -u<username>-p - To check if the plugin is present in the directory where operating system plugins are located, run the following command on the MariaDB command line:
SHOW GLOBAL VARIABLES LIKE 'plugin_dir' - On the operating system command line, run the following command:
ll<directory obtained by the previous command>| grep server_audit.soIf the command output is empty and the plugin is not present in the directory, you can either copy the MariaDB Audit Plugin to that directory or use a newer version of MariaDB.
- On the MariaDB command line, run the following command:
install plugin server_audit soname 'server_audit.so' - Create a backup copy of the /etc/mysql/my.cnf configuration file.
- In the /etc/mysql/my.cnf configuration file, in the
[mysqld]section, add the following lines:server_audit_logging=1server_audit_events=connect,table,query_ddl,query_dml,query_dclserver_audit_output_type=SYSLOGserver_audit_syslog_facility=LOG_SYSLOGIf you want to disable event export for certain audit event groups, remove some of the values from the
server_audit_eventssetting. Descriptions of settings are available on the MariaDB Audit Plugin vendor's website. - Save changes to the configuration file.
- Restart the MariaDB service by running one of the following commands:
systemctl restart mariadbfor a system with systemd initialization.service mariadb restartfor a system with init initialization.
MariaDB Audit Plugin for MariaDB is configured. If necessary, you can run the following commands on the MariaDB command line:
show pluginsto check the list of current plug-ins.SHOW GLOBAL VARIABLES LIKE 'server_audit%'to check the current audit settings.
Configuring a Syslog server to send events
The rsyslog service is used to transmit events from the server to the collector.
To configure the sending of events from the server where MySQL or MariaDB is installed to the collector:
- Before making any changes, create a backup copy of the /etc/rsyslog.conf configuration file.
- To send events via UDP, add the following line to the /etc/rsyslog.conf configuration file:
*.* @<IP address of the KUMA collector>:<port of the KUMA collector>For example:
*.* @192.168.1.5:1514If you want to send events over TCP, the line should be as follows:
*.* @@192.168.1.5:2514Save changes to the /etc/rsyslog.conf configuration file.
- Restart the rsyslog service by executing the following command:
sudo systemctl restart rsyslog.service
Configuring receipt of Apache Cassandra events
KUMA allows receiving information about Apache Cassandra events.
Configuring event receiving consists of the following steps:
- Configuring Apache Cassandra event logging in KUMA.
- Creating a KUMA collector for Apache Cassandra events.
To receive Apache Cassandra events, in the KUMA Collector Installation Wizard, at the Transport step, select a file type connector; at the Event parsing step, in the Normalizer field, select [OOTB] Apache Cassandra file.
- Installing a collector in the KUMA network infrastructure.
- Verifying receipt of Apache Cassandra events in the KUMA collector.
To verify that the Apache Cassandra event source server is configured correctly, you can search for related events.
Configuring Apache Cassandra event logging in KUMA
To configuring Apache Cassandra event logging in KUMA:
- Make sure that the server where Apache Cassandra is installed has 5 GB of free disk space.
- Connect to the Apache Cassandra server using an account with administrator rights.
- Before making changes, create backup copies of the following configuration files:
- /etc/cassandra/cassandra.yaml
- /etc/cassandra/logback.xml
- Make sure that the settings in the /etc/cassandra/cassandra.yaml configuration file have the following values; make changes if necessary:
- in the
audit_logging_optionssection, set theenabledsetting totrue. - In the
loggersection, set theclass_nameparameter toFileAuditLogger.
- in the
- Add the following lines to the /etc/cassandra/logback.xml configuration file:
<!-- Audit Logging (FileAuditLogger) rolling file appender to audit.log --><appender name="AUDIT" class="ch.qos.logback.core.rolling.RollingFileAppender"><file>${cassandra.logdir}/audit/audit.log</file><rollingPolicy class="ch.qos.logback.core.rolling.SizeAndTimeBasedRollingPolicy"><!-- rollover daily --><fileNamePattern>${cassandra.logdir}/audit/audit.log.%d{yyyy-MM-dd}.%i.zip</fileNamePattern><!-- each file should be at most 50MB, keep 30 days worth of history, but at most 5GB --><maxFileSize>50MB</maxFileSize><maxHistory>30</maxHistory><totalSizeCap>5GB</totalSizeCap></rollingPolicy><encoder><pattern>%-5level [%thread] %date{ISO8601} %F:%L - %replace(%msg){'\n', ' '}%n</pattern></encoder></appender><!-- Audit Logging additivity to redirect audt logging events to audit/audit.log --><logger name="org.apache.cassandra.audit" additivity="false" level="INFO"><appender-ref ref="AUDIT"/></logger> - Save changes to the configuration file.
- Restart the Apache Cassandra service using the following commands:
sudo systemctl stop cassandra.servicesudo systemctl start cassandra.service
- After restarting, check the status of Apache Cassandra using the following command:
sudo systemctl status cassandra.serviceMake sure that the command output contains the following sequence of characters:
Active: active (running)
Apache Cassandra event export is configured. Events are located in the /var/log/cassandra/audit/ directory, in the audit.log file (${cassandra.logdir}/audit/audit.log).
Page topConfiguring receipt of FreeIPA events
You can configure the receipt of FreeIPA events in KUMA via the Syslog protocol.
Configuring event receiving consists of the following steps:
- Configuring export of FreeIPA events to KUMA.
- Creating a KUMA collector for receiving FreeIPA events.
To receive FreeIPA events, in the KUMA Collector Setup Wizard, at the Event parsing step, in the Normalizer field, select [OOTB] FreeIPA.
- Installing the KUMA collector in the network infrastructure.
- Verifying receipt of FreeIPA events by KUMA.
To verify that the FreeIPA event source server is configured correctly, you can search for related events.
Configuring export of FreeIPA events to KUMA
To configure the export of FreeIPA events to KUMA via the Syslog protocol in JSON format:
- Connect to the FreeIPA server via SSH using an account with administrator rights.
- In the /etc/rsyslog.d/ directory, create a file named freeipa-to-siem.conf.
- Add the following lines to the /etc/rsyslog.d/freeipa-to-siem.conf configuration file:
template(name="ls_json" type="list" option.json="on"){ constant(value="{")constant(value="\"@timestamp\":\"") property(name="timegenerated" dateFormat="rfc3339")constant(value="\",\"@version\":\"1")constant(value="\",\"message\":\"") property(name="msg")constant(value="\",\"host\":\"") property(name="fromhost")constant(value="\",\"host_ip\":\"") property(name="fromhost-ip")constant(value="\",\"logsource\":\"") property(name="fromhost")constant(value="\",\"severity_label\":\"") property(name="syslogseverity-text")constant(value="\",\"severity\":\"") property(name="syslogseverity")constant(value="\",\"facility_label\":\"") property(name="syslogfacility-text")constant(value="\",\"facility\":\"") property(name="syslogfacility")constant(value="\",\"program\":\"") property(name="programname")constant(value="\",\"pid\":\"") property(name="procid")constant(value="\",\"syslogtag\":\"") property(name="syslogtag")constant(value="\"}\n")}*.* @<IP address of the KUMA collector>:<port of the KUMA collector KUMA>;ls_jsonYou can fill in the last line in accordance with the selected protocol:
*.* @<192.168.1.10>:<1514>;ls_jsonfor sending events over UDP*.* @@<192.168.2.11>:<2514>;ls_jsonfor sending events over TCP - Add the following lines to the /etc/rsyslog.conf configuration file:
$IncludeConfig /etc/freeipa-to-siem.conf$RepeatedMsgReduction off - Save changes to the configuration file.
- Restart the rsyslog service by executing the following command:
sudo systemctl restart rsyslog.service
Configuring receipt of VipNet TIAS events
You can configure the receipt of ViPNet TIAS events in KUMA via the Syslog protocol.
Configuring event receiving consists of the following steps:
- Configuring export of ViPNet TIAS events to KUMA.
- Creating a KUMA collector for receiving ViPNet TIAS events.
To receive ViPNet TIAS events using Syslog, in the Collector Installation Wizard, at the Event parsing step, select the [OOTB] Syslog-CEF normalizer.
- Installing a KUMA collector for receiving ViPNet TIAS events.
- Verifying receipt of ViPNet TIAS events in KUMA.
You can verify that ViPNet TIAS event source server is correctly configured in the Searching for related events section of the KUMA Console.
Configuring export of ViPNet TIAS events to KUMA
To configure the export of ViPNet TIAS events to KUMA via the syslog protocol:
- Connect to the ViPNet TIAS web interface under a user account with administrator rights.
- Go to the Management – Integrations section.
- On the Integration page, go to the Syslog tab.
- In the toolbar of the list of receiving servers, click New server.
- This opens the new server card; in that card:
- In the Server address field, enter the IP address or domain name of the KUMA collector.
For example, 10.1.2.3 or syslog.siem.ru
- In the Port field, specify the inbound port of the KUMA collector. The default port number is 514.
- In the Protocol list, select the transport layer protocol that the KUMA collector is listening on. UDP is selected by default.
- In the Organization list, use the check boxes to select the organizations of the ViPNet TIAS infrastructure.
Messages are sent only for incidents detected based on events received from sensors of selected organizations of the infrastructure.
- In the Status list, use check boxes to select incident statuses.
Messages are sent only when selected statuses are assigned to incidents.
- In the Severity level list, use check boxes to select the severity levels of the incidents.
Messages are sent only about incidents with the selected severity levels. By default, only the high severity level is selected in the list.
- In the UI language list, select the language in which you want to receive information about incidents in messages. Russian is selected by default.
- In the Server address field, enter the IP address or domain name of the KUMA collector.
- Click Add.
- In the toolbar of the list, set the Do not send incident information in CEF format toggle switch to enabled.
As a result, when new incidents are detected or the statuses of previously detected incidents change, depending on the statuses selected during configuration, the corresponding information is sent to the specified addresses of receiving servers via the syslog protocol in CEF format.
- Click Save changes.
Export of events to the KUMA collector is configured.
Page topConfiguring receipt of Nextcloud events
You can configure the receipt of Nextcloud 26.0.4 events in the KUMA SIEM system.
Configuring event receiving consists of the following steps:
- Configuring audit of Nextcloud events.
- Configuring a Syslog server to send events.
The rsyslog service is used to transmit events from the server to the collector.
- Creating a KUMA collector for receiving Nextcloud events.
To receive Nextcloud events, in the Collector Installation Wizard, at the Event parsing step, select the [OOTB] Nextcloud syslog normalizer, and at the Transport step select the tcp or udp connector type.
- Installing KUMA collector for receiving Nextcloud events
- Verifying receipt of Nextcloud events in the KUMA collector
You can verify that the Nextcloud event source server is correctly configured in the Searching for related events section of the KUMA Console.
Configuring audit of Nextcloud events
To configure the export of Nextcloud events to KUMA:
- On the server where Nextcloud is installed, create a backup copy of the /home/localuser/www/nextcloud/config/config.php configuration file.
- Edit the /home/localuser/www/nextcloud/config/config.php Nextcloud configuration file.
- Edit the settings as follows:
'log_type' => 'syslog','syslog_tag' => 'Nextcloud','logfile' => '','loglevel' => 0,'log.condition' => ['apps' => ['admin_audit'],], - Restart the Nextcloud service:
sudo service restart nextcloud
Export of events to the KUMA collector is configured.
Page topConfiguring a Syslog server to send Nextcloud events
To configure the sending of events from the server where Nextcloud is installed to the collector:
- In the /etc/rsyslog.d/ directory, create a Nextcloud-to-siem.conf file with the following content:
If $programname contains 'Nextcloud' then @<IP address of the collector>:<port of the collector>Example:
If $programname contains 'Nextcloud' then @192.168.1.5:1514If you want to send events via TCP, the contents of the file must be as follows:
If $programname contains 'Nextcloud' then @<IP address of the collector>:<port of the collector> - Save changes to the Nextcloud-to-siem.conf configuration file.
- Create a backup copy of the /etc/rsyslog.conf file.
- Add the following lines to the /etc/rsyslog.conf configuration file:
$IncludeConfig /etc/Nextcloud-to-siem.conf$RepeatedMsgReduction off - Save your changes.
- Restart the rsyslog service by executing the following command:
sudo systemctl restart rsyslog.service
The export of Nextcloud events to the collector is configured.
Page topConfiguring receipt of Snort events
You can configure the receipt of Snort 3 events in the KUMA SIEM system.
Configuring event receiving consists of the following steps:
- Configuring logging of Snort events.
- Creating a KUMA collector for receiving Snort events.
To receive Snort events, in the Collector Installation Wizard, at the Event parsing step, select the [OOTB] Snort 3 json file normalizer, and at the Transport step, select the file connector type.
- Installing a KUMA collector for receiving Snort events
- Verifying receipt of Snort events in the KUMA collector
You can verify that the Snort event source server is correctly configured in the Searching for related events section of the KUMA Console.
Configuring logging of Snort events
Make sure that the server running Snort has at least 500 MB of free disk space for storing a single Snort event log.
When the log reaches 500 MB, Snort automatically creates a new file with a name that includes the current time in unixtime format.
We recommend monitoring disk space usage.
To configure Snort event logging:
- Connect to the server where Snort is installed using an account with administrative privileges.
- Edit the Snort configuration file. To do so, run the following command on the command line:
sudo vi /usr/local/etc/snort/snort.lua - In the configuration file, edit the alert_json block:
alert_json ={file = true,limit = 500,fields = 'seconds action class b64_data dir dst_addr dst_ap dst_port eth_dst eth_len \eth_src eth_type gid icmp_code icmp_id icmp_seq icmp_type iface ip_id ip_len msg mpls \pkt_gen pkt_len pkt_num priority proto rev rule service sid src_addr src_ap src_port \target tcp_ack tcp_flags tcp_len tcp_seq tcp_win tos ttl udp_len vlan timestamp',} - To complete the configuration, run the following command:
sudo /usr/local/bin/snort -c /usr/local/etc/snort/snort.lua -s 65535 -k none -l /var/log/snort -i<name of the interface that Snort is listening on>-m 0x1b
As a result, Snort events are logged to /var/log/snort/alert_json.txt.
Page topConfiguring receipt of Suricata events
You can configure the receipt of Suricata 7.0.1 events in the KUMA SIEM system.
Configuring event receiving consists of the following steps:
- Configuring export of Suricata events to KUMA
- Creating a KUMA collector for receiving Suricata events.
To receive Suricata events, in the Collector Installation Wizard, at the Event parsing step, select the [OOTB] Suricata json file normalizer, and at the Transport step, select the file connector type.
- Installing KUMA collector for receiving Suricata events
- Verifying receipt of Suricata events in the KUMA collector
You can verify that the Suricata event source server is correctly configured in the Searching for related events section of the KUMA Console.
Configuring audit of Suricata events.
To configure Suricata event logging:
- Connect via SSH to the server that has administrative accounts.
- Create a backup copy of the /etc/suricata/suricata.yaml file.
- Set the following values in the eve-log section of the /etc/suricata/suricata.yaml configuration file:
- eve-log:enabled: yesfiletype: regular #regular|syslog|unix_dgram|unix_stream|redisfilename: eve.json - Save your changes to the /etc/suricata/suricata.yaml configuration file.
As a result, Suricata events are logged to the /usr/local/var/log/suricata/eve.json file.
Suricata does not support limiting the size of the eve.json event file. If necessary, you can manage the log size by using rotation. For example, to configure hourly log rotation, add the following lines to the configuration file:
outputs:
- eve-log:
filename: eve-%Y-%m-%d-%H:%M.json
rotate-interval: hour
Configuring receipt of FreeRADIUS events
You can configure the receipt of FreeRADIUS 3.0.26 events in the KUMA SIEM system.
Configuring event receiving consists of the following steps:
- Configuring audit of FreeRADIUS events.
- Configuring a Syslog server to send FreeRADIUS events.
- Creating a KUMA collector for receiving FreeRADIUS events.
To receive FreeRADIUS events, in the Collector Installation Wizard, at the Event parsing step, select the [OOTB] FreeRADIUS syslog normalizer, and at the Transport step, select the tcp or udp connector type.
- Installing KUMA collector for receiving FreeRADIUS events.
- Verifying receipt of FreeRADIUS events in the KUMA collector.
You can verify that the FreeRADIUS event source server is correctly configured in the Searching for related events section of the KUMA Console.
Configuring audit of FreeRADIUS events
To configure event audit in the FreeRADIUS system:
- Connect to the server where the FreeRADIUS system is installed using an account with administrative privileges.
- Create a backup copy of the FreeRADIUS configuration file:
sudo cp /etc/freeradius/3.0/radiusd.conf /etc/freeradius /3.0/radiusd.conf.bak - Open the FreeRADIUS configuration file for editing:
sudo nano /etc/freeradius/3.0/radiusd.conf - In the 'log' section, edit the settings as follows:
destination = syslogsyslog_facility = daemonstripped_names = noauth = yesauth_badpass = yesauth_goodpass = yes - Save the configuration file.
FreeRADIUS event audit is configured.
Page topConfiguring a Syslog server to send FreeRADIUS events
The rsyslog service is used to transmit events from the FreeRADIUS server to the KUMA collector.
To configure the sending of events from the server where FreeRADIUS is installed to the collector:
- In the /etc/rsyslog.d/ directory, create the FreeRADIUS-to-siem.conf file and add the following line to it:
If $programname contains 'radiusd' then @<IP address of the collector>:<port of the collector>If you want to send events via TCP, the contents of the file must be as follows:
If $programname contains 'radiusd' then @<IP address of the collector>:<port of the collector> - Create a backup copy of the /etc/rsyslog.conf file.
- Add the following lines to the /etc/rsyslog.conf configuration file:
$IncludeConfig /etc/FreeRADIUS-to-siem.conf$RepeatedMsgReduction off - Save your changes.
- Restart the rsyslog service:
sudo systemctl restart rsyslog.service
The export of events from the FreeRADIUS server to the KUMA collector is configured.
Page topConfiguring receipt of VMware vCenter events
You can configure the receipt of VMware vCenter events in the KUMA SIEM system.
Configuring event receiving consists of the following steps:
- Configuring the connection to VMware vCenter.
- Creating a KUMA collector for receiving VMware vCenter events.
To receive VMware vCenter events, in the collector installation wizard, at the Transport step, select the vmware connector type. Specify the required settings:
- The URL at which the VMware API is available, for example, https://vmware-server.com:6440.
- VMware credentials — a secret that specifies the username and password for connecting to the VMware API.
At the Event parsing step, select the [OOTB] VMware vCenter API normalizer.
- Installing a KUMA collector for receiving VMware vCenter events.
- Verifying receipt of VMware vCenter events in the KUMA collector.
You can verify that the VMware vCenter event source server is correctly configured in the Searching for related events section of the KUMA Console.
Configuring the connection to VMware vCenter
To configure a connection to VMware vCenter to receive events:
- Connect to the VMware vCenter web interface under a user account that has administrative privileges.
- Go to the Security&Users section and select Users.
- Create a user account.
- Go to the Roles section and assign the "Read-only: See details of objects role, but not make changes" role to the created account.
You will use the credentials of this user account in the secret of the collector.
For details about creating user accounts, refer to the VMware vCenter documentation.
The connection to VMware vCenter for receiving events is configured.
Page topConfiguring receipt of zVirt events
You can configure the receipt of zVirt 3.1 events in the KUMA SIEM system.
Configuring event receiving consists of the following steps:
- Configuring export of zVirt events to KUMA.
- Creating a KUMA collector for receiving zVirt events.
To receive zVirt events, in the Collector Installation Wizard, at the Event parsing step, select the [OOTB] OrionSoft zVirt syslog normalizer, and at the Transport step, select the tcp or udp connector type.
- Installing KUMA collector for receiving zVirt events
- Verifying receipt of zVirt events in the KUMA collector
You can verify that the zVirt event source server is correctly configured in the Searching for related events section of the KUMA Console.
Configuring export of zVirt events
ZVirt can send events to external systems in Hosted Engine installation mode.
To configure the export of zVirt events to KUMA:
- In the zVirt web interface, under Resources, select Virtual machines.
- Select the machine that is running the HostedEngine virtual machine and click Edit.
- In the Edit virtual machine window, go to the Logging section.
- Select the Determine Syslog server address check box.
- In the text box, enter the collector information in the following format:
<IP address or FQDN of the KUMA collector>:<port of the KUMA collector>. - If you want to use TCP instead of UDP for sending logs, select the Use TCP connection check box.
Event export is configured.
Page topConfiguring receipt of Zeek IDS events
You can configure the receipt of Zeek IDS 1.8 events in the KUMA SIEM system.
Configuring event receiving consists of the following steps:
- Conversion of the Zeek IDS event log format.
The KUMA normalizer supports Zeek IDS logs in the JSON format. To send events to the KUMA normalizer, log files must be converted to the JSON format.
- Creating a KUMA collector for receiving Zeek IDS events.
To receive Zeek IDS events, in the Collector Installation Wizard, at the Event parsing step, select the [OOTB] ZEEK IDS json file normalizer, and at the Transport step, select the file connector type.
- Installing KUMA collector for receiving Zeek IDS events
- Verifying receipt of Zeek IDS events in the KUMA collector
You can verify that the Zeek IDS event source server is correctly configured in the Searching for related events section of the KUMA Console.
Conversion of the Zeek IDS event log format
By default, Zeek IDS events are logged in files in the /opt/zeek/logs/current directory.
The "[OOTB] ZEEK IDS json file" normalizer supports Zeek IDS logs in the JSON format. To send events to the KUMA normalizer, log files must be converted to the JSON format.
This procedure must be repeated every time before receiving Zeek IDS events.
To convert the Zeek IDS event log format:
- Connect to the server where Zeek IDS is installed using an account with administrative privileges.
- Create the directory where JSON event logs must be stored:
sudo mkdir /opt/zeek/logs/zeek-json - Change to this directory:
sudo cd /opt/zeek/logs/zeek-json - Run the command that uses the jq utility to convert the original event log format to the target format:
jq . -c<path to the log file to be converted to a different format>>><new file name>.logExample:
jq . -c /opt/zeek/logs/current/conn.log >> conn.log
As a result of running the command, a new file is created in the /opt/zeek/logs/zeek-json directory if this file did not exist before. If the file was already present in the current directory, new information is appended to the end of the file.
Page topConfiguring Windows event reception using Kaspersky Endpoint Security for Windows
In KES for Windows, starting from version 12.6, events can be sent from Windows logs to a KUMA collector. In this way, KUMA can get events from Windows logs (a limited set of EventIDs of Microsoft products is supported) from all hosts with KES for Windows 12.6 without installing KUMA agents on such hosts. To activate the functionality, you need:
- A valid KUMA license
- KSC 14.2 or later
- KES for Windows version 12.6 or later
Configuring event receiving consists of the following steps:
- Importing the normalizer into KUMA.
In KUMA, you must configure getting updates through Kaspersky update servers.
Click Import resources and in the list of normalizers available for installation, select [OOTB] Microsoft Products via KES WIN.
- Creating a KUMA collector for receiving Windows events.
To receive Windows events, at the Transport step, select TCP or UDP and specify the port number that the collector must listen on. At the Event parsing step, select the [OOTB] Microsoft Products via KES WIN normalizer. At the Event filtering step, select the [OOTB] Microsoft Products via KES WIN - Event filter for collector filter.
- Requesting a key from KUMA Technical Support.
If your license did not include a key for activating the functionality of sending Windows logs to the KUMA collector, send the following message to Technical Support: "We have purchased a KUMA license and are using KES for Windows version 12.6. We want to activate the functionality of sending Windows logs to the KUMA collector. Please provide a key file to activate the functionality." New KUMA users do not need to make a Technical Support request because new users get 2 keys with licenses for KUMA and for activating the KES for Windows functionality.
In response to your message, you will get a key file.
- Configuration on the side of KSC and KES for Windows.
A key file that activates the functionality of sending Windows events to KUMA collectors must be imported into KSC and distributed to KES endpoints in accordance with the instructions. You must also add KUMA server addresses to the KES policy and specify network connection settings.
- Verifying receipt of Windows events in the KUMA collector
You can verify that the Windows event source server is correctly configured in the Searching for related events section of the KUMA Console.
Microsoft product events transmitted by KES for Windows are listed in the following table:
Event log
Event ID
DNS Server
150
DNS Server
770
MSExchange Management
1
Security
4781
Security
6416
Security
1100
Security
1102 / 517
Security
1104
Security
1108
Security
4610 / 514
Security
4611
Security
4614 / 518
Security
4616 / 520
Security
4622
Security
4624 / 528 / 540
Security
4625 / 529
Security
4648 / 552
Security
4649
Security
4662
Security
4663
Security
4672 / 576
Security
4696
Security
4697 / 601
Security
4698 / 602
Security
4702
Security
4704 / 608
Security
4706
Security
4713/617
Security
4715
Security
4717 / 621
Security
4719 / 612
Security
4720 / 624
Security
4722 / 626
Security
4723 / 627
Security
4724 / 628
Security
4725 / 629
Security
4726 / 630
Security
4727
Security
4728 / 632
Security
4729 / 633
Security
4732 / 636
Security
4733 / 637
Security
4738 / 642
Security
4739/643
Security
4740 / 644
Security
4741
Security
4742 / 646
Security
4756 / 660
Security
4757 / 661
Security
4765
Security
4766
Security
4767
Security
4768 / 672
Security
4769 / 673
Security
4770
Security
4771 / 675
Security
4775
Security
4776 / 680
Security
4778 / 682
Security
4780 / 684
Security
4794
Security
4798
Security
4817
Security
4876 / 4877
Security
4882
Security
4885
Security
4886
Security
4887
Security
4890
Security
4891
Security
4898
Security
4899
Security
4900
Security
4902
Security
4904
Security
4905
Security
4928
Security
4946
Security
4947
Security
4948
Security
4949
Security
4950
Security
4964
Security
5025
Security
5136
Security
5137
Security
5138
Security
5139
Security
5141
Security
5142
Security
5143
Security
5144
Security
5145
Security
5148
Security
5155
Security
5376
Security
5377
Security
5632
Security
5888
Security
5889
Security
5890
Security
676
System
1
System
104
System
1056
System
12
System
13
System
6011
System
7040
System
7045
System, Source Netlogon
5723
System, Source Netlogon
5805
Terminal-Services-RemoteConnectionManager
1149
Terminal-Services-RemoteConnectionManager
1152
Terminal-Services-RemoteConnectionManager
20523
Terminal-Services-RemoteConnectionManager
258
Terminal-Services-RemoteConnectionManager
261
Windows PowerShell
400
Windows PowerShell
500
Windows PowerShell
501
Windows PowerShell
800
Application, Source ESENT
301
Application, Source ESENT
302
Application, Source ESENT
325
Application, Source ESENT
326
Application, Source ESENT
327
Application, Source ESENT
2001
Application, Source ESENT
2003
Application, Source ESENT
2005
Application, Source ESENT
2006
Application, Source ESENT
216
Application
1000
Application
1002
Application
1 / 2
Configuring receipt of Codemaster Mirada events
You can configure the receipt of Codemaster Mirada events in the KUMA SIEM system.
Configuring event receiving consists of the following steps:
- Configuring audit of the Codemaster Mirada system.
- Creating a KUMA collector for receiving Codemaster Mirada events.
To receive Codemaster Mirada, in the Collector Installation Wizard, at the Event parsing step, select the [OOTB] Codemaster Mirada syslog normalizer, and at the Transport step, select the tcp or udp connector type.
- Installing a collector in the KUMA network infrastructure.
- Verifying receipt of Codemaster Mirada events in the KUMA collector
You can verify that the Codemaster Mirada event source server is correctly configured in the Events section of the KUMA Console.
Configuring audit of the Codemaster Mirada system
The Codemaster Mirada system can send events over the Syslog protocol.
To configure event audit in the Codemaster Mirada system:
- Connect to the Codemaster Mirada web interface under a user account that has administrative privileges.
- Go to the Settings → Syslog section.
- Enable the event transmission service using the toggle switch.
- Select the type and format of the protocol by clicking the dot-in-a-circle icon.
- In the Host field, specify the IP address of the KUMA collector.
- In the Protocol field, specify the UDP or TCP transport protocol.
- In the Port field, specify the port that the KUMA collector is listening on.
The default port is 514.
- In the Format field, specify the RFC 3164 standard.
- Click Save in the lower part of the page to save the changes.
Configuring receipt of Postfix events
You can configure the receipt of Postfix events in KUMA. Integration is only possible when sending events via syslog using the TCP protocol. The resources described in this article are available for KUMA 3.0 and newer versions.
Configuring event receiving consists of the following steps:
- Configuring Postfix to send events.
- Creating a KUMA collector for receiving Postfix events.
- Verifying receipt of Postfix events in the KUMA collector
You can verify that the Postfix event source server is correctly configured in the Searching for related events section of the KUMA Console.
The Postfix system generates events in two formats:
- Multi-line events containing information about messages (with a unique ID). These events have the following form:
<syslog PRI> time host process_name: ID: information from base event 1
<syslog PRI> time host process_name: id: info from base event 2
- Single-line events containing information about errors (without an ID). These events have the following form:
<syslog PRI> time host process_name: severity: basic information for parsing
A set of KUMA resources is used to process Postfix events; this set of resources must be applied when creating a collector:
- Normalizer
- Aggregation rule
- Filters for destinations
The collector aggregates multi-line base events based on event ID, normalizes them, and sends the aggregated event to the storage and the correlator.
The aggregated event has the following form:
Service information from the aggregation rule: ID: information from base event 1, information from base event 2, information from base event n
After aggregation, the received event is sent to the same collector where the aggregated event is normalized.
Processing algorithm for Postfix events
The following algorithm was implemented to process Postfix events:
- Initial normalization
At this stage, initial normalization is performed for base events received via syslog that begin with the "<" character. The events are brought to a format suitable for subsequent aggregation: the first character is extracted from the event and put into the FlexString1 field, the identifier is put into the ExternalID field, and the host name is put into the DeviceHostName field. Basic normalization is performed in the main normalizer.
- Checking for aggregation
The event is examined to see if it is aggregated or not. As a result, non-aggregated events (the first character is not "{" and the ID is not empty) have an aggregation rule applied, and then aggregated events are sent for re-normalization.
- Applying the aggregation rule
At this stage, the aggregation rule is applied to the events, the base events are collated and take the following form:
Service information from the aggregation rule: ID: information from base event 1, information from base event 2, information from base event n
- After aggregation, the collated event is sent back to the same collector to subject the aggregated event to normalization.
To close the event processing loop, you must specify the same collector as the destination. In the diagram, the destination is named "Loop" to draw attention to the event processing loop. You can give an arbitrary name to your destination.
- Normalization of the aggregated event
Normalization of the aggregated event that begins with a "{" character is performed in the following extra normalizers: Aggregated events, Aggregated events. Message KV parser, Aggregated events. Message regex 1, Aggregated events. Message regex 2.
- Sending to storage and the correlator
Aggregated and normalized events are sent to storage and the correlator.
The following figure shows the flow chart of Postfix event processing.
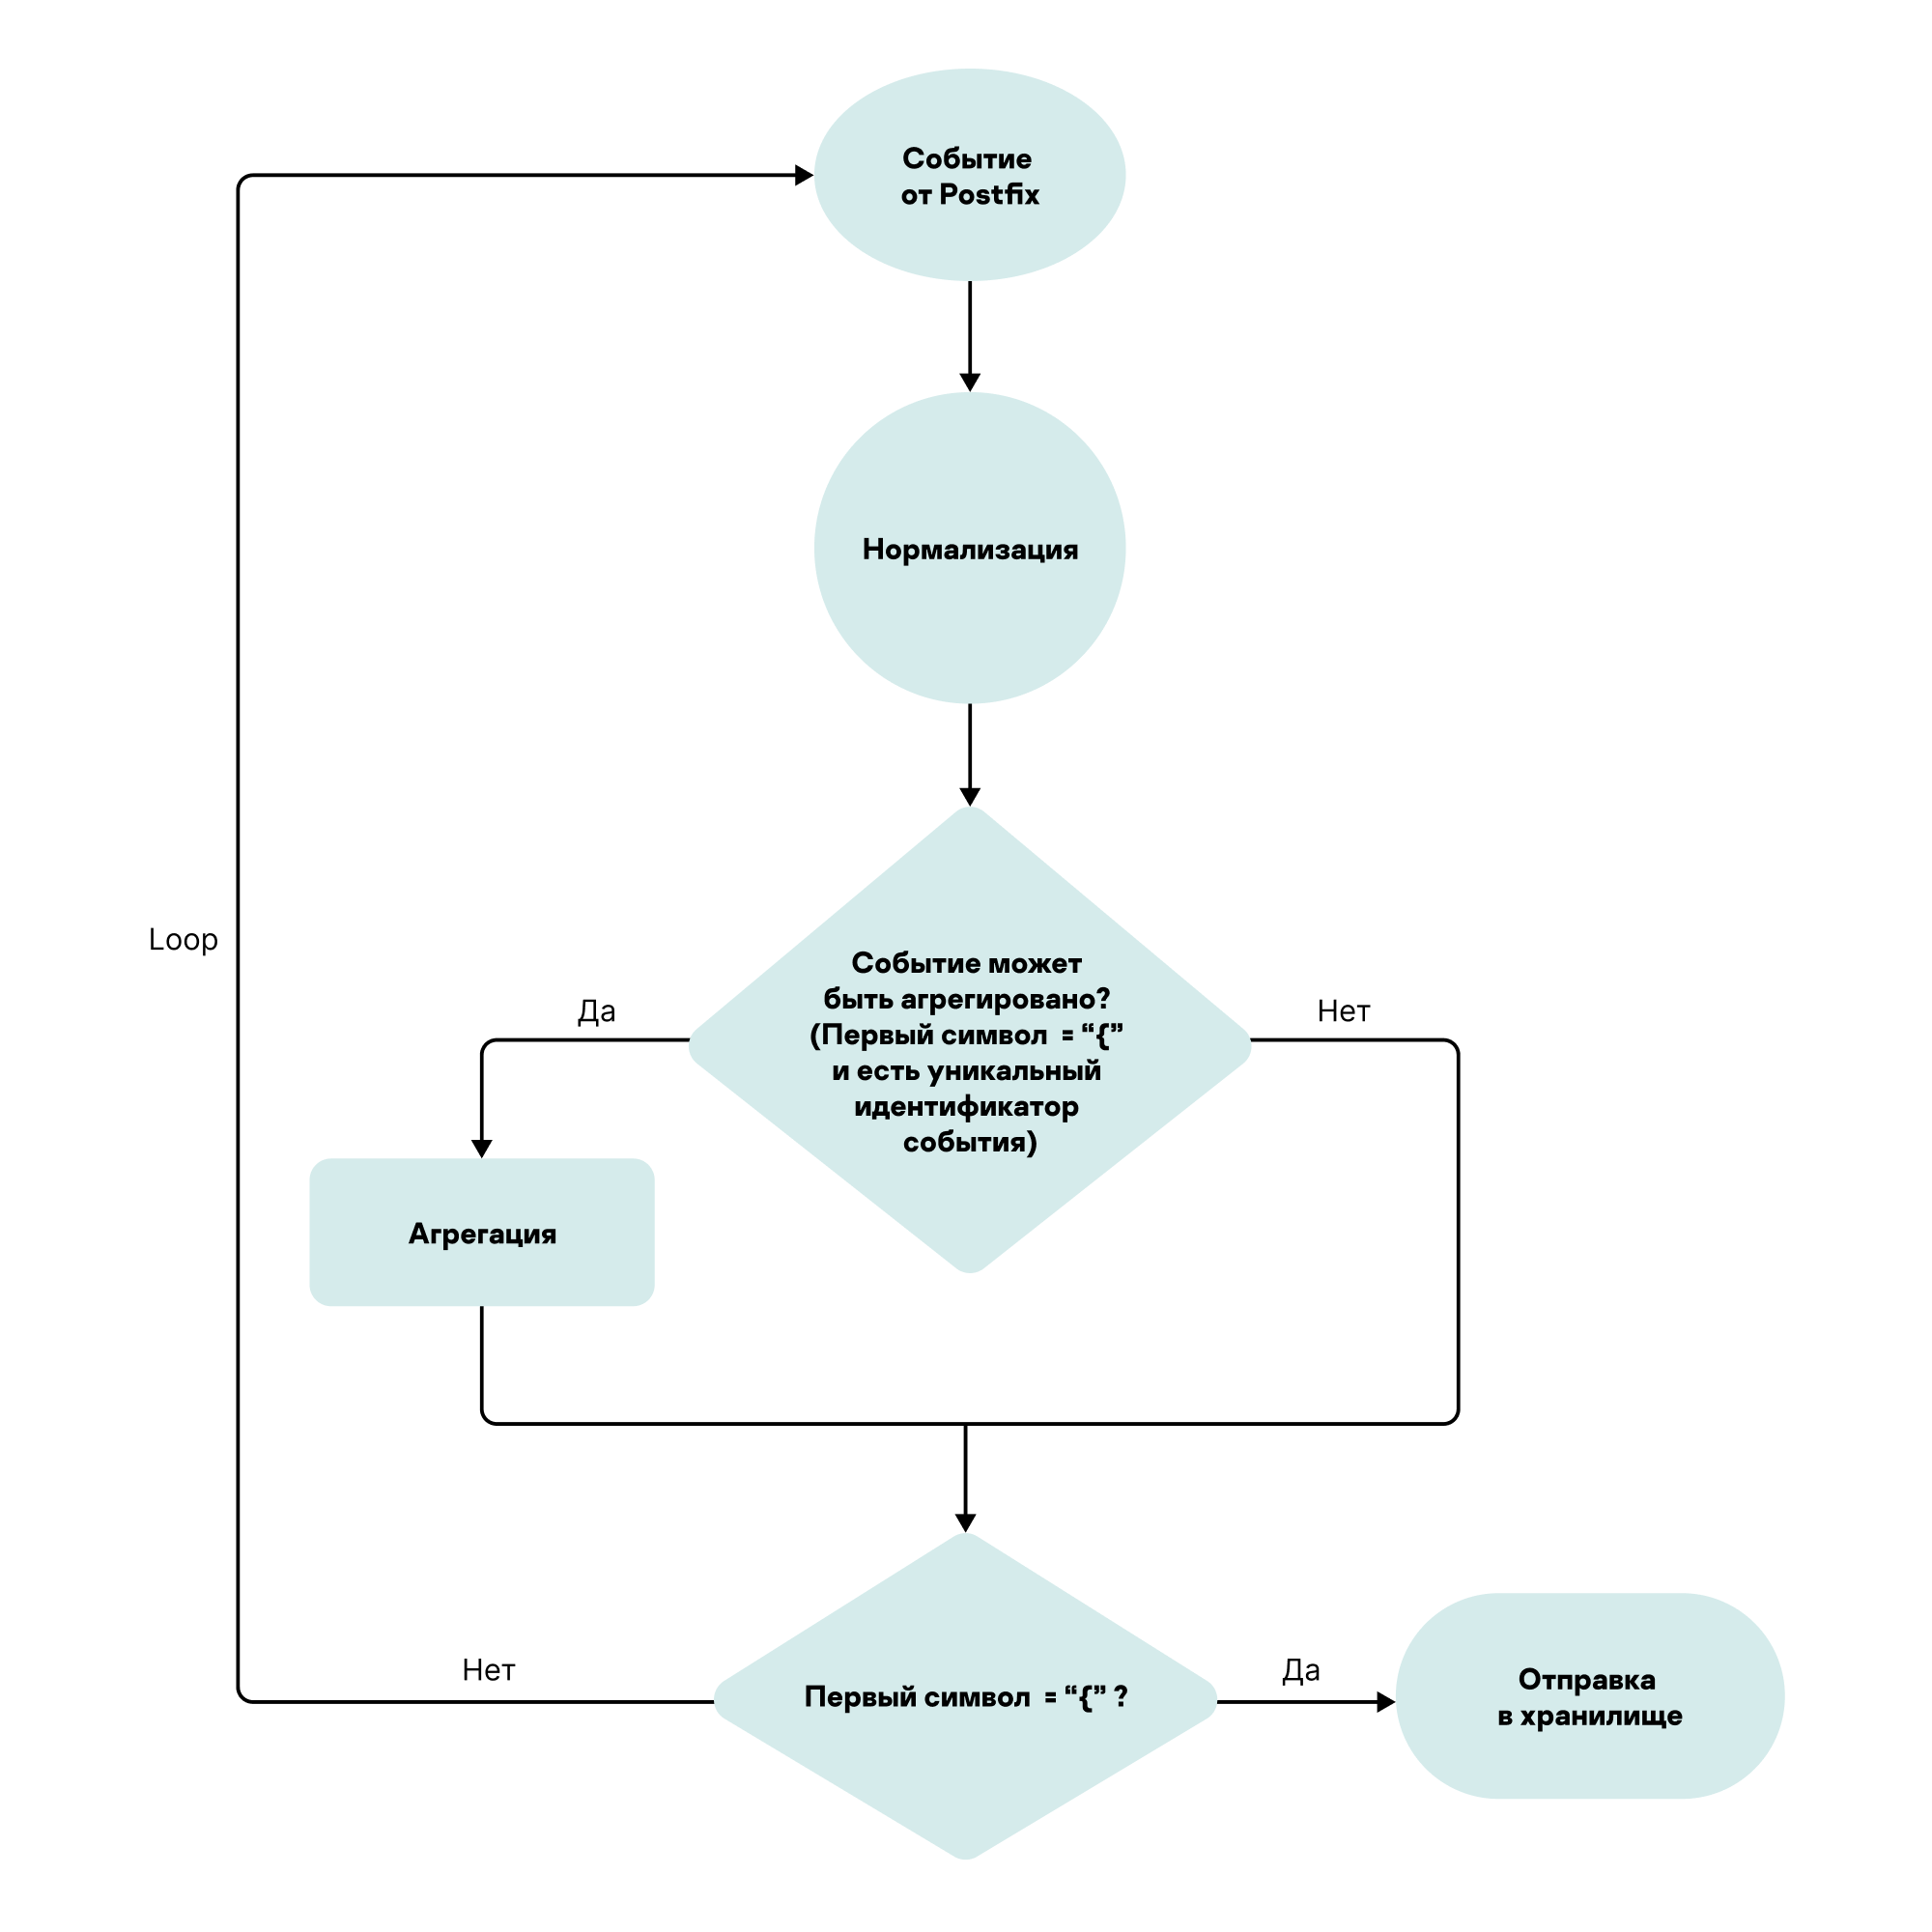
Configuring Postfix to send events
By default, audit events of the Postfix system are output to /var/log/maillog or /var/log/mail.
To send events to KUMA:
- Create a backup copy of the /etc/rsyslog.conf file.
- Open the /etc/rsyslog.conf file for editing.
- Add the following line to the end of the /etc/rsyslog.conf file:
mail.* @@<IP address of the KUMA collector>:<port of the KUMA collector> - Save the /etc/rsyslog.conf file.
- Restart the rsyslog service:
sudo systemctl restart rsyslog
Configuring a KUMA collector for receiving and processing Postfix events
To configure a KUMA collector for receiving Postfix events:
- Import the [OOTB] Postfix package from the KUMA repository. The package is available for KUMA 3.0 and newer versions.
- Create a new collector, and in the Collector Installation Wizard, configure the following:
- At the Transport step, in the Type field, select the tcp type, and in the URL field, specify the FQDN or IP address and port of the collector.
- At the Event parsing step, click Add event parsing, and in the displayed Basic event parsing window, in the Normalizer drop-down list, select the [OOTB] Postfix syslog normalizer.
- At the Event aggregation step, click Add aggregation rule, and in the displayed Event aggregation window, in the Aggregation rule drop-down list, select [OOTB] Postfix. Aggregation rule.
- At the Routing step, click Add and in the displayed Create destination window, create three destination points one by one—the same collector with the name "Loop", a storage, and a correlator.
- Create a destination named "Loop" with the following parameters.
- On the Basic settings tab, in the Type drop-down list, select the tcp transport type; in the URL field, specify the FQDN or IP address and port of the collector that you specified before at step 2.1 of these instructions.
- On the Advanced settings tab, in the Filter drop-down list, select the Postfix. Filter for event aggregation filter.
This configuration is necessary to send the aggregated event to the same collector for subsequent normalization.
- Create a correlator destination:
- On the Basic settings tab, in the Type drop-down list, select correlator and fill in the URL field.
- On the Advanced settings tab, in the Filter drop-down list, select the Postfix. Aggregated events to storage and correlator filter.
- Create a storage destination:
- On the Basic settings tab, in the Type drop-down list, select storage and fill in the URL field.
- On the Advanced settings tab, in the Filter drop-down list, select the Postfix. Aggregated events to storage and correlator filter.
This configuration is necessary to send the aggregated normalized event to storage and the correlator.
- Create a destination named "Loop" with the following parameters.
- Click the Create button.
The collector service is created with the settings specified in the KUMA Console. The command for installing the service on the server is displayed.
- Copy the collector installation command and run it on the relevant server.
The collector is configured to receive and process Postfix events.
Page topConfiguring receipt of CommuniGate Pro events
You can configure the receipt of CommuniGate Pro 6.1 events in KUMA. Integration is only possible when sending events via syslog using the TCP protocol. The resources described in this article are available for KUMA 3.0 and newer versions. Processing of SIP module events is supported (such events contain the "SIPDATA" character sequence).
Configuring event receiving consists of the following steps:
- Configuring CommuniGate Pro to send events
- Configuring the KUMA collector for receiving CommuniGate Pro events
- Verifying receipt of CommuniGate Pro events in the KUMA collector
You can verify that the CommuniGate Pro event source server is correctly configured in the Searching for related events section of the KUMA Console.
The CommuniGate Pro system generates an audit event as several separate records that look like this:
<event code> timestamp ID direction: information from base event 1
<event code> timestamp ID direction: information from base event 2
<event code> timestamp ID direction: base information n
A set of KUMA resources is used to process CommuniGate Pro events; this set of resources must be applied when creating a collector:
- Normalizer
- Aggregation rule
- Filters for destinations
The collector aggregates multi-line base events based on event ID, normalizes them, and sends the aggregated event to the storage and the correlator.
The aggregated event has the following form:
Service information from the aggregation rule: ID: information from base event 1, information from base event 2, information from base event n
After aggregation, the received event is sent to the same collector where the aggregated event is normalized.
Processing algorithm for CommuniGate Pro events
The following algorithm was implemented to process CommuniGate Pro events:
- Initial normalization
At this stage, the initial normalization of base events is performed. The first character in the base event is a numeral. The events are brought to a format suitable for subsequent aggregation: the first character is extracted from the event and put into the DeviceCustomString1 field, the identifier is put into the ExternalID field, and the host name is put into the DeviceHostName field. Basic normalization is performed in the main normalizer.
- Checking for aggregation
The event is examined to see if it is aggregated or not. As a result, non-aggregated events (the first character is a numeral) have an aggregation rule applied, and then aggregated events are sent for re-normalization. Aggregation is performed using the "[OOTB] CommuniGate Pro. Aggregation rule".
- Applying the aggregation rule
At this stage, the aggregation rule is applied to the events, the base events are collated and take the following form:
Service information from the aggregation rule: ID: information from base event 1, information from base event 2, information from base event n
After aggregation, the collated event is sent back to the same collector to subject the aggregated event to normalization.
To close the event processing loop, you must specify the same collector as the destination. In the diagram, the destination is named "Loop" to draw attention to the event processing loop. You can give an arbitrary name to your destination.
- Normalization of the aggregated event
Normalization of the aggregated event that begins with a "{" character is performed in the following extra normalizers: Aggregated events, Aggregated events - kv part.
- Sending to storage and the correlator
Aggregated and normalized events are sent to storage and the correlator.
The following figure shows the flow chart of CommuniGate Pro event processing.
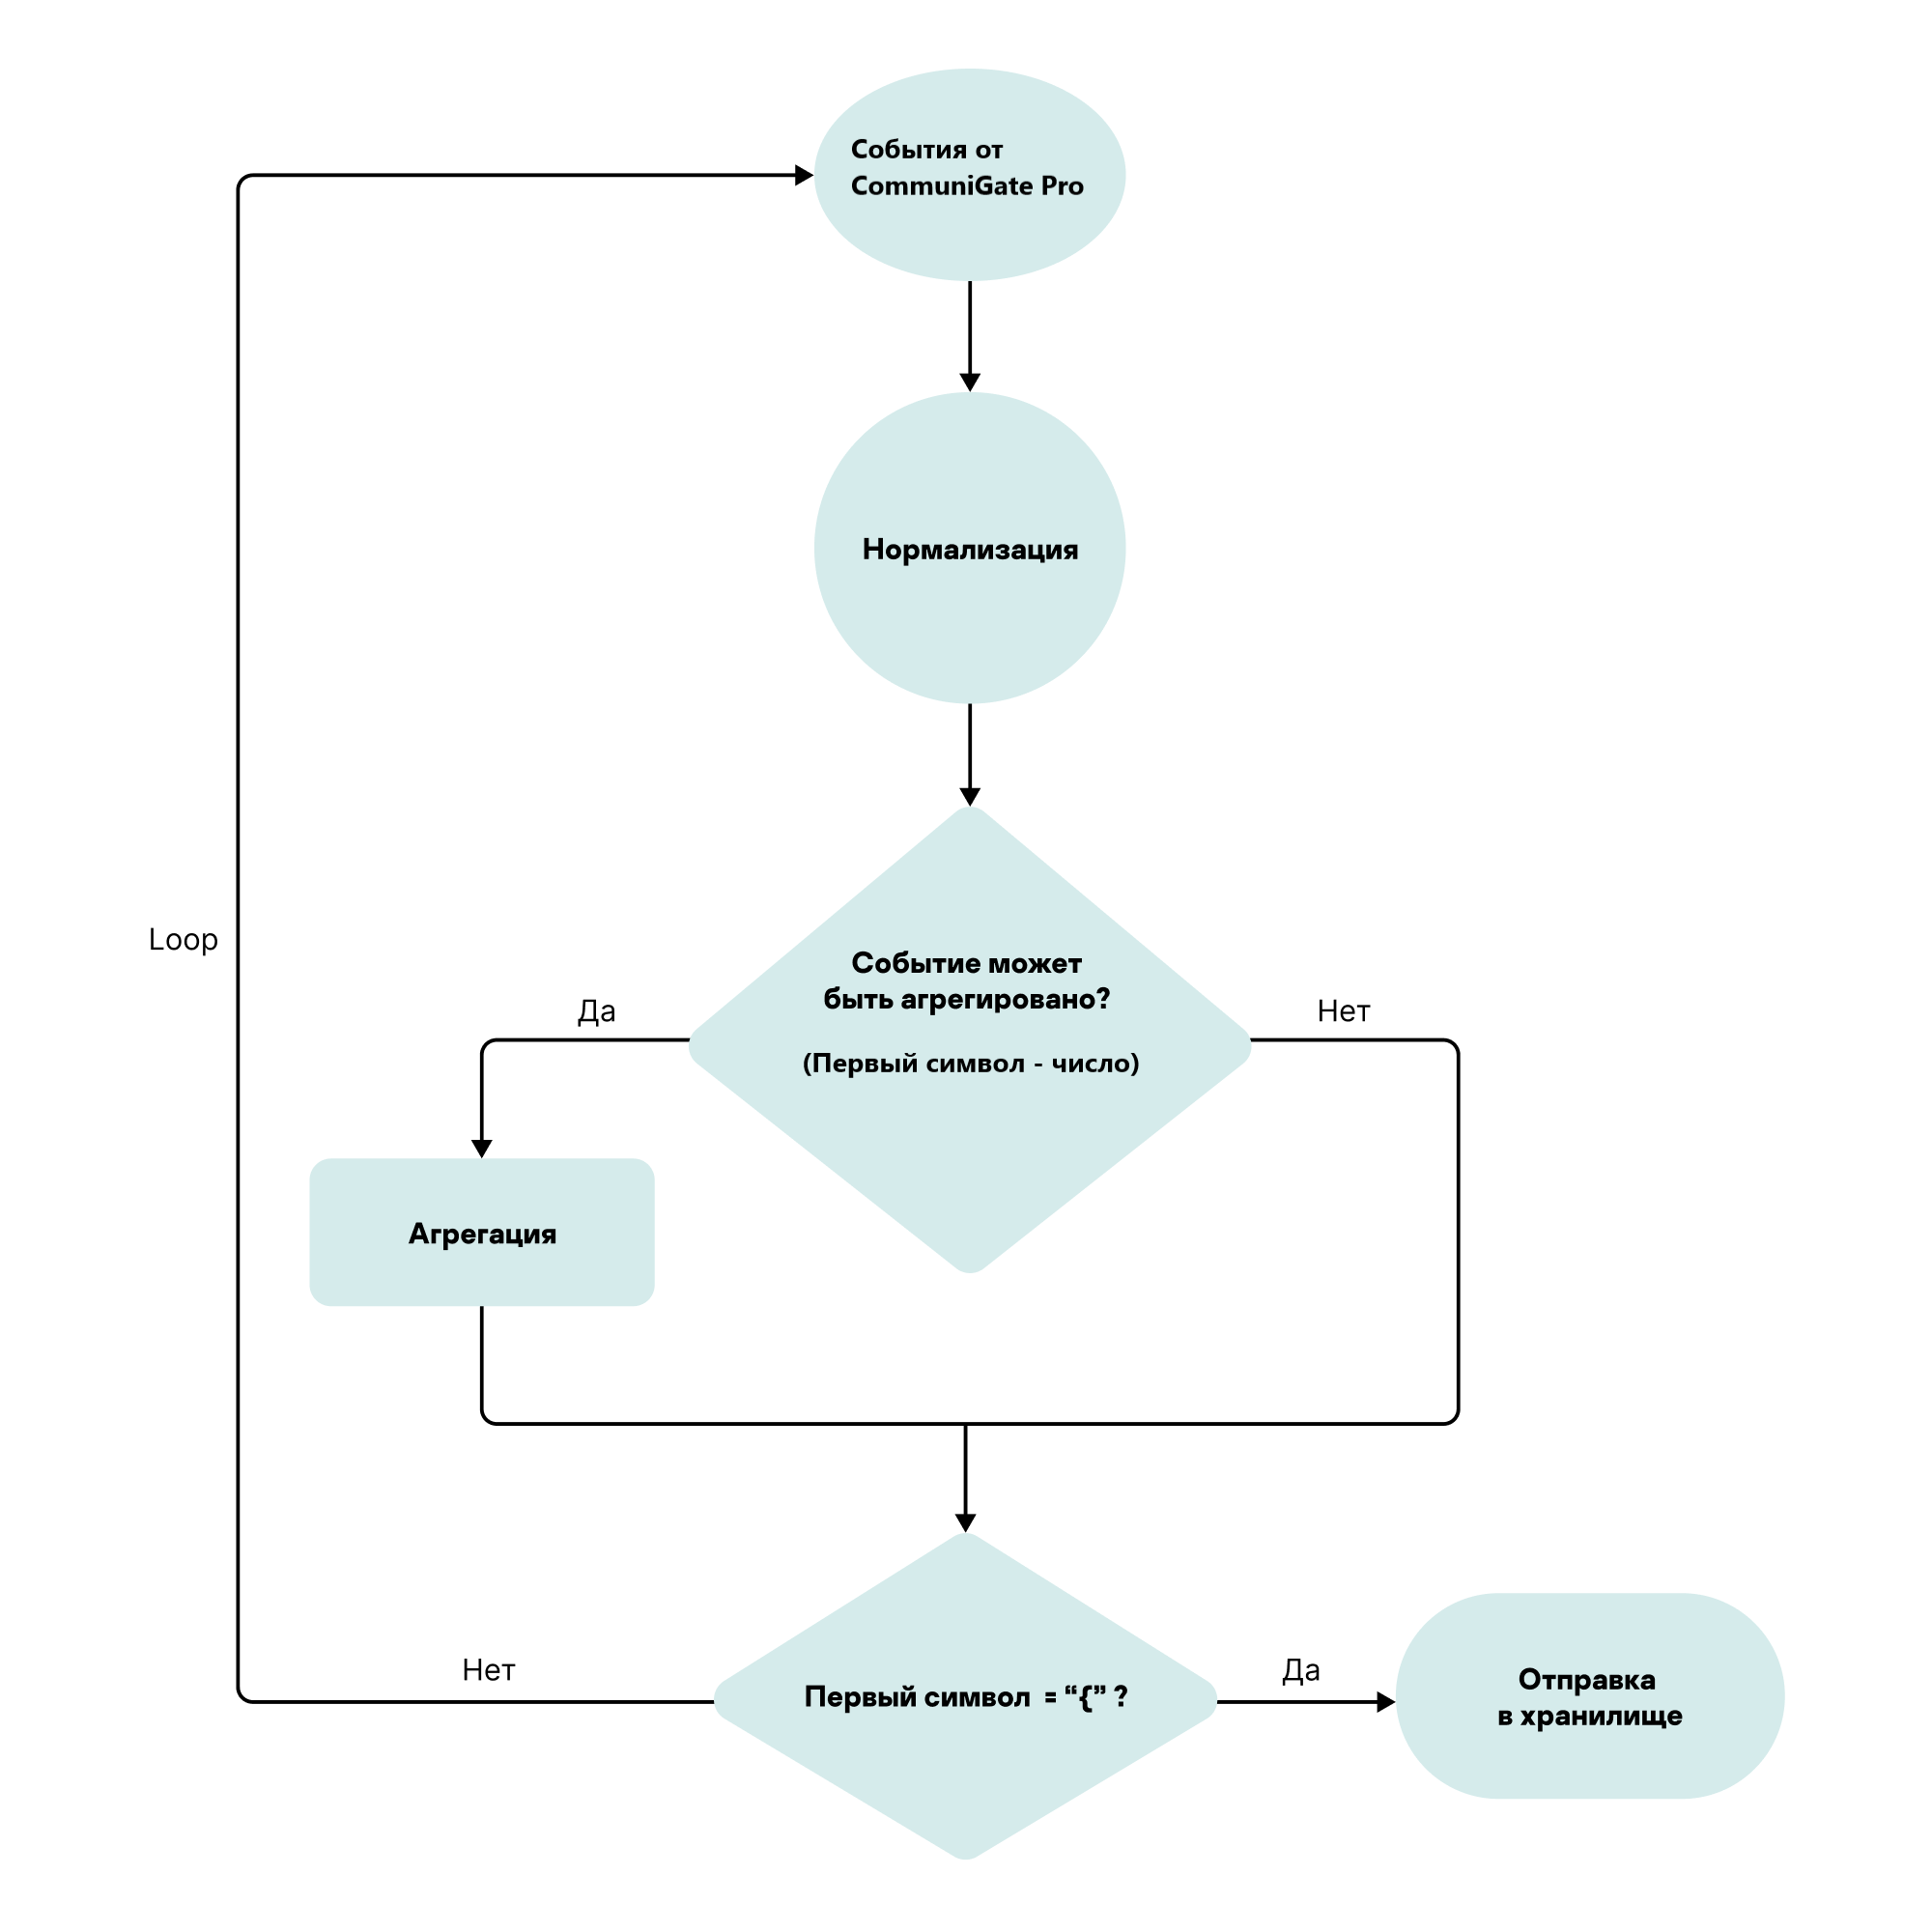
Configuring CommuniGate Pro to send events
By default, CommuniGate Pro audit events are sent to .log files in the /var/CommuniGate/SystemLogs/ directory.
To send events to KUMA, you need to install the KUMA agent on the CommuniGate Pro server and configure it to read .log in the /var/CommuniGate/SystemLogs/ directory and send them to the KUMA collector over TCP.
To create an agent that will read and send events to KUMA:
- In the KUMA Console, go to Resources and services → Agents and click Add.
- This opens the Create agent window; in that window, on the Basic settings tab, in the Name field, specify the agent name.
- On the Config #1 tab, fill in the following fields:
- In the Connector group of settings on the Basic settings tab, set the following values for the connector:
- In the Name field, enter a name, for example, "CommuniGate file".
- In the Type drop-down list, select file.
- In the File path field, enter the following value:
/var/CommuniGate/SystemLogs/.*.log
- In the Destinations group of settings on the Basic settings tab, set the following values for the destination:
- In the Name field, enter a name, for example, "CommuniGate TCP collector".
- In the Type drop-down list, select tcp.
- In the URL field, enter the FQDN or IP address and port of the KUMA collector.
- In the Connector group of settings on the Basic settings tab, set the following values for the connector:
- Click the Create button.
- When the agent service is created in KUMA, install the agent on the network infrastructure devices from which you want to send data to the collector.
Configuring a KUMA collector for receiving and processing CommuniGate Pro events
To configure a KUMA collector for receiving CommuniGate Pro events:
- Import the [OOTB] CommuniGate Pro package from the KUMA repository. The package is available for KUMA 3.0 and newer versions.
- Create a new collector, and in the Collector Installation Wizard, configure the following:
- At the Transport step, in the Type field, select the tcp type, and in the URL field, specify the FQDN or IP address and port of the collector.
- At the Event parsing step, click Add event parsing, and in the displayed Basic event parsing window, in the Normalizer drop-down list, select the [OOTB] CommuniGate Pro normalizer.
- At the Event aggregation step, click Add aggregation rule, and in the displayed Event aggregation window, in the Aggregation rule drop-down list, select [OOTB] CommuniGate Pro. Aggregation rule.
- At the Routing step, click Add and in the displayed Create destination window, create three destination points one by one—the same collector with the name "Loop", a storage, and a correlator.
- Create a destination named "Loop" with the following parameters:
- On the Basic settings tab, in the Type drop-down list, select the tcp transport type; in the URL field, specify the FQDN or IP address and port of the collector that you specified before at step 2.1 of these instructions.
- On the Advanced settings tab, in the Filter drop-down list, select the [OOTB] CommuniGate Pro. Filter for event aggregation filter.
This configuration is necessary to send the aggregated event to the same collector for subsequent normalization.
- Create a correlator destination:
- On the Basic settings tab, in the Type drop-down list, select correlator and fill in the URL field.
- On the Advanced settings tab, in the Filter drop-down list, select the [OOTB] CommuniGate Pro. Aggregated events to storage and correlator filter.
- Create a storage destination:
- On the Basic settings tab, in the Type drop-down list, select storage and fill in the URL field.
- On the Advanced settings tab, in the Filter drop-down list, select the [OOTB] CommuniGate Pro. Aggregated events to storage and correlator filter.
This configuration is necessary to send the aggregated normalized event to storage and the correlator.
- Create a destination named "Loop" with the following parameters:
- Click the Create button.
The collector service is created with the settings specified in the KUMA Console. The command for installing the service on the server is displayed.
- Copy the collector installation command and run it on the relevant server.
The collector is configured to receive and process CommuniGate Pro events.
Page topConfiguring receipt of Yandex Cloud events
You can configure the receipt of Yandex Cloud events in KUMA. The normalizer supports processing configuration-level audit events stored in .json files.
Configuring event receiving consists of the following steps:
- Configuring audit of Yandex Cloud events.
- Configuring export of Yandex Cloud events.
- Configuring a KUMA collector for receiving and processing Yandex Cloud events.
To receive Yandex Cloud events in the KUMA Collector Installation Wizard:
- In the KUMA Collector Installation Wizard, at the Transport step, select the connector of the file type.
- In the URL field, enter
/var/log/yandex-cloud/<audit_trail_id>/*/*/*/*.json, where <audit_trail_id> is the ID of the audit. - At the Event parsing step, in the Normalizer field, select [OOTB] Yandex Cloud.
- Installing a collector in the KUMA network infrastructure.
- Verifying receipt of Yandex Cloud events in the KUMA collector
To verify that the Yandex Cloud event source server is configured correctly, you can search for related events.
Configuring audit of Yandex Cloud events
Configuring event export proceeds in stages:
- Preparing the environment for working with Yandex Cloud.
- Creating a bucket for audit logs.
- Creating an encryption key in the Key Management Service.
- Enabling bucket encryption.
- Creating service accounts.
- Creating a static key.
- Assigning roles to service accounts.
- Creating an audit trail.
Preparing the environment for working with Yandex Cloud.
To manage the configuration, you need Yandex Cloud CLI; install and initialize it.
Note: by default, audit is performed in the Yandex Cloud folder specified in the CLI profile. You can specify a different folder using the --folder-name or --folder-id parameter.
To configure the audit, you need an active billing account because a fee is charged for using the Yandex Cloud infrastructure.
To configure Yandex Cloud audit, you need an active billing account:
- Go to the management console, then log in to Yandex Cloud or register.
- On the Yandex Cloud Billing page, make sure that you have a billing account connected and that it has the ACTIVE or TRIAL_ACTIVE status. If you do not have a billing account, create one.
If you have an active billing account, you can create or select a Yandex Cloud folder in which your infrastructure will work, on the cloud page.
Creating a bucket for audit logs
To create a bucket:
- In the management console, go to the folder in which you want to create the bucket, for example, example-folder.
- Select the Object Storage service.
- Click Create bucket.
- On the bucket creation page:
- Enter the bucket name in accordance with the naming rules, for example kumabucket.
- If necessary, limit the maximum size of the bucket. Size 0 means no limit and is equivalent to the enabled No limit option.
- As the access type, select Restricted.
- Select the default storage class.
- Click Create bucket.
The bucket is created.
Creating an encryption key in the Key Management Service
To create an encryption key:
- In the management console, go to the example-folder folder.
- Select the Key Management Service.
- Click the Create key button and specify the following settings:
- Name (for example, kuma-kms).
- Encryption algorithm, AES-256.
- Keep default values for the rest of the settings.
- Click Create.
The encryption key is created.
Enabling bucket encryption
To enable bucket encryption:
- In the management console, go to the bucket you created earlier.
- In the left pane, select Encryption.
- In the KMS key field, select the kuma-kms key.
- Click Save.
Bucket encryption is enabled.
Creating service accounts
To create service accounts (a separate account for the trail and a separate account for the bucket):
- Create the sa-kuma service account:
- In the management console, go to the example-folder folder.
- In the upper part of the scree, go to the Service accounts tab.
- Click Create service account and enter the name of the service account, for example, sa-kuma, making sure the name complies with the naming rules:
- length: 3 to 63 characters
- may contain lower-case letters of the Latin alphabet, numerals, and hyphens
- the first character must be a letter, the last character may not be a hyphen
- Click Create.
- Create the sa-kuma-bucket service account:
- In the management console, go to the example-folder folder.
- In the upper part of the scree, go to the Service accounts tab.
- Click Create service account and enter the name of the service account, for example, sa-kuma-bucket, making sure the name complies with the naming rules:
- length: 3 to 63 characters
- may contain lower-case letters of the Latin alphabet, numerals, and hyphens
- the first character must be a letter, the last character may not be a hyphen
- Click Create.
The service accounts are created.
Creating a static key
You will need the key ID and the private key when mounting the bucket. You can create a key using the management console or the CLI.
To create a key using the management console:
- In the management console, go to the example-folder folder.
- In the upper part of the screen, go to the Service accounts tab.
- Select the sa-kuma-bucket service account and click the row with its name.
- In the upper panel, click Create new key.
- Select Create static access key.
- Enter a description for the key and click Create.
- Save the ID and the secret key.
The static access key is created. The key value will become unavailable when you close the dialog.
To create a key using the CLI:
- Create an access key for the sa-kuma-bucket service account:
yc iam access-key create --service-account-name sa-kuma-bucketResult:
access_key:id: aje*******k2uservice_account_id: aje*******usmcreated_at: "2022-09-22T14:37:51Z"key_id: 0n8*******0YQsecret: JyT*******zMP1 - Save the key_id and the key from the 'secret' value. You will not be able to get the key value again.
The access key is created.
Assigning roles to service accounts
To assign the audit-trails.viewer, storage.uploader, and kms.keys.encrypterDecrypter roles to the sa-kuma service account:
- In the CLI, assign the audit-trails.viewer role to the folder:
yc resource-manager folder add-access-binding \--role audit-trails.viewer \--id <folder_id> \--service-account-id <service_account_id>Where:
--roleis the assigned role.--idis the ID of the 'example-folder' folder.--service-account-idis the ID of the sa-kuma service account.
- Assign the storage.uploader role to the folder with the bucket:
yc resource-manager folder add-access-binding \--role storage.uploader \--id <folder_id> \--service-account-id <service_account_id>Where:
--roleis the assigned role.--idis the ID of the 'example-folder' folder.--service-account-idis the ID of the sa-kuma service account.
- Assign the kms.keys.encrypterDecrypter role to the kuma-kms encryption key:
yc kms symmetric-key add-access-binding \--role kms.keys.encrypterDecrypter \--id <key_id> \--service-account-id <service_account_id>Where:
--roleis the assigned role.--idis the ID of the kuma-kms KMS key.--service-account-idis the ID of the sa-kuma service account.
To assign the storage.viewer and kms.keys.encrypterDecrypter roles to the sa-kuma-bucket service account:
- In the CLI, assign the storage.viewer role to the folder:
yc resource-manager folder add-access-binding \--id <folder_id> \--role storage.viewer \--service-account-id <service_account_id>Where:
--idis the ID of the 'example-folder' folder.--roleis the assigned role.--service-account-idis the ID of the sa-kuma-bucket service account.
- Assign the kms.keys.encrypterDecrypter role to the kuma-kms encryption key:
yc kms symmetric-key add-access-binding \--role kms.keys.encrypterDecrypter \--id <key_id> \--service-account-id <service_account_id>Where:
--roleis the assigned role.--idis the ID of the kuma-kms KMS key.--service-account-idis the ID of the sa-kuma-bucket service account.
Creating an audit trail
To create an audit trail:
- In the management console, go to the example-folder folder.
- Select the Audit Trails service.
- Click Create trail and specify a name for the trail you are creating, for example, kuma-trail.
- In the Destination section, specify the parameters of the destination object:
- Destination: Object Storage.
- Bucket: The name of the bucket, for example kumabucket.
- Object prefix: Optional parameter used in the full name of the audit log file.
Use a prefix if you store audit logs and third-party data in the same bucket. Do not use the same prefix for logs and other objects in the bucket because this may cause logs and third-party objects to overwrite each other.
- Encryption key: specify the kuma-kms encryption key that the bucket is encrypted with.
- In the Service account section, select sa-kuma.
- In the Collecting management events section, specify the settings for collecting management events audit logs:
- Collecting events: Select Enabled.
- Resource: Select Folder.
- Folder: Does not require filling, contains the name of the current folder.
- In the Collecting data events, in the Collecting events field, select Disabled.
- Click Create.
Configuring export of Yandex Cloud events
The bucket must be mounted on the server on which the KUMA collector will be installed.
To mount the bucket:
- On the server, create a directory for the 'kuma' user:
sudo mkdir /home/kuma - On the server, create a file with a static access key for the sa-kuma-bucket service account and grant appropriate access permissions to the 'kuma' user:
sudo bash -c 'echo <access_key_ID>:<secret_access_key> > /home/kuma/.passwd-s3fs'sudo chmod 600 /home/kuma/.passwd-s3fssudo chown -R kuma:kuma /home/kuma - Install the s3fs package:
sudo apt install s3fs - Create a directory where the bucket must be mounted and grant permissions to the kuma user:
sudo mkdir /var/log/yandex-cloud/sudo chown kuma:kuma /var/log/yandex-cloud/ - Mount the bucket:
sudo s3fs kumabucket /var/log/yandex-cloud -o passwd_file=/home/kuma/.passwd-s3fs -o url=https://storage.yandexcloud.net -o use_path_request_style -o uid=$(id -u kuma) -o gid=$(id -g kuma)You can configure the bucket to be mounted at operating system startup by adding a line to /etc/fstab, for example:
s3fs#kumabucket /var/log/yandex-cloud fuse _netdev,uid=<kuma_uid>,gid=<kuma_gid>,use_path_request_style,url=https://storage.yandexcloud.net,passwd_file=/home/kuma/.passwd-s3fs 0 0Where:
<kuma_uid> is the ID of the 'kuma' operating system user.
<kuma_gid> is the ID of the 'kuma' group of operating system users.
To find out the kuma_uid and kuma_gid, run the following command in the console:
id kuma - Verify that the bucket is mounted:
sudo ls /var/log/yandex-cloud/If everything is configured correctly, the command returns <audit_trail_id>, where <audit_trail_id> is the audit trail ID.
Export of Yandex Cloud events is configured. Events will be located in directories in .json files:
/var/log/yandex-cloud/{audit_trail_id}/{year}/{month}/{day}/*.json
Page topConfiguring receipt of Microsoft 365 events
You can configure the receipt of events from the Microsoft 365 (Office 365) cloud solution in KUMA.
Configuring event receiving consists of the following steps:
- Configuring access to Office 365 management APIs using standard Microsoft methods
To receive events in KUMA, grant the necessary set of API permissions:
Microsoft.Graph
Directory.Read.All
Office 365 management API
ActivityFeed.Read
ActivityFeed.Read.Dlp
- Creating a KUMA collector
To receive Microsoft 365 events, create a collector with the following parameters:
- At the Transport step, specify the office365 connector type.
- At the Parsing events step, specify the [OOTB] Microsoft Office 365 json normalizer.
- Installing a collector in a KUMA network infrastructure
- Verifying receipt of Windows Microsoft 365 in the KUMA collector
To verify that the Microsoft 365 event source server is configured correctly, you can search for related events.