Contents
Working with events and patterns
The Event Processor section provides data on
and the structure of detected by the Event Processor service in the event stream received from external sources or from the Anomaly Detector service.
In the Event Processor section, you can view the history of received events and the registration history of new and/or persistently recurring patterns. You can also configure the display of event parameters and can configure pattern registration settings. On the Monitoring tab, you can monitor specific events, patterns, or values of event parameters received by the Event Processor within the data stream from monitored assets.
If restarted, Kaspersky MLAD restores the state of the Event Processor service and pauses the processing of data received from the CEF Connector. This data is temporarily stored in the internal queue of the application message broker. Until the Event Processor service is restored, the Event Processor section tabs will display a notification informing you that the Event Processor service has stopped. This service restoration process may take several minutes if there is a significantly large number of processed events or registered patterns.
Event Processor section
Configuring settings in the Event Processor section
Before events are processed by the Event Processor service, attention settings and display of event parameters must be configured.
System administrators can manage the attention settings and display of event parameters.
A large number of attention directions can slow down the operation of Kaspersky MLAD main services (data reception, anomaly detection, web interface). To clarify the number of attention directions, it is recommended to consult with Kaspersky experts or a certified integrator.
To configure attention settings and display of event parameters:
- In the main menu, select the Event Processor → Monitoring section.
- On the opened page, click the Settings button.
The Event Processor settings pane will appear on the right.
- In the Configure attention section, do one of the following for each event parameter:
- If you need to register patterns for all values of an event parameter, use the drop-down list to select All parameter values.
- To register patterns for a specific event parameter value, select the event parameter value in the drop-down list. As you start typing a value, all matching parameter values are displayed in the list.
If the parameter value is not listed, enter the required value and select Create Value: <event parameter value>.
- If you need to register patterns based on an event parameter value template, turn on the Regular expression toggle switch for the relevant event parameter, use the drop-down list to enter the value template with a regular expression, and select Regular expression: <value template>.
You can use special characters of regular expressions to search for patterns based on regular expressions.
Each attention direction is defined by the parameter value that must be present in all events of this direction. When configuring attention directions, you can indicate specific values or templates of values of one or more parameters or define attention directions for all possible values of one or more parameters.
- To configure the display of filters for the event parameters, in the Filters section on the Event history and Patterns history tabs, in the Configure display of event parameter filters section, select the check boxes next to the names of the desired event parameters.
By default, the Configure display of event parameter filters section displays the event parameters from the Anomaly Detector service. To display custom event parameters, load the Event Processor service configuration file. All available event parameters are selected by default.
If necessary, in the Filters section you can change the display order for the event parameters. For this purpose, drag the required event parameter up or down in the Configure display of event parameter filters section.
- To save your changes, click the Apply button.
Working with monitors
Monitor management is available to system administrators.
In the Event Processor → Monitoring section, you can create monitors for monitoring specific events, patterns, or values of event parameters.
The Monitoring tab displays all monitors created in the application, including the following brief information:
- Monitor name.
- Monitor threshold.
- Sliding window used to track the number of monitor activations.
- Number of monitor activations on the sliding window.
If necessary, you can view detailed information about each monitor by clicking the Information button located next to the name of the relevant monitor in the table.
On the Histogram tab, you can also view brief statistics on the number of registered activations for each created monitor.
Creating a monitor
Monitor management is available to system administrators.
To create a monitor:
- In the main menu, select the Event Processor → Monitoring section.
- Click the Create monitor button.
The Create monitor pane appears on the right.
- Specify the monitor name in the Name field.
- In the Sliding window (sec.) field, specify the interval (in seconds) from the current point in time back to the time sequence for which the monitor will process incoming values of parameters, events or patterns.
- In the Threshold field, specify the number of monitor activations in the sliding window after which the monitor sends an alert to the external system.
- In the Stack limit field, specify the number of monitor activations that must be displayed when viewing information about the monitor.
- In the Subscription type drop-down list, select one of the following values:
- If you need to process data on the values of event parameters, select Parameter values.
- If you need to process data on events, select Events.
- If you need to process data on detected patterns, select Patterns.
- If you need to track new events, patterns, or values of event parameters, turn on the Only new toggle switch in the Filters section.
- To focus the attention of the model on specific directions of events, do one of the following:
- If you selected Events from the Subscription type drop-down list, select Attention for the relevant event parameter. If you need to track events without specifying the attention direction, clear the Attention check box.
- If you selected Patterns from the Subscription type drop-down list, select the Attention check box for the relevant event parameter.
You can select only one attention direction.
- For each event parameter, do one of the following:
- If you need to process data on all values of an event parameter, use the drop-down list to select All parameter values.
This option is displayed if you specified the attention direction for the current event parameter.
- To process data only on the new values of an event parameter, in the drop-down list select New parameter values.
This option is displayed only when the Only new function is enabled for event-based data processing.
- To process data for a specific value of an event parameter, in the drop-down list select the event parameter value. As you start typing a value, all matching parameter values are displayed in the list.
If the parameter value is not listed, enter the required value and select Create Value: <event parameter value>.
- If you need to process data based on an event parameter value template, turn on the Regular expression toggle switch for the relevant event parameter, use the drop-down list to enter the value template with a regular expression, and select Regular expression: <value template>.
You can use special characters of regular expressions to search patterns using regular expressions.
- If you need to process data on all values of an event parameter, use the drop-down list to select All parameter values.
- Click the Create button.
The new monitor is created and displayed on the Monitoring tab.
Page topDeleting a monitor
Monitor management is available to system administrators.
To delete a monitor:
- In the main menu, select the Event Processor → Monitoring section.
- Click the Delete button in the cell of the monitor whose information you want to delete and confirm your selection.
The monitor will be deleted.
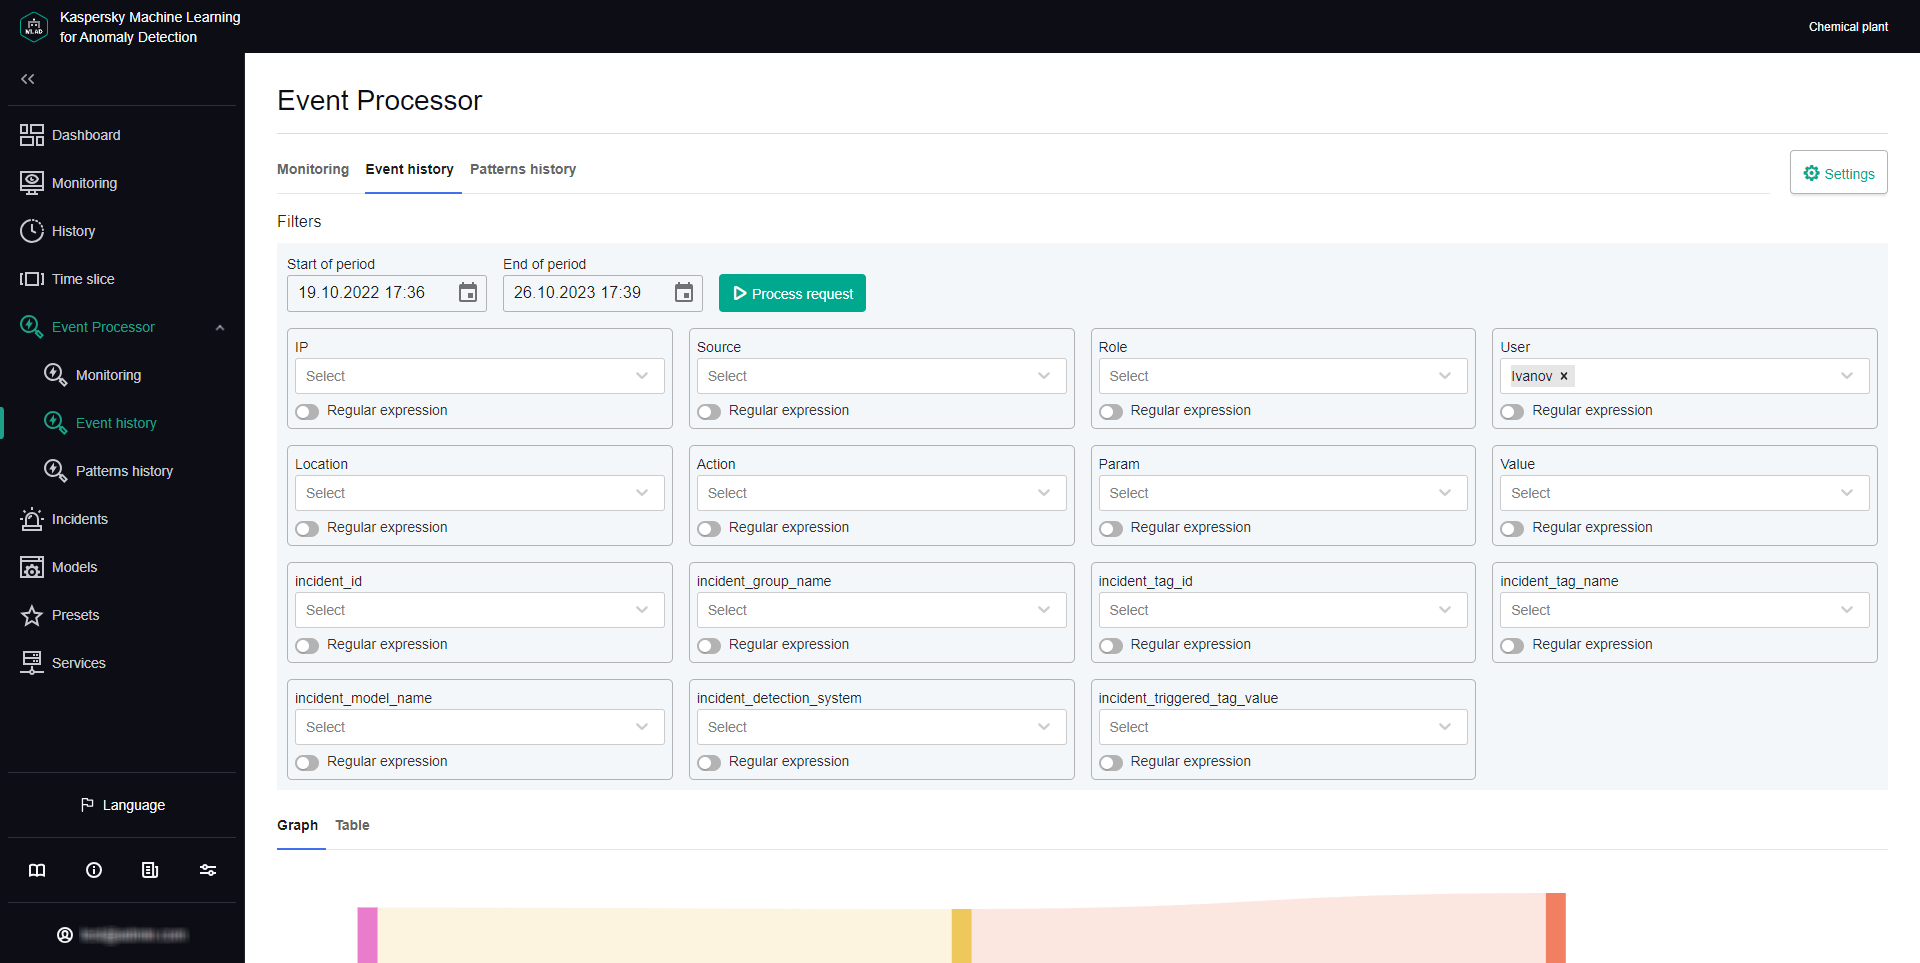
Page topViewing the events history
Kaspersky MLAD lets you view the events that were received from external sources of events. To view events, you need to upload them to Event Processor → Event history.
Viewing the event history is available to system administrators.
Kaspersky MLAD displays incoming events as a graph of relations between event parameters. The graph nodes correspond to the values of the event parameters, and the arcs between the nodes correspond to the links between the parameter values of incoming events. You can hover the mouse pointer over the event graph and view information about the event parameters and their values. You can also hover the mouse pointer over the event graph arc and view information about the number of links between the values of event parameters.
You can also view information about the detected events as a table.
Each monitored asset has its own specific incoming events and event parameters. The list of event parameters is defined in the configuration file for the Event Processor service. The configuration file is created and uploaded by a system administrator during configuration of the Event Processor service.
To upload data for viewing incoming events:
- In the main menu, select the Event Processor → Event history section.
- In the Filters section, click the calendar icon (
 ) to select the start and end date and time of the period for which you want to load and view events. To configure event parameters, do one of the following:
- To load events based on the specific values of the event parameters, select the event parameter value in the drop-down lists. As you start typing a value, all matching parameter values are displayed in the lists.
- To load events based on a value template, enable the Regular expression option for the relevant event parameters, in the drop-down lists, specify the value template using a regular expression, and select Regular expression: <value template>.
You can use special characters of regular expressions to perform a search based on regular expressions.
Each monitored asset has its own specific set and names of event parameters.
- Click the Process request button.
Data on the events found by the application will be displayed as a graph in the central part of the page.
- To view the received events as a table, select the Table tab.
The central part of the page displays a table that contains information on the detected events.
Viewing the pattern history
In the section Event Processor → Patterns history, you can find and view the structure of the new and/or persistently recurring patterns. The Event Processor generates patterns only for specific directions that are defined in the attention configuration by the system administrator.
Viewing the pattern history is available to system administrators.
You can also view the structure of the detected patterns down to the event level. The Event Processor represents patterns, events, and values of event parameters as a layered hierarchy of nested elements. For example, a fourth-layer pattern consists of subpatterns of the third layer. A third-layer pattern consists of second-layer patterns, and a second-layer pattern consists of events, which are first-layer elements. Event parameter values are elements of the null terminal layer.
Each monitored asset has its own specific incoming events and event parameters. The list of event parameters is defined in the configuration file for the Event Processor service. The configuration file is created and uploaded by a system administrator during configuration of the Event Processor service.
To view the registered patterns:
- In the main menu, select the Event Processor → Patterns history section.
- In the Filters section, configure the following settings for displaying patterns on the page:
- In the Start of period field, click the calendar icon () and select the starting date and time of the period for which you want to view the patterns.
- In the End of period field, click the calendar icon () and select the end date and time of the period for which you want to view the patterns.
- In the Pattern type drop-down list, select one of the following values:
- Stable refers to patterns that were registered by the Event Processor service two or more times.
- New refers to new patterns registered by the Event Processor service for the first time.
- All includes all patterns that were registered by the Event Processor service.
- To view patterns for a specific attention direction, select Attention for the relevant event parameter.
You must select one of the attention directions that were defined when configuring the attention settings.
- To configure event parameters, do one of the following:
- To view patterns based on specific values of the event parameters, select the event parameter values in the drop-down lists. As you start typing a value, all matching parameter values are displayed in the lists.
- If you need to view patterns based on a value template, turn on the Regular expression toggle switch for the relevant event parameters, use the drop-down lists to enter the value template with a regular expression, and select Regular expression: <value template>.
You can use special characters of regular expressions to perform a search based on regular expressions.
For the request to be processed correctly, enter the values for the event parameter that is receiving focused attention from the model. If an event parameter that is receiving focused attention has multiple values defined, the Event Processor will generate patterns for each value of the parameter.
- In the Start of period field, click the calendar icon (
- Click the Process request button.
The central part of the page displays a table containing data on the registered patterns.
- To view the pattern structure, click the desired pattern row.
The page with detailed information on the pattern opens.
- To view the structure of a pattern, do one of the following:
- To view the structure of a particular subpattern, on the Patterns tab in the Nested elements section, click the desired pattern.
You can return to viewing the top-level pattern structure by clicking the ID of the desired pattern above the Pattern info section.
- To view the table of subpatterns at a certain nesting level, select the desired layer on the Patterns tab of the Nested elements section.
- To view the events included in the pattern at the current nesting level, click the Events tab.
Kaspersky MLAD displays the pattern structure from the top nesting level.
- To view the structure of a particular subpattern, on the Patterns tab in the Nested elements section, click the desired pattern.