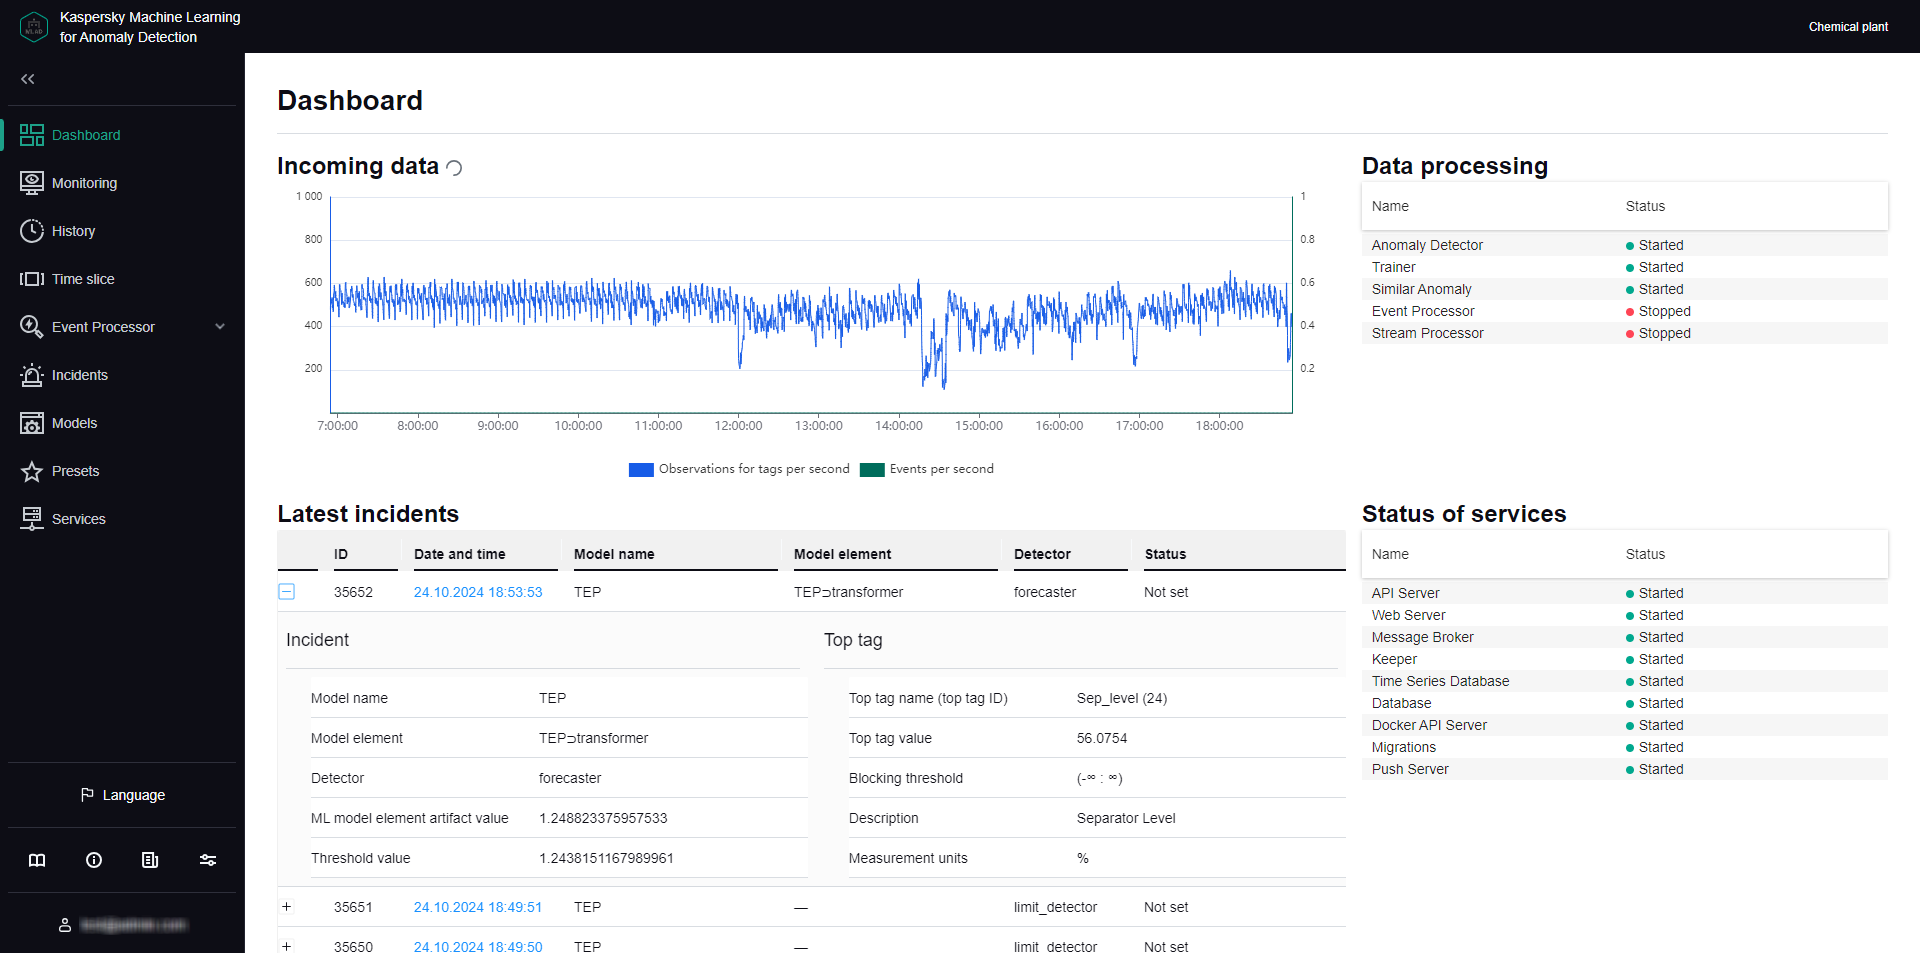
The Dashboard section provides summary information on the number of events and observations for tags received by Kaspersky MLAD, registered incidents, and the status of services.
The information on the page is divided into the following blocks:
Incoming data is a graph that displays the number of events and observations for tags received by Kaspersky MLAD. You can enable or disable the display of incoming events and observations for tags on the graph by clicking the corresponding data signature legend under the graph. The left scale of the graph displays the range for the number of observations for tags per second. The right scale of the graph displays the range for the number of incoming events per second.
Date and time refers to the date and time when the incident occurred.
Model name refers to the name of the ML model whose element registered the incident.
Model element refers to the name of the ML model element that registered the incident.
Detector refers to the type of incident registered.
Status refers to the status of the registered incident as entered by an expert following an incident analysis or assigned automatically according to the incident status defined for the ML model element that registered the incident
Clicking the button near an incident in the incidents table opens a window containing the technical attributes of the selected incident and tag:
Incident is a section containing information about the incident:
Model name refers to the name of the ML model whose element registered the incident.
Model element refers to the name of the ML model element that registered the incident.
Detector refers to the type of incident registered.
ML model element artifact value refers to deviation of the monitored asset's behavior from normal at the time of incident registration. This is absent if the incident is registered by Limit Detector or Stream Processor.
Threshold value refers to the threshold value for registering an incident by an ML model element. For any incident detected by Limit Detector, the specific threshold (upper or lower) reached by the tag is recorded.
Top tag is a section that contains information about the tag that had the greatest impact on incident registration:
Top tag name (top tag ID) is the name and ID of the tag that had the greatest impact on incident registration.
Top tag value is the value of the top tag registered when the incident occurred.
Blocking threshold refers to maximum permissible top tag values. Limit Detector requires these settings to function correctly. Whenever the tag value reaches its upper or lower blocking threshold, the Limit Detector registers an incident.
Description refers to a description of the top tag.
Measurement units refer to the units for measuring the top tag values.
Data processing refers to a table that displays the statuses of services used for processing events and observations according to tags received by Kaspersky MLAD, training and inferencing ML models, and registering incidents.
Status of services is a table that displays the status of each service.
You can proceed to the History section from the Dashboard section by clicking the date and time of an incident in the Latest incidents table. The History section displays detailed information about the incidents registered by Kaspersky MLAD.
 button near an incident in the incidents table opens a window containing the technical attributes of the selected incident and tag: