Contents
- About incidents
- About incidents detected by a predictive element of an ML model
- About incidents detected by an ML model element based on a diagnostic rule
- About incidents detected by an ML model element based on an elliptic envelope
- About incidents detected by the Limit Detector
- About incidents detected by the Stream Processor service
About incidents
An incident is an identified deviation from the expected (normal) behavior of a monitored asset.
Kaspersky MLAD supports incident registration for the following sources:
- ML model elements. An incident is recorded when the value of an ML model element artifact reaches the incident registration threshold set for that specific element. Incidents can be detected by predictive, diagnostic rule-based, and elliptic envelope-based ML model elements.
The registration of an incident may be delayed after the specified threshold is reached, depending on the configuration of the ML model element. When a certain threshold for registering an incident is met, the ML model element starts watching for unusual activity in the monitored asset for a specific period defined in the element settings. If the monitored asset exhibits anomalous behavior for a certain specified proportion of this interval, the ML model element registers an incident.
Kaspersky MLAD can suppress the registration of consecutive incidents from the same ML model element if these occur shortly after the first incident in the series. This uses Period of recurring alert suppression (sec), which you can define in the element settings.
An ML model element may continue to flag the same incident multiple times until the abnormal activity stops. You can control how often repeated incidents are recorded by adjusting the Reminder period (sec) and editing the element.
- Limit Detector. The system will record an incident whenever a tag value reaches the upper or lower limit.
- Stream Processor. An incident is recorded when the system notices that telemetry data is missing or when Kaspersky MLAD receives observations too early or too late.
When a deviation is detected, the corresponding source records the date, time and relevant deviation parameters, and saves this data as an entry in the Incidents section. If incident notifications for users or external systems are created in Kaspersky MLAD, information about an incident is sent to the intended recipients via the corresponding services of Kaspersky MLAD.
About incidents detected by a predictive element of an ML model
An ML model predictive element has been trained on a particular subset of tags, and it can anticipate current tag behavior. In this case, an incident is any substantial discrepancy between the observed (actual) values of tags and the predicted values of tags resulting from operations of the ML model element. In the model element settings, you can view which tags are analyzed by the ML model element (Input tags parameter) and which tags' behavior is predicted (Output tags parameter).
An ML model can include one or more elements running in parallel. In the History and Monitoring sections, you can select a specific element of the ML model to display the incidents registered as a result of a specific model element operation. The graph of the ML model element artifact shows registered incidents as colored dots at the bottom.
The artifact graph also displays cumulative prediction error value for the selected ML model element. Cumulative prediction error is an indicator of the difference between predicted values from actual values, calculated cumulatively for all tags included in the selected element of the ML model. The higher the prediction error value, the more the behavior of tags will differ from the expected (normal) behavior. The prediction error threshold is the critical cumulative prediction error value that, when reached, causes the ML model predictive element to register an incident. The artifact graph displays the cumulative prediction error as a red line, and the prediction error threshold, as an orange line. The area on the graph where the forecast error exceeds the specified threshold is colored red.
The ML model artifact graph is displayed at the bottom of the History section (see figure below).
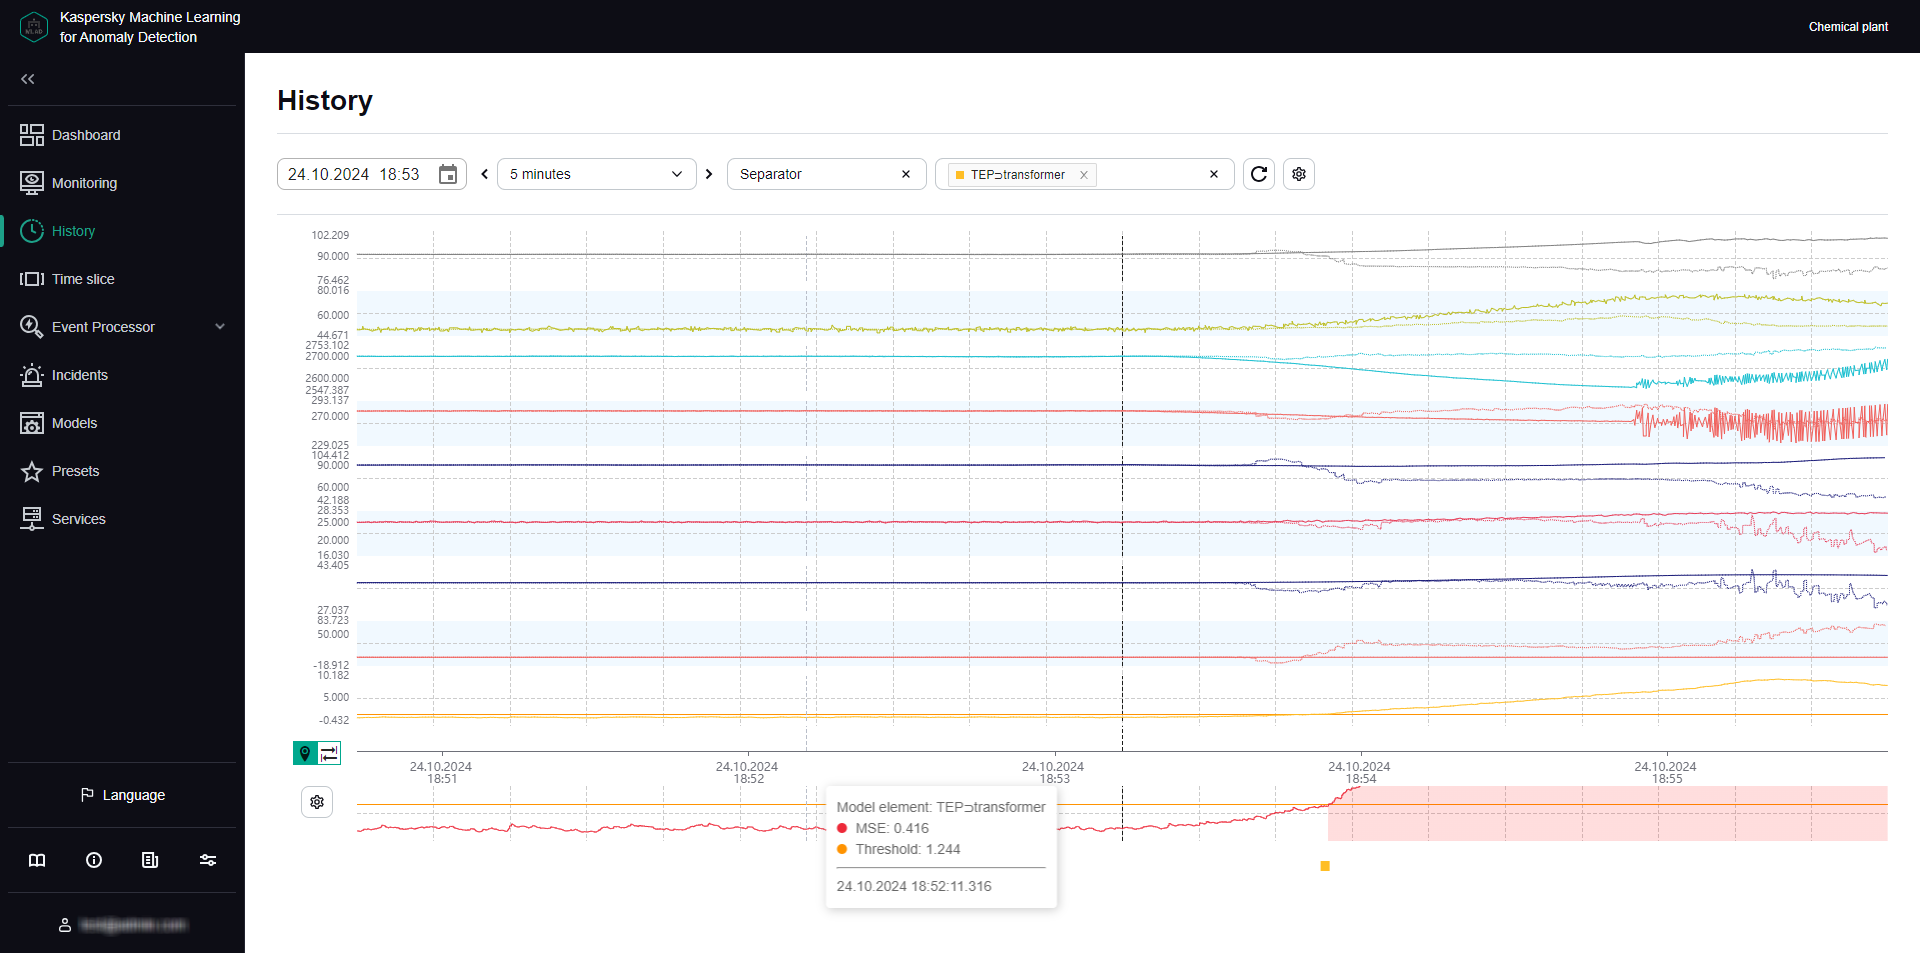
ML model element artifact graph under History
For each incident, the application automatically identifies tags with the greatest actual value deviations from those predicted by the ML model. These tags generate a Tags for incident #<incident ID> preset. This preset is displayed under History when you click the incident date and time in the incidents table. Tags that are included in the Tags for incident #<incident ID> preset are sorted in descending order of their deviation from expected (normal) behavior. The tag with the greatest deviation from the predicted value is displayed in the incidents table under Incidents. The incidents table also indicates the prediction error threshold and the actual prediction error value at the moment when the incident was registered.
Information obtained when viewing the Tags for incident #<incident ID> preset is not actually diagnostic information for the purposes of identifying the causes of an incident, but you can still use this information when analyzing the values of tags with the largest deviations in behavior. The tag whose behavior was the first to deviate from the norm and caused subsequent deviations in other tags is referred to as the causal tag. In some cases, the causal tag may not be at the top of the list in the Tags for incident #<incident ID> preset and may even be entirely absent from this preset. This could happen due to the following reasons:
- Minor amplitude changes in the behavior of the causal tag had a multiplier effect and caused significant deviations in other tags that were included in the Tags for incident #<incident ID> preset.
- The causal tag is not analyzed by the ML model, and Kaspersky MLAD registers derivative changes in the behavior of tags caused by the deviation of the causal tag.
- Changes in the behavior of the causal tag had a delayed effect, and by the time an anomaly occurred in the operation of the monitored asset, the behavior of the causal tag returned to normal.
About incidents detected by an ML model element based on a diagnostic rule
An ML model can include one or more elements based on diagnostic rules. Each diagnostic rule results in the following values being obtained that are calculated at each point in time:
- Value
0. The diagnostic rule was not triggered or applied at this moment. - Value
1. The diagnostic rule was triggered at this moment. - Intermediate values from
0to1are possible in individual cases. The diagnostic rule was partially triggered at this moment.
Once the result surpasses the threshold set for the diagnostic rule, which is generally equal to one, the element based on the diagnostic rule records an event. For each incident registered by the diagnostic rule, Kaspersky MLAD automatically creates a Tags for incident #<incident ID> preset. This preset can be selected under History when you click the incident date and time in the incidents table. This preset contains the value obtained as a result of the work of the diagnostic rule, as well as the tags included in this rule.
Page topAbout incidents detected by an ML model element based on an elliptic envelope
An ML model elliptic envelope is trained on a specific subset of tags, and it can detect outliers (anomalies) in a dataset. The training of the ML model creates an elliptical region within the phase space. Any data points that fall within this ellipse are considered normal. When states are detected that are a distance from the center of the elliptical region equal to or greater than the predetermined threshold, the element based on the elliptic envelope registers an incident. In the model element parameters, you can view which tags are parsed by the element (Input tags).
The most relevant tags are automatically defined for every incident registered by an element based on an elliptic envelope. These are tags whose removal from the ML model causes the least deviation from the normal state. These tags generate a Tags for incident #<incident ID> preset. The preset can be selected under History when you click the incident date and time in the incidents table. Tags that are included in the Tags for incident #<incident ID> preset are sorted in descending order of their deviation from expected (normal) behavior. The tag with the greatest impact on incident registration is displayed in the incidents table under Incidents.
An ML model may include one or more elements running in parallel. In the History and Monitoring sections, you can select a specific element of the ML model to display the incidents registered as a result of a specific model element operation. The graph of the ML model element artifact shows registered incidents as colored dots at the bottom.
Page topAbout incidents detected by the Limit Detector
If the Limit Detector is enabled, Kaspersky MLAD automatically monitors all tags having blocking thresholds specified for the tag when using any ML model. Blocking thresholds can be defined in a tag configuration imported into Kaspersky MLAD at the start of operations. You can edit the tag blocking thresholds in the application's web interface.
To visually monitor the position of a tag graph relative to the blocking thresholds in individual graphic areas under History and Monitoring, you can turn on Blocking threshold and Always display blocking threshold. If Always display blocking threshold is disabled, the upper or lower threshold line is displayed only if the tag values have reached the corresponding threshold during the time interval displayed on the screen. The Limit Detector identifies and registers events regardless of whether or not the Always display blocking threshold option is enabled.
When the tag value reaches its upper or lower technical limit, the Limit Detector registers an incident. This tag is displayed in the incidents table in the Incidents section. The incidents table also shows the blocking thresholds of the tag and the actual value of a tag that violated one of these limits. For each incident registered by Limit Detector, Kaspersky MLAD automatically creates a Tags for incident #<incident ID>. This preset can be selected under History when you click the incident date and time in the incidents table. This preset includes the only causal tag of the incident.
Page topAbout incidents detected by the Stream Processor service
The Stream Processor service gathers real-time telemetry data received from the monitored asset at arbitrary points in time and converts this data to a uniform temporal grid (UTG). When analyzing incoming data, the Stream Processor service can detect losses of telemetry data and observations that were received by Kaspersky MLAD too early or too late. The Stream Processor service registers an incident in such cases.
Incidents detected by the Stream Processor service are displayed in the incidents table of the Incidents section. Each incident registered by the Stream Processor service is automatically assigned one of the following incident types:
- No data – input data stream for a specific tag was terminated or interrupted.
- Clock malfunction – observations received by Kaspersky MLAD too early are detected.
- Late receipt of observation – observations received by Kaspersky MLAD too late are detected.
The Stream Processor service transfers the UTG-converted data to the ML model of the Anomaly Detector service.
Page top