About incidents detected by a predictive element of an ML model
An ML model predictive element has been trained on a particular subset of tags, and it can anticipate current tag behavior. In this case, an incident is any substantial discrepancy between the observed (actual) values of tags and the predicted values of tags resulting from operations of the ML model element. In the model element settings, you can view which tags are analyzed by the ML model element (Input tags parameter) and which tags' behavior is predicted (Output tags parameter).
An ML model can include one or more elements running in parallel. In the History and Monitoring sections, you can select a specific element of the ML model to display the incidents registered as a result of a specific model element operation. The graph of the ML model element artifact shows registered incidents as colored dots at the bottom.
The artifact graph also displays cumulative prediction error value for the selected ML model element. Cumulative prediction error is an indicator of the difference between predicted values from actual values, calculated cumulatively for all tags included in the selected element of the ML model. The higher the prediction error value, the more the behavior of tags will differ from the expected (normal) behavior. The prediction error threshold is the critical cumulative prediction error value that, when reached, causes the ML model predictive element to register an incident. The artifact graph displays the cumulative prediction error as a red line, and the prediction error threshold, as an orange line. The area on the graph where the forecast error exceeds the specified threshold is colored red.
The ML model artifact graph is displayed at the bottom of the History section (see figure below).
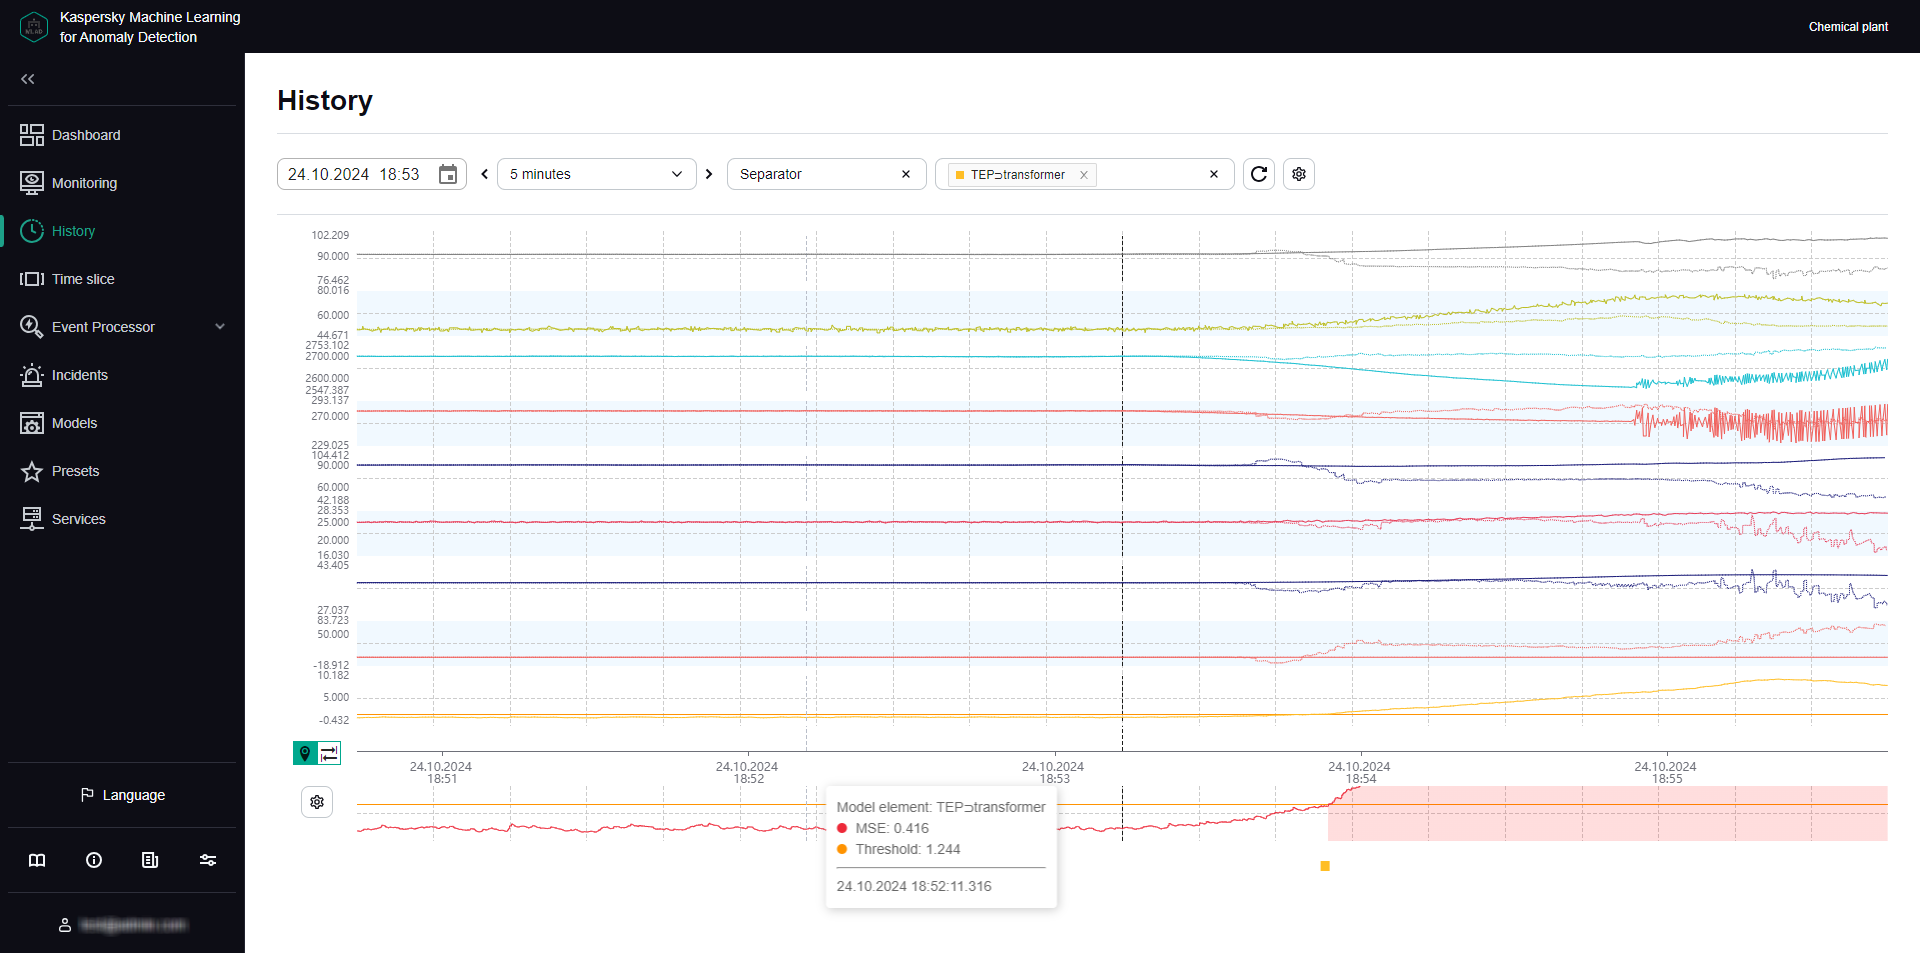
ML model element artifact graph under History
For each incident, the application automatically identifies tags with the greatest actual value deviations from those predicted by the ML model. These tags generate a Tags for incident #<incident ID> preset. This preset is displayed under History when you click the incident date and time in the incidents table. Tags that are included in the Tags for incident #<incident ID> preset are sorted in descending order of their deviation from expected (normal) behavior. The tag with the greatest deviation from the predicted value is displayed in the incidents table under Incidents. The incidents table also indicates the prediction error threshold and the actual prediction error value at the moment when the incident was registered.
Information obtained when viewing the Tags for incident #<incident ID> preset is not actually diagnostic information for the purposes of identifying the causes of an incident, but you can still use this information when analyzing the values of tags with the largest deviations in behavior. The tag whose behavior was the first to deviate from the norm and caused subsequent deviations in other tags is referred to as the causal tag. In some cases, the causal tag may not be at the top of the list in the Tags for incident #<incident ID> preset and may even be entirely absent from this preset. This could happen due to the following reasons:
- Minor amplitude changes in the behavior of the causal tag had a multiplier effect and caused significant deviations in other tags that were included in the Tags for incident #<incident ID> preset.
- The causal tag is not analyzed by the ML model, and Kaspersky MLAD registers derivative changes in the behavior of tags caused by the deviation of the causal tag.
- Changes in the behavior of the causal tag had a delayed effect, and by the time an anomaly occurred in the operation of the monitored asset, the behavior of the causal tag returned to normal.