Contents
Viewing data in the History section
The History section provides access to the history of incoming data, the results of data processing by Kaspersky MLAD, generated ML model artifacts, and registered incidents information.
The central part of the History section consists of a set of horizontal segments designed to display graphs. Each such segment is called a graphic area. The graphic areas for the selected preset are displayed first. A single graphic area of a preset can display a graph of one tag or graphs of multiple tags superimposed over each other. The composition of tags whose data is shown in the graphic area can be determined when you create a preset. The graphs display the values of preset tags received by Kaspersky MLAD from the monitoring object during the selected time interval. You can choose ML model elements and customize graph display for the graphs for individual graphic areas to show artifacts linked to the tags associated with those areas and generated by the ML model elements that use these tags.
Graphic areas for each selected ML model element are displayed after the preset graphic areas. These graphic areas display graphs for ML model element artifacts. The value of an ML model element artifact depends on the analytical algorithms used by the element. It is displayed as a colored line. The color of the line corresponds to the color selected for the Color of incident dot indicators setting when the corresponding element was created. Graphs also display an orange line that represents the threshold. When a value exceeds this threshold, the ML model element registers an incident.
At the bottom of the section, there is a graphic area that displays a graph of the ML model element artifact selected in the ML model element artifact graph display settings panel. The red line on the graph corresponds to the value of the ML model element artifact, while the orange line represents a threshold. When the value crosses this threshold, Kaspersky MLAD registers an incident. The area on the graph where the value of the ML model element artifact exceeds the specified threshold is colored red. Below the graph, color-coded dots that represent recorded incidents are displayed.
Depending on the selected time scale and the density of incidents, one dot indicator may correspond to one or multiple closely-spaced incidents that were registered by one or multiple ML model elements. The color of the indicator points relating to incidents recorded by a single ML model element is assigned when that element is created. Purple is reserved for indicator points that correspond to a group of incidents recorded by different elements. Red is reserved for indicator points that correspond to incidents recorded by Limit Detector.
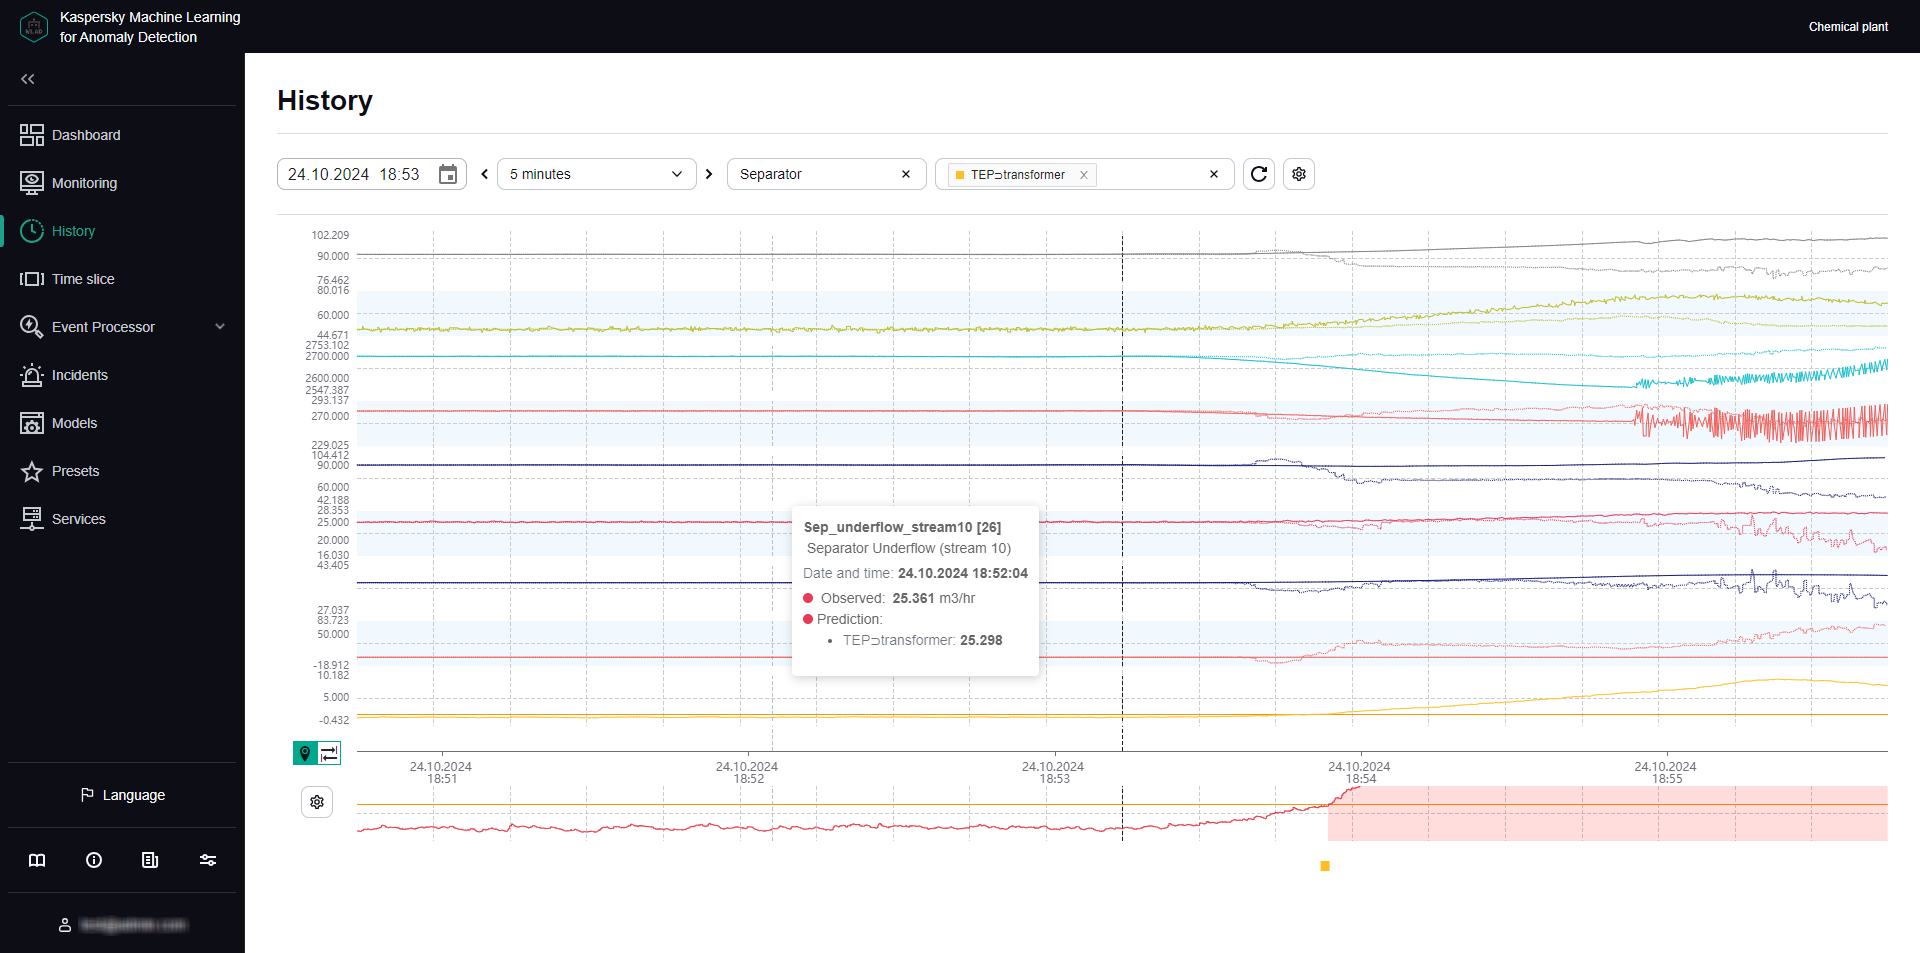
History section
Viewing historical data for a specific preset
Kaspersky MLAD allows you to select custom presets for which historical data is displayed. If you want to view historical data for tags in the Tags for incident #<incident ID> dynamic preset, click the incident registration date under Incidents. The Tags for incident #<incident ID> dynamic preset contains tags that had the greatest influence on the generation of a registered incident.
To view historical data for a specific preset:
- In the main menu, select the History section.
- On the opened page, select the relevant preset from the Preset drop-down list.
The page will display graphs for the tags included in the selected preset, according to the graphic areas settings specified when that preset was created.
You can use the time navigation function to view the entire history of data. You can edit the date and time interval or select ML model elements to view their output, if needed. You can also change which tags are displayed by editing the preset.
Page topSelecting elements of the ML model in the History section
History provides the history of incoming data, the results of its processing by Kaspersky MLAD, artifacts generated by selected ML model elements, and registered incidents.
When multiple ML models are applied to processing data for a monitored object, Kaspersky MLAD gives you the option to select several components of these models to visualize their inference results: An ML model element is not created for the Limit Detector. The dot indicators of incidents registered using this detector are displayed if use of the Limit Detector is enabled and the display of indicators for all incidents is enabled.
The functionality is available after a license key is added.
To view the inference results of an ML model element:
- In the main menu, select the History section.
- On the opened page, select one or several elements of the ML model from the Model element drop-down list.
Element names are displayed as
<ML model name>
<element name>.Graphic areas for the selected preset will display the values of tags received by Kaspersky MLAD for the selected time interval. When you customize graph display, graphs for individual graphic areas will show artifacts linked to the tags associated with those areas and generated by the ML model elements that use these tags.
The central part of the section will display graphs for artifacts from the selected ML model elements. The values shown on the graphs depend on the analytical algorithms used by the elements to identify anomalies.
To hide the artifacts for a selected ML model element, click
 next to the element.
 - To display a graph of a specific ML model element's artifact at the bottom of the section, do the following:
- Click the
 button below the tag graphs on the left side of the page.
The ML model element artifact graph display settings pane appears on the right.
- From the Model element drop-down list, select the ML model element. You can select only one ML model element from the list.
- Click the Close button.
The graph will show the value of the selected ML model element's artifact as a red line. The graph area above the orange threshold line is highlighted in red to indicate above-threshold artifact values.
- Click the
The lower part of the graph displays the dot indicators of incidents that were registered by the selected ML model elements. If the display of indicators for all incidents is enabled, dot indicators for incidents that were registered by all ML models and Limit Detector will be displayed.
Page topSelecting a date and time interval in the History section
Kaspersky MLAD lets you choose the date and a fixed time interval (scale) for displaying historical data or a user-defined time interval (for example, when an incident was detected).
To select the date for displaying historical data:
- In the main menu, select the History section.
- Click the
 button. In the opened window, select the date and time for which you need to display historical data on graphs.
 - Click the Apply button.
The vertical blue line on graphs will indicate the selected date and time (in the center of the graph).
- If you need to select other date and time (point) on the graph, click the
 button on the left of the time axis and select the relevant point.
The selected point will become the new center of the graph. The vertical blue dashed line will indicate the selected date and time.
To select a time interval for displaying historical data:
- In the main menu, select the History section.
- On the opened page, do one of the following:
- If you need to display data for a fixed time interval, select the relevant time interval from the drop-down list. The following time intervals are available by default:
- 1, 5, 10, 15, and 30 minutes
- 1, 3, 6, and 12 hours
- 1, 2, 15, and 30 days
- 3 and 6 months
- 1, 2, and 3 years
If necessary, the system administrator can create, edit, or delete time intervals.
- To display data for a custom time interval, click
 on the left of the time axis, select an interval on the time axis, and click
  . If you need to change the scale again, repeat this step.
- If you need to display data for a fixed time interval, select the relevant time interval from the drop-down list. The following time intervals are available by default:
The graphs for the selected preset will display the tag values and inference results for the selected ML model elements, for the chosen time interval.
Page topNavigating through time in the History section
Kaspersky MLAD provides the capability to navigate through time for convenient viewing of historical data.
To use time navigation when viewing data:
- In the main menu, select the History section.
- On the opened page, select the time interval for the data that you want to view.
- Use the
 and
and  buttons in the upper part of the page to move along the time axis to the right or left.
The time axis for viewing historical data on the graph will shift to the selected time interval.
Navigating through time
On graphs, a vertical blue dashed line indicates the midpoint of the selected time interval and matches the selected date and time. If an interval of 1 day is selected, the graph displays historical data for the 12-hour periods before and after the selected date and time relative to the dashed line. If necessary, you can change the time interval.
Page topConfiguring how graphs are displayed in the History section
Kaspersky MLAD lets you configure the settings for displaying graphic areas of presets in the History section.
To customize the appearance of graphic areas:
- In the main menu, select the History section.
- On the opened page, click the button in the upper part of the screen.
The Graph display settings pane appears on the right.
- In the Graph height drop-down list, select one of the following values: 55 px, 110 px, 145 px, 190 px.
By default, the Graph height parameter is set to 55 px.
- Turn on the Show observation graphs in selected color toggle switch, and select a color in the Color of observation graphs field as needed.
- Turn on the Show prediction graphs in selected color toggle switch, and select a color in the Prediction graph color field as needed.
- Use the Tag name and description toggle switch to enable or disable display of the tags descriptions and names on the left of the graphs.
- Use the Predicted tag value toggle switch to enable or disable display of the predicted tags values on graphs.
- Use the Individual tag error toggle switch to turn on or off the display of individual tag value prediction errors on graphs.
- Use the Display indicators for all incidents toggle switch to enable or disable display of the dot indicators for incidents registered by all ML models or Limit Detector.
If this switch is disabled, only the dot indicators for incidents that were registered by the selected ML model elements will be shown.
- If you need the graphs to display the defined technical limits for tags:
- Turn on the Blocking threshold toggle switch.
- If you need to always display the defined technical limits, turn on the Always display blocking threshold toggle switch.
If this switch is disabled, the technical limits will be displayed only if a tag value is approaching the corresponding limit in the graph area displayed on the screen.
- Use the Additional threshold lines toggle switch to enable or disable the display of additional threshold lines on the graph.
- Click the Close button to return to viewing graphs in the History section.
The defined settings for displaying graphic areas of presets in the History section will be applied.
Page top