Contents
- Working with incidents and groups of incidents
- About incidents
- About incidents detected by a predictive element of an ML model
- About incidents detected by an ML model element based on a diagnostic rule
- About incidents detected by an ML model element based on an elliptic envelope
- About incidents detected by the Limit Detector
- About incidents detected by the Stream Processor service
- About anomalies
- Scenario: analysis of incidents
- Viewing incidents
- Viewing the technical specifications of a registered incident
- Viewing incident groups
- Studying the behavior of the monitored asset at the moment when an incident was detected
- Adding a status, cause, expert opinion or note to an incident or incident group
- Exporting incidents to a file
- About incidents
Working with incidents and groups of incidents
The Kaspersky MLAD web interface provides the capability to investigate registered incidents. Depending on the type of the registered incident source, information about the incident and the methods you can use to investigate it may differ.
The functionality is available after a license key is added.
You can perform the following actions for any incident:
- Analyze the incident details.
- Find out if any similar incidents were detected previously.
- Study the behavior of the monitored asset at the moment when the incident was detected.
- Leave a note or expert opinion for a registered incident or incident group.
The Incidents section displays a column graph showing the incidents that match the filtering criteria specified under the graph. The graph displays statistics on the registered incidents for the period specified above the graph.
The graph can display up to 60 bars. If the specified period does not exceed 60 days, incidents on the graph are grouped by days. If the specified period is between 60 days and 60 weeks, incidents on the graph are grouped by weeks. If the specified period is longer than 60 weeks, incidents on the graph are grouped by months.
Hovering the mouse pointer over a bar of the graph displays a window showing the number of registered incidents per corresponding time period. Upon clicking a bar, the graph and in the table below display information about the incidents registered during the corresponding time period.
In this section, you can view individual incidents as well as groups of incidents.
Incidents tab
The Incidents tab shows a table of registered incidents. Incidents are sorted by date in descending order, with the newest incidents shown first.
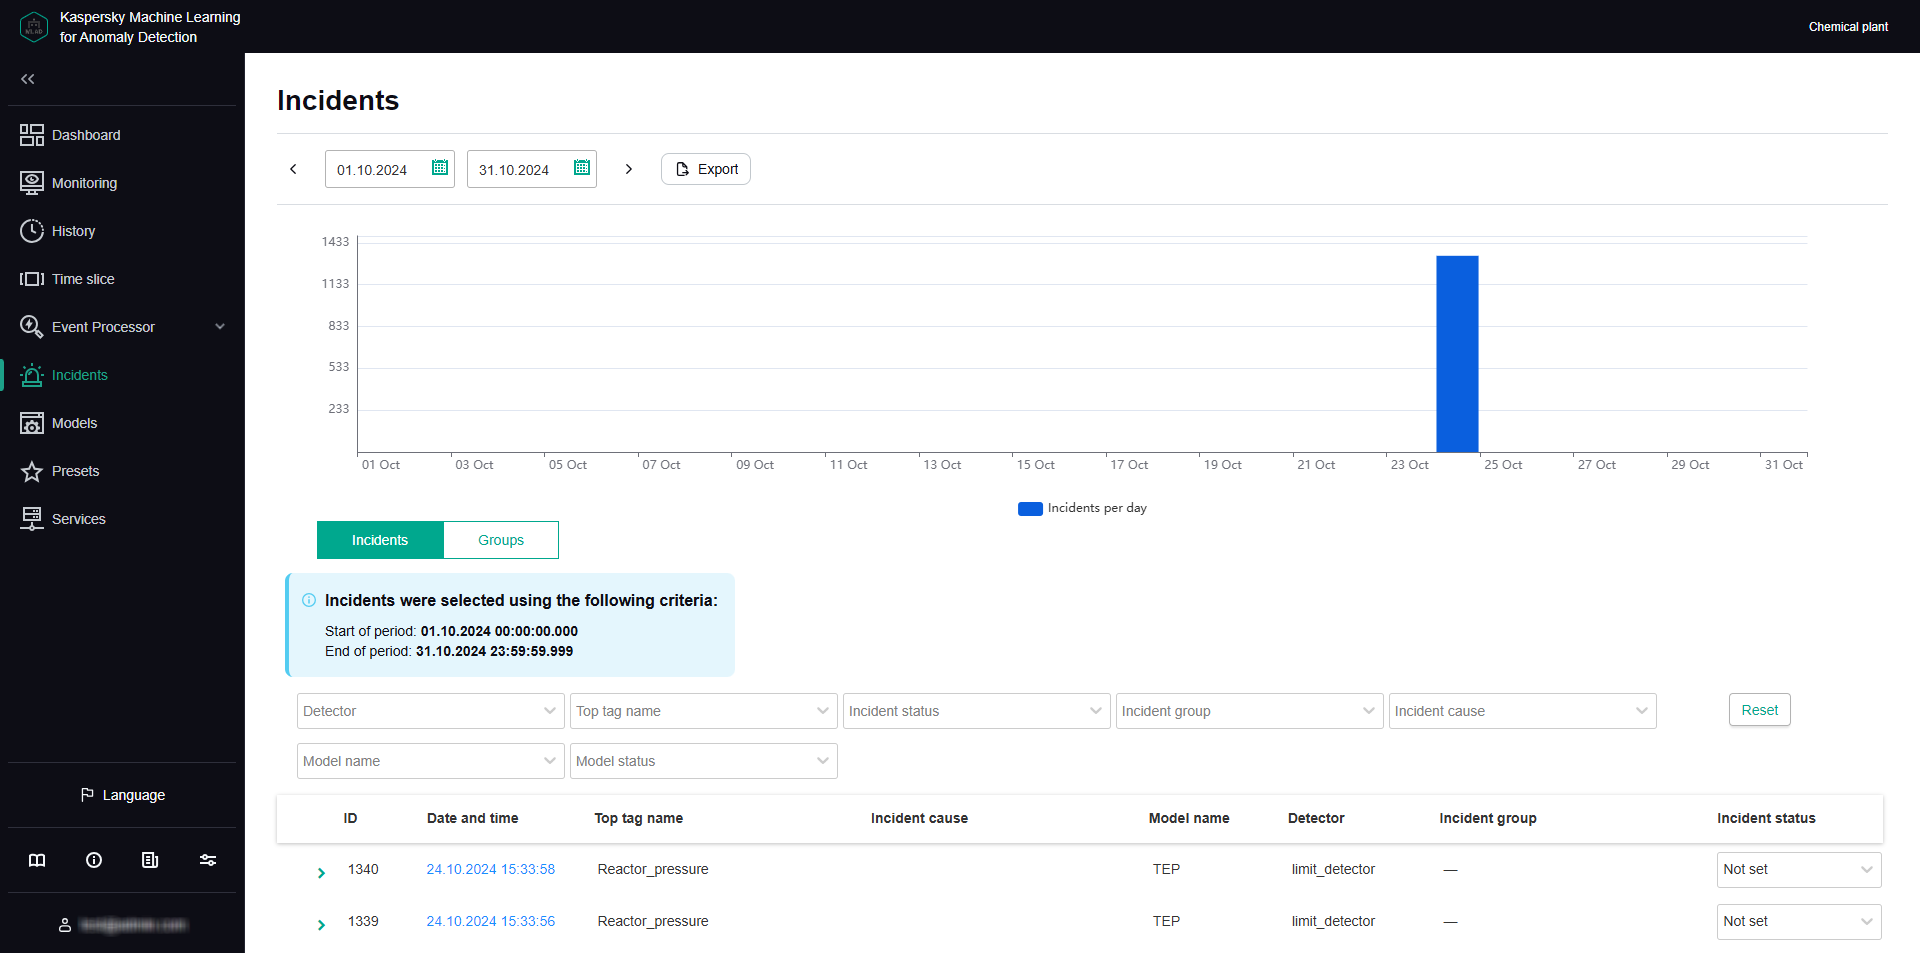
Incidents tab
You can go to the History section by clicking the date and time of the incident.
Groups tab
The Groups tab shows a table of incident groups. Kaspersky MLAD automatically generates groups of similar incidents.
You can change the group name that was assigned automatically and set the status of incidents that belong to this group. You can also provide an expert opinion that contains the recommended actions to take in response to new incidents in this group, for example.
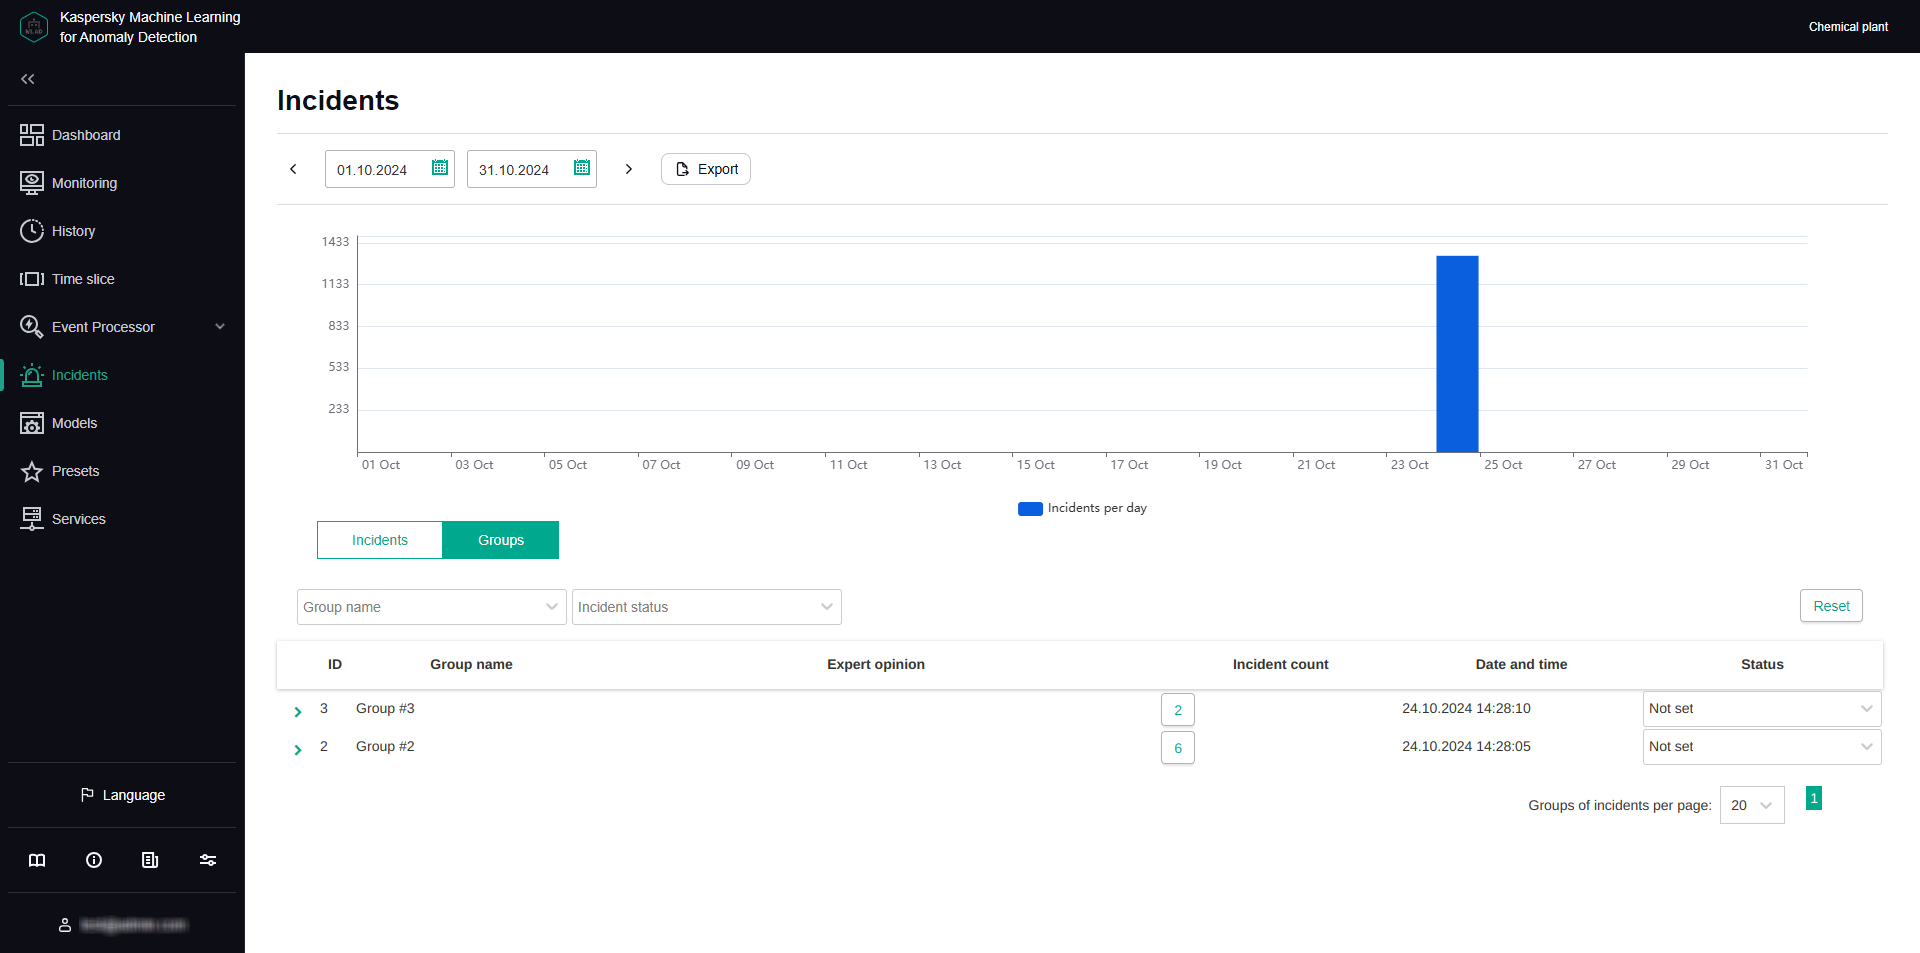
Groups tab
About incidents
An incident is an identified deviation from the expected (normal) behavior of a monitored asset.
Kaspersky MLAD supports incident registration for the following sources:
- ML model elements. An incident is recorded when the value of an ML model element artifact reaches the incident registration threshold set for that specific element. Incidents can be detected by predictive, diagnostic rule-based, and elliptic envelope-based ML model elements.
The registration of an incident may be delayed after the specified threshold is reached, depending on the configuration of the ML model element. When a certain threshold for registering an incident is met, the ML model element starts watching for unusual activity in the monitored asset for a specific period defined in the element settings. If the monitored asset exhibits anomalous behavior for a certain specified proportion of this interval, the ML model element registers an incident.
Kaspersky MLAD can suppress the registration of consecutive incidents from the same ML model element if these occur shortly after the first incident in the series. This uses Period of recurring alert suppression (sec), which you can define in the element settings.
An ML model element may continue to flag the same incident multiple times until the abnormal activity stops. You can control how often repeated incidents are recorded by adjusting the Reminder period (sec) and editing the element.
- Limit Detector. The system will record an incident whenever a tag value reaches the upper or lower limit.
- Stream Processor. An incident is recorded when the system notices that telemetry data is missing or when Kaspersky MLAD receives observations too early or too late.
When a deviation is detected, the corresponding source records the date, time and relevant deviation parameters, and saves this data as an entry in the Incidents section. If incident notifications for users or external systems are created in Kaspersky MLAD, information about an incident is sent to the intended recipients via the corresponding services of Kaspersky MLAD.
About incidents detected by a predictive element of an ML model
An ML model predictive element has been trained on a particular subset of tags, and it can anticipate current tag behavior. In this case, an incident is any substantial discrepancy between the observed (actual) values of tags and the predicted values of tags resulting from operations of the ML model element. In the model element settings, you can view which tags are analyzed by the ML model element (Input tags parameter) and which tags' behavior is predicted (Output tags parameter).
An ML model can include one or more elements running in parallel. In the History and Monitoring sections, you can select a specific element of the ML model to display the incidents registered as a result of a specific model element operation. The graph of the ML model element artifact shows registered incidents as colored dots at the bottom.
The artifact graph also displays cumulative prediction error value for the selected ML model element. Cumulative prediction error is an indicator of the difference between predicted values from actual values, calculated cumulatively for all tags included in the selected element of the ML model. The higher the prediction error value, the more the behavior of tags will differ from the expected (normal) behavior. The prediction error threshold is the critical cumulative prediction error value that, when reached, causes the ML model predictive element to register an incident. The artifact graph displays the cumulative prediction error as a red line, and the prediction error threshold, as an orange line. The area on the graph where the forecast error exceeds the specified threshold is colored red.
The ML model artifact graph is displayed at the bottom of the History section (see figure below).
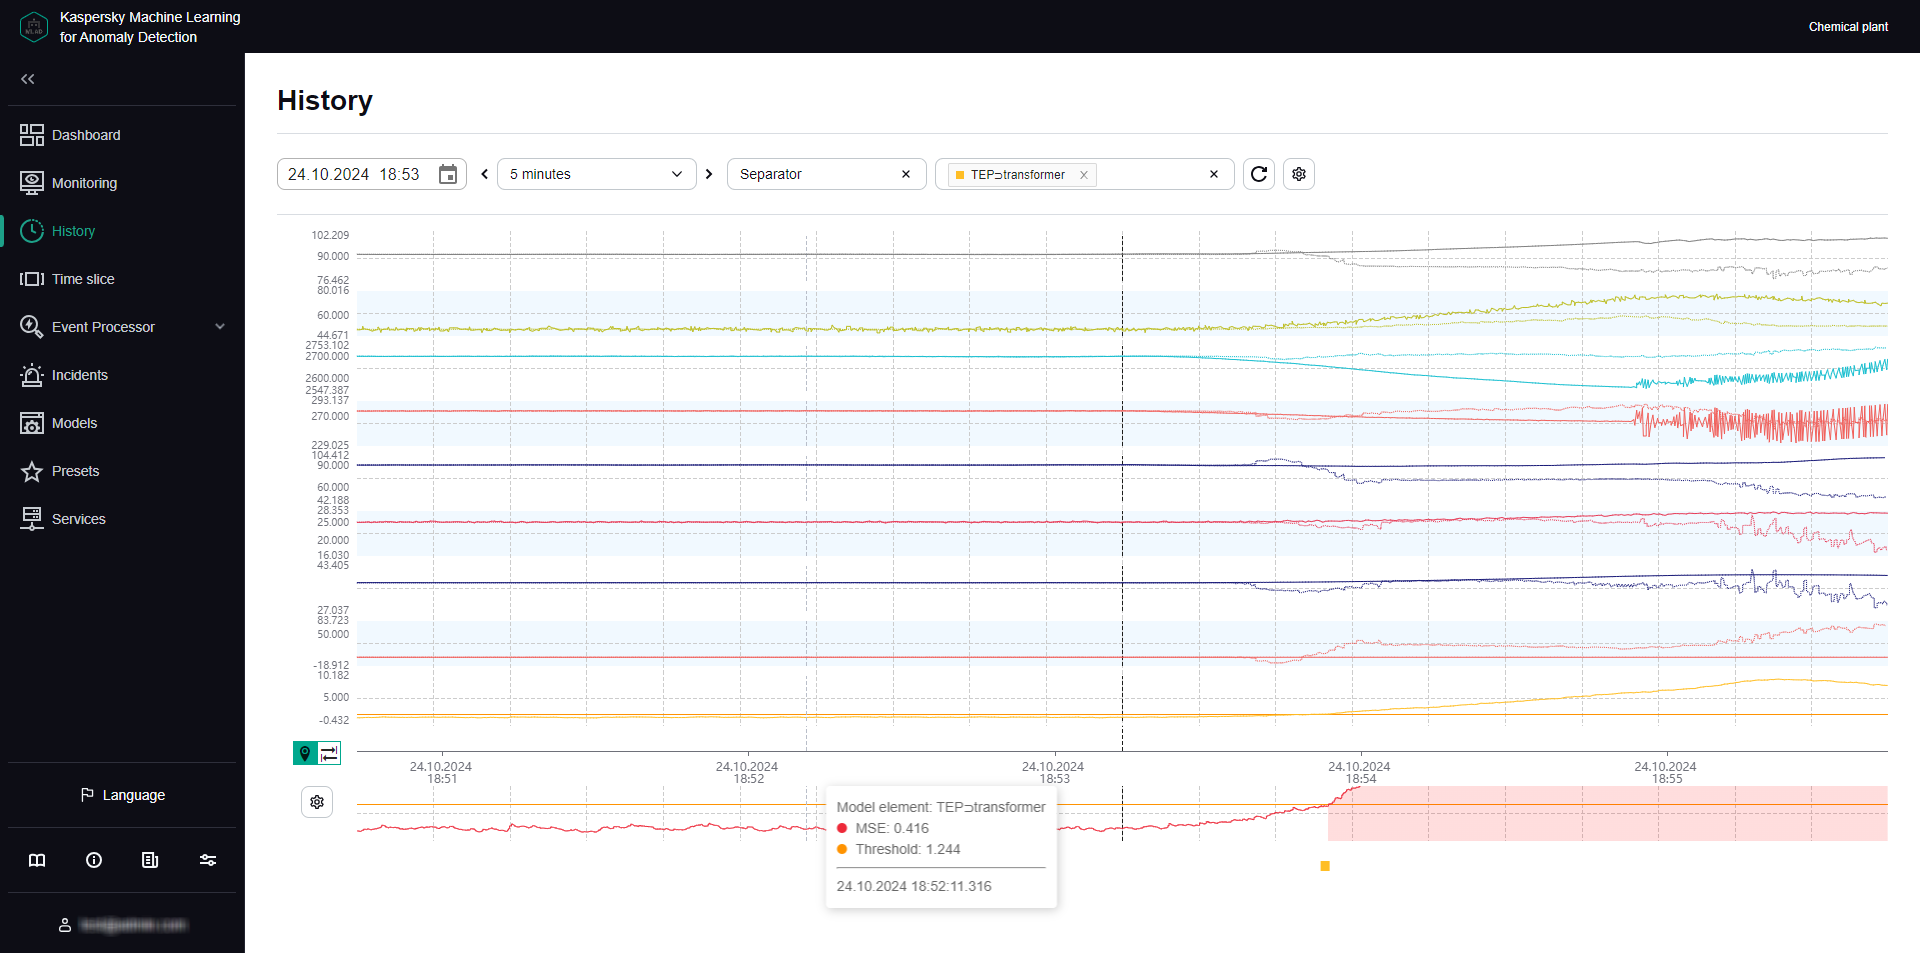
ML model element artifact graph under History
For each incident, the application automatically identifies tags with the greatest actual value deviations from those predicted by the ML model. These tags generate a Tags for incident #<incident ID> preset. This preset is displayed under History when you click the incident date and time in the incidents table. Tags that are included in the Tags for incident #<incident ID> preset are sorted in descending order of their deviation from expected (normal) behavior. The tag with the greatest deviation from the predicted value is displayed in the incidents table under Incidents. The incidents table also indicates the prediction error threshold and the actual prediction error value at the moment when the incident was registered.
Information obtained when viewing the Tags for incident #<incident ID> preset is not actually diagnostic information for the purposes of identifying the causes of an incident, but you can still use this information when analyzing the values of tags with the largest deviations in behavior. The tag whose behavior was the first to deviate from the norm and caused subsequent deviations in other tags is referred to as the causal tag. In some cases, the causal tag may not be at the top of the list in the Tags for incident #<incident ID> preset and may even be entirely absent from this preset. This could happen due to the following reasons:
- Minor amplitude changes in the behavior of the causal tag had a multiplier effect and caused significant deviations in other tags that were included in the Tags for incident #<incident ID> preset.
- The causal tag is not analyzed by the ML model, and Kaspersky MLAD registers derivative changes in the behavior of tags caused by the deviation of the causal tag.
- Changes in the behavior of the causal tag had a delayed effect, and by the time an anomaly occurred in the operation of the monitored asset, the behavior of the causal tag returned to normal.
About incidents detected by an ML model element based on a diagnostic rule
An ML model can include one or more elements based on diagnostic rules. Each diagnostic rule results in the following values being obtained that are calculated at each point in time:
- Value
0. The diagnostic rule was not triggered or applied at this moment. - Value
1. The diagnostic rule was triggered at this moment. - Intermediate values from
0to1are possible in individual cases. The diagnostic rule was partially triggered at this moment.
Once the result surpasses the threshold set for the diagnostic rule, which is generally equal to one, the element based on the diagnostic rule records an event. For each incident registered by the diagnostic rule, Kaspersky MLAD automatically creates a Tags for incident #<incident ID> preset. This preset can be selected under History when you click the incident date and time in the incidents table. This preset contains the value obtained as a result of the work of the diagnostic rule, as well as the tags included in this rule.
Page topAbout incidents detected by an ML model element based on an elliptic envelope
An ML model elliptic envelope is trained on a specific subset of tags, and it can detect outliers (anomalies) in a dataset. The training of the ML model creates an elliptical region within the phase space. Any data points that fall within this ellipse are considered normal. When states are detected that are a distance from the center of the elliptical region equal to or greater than the predetermined threshold, the element based on the elliptic envelope registers an incident. In the model element parameters, you can view which tags are parsed by the element (Input tags).
The most relevant tags are automatically defined for every incident registered by an element based on an elliptic envelope. These are tags whose removal from the ML model causes the least deviation from the normal state. These tags generate a Tags for incident #<incident ID> preset. The preset can be selected under History when you click the incident date and time in the incidents table. Tags that are included in the Tags for incident #<incident ID> preset are sorted in descending order of their deviation from expected (normal) behavior. The tag with the greatest impact on incident registration is displayed in the incidents table under Incidents.
An ML model may include one or more elements running in parallel. In the History and Monitoring sections, you can select a specific element of the ML model to display the incidents registered as a result of a specific model element operation. The graph of the ML model element artifact shows registered incidents as colored dots at the bottom.
Page topAbout incidents detected by the Limit Detector
If the Limit Detector is enabled, Kaspersky MLAD automatically monitors all tags having blocking thresholds specified for the tag when using any ML model. Blocking thresholds can be defined in a tag configuration imported into Kaspersky MLAD at the start of operations. You can edit the tag blocking thresholds in the application's web interface.
To visually monitor the position of a tag graph relative to the blocking thresholds in individual graphic areas under History and Monitoring, you can turn on Blocking threshold and Always display blocking threshold. If Always display blocking threshold is disabled, the upper or lower threshold line is displayed only if the tag values have reached the corresponding threshold during the time interval displayed on the screen. The Limit Detector identifies and registers events regardless of whether or not the Always display blocking threshold option is enabled.
When the tag value reaches its upper or lower technical limit, the Limit Detector registers an incident. This tag is displayed in the incidents table in the Incidents section. The incidents table also shows the blocking thresholds of the tag and the actual value of a tag that violated one of these limits. For each incident registered by Limit Detector, Kaspersky MLAD automatically creates a Tags for incident #<incident ID>. This preset can be selected under History when you click the incident date and time in the incidents table. This preset includes the only causal tag of the incident.
Page topAbout incidents detected by the Stream Processor service
The Stream Processor service gathers real-time telemetry data received from the monitored asset at arbitrary points in time and converts this data to a uniform temporal grid (UTG). When analyzing incoming data, the Stream Processor service can detect losses of telemetry data and observations that were received by Kaspersky MLAD too early or too late. The Stream Processor service registers an incident in such cases.
Incidents detected by the Stream Processor service are displayed in the incidents table of the Incidents section. Each incident registered by the Stream Processor service is automatically assigned one of the following incident types:
- No data – input data stream for a specific tag was terminated or interrupted.
- Clock malfunction – observations received by Kaspersky MLAD too early are detected.
- Late receipt of observation – observations received by Kaspersky MLAD too late are detected.
The Stream Processor service transfers the UTG-converted data to the ML model of the Anomaly Detector service.
Page topAbout anomalies
An anomaly is any deviation in a monitored asset's behavior that is abnormal, not provided for by the current work procedure, and not normally caused by the industrial process.
Kaspersky MLAD registers only incidents. A specific incident can be identified as an anomaly only by an ICS specialist after conducting an analysis of incidents registered by the application. An incident analysis may result in one of the following conclusions:
- The incident is an anomaly that requires certain actions from a responding ICS specialist.
- The incident is not actually an anomaly, but instead was a false positive by the ML model.
If an ML model consistently produces false positive results, you need to find out what is causing the decline in performance, adjust the settings of the ML model and/or its elements, or further train the elements.
- The ML model worked correctly, but the incident is not an anomaly.
The incident was a result of temporarily switching the monitored asset to a non-standard operating mode (preventative maintenance or testing) or was caused by short-term impacts from non-standard external factors (unusual weather conditions or startup of a neighboring unit). The ICS operator does not need to take any response action.
Incidents are analyzed and assessed by a subject-matter expert. In some cases, like when registering incidents detected by diagnostic rules or incidents that occur repeatedly, similar incidents can be automatically grouped and assessed.
The ML model might miss a real anomaly. In this case, the anomaly will not be correlated to any registered incidents and will not be reflected in the Kaspersky MLAD history. If observations from an expert, an ICS operator, or external sources reveal repeated instances of an ML model failing to activate, you need to identify the cause of the decline in performance, adjust the settings of the ML model and/or its elements, and further train the elements of the ML model.
New
, , and values of the event parameters detected by the Event Processor service in the stream of incoming events can also indicate an anomaly in the operation of a monitored asset. When new events, patterns or values of event parameters are detected, the Event Processor service does not register incidents. To view new detections in the Event Processor section, you can view the history of registered patterns, filtering them by the New type. You can also create a monitor for tracking new events, patterns, or values of event parameters. The Event Processor service activates the monitor when it detects events, patterns, or event parameter values that match the specified search criteria. When the specified threshold for the number of monitor activations in a sliding window is reached, the Event Processor service sends an alert about the monitor activation to the external system using the CEF Connector. Page top
Scenario: analysis of incidents
This section describes the sequence of actions required when analyzing incidents registered by Kaspersky MLAD.
The functionality is available after a license key is added.
The incident analysis scenario described in this section is not a precisely regulated procedure. The specific scope and sequence of actions taken to investigate an incident and identify its cause depend on the particular subject area, the knowledge level of the process engineer or ICS expert investigating the incident, and the availability of additional information on the monitored asset.
The incident analysis scenario consists of the following steps:
- Viewing information about a registered incident
The Incidents section displays all incidents registered by Kaspersky MLAD, and provides detailed information about their registration time, the ML model that registered the incident, and an expert opinion if one was added. You can proceed to view incident information in one of the following ways:
- Viewing the latest incidents in the Dashboard section
If you want to view a recently detected incident, in the Dashboard section, click the date and time of the relevant incident in the Latest incidents table. In the History section that opens, in the lower part of the page, click the dot indicator in the artifact graph section to view a specific incident. The Incidents section opens showing only the incidents that were registered in the specific time interval represented by the selected dot indicator (the interval is displayed above the incidents table).
- Viewing incidents in the Incidents section
If you know the date and time when an incident was registered, select the corresponding incident in the Incidents section. You can change the time interval for the displayed incidents by using the bar graph or the date selection field in the upper part of the page.
- Navigating from an incident notification received by email
If an incident notification was created for you, you will receive the notification by email when an incident is registered. The email message contains the time when the incident began, the top tag, and a link to proceed to the History section in the Kaspersky MLAD web interface. You can use this link to proceed to the start of the incident in the History section. At the bottom of the History page, click the dot indicator that corresponds to the incident start time. The Incidents section opens showing only the incidents that were registered in the specific time interval represented by the selected dot indicator (the interval is displayed above the incidents table).
When you find a record about the required incident, click the
 button to view detailed information about the incident.
 - Viewing the latest incidents in the Dashboard section
- Viewing information about similar incidents
When two or more similar incidents are detected, Kaspersky MLAD automatically combines them into a group. In the incidents table in the Incidents section, the group associated with the incident is displayed in the Incident group column. If nothing is indicated for the selected incident in this column, this means that Kaspersky MLAD has not yet detected incidents similar to this particular incident.
To view all incidents in a group, select the Groups tab and click the
button next to the relevant group. The table displays information about the incidents assigned to the selected group, as well as an expert opinion if it was added. Read the expert opinions for individual incidents and for the group. - Studying the behavior of the monitored asset at the moment when an incident was detected
Study the behavior of the monitored asset at the moment when the incident was detected.
- Analyzing the incident
Analyze the incident while considering the specific details of incident registration depending on the type of the source that registered the incident:
- Forecaster. A predictive element of the ML model registers incidents when there is a significant discrepancy between observed (actual) tag values and predicted tag values. Based on information obtained when viewing the automatically generated Tags for incident #<incident ID> preset and considering the available expert knowledge on the monitored object, form a hypothesis regarding which tags could have caused the anomaly and select the appropriate preset after studying their behavior. Analyze the graph of the ML model element artifact, move back in time from the moment the prediction error threshold was reached, and examine the behavior of tags at the moment when the prediction error values started to grow.
- Rule Detector. For each incident registered by an ML model element based on a diagnostic rule, the application automatically creates the Tags for incident #<incident ID> preset, which includes the value obtained as a result of the diagnostic rule operation and which caused the incident registration.
- Elliptic envelope. An ML model elliptic envelope records incidents whenever it detects states that are a distance from the center of the normal state cluster equal to or greater than a predefined threshold. When registering an incident, the application generates a Tags for incident #<incident ID> preset that includes the tags whose exclusion from the ML model results in the smallest deviation of observations from the normal state. Analyze the graph of the ML model element artifact, move back in time from the moment the threshold was reached, and examine the behavior of tags at the moment when the deviation started to grow.
- Limit Detector. For each incident that was registered by the Limit Detector, the application automatically creates the Tags for incident #<incident ID> preset, which includes a single causal tag for the incident.
- Stream Processor. The Stream Processor service registers incidents up until telemetry data is transmitted to the ML model for processing. Incidents are registered if data loss is detected or if observations are received by Kaspersky MLAD too early or too late.
- Adding a status, cause, expert opinion or note to an incident or its incident group
For each incident, add an expert opinion or note in which you can specify whether the incident is an anomaly. An expert opinion and note for an incident are displayed only when viewing a specific incident. If necessary, you can specify the status and cause of an incident. The cause of an incident is displayed in the incidents table and when viewing a specific incident. You can also add or edit the status and expert opinion for a group of incidents.
If you know in advance the expert opinion, cause, and/or status of incidents registered by a specific ML model element, you can enter that information in the element parameters. The expert opinion, reason, and/or status will be automatically assigned to incidents at the time of their registration by the element.
Viewing incidents
The functionality is available after a license key is added.
To view incidents that were registered during a specific period:
- In the main menu, select the Incidents section.
- In the upper part of the opened page, select the start and end dates of the period.
By clicking a bar in the bar chart, you can also refine the time period for which incidents are displayed. The column can represent a month, week, or day, depending on the length of the period set above the chart.
- If necessary, filter incidents according to the top tag names, incident groups, statuses as well as causes, names and statuses of the ML models that registered the incidents by selecting the values from the appropriate drop-down lists.
The table located in the central area of the page shows the incidents registered during a specific period according to the specified filtering criteria. When you click the Reset button, the table and the bar graph show all registered incidents.
The following information is displayed for each incident in the table:
- ID refers to the ID of the registered incident.
- Date and time refers to the date and time when the incident was registered.
Clicking the incident registration date and time opens the History section, where you can view information about the Tags for incident #<incident ID> preset generated for the registered incident.
- Top tag name is the name of the process parameter that had the greatest impact on incident registration.
- Incident cause refers to the cause of the registered incident as entered by an expert (ICS process engineer or operator) as a result of an incident analysis or assigned automatically according to the incident cause specified for the ML model element that registered the incident.
- Model name refers to the name of the ML model whose element registered the incident. This is absent if the incident was registered by Stream Processor.
- Detector refers to the type of the registered incident: Elliptic Envelope, Forecaster, Limit Detector, Rule Detector, or Stream Processor.
- Incident group refers to the name of the incident group to which the registered incident belongs.
If two or more similar incidents are detected, they are combined into a group that is created automatically by using the Similar Anomaly service. You can view incidents that belong to a particular group by selecting the group name from the Incident group drop-down list above the incidents table.
- Incident status refers to the status of the registered incident as entered by an expert (ICS process engineer or operator) as a result of an incident analysis or assigned automatically according to the incident status specified for the ML model element that registered the incident.
You can set the incident status based on analysis results by selecting the appropriate value from the drop-down list. After installation of Kaspersky MLAD, the following statuses of incidents and incident groups are available by default: Under review, Decision pending, Instructions issued, Problem closed, Cause unknown, Ignore and False positive. If necessary, the system administrator can create, edit, or delete statuses of incidents.
Viewing the technical specifications of a registered incident
The functionality is available after a license key is added.
In the Incidents section, you can view the technical specifications of registered incidents. To do so, click the ![]() button near the relevant incident in the incidents table. The following technical specifications will be displayed for the selected incident:
button near the relevant incident in the incidents table. The following technical specifications will be displayed for the selected incident:
- Incident is the section containing information about the incident.
- Top tag is a section that contains information about the tag that had the greatest impact on incident registration.
- Stream Processor service incident parameters is a section containing information about the parameters of the incident registered by the Stream Processor service. This group of parameters is displayed if the current incident is registered by the Stream Processor service.
- Incident cause is the field for selecting the cause of the incident. This field is completed by an expert (process engineer or ICS specialist). If necessary, the system administrator can create, edit, or delete causes of incidents.
An incident cause can be assigned automatically if a cause is specified in the parameters of the ML model element that registered the incident.
- Expert opinion is the field for adding an expert opinion based on an analysis of the registered incident. This field is completed by an expert (process engineer or ICS specialist).
An expert opinion can be assigned automatically if an opinion is specified in the parameters of the ML model element that registered the incident.
- Note is the field for entering a comment for the selected incident. If necessary, you can provide a comment for the incident.
Viewing incident groups
When two or more similar incidents are detected, Kaspersky MLAD automatically combines them into a group (using the Similar Anomaly service). This lets you analyze incidents with consideration of prior history and expert opinions that were generated for similar incidents. In the incidents table in the Incidents section, the group associated with the incident is displayed in the Incident group column. If nothing is indicated for the incident in this column, this means that Kaspersky MLAD has not yet detected incidents similar to this particular incident. Incidents can be regrouped, and the expert opinions that were added to these incidents are migrated to the new group. The group name is automatically assigned in the format Group #N (N is replaced by the sequence number of the group). If necessary, you can edit a group name.
The functionality is available after a license key is added.
To view incident groups:
In the main menu, select the Incidents section and select the Groups tab.
All incident groups for your monitored asset are displayed in the table located in the central part of the page.
The following information is displayed for each incident group in the table:
- ID is the incident group identifier.
- Group name refers to the name of the incident group.
- Expert opinion is a conclusion added by an expert (process engineer or ICS specialist) based on an analysis of the group of registered incidents.
- Incident count refers to the number of registered incidents included in the group.
You can proceed to view incidents of the group by clicking its incidents count.
- Date and time refers to the date and time when the incident group was created.
- Status refers to the status of the registered incidents in the group as entered by an expert (ICS process engineer or operator) as a result of an incident analysis or assigned to the incidents automatically according to the incident status specified for the ML model elements that registered the incidents.
You can set the incident group status based on analysis results by selecting the appropriate value from the drop-down list. After installation of Kaspersky MLAD, the following statuses of incidents and incident groups are available by default: Under review, Decision pending, Instructions issued, Problem closed, Cause unknown, Ignore and False positive. If necessary, the system administrator can create, edit, or delete statuses of incidents.
To view detailed information about an incident group:
- Click the button near the incident group.
A list of incidents in this group is displayed. The following technical specifications are displayed for each incident of the group:
- Incident date is the date and time when the incident was registered.
You can go to the History section by clicking the incident registration date.
- Top tag name is the name of the tag that had the greatest impact on incident registration.
- Top tag value is the value of the tag that had the greatest impact on incident registration.
- Relevant tags refers to a table that contains the identifiers of tags that influenced the identification of similar incidents and merging of these incidents into a group.
- Incident date is the date and time when the incident was registered.
- If you need to view the degree of influence a tag had on the formation of similar incidents, click the Relevant tags table cell containing the identifier of the relevant tag.
All table cells containing the selected tag ID are highlighted in green. The closer the green-highlighted cells containing the ID of the selected tag are to the first table column, the more impact that tag has when identifying and grouping similar incidents.
You can also add a status and expert opinion for the incident group.
Page topStudying the behavior of the monitored asset at the moment when an incident was detected
This section describes the sequence of actions required when studying the behavior of a monitored asset at the moment when an incident was detected.
The functionality is available after a license key is added.
Studying the behavior of a monitored asset consists of the following steps:
- Viewing the history of tags received for a monitored asset in the History section
You can proceed to view incident information in one of the following ways:
- If you want to view a recently detected incident, in the Dashboard section, click the date and time of the relevant incident in the Latest incidents table.
- In the Incidents section, click the date and time of the relevant incident in the incidents table.
- If an incident notification was created for you, you can proceed to view the incident by clicking the link from the email notification. The email message contains the time when the incident began, the top tag, and a link to proceed to the History section in the Kaspersky MLAD web interface.
In the History section, Kaspersky MLAD displays graphs of tags received from the monitored asset for which the selected incident was registered. The graphs display data for the Tags for incident #<incident identifier> preset, generated for the date and time when the selected incident was registered. This preset includes the tags whose behavior led to incident registration. Depending on the type of the source that registered an incident, this may involve the following tags:
- The tags for which the actual values showed the greatest deviations from the ML model's forecast, given that the incident was registered by the ML model predictive element.
- Tags included in a diagnostic rule and the value obtained as a result of the operation of this rule, if the incident was registered by the ML model element based on the diagnostic rule
- The tags whose removal from the ML model results in the least deviations of observations from the normal state, given that the incident was detected by the ML model element based on the elliptic envelope.
- A tag whose value was outside of the set blocking thresholds, if the incident was registered by the Limit Detector.
If necessary, you can select a different preset for displaying data received from the monitored asset at the moment when the incident was registered. The graph uses a vertical blue dashed line to indicate the date and time when the incident was registered.
Example tag graphs for a registered incident under History.
The tag graphs are displayed in the upper part of the History section. The graph of the ML model element artifact is displayed in the lower part of the History section.
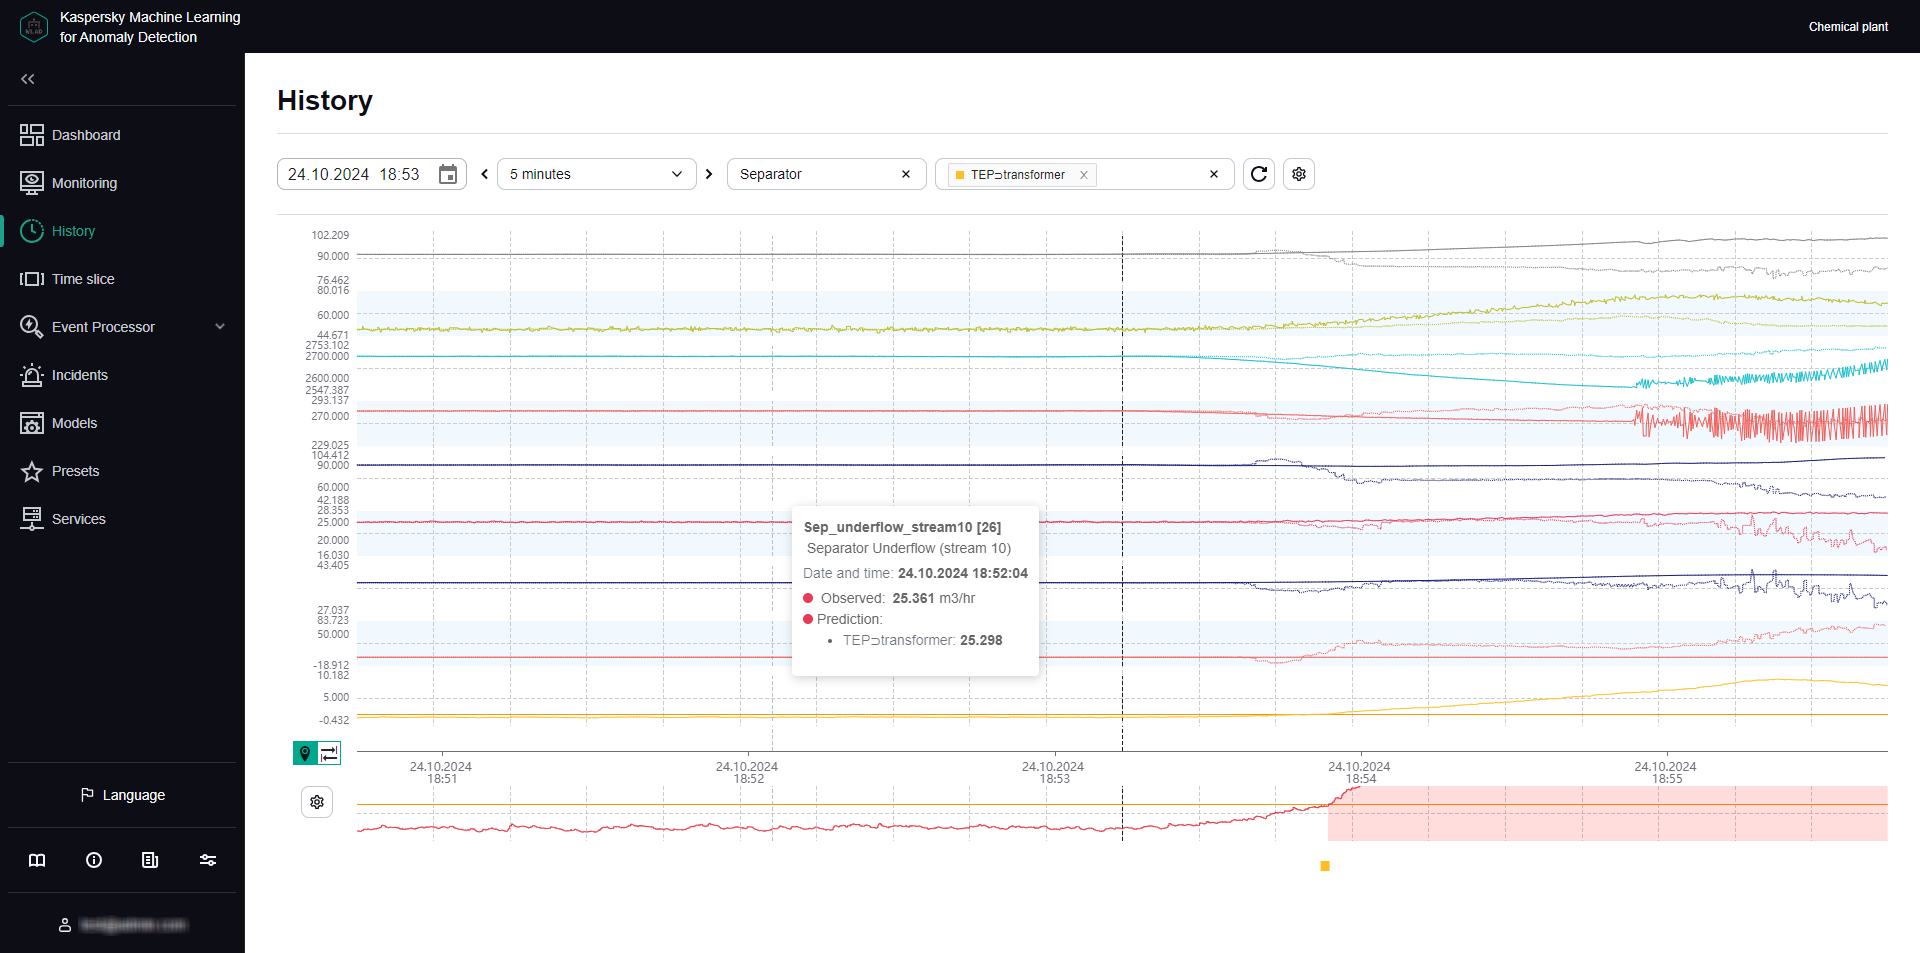
Tag graphs in the History section
- Configuring how data is displayed on graphs in the History section
Under History, you can turn on the display of predicted tag values generated by the predictive elements of the ML model. This lets you assess the difference between actual tag values and predicted tag values. Hovering over a tag graph displays tag details, such as the name, description, date and time when it was observed, value, and unit of measurement. You can also enable display of the tag name and description on the left of each tag graph.
- Configuring the time settings for displaying data in the History section
When studying the behavior of tags, you can change the scale of the time axis or move forward or backward in time through graphs. When displaying shorter time intervals on tag graphs, the History section may show more details of the behavior of tags that had been averaged when tag graphs for a longer period were displayed.
- Changing the vertical boundaries for displaying data in the History section
When displaying single graphic areas, the default vertical scale of the graph is automatically determined according to the minimum and maximum tag values within the displayed area. If minimum and maximum permissible values (blocking thresholds) are defined for a tag, you can control graph scale along the vertical axis by enabling Always display blocking threshold. If a tag value is within the permissible range, the vertical scale of the graph will be fixed by limit lines derived from the lower and upper thresholds of the tag graph. If the tag values go beyond the specified blocking thresholds, the vertical scale will be automatically changed to display the tag values exceeding the thresholds.
If graphic areas are displayed for several tags, you can adjust their vertical scale by using the parameters of the corresponding graphic area, which you can set when editing the selected preset.
Adding a status, cause, expert opinion or note to an incident or incident group
Kaspersky MLAD lets you add an expert opinion or note to a registered incident.
The functionality is available after a license key is added.
An expert opinion is normally added by an expert (process engineer or ICS specialist) and may contain an incident analysis or recommendations on resolving a problem that is indicated by an identified incident. An expert opinion can be added to an individual incident or to a group of incidents. If expert opinions were previously added to incidents that are later put into a group, these opinions will also be displayed in the group (linked to each specific incident). When incidents are regrouped, the expert opinion for an incident migrates together with the incident to the new group.
Notes are intended to aid discussions between experts or operators of facilities regarding recommended actions for analysis, investigation, and remediation of an incident. Each note includes information stating who added the note and when it was added.
You can also add the cause of the incident and the incident status determined by the expert based on the incident analysis results. A status can be assigned to an individual incident or to a group of incidents. When changing the status of a group of incidents, Kaspersky MLAD changes the status of the incidents that are part of this group. The status of an incident also affects whether a dot indicator for it will be displayed under Monitoring and History and whether an incident notification with this status will be sent. If the Notify about an incident check box is cleared for the incident status, the incident dot indicators to which this status was assigned automatically will not be displayed under Monitoring or History, and no email notifications about incidents will be sent. An incident status can be assigned automatically in one of the following cases:
- If the incident was automatically assigned to a group with that status.
- If the incident is registered by an ML model element that sets that incident status by default.
For the Problem closed and Ignore statuses, the Notify about an incident check box is cleared by default. If during registration, incidents are automatically assigned one of these statuses in accordance with the status specified for the ML model element that registered this incident, notifications about these incidents will not be sent.
If you know in advance the expert opinion, cause, and/or status of incidents registered by a specific ML model element, you can enter that information in the element parameters. The expert opinion, reason, and/or status will be automatically assigned to incidents at the time of their registration by the element.
Before adding a cause, status, note or expert opinion, you must conduct an analysis of the registered incident.
To add an expert opinion, status, cause, or note to an incident:
- In the main menu, select the Incidents section.
- If necessary, change the incident status by selecting one of the following statuses from the Incident status drop-down list: Under review, Decision pending, Instructions issued, Problem closed, Cause unknown, Ignore, or False positive.
By default, an incident is assigned the Unknown status. If necessary, the system administrator can create, edit, or delete statuses of incidents.
- To display detailed technical specifications of an incident, click the button near the relevant incident. In the details area that opens, you can do the following:
- If you need to add the cause of an incident, use the Incident cause field to select the cause of the incident.
If necessary, the system administrator can create, edit, or delete causes of incidents.
- If you need to add an expert opinion based on an analysis of a registered incident, click the
 button on the right of the Expert opinion field, enter the opinion in the opened field and press ENTER.
The expert opinion will be added to the selected incident and will appear in the incidents table in the Incidents section.
- If you need to add a note to an incident, enter your message in the Note field and click the Add note button.
You can provide a message up to 512 characters long.
- If you need to add the cause of an incident, use the Incident cause field to select the cause of the incident.
The status, cause, expert opinion, and note will be added to the incident and will be available to other users when viewing this incident.
When two or more similar incidents are detected, Kaspersky MLAD automatically combines them into a group. The group name is also automatically assigned in the format Group #N (N is replaced by the sequence number of the group). You can edit the group name, change the status of an incident group, and edit the expert opinion containing recommendations for analyzing similar events, for example.
To add a status and expert opinion to a group of incidents:
- In the main menu, select the Incidents section and click Groups.
- If necessary, change the incident group status by selecting one of the following statuses from the Status drop-down list: Under review, Decision pending, Instructions issued, Problem closed, Cause unknown, Ignore, or False positive.
When changing the status of a group of incidents, Kaspersky MLAD changes the status of the incidents that are part of this group. By default, a group of incidents is assigned the Unknown status.
If necessary, the system administrator can create, edit, or delete statuses of incidents.
- In the incident groups table, double-click the row of the incident group.
The Edit group window opens.
- To change the name of the incident group, enter a new name for the group in the Group name field.
- In the Expert opinion field, enter the text of the expert opinion (for example, recommendations for analyzing similar incidents).
- Click the Save button.
The status and expert opinion will be changed for the incident group and can now be viewed by other users in the Groups table in the Incidents section.
Page topExporting incidents to a file
Incidents registered for a specific period in Kaspersky MLAD can be exported to an XLSX file.
The functionality is available after a license key is added.
To save incidents registered for a specific period to a file:
- In the main menu, select the Incidents section.
- In the upper part of the opened page, select the start and end dates of the period.
- Click the Export button.
- Select a directory to save on your local drive, and save the file.
Incidents registered for the selected period in Kaspersky MLAD will be saved to an XLSX file on the local drive. The XLSX file can be opened in Microsoft Excel.
Page top