Contents
Managing presets
A preset is a set of tags generated by a user in arbitrary order or created automatically when an incident is registered. A set of tags in a custom preset can correspond to a certain aspect of the technological process or a section of the monitored asset.
You can create custom presets under Presets. The presets created by you are displayed only for your user account.
When creating presets, you can do the following:
- Select tags whose data to display on the graphs under History and Monitoring.
- Manage graphic areas within a preset. A graphic area is a collection of tags whose data is displayed together by overlapping on a single graph in History and Monitoring sections. A graphic area can display data for one or more tags in a preset.
- Control the display of preset tags in Time slice section. To do this, you can define expressions with basic arithmetic operations, such as addition, subtraction, multiplication, or division, to calculate the values of the tags within the preset.
Custom presets and their tags are displayed as a tree on the left side of the window. You can use the  and
and  buttons to the left of the preset names to display or hide tags included in the presets.
To view incoming data on the graphs under History and Monitoring, upload presets to Kaspersky MLAD from a JSON file.
You can edit presets, save them to JSON, or delete.
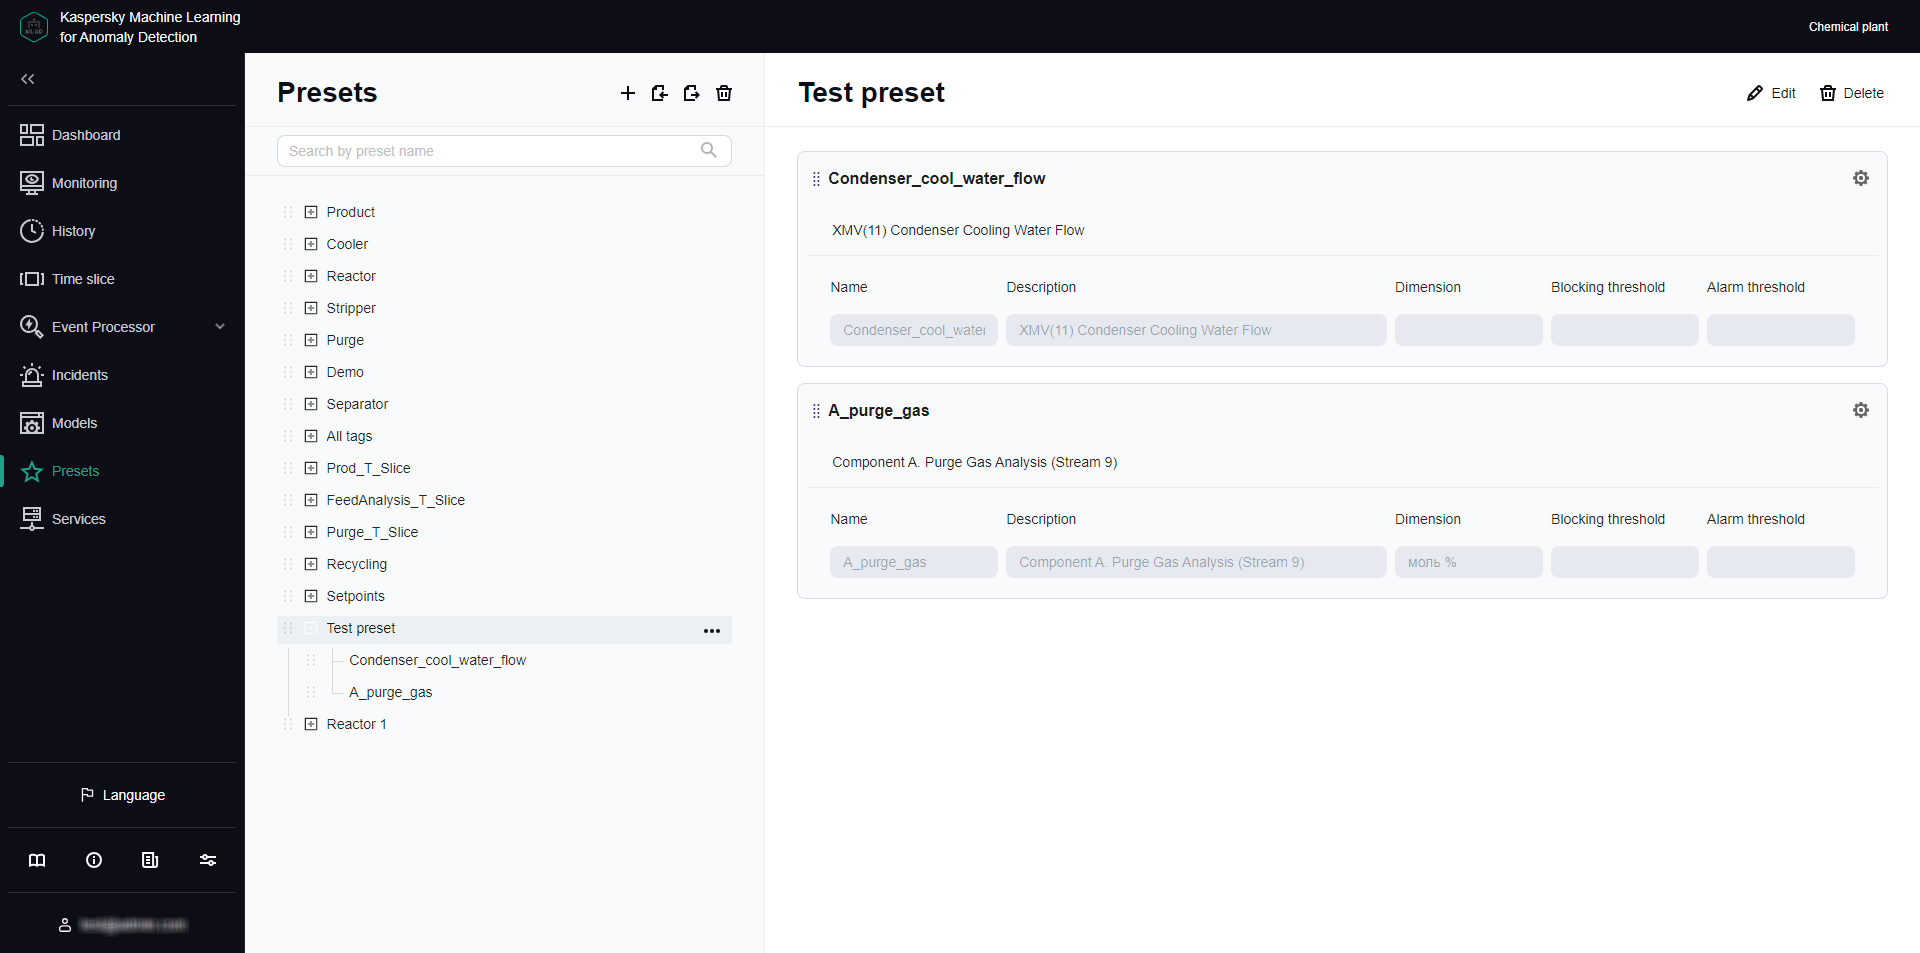
Presets section
Viewing a preset
You can view presets you created and uploaded to Kaspersky MLAD for your monitored asset.
To view a preset:
- In the main menu, select the Presets section.
- On the page that opens, select the relevant preset from the preset tree on the left.
A list of the graphic areas included in the selected preset will appear on the right.
- To view the details of the tags in a preset, do the following:
- Click the button on the left of the preset name.
A list of included tags is displayed under the selected preset.
- To view tag settings, click the tag in the preset.
A list of tag settings defined when the tag was created appears on the right.
- Click the
If necessary, you can change the preset or create a new preset.
Page topCreating a preset
Kaspersky MLAD allows you to create presets and configure how the results are displayed in the Time slice view.
You can define graphic areas. Graphic areas define the composition of tags whose data is displayed on the same graph and the place where the tag graph is displayed under History and Monitoring. Graphic areas that contain a single tag are referred to as single-tag graphic areas. Single-tag graphic areas are created automatically after you select tags for the preset.
If necessary, you can specify an expression to use for calculating the values of tags in the preset to display these values on the graph in the Time slice section. For example, you can use the specified expressions to view individual tag errors, predicted tag values, and the values of tags received from the monitored asset's sensors at the same time. You can use the following variables in your expressions:
- $tagValue is the received tag value (based on the results of monitoring).
- $tagError is the individual tag error.
- $tagPrediction is the predicted tag value.
- $tagX is the X coordinate of the monitored asset's sensor location specified when creating the tag.
- $tagY is the Y coordinate of the monitored asset's sensor location specified when creating the tag.
- $tagZ is the Z coordinate of the monitored asset's sensor location specified when creating the tag.
To create a new preset:
- In the main menu, select the Presets section and click the
 button.
The Create preset pane appears on the right. The asset tree appears on the left side of the pane.
- Specify the name of the preset in the Preset name field.
- In the asset tree, select the check boxes next to the tags that you want added to the preset.
To include all tags associated with a particular preset, choose that preset from Select preset. Find and add a tag by typing its name into the Search by tag name field, then select the relevant tag.
If you need to delete tags from a preset, clear the check boxes next to the tags you want to delete in the asset tree.
- Click Save selection.
Graphic areas automatically generated for each selected tag appear on the right. The number of graphic areas corresponds to the number of tags in the preset.
- To change the preset name, do one of the following:
- Click Delete all areas under Graphic areas to delete all graphic areas associated with the preset.
- Click
 in the upper right corner of the graphic area section and confirm your choice.
Deleting a graphic area does not remove the tags associated with it from the preset. You can add tags from deleted graphic areas to other areas.
- To edit an existing graphic area, do one the following:
- To add a tag to a graphic area, click the plus sign in the graphic area section and select a tag.
To copy the name of a selected tag, click the
 button on the right of the relevant name. You can use the copied tag name, for example, as the name of a graphic area.
 - To remove a tag from a graphic area, click the
 button next to the tag in the graphic area section.
- To add a tag to a graphic area, click the plus sign in the graphic area section and select a tag.
- To add a graphic area, do the following:
- Click Empty area.
- Select a tag to add to the graphic area.
If the selected tag is used within a single graphic area, the browser window displays a corresponding informational message.
To copy the name of a selected tag, click the
button on the right of the relevant name. You can use the copied tag name, for example, as the name of a graphic area. - To add a further tag or several tags to the graphic area, click the plus sign and select tags.
To copy the name of a selected tag, click the
button on the right of the relevant name. You can use the copied tag name, for example, as the name of a graphic area.
- To add single-tag graphic areas for tags unused in other graphic areas in the preset, click Single-tag graphs.
On the right, single graphical areas will be displayed for tags that were not used in previously created graphic areas.
- If you need to change the position of a graphic area within a preset, drag the graphic area up or down by holding the dots on the left (
 ) of its name.
 - To change the settings for displaying the graphic area under History and Monitoring, do the following:
- Click the
 button in the upper-right corner of the graphic area section.
A panel with the graphic area display settings appears on the right.
- In Graphic area name, provide a name for the graphic area.
- Enter a new graphic area description in Description.
- In the Axis scale mode drop-down list, select one of the following modes:
- Single axis mode: uses one Y-axis to display tag data.
- Cast mode: scales data along the Y-axis for each tag individually, irrespective of data from other tags in the graphic area.
- If you have selected single axis mode, do one of the following:
- Turn on the Automatic toggle button to automatically scale the graph according to the minimum and maximum data values for all tags in the graphic area.
- Turn off the Automatic toggle button and provide an upper and lower display boundary for tags in the graphic area.
If tag values go beyond the defined boundaries, they will not be displayed in the graphic area. The permissible boundaries for displaying tag values take priority over the display of blocking thresholds, even if the Always display blocking threshold function is enabled.
- To add further horizontal threshold lines for tags on the graph, click Add threshold line, and provide a threshold value and line color to display on the graph.
Additional threshold lines help to visualize tag value fluctuations within certain limits. You can add multiple threshold lines.
If you need to delete a previously added threshold line, click the
button next to the specified threshold value and the color of the relevant line. - Click the Save button.
- Click the
- To configure the display of preset in the Time slice section:
- Click Display preset in the Time slice section.
The Display preset in the Time slice section panel appears on the right.
- Turn on the Display preset in the Time slice section toggle button.
- In the X-axis caption field, enter the caption to be displayed on the x-axis.
- To display on the graph the values of preset tags calculated according to the expression, click Add graph and specify the following values:
- In the Name field, enter the name of the expression to be used for calculating the tag values.
- In the Y-axis caption field, enter the caption to be displayed on the y-axis.
- In the Expression for calculation field, enter an expression for calculating tag values.
You can define expressions with simple arithmetic operations (such as addition, subtraction, multiplication, and division). For example, if the sensors are reporting temperature in Fahrenheit, you can use the following expression to display the temperature in Celsius:
5/9 * ($tagValue - 32)
- In the Graph color field, select the color of the graph that will be displayed for the preset in the Time slice section.
If necessary, you can add multiple expressions for the Time slice section.
- If you want to delete an expression from a preset for the Time slice section, click the
 button on the right of the relevant expression.
 - Click the Save button.
- Click Display preset in the Time slice section.
- Click the Save button.
If any preset tags have not been added to at least one graphic area, the browser window displays an informational message. Tags that are not being used in graphic areas will not be displayed on the graphs in the History and Monitoring sections.
The new preset is displayed under Presets in the presets tree on the left and in the presets drop-down list under History and Monitoring. The preset for which step 11 of these instructions was performed will also be displayed in the drop-down list of presets in the Time slice section.
To change the position of presets in the presets tree, drag the preset up or down the tree by clicking and holding the dots ( ) to the left of the preset icon.
Loading presets from a file
You can load presets to Kaspersky MLAD from a JSON file.
To import presets into Kaspersky MLAD from a file:
- In the main menu, select the Presets section.
- In the upper part of the opened page, click the
 button.
 - Select the JSON file containing the preset description on your local drive.
The selected file will be imported into Kaspersky MLAD. The new presets will appear in the preset list in addition to the previously created presets. If the name of the preset imported from a file matches the name of an existing preset, the new preset will be assigned a name set in the JASON file.
Page topEditing a preset
You can edit the presets you created or uploaded.
You can remove tags from a preset using the vertical menu in the preset tree, if needed. To do this, open the vertical menu  to the right of the tag, select Delete tag, and confirm your choice.
To edit a preset:
- In the main menu, select the Presets section.
- Perform one of the following actions:
- In the preset tree on the left, select the preset and click Edit in the upper right corner of the page.
- In the vertical menu to the right of the preset, select Edit preset.
The Edit preset pane appears on the right. The asset tree appears on the left side of the pane.
- Edit the following preset settings if needed:
- Preset name.
- The composition of tags in the preset.
When deleting a tag from a preset, Kaspersky MLAD also deletes it from all graphic areas that have used the tag. A single graphic area is automatically created for each tag added to the preset.
- The composition of graphic areas in the preset.
Deleting a graphic area does not remove the tags associated with it from the preset. You can add tags from deleted graphic areas to other areas.
- The composition of tags in the graphic areas.
- The location of the graphic area within the preset.
- Settings for displaying the graphic area in History and Monitoring sections.
- Settings for displaying the preset in the Time slice section
- Click the Save button.
If any preset tags have not been added to at least one graphic area, the browser window displays an informational message. Tags that are not being used in graphic areas will not be displayed on the graphs in the History and Monitoring sections.
The changed preset will be updated in the presets tree under Presets and in the presets drop-down list under History and Monitoring. The modified preset whose display settings in the Time slice section have been defined will also be displayed in the preset drop-down list in Time slice.
To change the position of presets in the presets tree, drag the preset up or down the tree by clicking and holding the dots () to the left of the preset icon.
Saving presets to a file
You can save the presets you created and uploaded to Kaspersky MLAD as a JSON file.
To save the presets you created and uploaded to Kaspersky MLAD to a file:
- In the main menu, select the Presets section.
- In the upper part of the opened page, click the
 button.
The presets that were created and uploaded to Kaspersky MLAD will be saved to a JSON file on the local drive.
Page topDelete presets
You can delete the presets you created or uploaded.
To delete a preset:
- In the main menu, select the Presets section.
- Perform one of the following actions:
- In the preset tree, select the preset and click Delete in the upper right corner of the page.
- In the vertical menu to the right of the preset, select Delete preset.
- Confirm preset deletion.
The preset will be deleted from the list of presets.
To delete all presets:
- In the main menu, select Presets, and click
 above the preset tree.
 - Confirm preset deletion.
All presets will be deleted.
Page top