Contents
- Working with the main menu
- Scenario: working with Kaspersky MLAD
- Viewing summary data in the Dashboard section
- Viewing incoming data in the Monitoring section
- Viewing data in the History section
- Viewing data in the Time slice section
- Viewing data for a specific preset in the Time slice section
- Selecting a specific branch of the ML model in the Time slice section
- Selecting a date and time interval in the Time slice section
- Navigating through time in the Time slice section
- Configuring how graphs are displayed in the Time slice section
- Working with events and patterns
- Working with incidents and groups of incidents
- Scenario: analysis of incidents
- Viewing incidents
- Viewing the technical specifications of a registered incident
- Viewing incident groups
- Studying the behavior of the monitored asset at the moment when an incident was detected
- Adding a status, cause, expert opinion or note to an incident or incident group
- Exporting incidents to a file
- Managing ML models
- Scenario: working with ML models
- Working with markups
- Working with imported ML models
- Working with manually created ML models
- Cloning an ML model
- Working with ML model templates
- Changing the parameters of an ML model
- Training a neural network element of an ML model
- Viewing the training results of an ML model element
- Preparing an ML model for publication
- Publishing an ML model
- Starting and stopping ML model inference
- Viewing the data flow graph of an ML model
- Removing an ML model
- Managing presets
- Managing services
Working with the main menu
This section contains a description of user tasks performed in the main menu of the application.
Access to application functions in the main menu depends on the role assigned to the user account. Users with the system administrator role have access to all functions of the application.
Scenario: working with Kaspersky MLAD
This section describes the actions that can be taken by a user when working in the main menu of Kaspersky MLAD.
The scenario for working with the application consists of the following steps:
- Creating presets to monitor the section of the protected facility
For quick and more convenient access to necessary data, it is recommended to create presets that include tags corresponding to units of the industrial plant. If necessary, you can modify existing presets.
- Viewing historical data
Go to the History section to view historical data of process parameters, generated predictions and identified incidents resulting from Kaspersky MLAD processing. Select the relevant preset and specify the date and time interval for viewing the data. Use the navigation to view historical data.
- Monitoring in online mode
To view the received values of process parameters, their predicted values, and errors in the online mode, go to the Monitoring section. Select the relevant preset and time interval to display the incoming data.
- Viewing data in the Time slice section
To view the values of the process parameters received from the monitored asset's sensors at a certain point in time, go to the Time slice section. Select the relevant preset and specify the date and time interval for viewing the data. Use the navigation to view data.
- Working with incidents
Go to the Incidents section and view information about the registered incidents. Analyze the incidents and add expert opinions or comments where you can indicate if the registered incidents are anomalies.
If you are subscribed to incident notifications, you will receive an email message when an abnormal situation arises. The message will indicate the date and time when the incident began and will provide a link you can use to go to the History section.
- Working with events and patterns
View the events and patterns detected by the Event Processor in the Event Processor section. Create monitors to monitor specific events, patterns, and event parameter values.
Viewing summary data in the Dashboard section
The Dashboard section provides summary information on the number of tags and events received by Kaspersky MLAD, registered incidents, and the status of services.
The information on the page is divided into the following blocks:
- Incoming data is a graph that displays the number of tags and events received by Kaspersky MLAD. You can enable or disable the display of incoming tags and events on the graph by clicking the corresponding data signature legend under the graph. The left scale of the graph displays the range for the number of incoming tags per second. The right scale of the graph displays the range for the number of incoming events per second.
- Latest incidents is a table that contains information about the latest registered incidents.
- ID refers to the ID of the registered incident.
- Date and time refers to the date and time when the incident occurred.
- Detector is the name of the detector that registered the incident.
- Top tag refers to the name of a technological process parameter for which the incident is registered.
Clicking the plus (
 ) next to the incident in the incidents table opens a window with the technical specification of the selected incident and tag:
- Incident is a section containing information about the incident:
- Model name refers to the name of the utilized ML model.
- Model branch is the name of the ML model branch being used.
- Detector is the name of the detector that registered the incident.
- MSE value is the value of the individual mean square error.
- Threshold value refers to the MSE threshold value for the ML model branch in use at the time of incident registration.
- Top tag is the section containing information about the tag for which the incident is registered:
- Top tag name (top tag ID) is the name and ID of the tag whose behavior invoked registration of the incident.
- Top tag value is the value of the top tag registered when the incident occurred.
- Blocking threshold refer to the thresholds of the top tag values, upon reaching which it is necessary for the ICS to take emergency response measures.
- Description refers to a description of the top tag.
- Measurement units refer to the units for measuring the top tag values.
- Machine learning is a table that displays the status of services used for operation and training of the ML model, and the name of the active ML model.
- Status of services is a table that displays the status of each service.
You can proceed to the History section from the Dashboard section by clicking the date and time of an incident in the Latest incidents table. The History section displays detailed information about the incidents registered by Kaspersky MLAD.
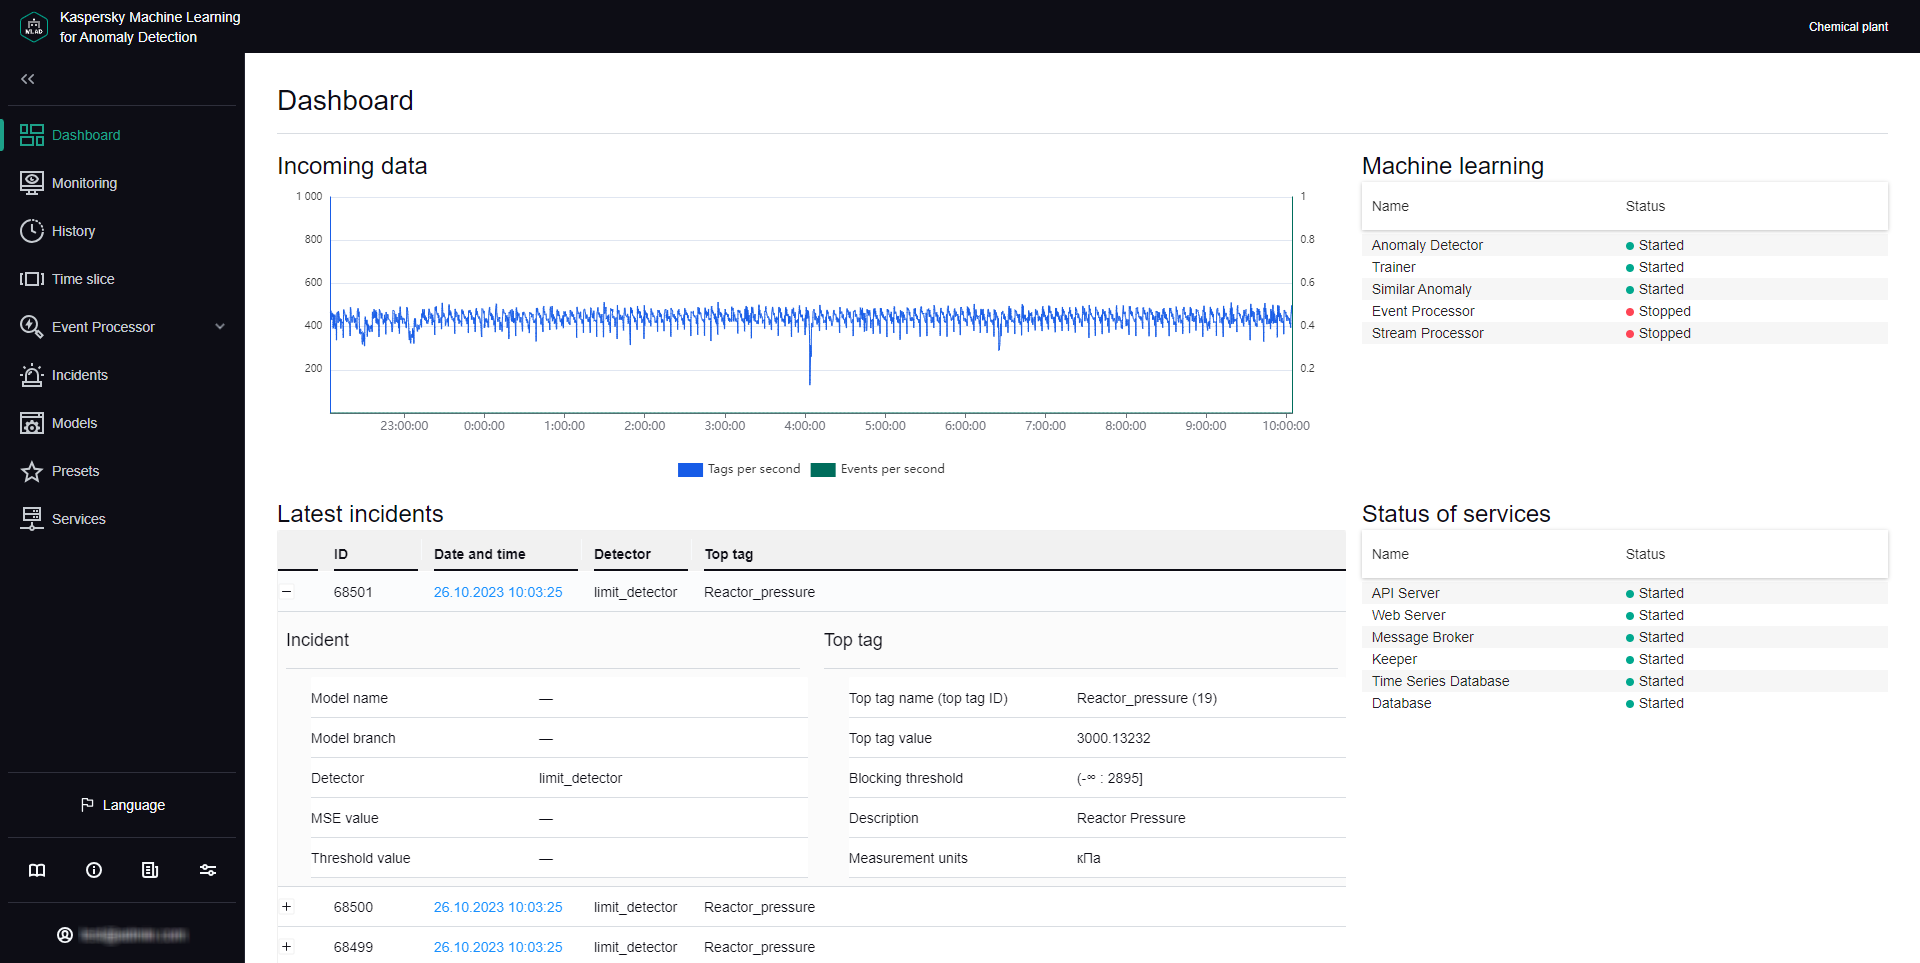
Dashboard section
Page topViewing incoming data in the Monitoring section
In the Monitoring section, you can view the real-time values of the tags included in the preset and their predicted values. You can view data on relevant tags by selecting the necessary preset from the drop-down list. This list includes presets that can be created in the Presets section. For each tag included in the selected preset, the incoming values are displayed as a graph. You can customize the display of graphs and select a branch of a specific ML model to view the operating results of this branch. For example, you can view the tag values predicted by the Forecaster Detector and their errors, or the values obtained as a result of the work of diagnostic rules.
The lower part of the page contains a section displaying the cumulative mean square error (also referred to as the "MSE" or "cumulative error"), and the number of registered incidents (color-coded dot indicators). The orange line shows the MSE threshold, above which Kaspersky MLAD registers an incident.
Depending on the selected time scale and the density of incidents, one dot indicator may correspond to one or multiple closely-spaced incidents that were registered by one or multiple different detectors. The color of dot indicators corresponds to the color of the ML model branch that was used to register the incident. Special colors are reserved for dot indicators that correspond to a group of incidents registered by different branches and for incidents registered by the Limit Detector.
There will be no MSE error value for incidents logged by the Rule Detector. When analyzing these incidents, pay attention to the rule triggering marker (color-coded dot indicator) below the MSE graph for the selected ML model branch.
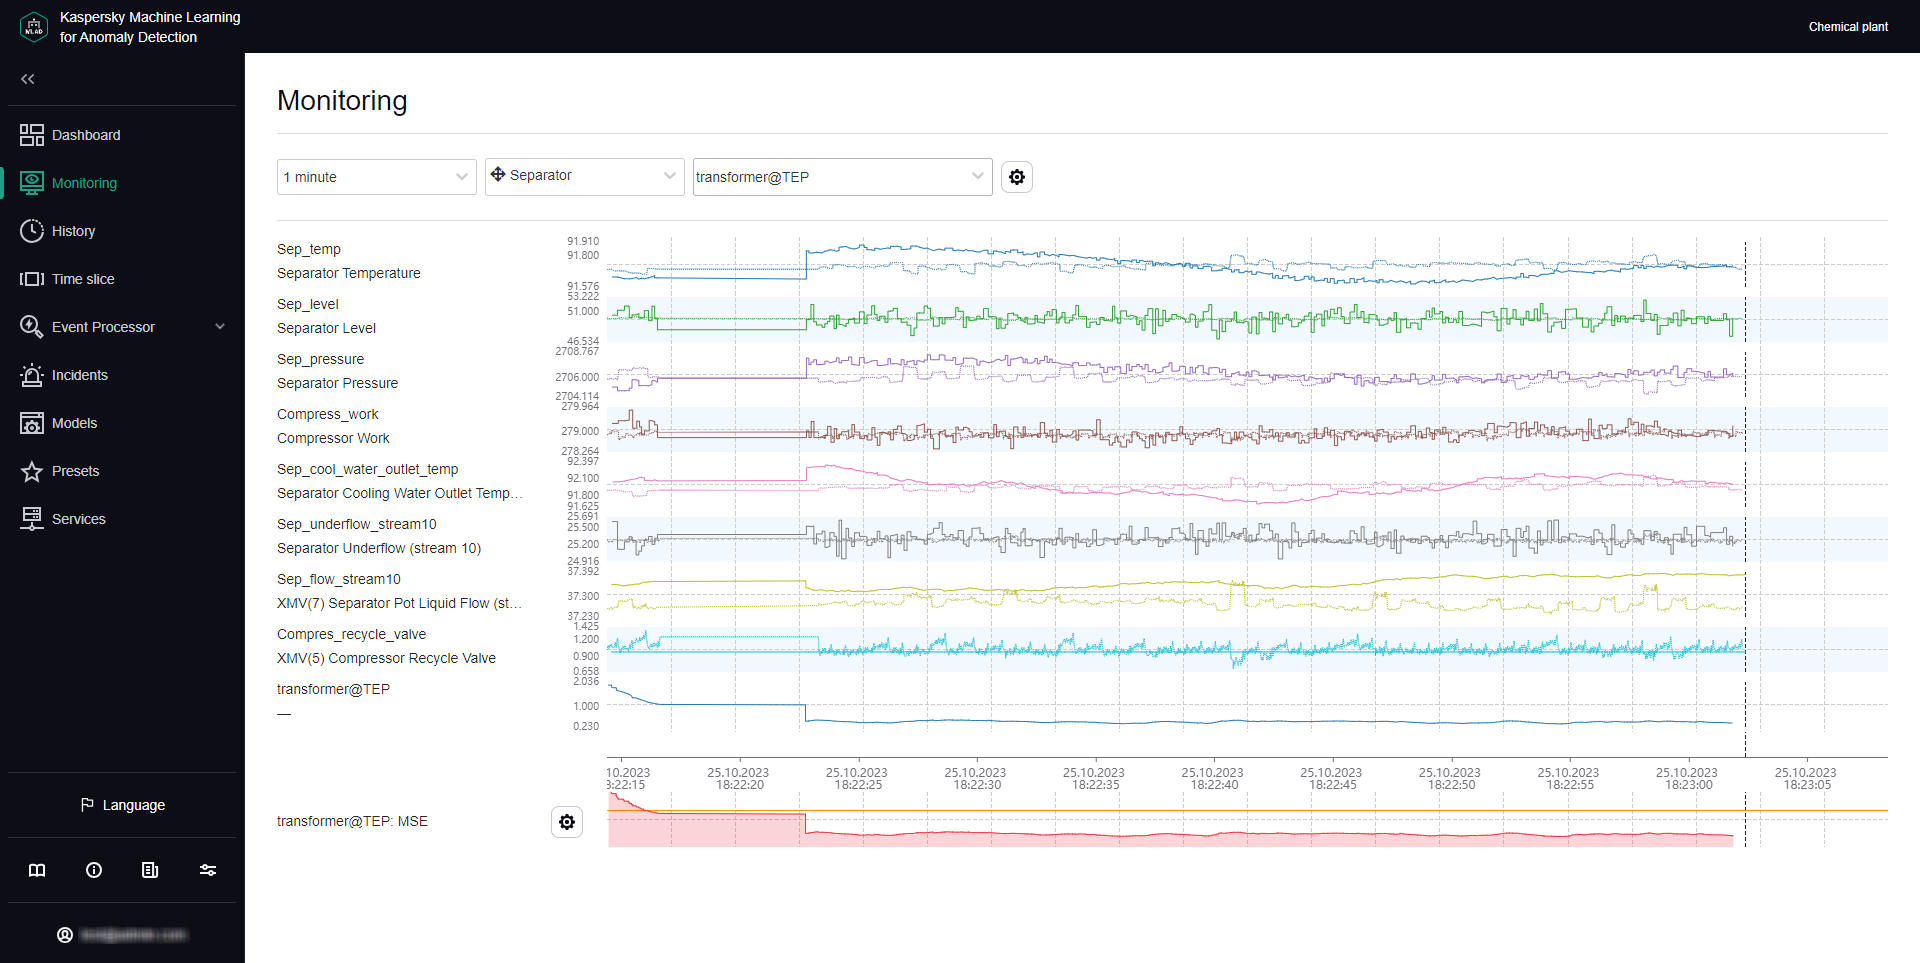
Monitoring section
Viewing data for a specific preset in the Monitoring section
Kaspersky MLAD allows you to select presets for which real-time data is displayed.
To view incoming data for a specific preset in real time:
- In the main menu, select the Monitoring section.
- On the opened page, select the relevant preset from the Preset drop-down list.
The page displays graphs for tags that are included in the selected preset.
If necessary, you can change the time interval for displaying data, customize the display of graphs, or select a specific branch of the ML model. You can also change which tags are displayed by editing the preset.
Page topSelecting a specific branch of the ML model in the Monitoring section
In the Monitoring section, you can view in real time the incoming values of tags included in the preset, their predicted values, and MSEs.
If the ML model used for a monitored asset has several branches for processing and predicting data, Kaspersky MLAD lets you select a specific branch of the ML model to display the operating results of the corresponding model element:
- For an ML model branch based on the Forecaster Detector, operating results are displayed as predicted values for specific tags, individual errors in the prediction of specific tags, and cumulative MSE and dot indicators of incidents registered by the detector.
- For an ML model branch based on the Rule Detector, operating results are presented as values obtained as a result of the work of diagnostic rules and dot indicators of incidents.
- An ML model branch is not created for the Limit Detector. The dot indicators of incidents registered using this detector are displayed if use of the Limit Detector is enabled and the display of indicators for all tags is enabled.
To display the predicted values of a tag on graphs in the Monitoring section, and to display the values obtained as a result of the work of diagnostic rules, you must customize the display of graphs.
To view the operating results of a specific ML model branch:
- In the main menu, select the Monitoring section.
- On the opened page, in the Model branch drop-down list, select the check boxes next to the relevant branches of the ML model.
The names of the selected branches are displayed in the field.
The branches belonging to the currently used ML model are located in the upper part of the list. The lower part of the list displays branches of other currently unused ML models that were uploaded to Kaspersky MLAD. An ML model branch is displayed in the drop-down list only after Kaspersky MLAD receives data that resulted from operations of the specific branch.
The graphs of the selected preset will display the predicted values of tags or the values obtained as a result of the work of diagnostic rules depending on the type of detector in the selected ML model branch.
If you need to hide the display of operating results from previously selected ML model branches, clear the check boxes next to these branches (however, one of the branches must remain active for graphs to be displayed in the Monitoring section).
- If you need to display the MSE received as a result of data processing by a specific ML model branch:
- Click the settings button
 below the tag graphs on the left side of the page.
 - In the MSE graph display settings pane that appears on the right, select the branch from the Model branch drop-down list. You can select only one ML model branch from the list.
- Click the Close button.
- Click the settings button
The MSE graph displays the MSE values for the selected branch of the ML model. The lower part of the graph displays the dot indicators of incidents that were registered by the selected ML model branches. If the display of indicators for all tags is enabled, the dot indicators of incidents that were registered by all ML model branches will be displayed.
Page topSelecting a time interval in the Monitoring section
Kaspersky MLAD lets you select the time interval (scale) for displaying incoming data.
To select a time interval:
- In the main menu, select the Monitoring section.
- On the opened page, select the necessary time interval from the drop-down list. The following values are available by default:
- 1, 5, 10, 15, and 30 minutes
- 1, 3, 6, and 12 hours
- 1, 2, 15, and 30 days
- 3 and 6 months
- 1, 2, and 3 years
If necessary, the system administrator can create, edit, or delete time intervals.
The page will display graphs of the defined preset for the selected time interval.
Page topConfiguring how graphs are displayed in the Monitoring section
Kaspersky MLAD lets you configure how the graphs of presets are displayed in the Monitoring section.
To configure the display settings for preset graphs:
- In the main menu, select the Monitoring section.
- On the opened page, click the settings button in the upper part of the screen.
The Graph display settings pane will appear on the right.
- In the Graph height drop-down list, select one of the following values: 55 px, 110 px, 145 px, 190 px.
By default, the Graph height parameter is set to 55 px.
- In the To go to the History section, use drop-down list, select the preset whose graphs should be displayed by default when you navigate to the History section.
- If necessary, move the Show observation graphs in selected color toggle button to enable the display of tag observation graphs in a specific color, and select the color in the Color of observation graphs field.
- If necessary, use the Show prediction graphs in selected color toggle switch to enable the display of tag prediction graphs in a specific color, and select the color in the Color of prediction graphs field.
- If necessary, use the Tag description and name toggle switch to enable display of the tag description and name on graphs.
- If necessary, use the Predicted tag value toggle switch to enable the display of the predicted tag value and values obtained as a result of the work of diagnostic rules on graphs.
- If necessary, use the Personal tag error toggle switch to enable display of the personal tag error on graphs.
- If necessary, use the Display indicators for all incidents toggle switch to enable display of the dot indicators for incidents registered by all ML model branches.
If this mode is disabled, only the dot indicators for incidents that were registered by the selected ML model branches will be shown.
- If you need the graphs to display the defined technical limits for a tag:
- Turn on the Blocking threshold toggle switch.
- If you need to always display the defined technical limits, turn on the Always display blocking threshold toggle switch.
If this mode is disabled, the technical limits will be displayed only if the tag value has reached the corresponding limit in the graph area displayed on the screen.
- If necessary, use the Additional threshold lines toggle switch to enable the display of additional threshold lines on the graph.
- Click the Close button to return to viewing graphs in the Monitoring section.
The defined settings for displaying preset graphs in the Monitoring section will be applied.
Page topViewing data in the History section
The History section provides access to the history of incoming data, the results of data processing by Kaspersky MLAD, generated predictions, and registered incidents. You can select the necessary preset in the drop-down list. This list includes presets that can be created in the Presets section. For each tag included in the selected preset, the incoming values are displayed as a graph. You can customize the display of graphs, select a time interval for viewing data, and select a branch of a specific ML model to view the operating results of this branch. For example, you can view the tag values predicted by the Forecaster Detector and their errors, or the values obtained as a result of the work of diagnostic rules.
The lower part of the page contains a section displaying the cumulative mean square error (also referred to as the "MSE" or "cumulative error"), and the number of registered incidents (color-coded dot indicators). The orange line shows the MSE threshold, above which Kaspersky MLAD registers an incident.
Depending on the selected time scale and the density of incidents, one dot indicator may correspond to one or multiple closely-spaced incidents that were registered by one or multiple different detectors. The color of dot indicators corresponds to the color of the ML model branch that was used to register the incident. Special colors are reserved for dot indicators that correspond to a group of incidents registered by different branches and for incidents registered by the Limit Detector.
There will be no MSE error value for incidents logged by the Rule Detector. When analyzing these incidents, pay attention to the rule triggering marker (color-coded dot indicator) below the MSE graph for the selected ML model branch.
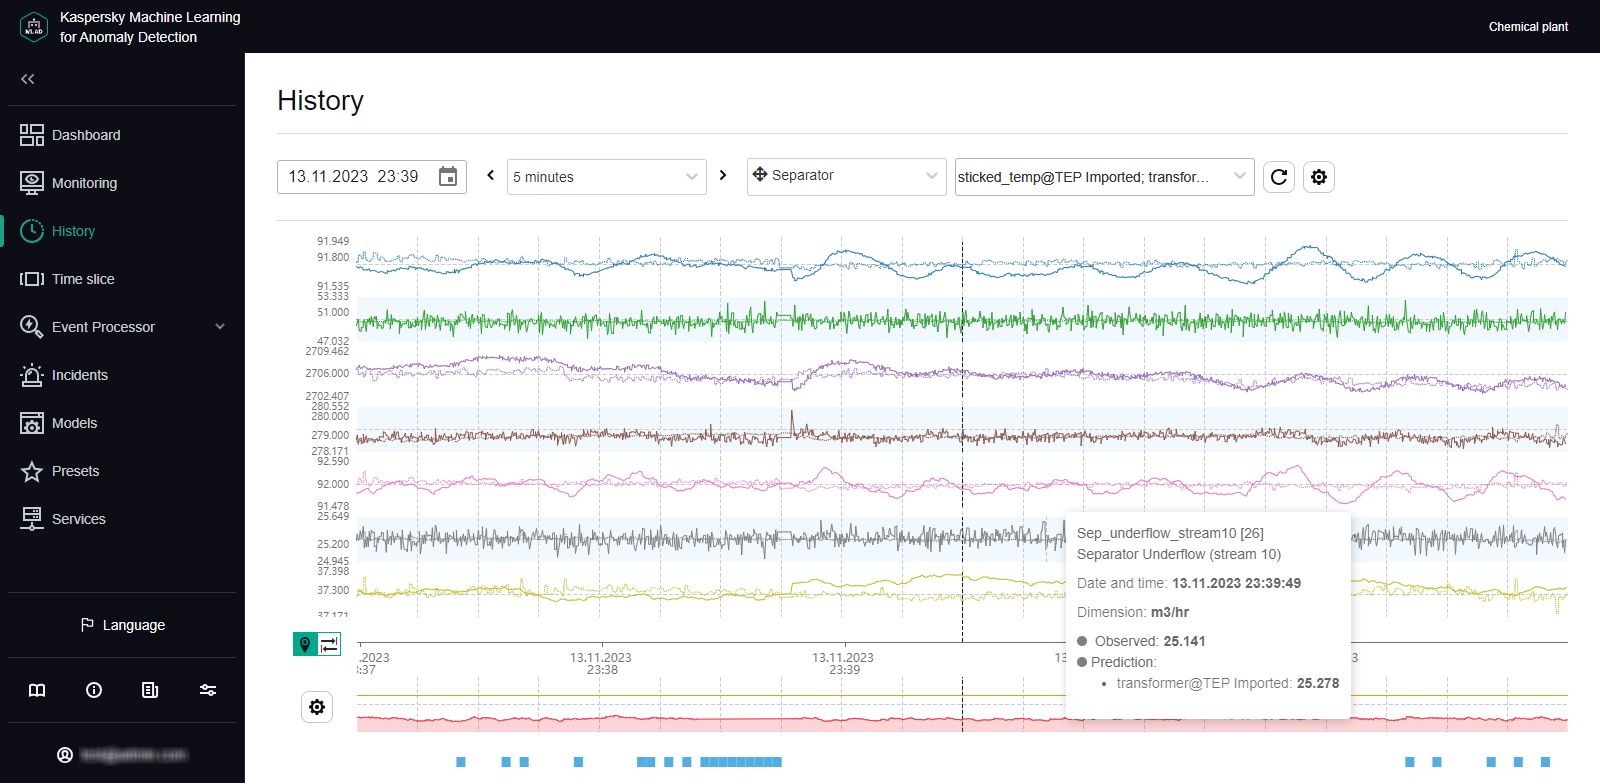
History section
Viewing historical data for a specific preset
Kaspersky MLAD allows you to select custom presets for which historical data is displayed. You can also view information about the Tags for event #N dynamic preset if you go to the History section from the Incidents section by clicking the incident registration date. The Tags for event #N dynamic preset contains tags that had the greatest influence on the generation of a registered incident.
To view historical data for a specific preset:
- In the main menu, select the History section.
- On the opened page, select the relevant preset from the Preset drop-down list.
The page displays graphs for tags that are included in the selected preset.
You can use the time navigation function to view the entire history of data. If necessary, you can change the date and time interval. You can also change the composition of tags in a preset, create a new preset, or select a specific branch of the ML model.
Page topSelecting a specific branch of the ML model in the History section
The History section provides access to the history of incoming data, the results of data processing by Kaspersky MLAD, generated predictions, and registered incidents.
If the ML model used for a monitored asset has several elements for processing data, Kaspersky MLAD lets you select a specific branch of the ML model to display the operating results of the corresponding model element:
- For an ML model branch based on the Forecaster Detector, operating results are displayed as predicted values for specific tags, individual errors in the prediction of specific tags, and cumulative MSE and dot indicators of incidents registered by the detector.
- For an ML model branch based on the Rule Detector, operating results are presented as values obtained as a result of the work of diagnostic rules and dot indicators of incidents.
- An ML model branch is not created for the Limit Detector. The dot indicators of incidents registered using this detector are displayed if use of the Limit Detector is enabled and the display of indicators for all tags is enabled.
To display the predicted values of a tag on graphs in the History section, and to display the values obtained as a result of the work of diagnostic rules, you must customize the display of graphs.
To view the operating results of a specific ML model branch:
- In the main menu, select the History section.
- On the opened page, in the Model branch drop-down list, select the check boxes next to the relevant branches of the ML model.
The names of the selected branches are displayed in the field.
The branches belonging to the currently used ML model are located in the upper part of the list. The lower part of the list displays branches of other currently unused ML models that were uploaded to Kaspersky MLAD. An ML model branch is displayed in the drop-down list only after Kaspersky MLAD receives data that resulted from operations of the specific branch.
The graphs of the selected preset will display the predicted values of tags or the values obtained as a result of the work of diagnostic rules depending on the type of detector in the selected ML model branch.
If you need to hide the operating results from previously selected ML model branches, clear the check boxes next to these branches (however, one of the branches must remain active for graphs to be displayed in the History section).
- If you need to display the MSE received as a result of data processing by a specific ML model branch:
- Click the settings button below the tag graphs on the left side of the page.
- In the MSE graph display settings pane that appears on the right, select the branch from the Model branch drop-down list. You can select only one ML model branch from the list.
- Click the Close button.
- Click the settings button
The MSE graph displays the MSE values for the selected branch of the ML model.
The lower part of the graph displays the dot indicators of incidents that were registered by the selected ML model branches. If the display of indicators for all tags is enabled, the dot indicators of incidents that were registered by all ML model branches will be displayed.
Page topSelecting a date and time interval in the History section
Kaspersky MLAD lets you choose the date and a fixed time interval (scale) for displaying historical data or a user-defined time interval (for example, when an incident was detected).
To select the date for displaying historical data:
- In the main menu, select the History section.
- Click the calendar icon (
 ) and select the date and time of the historical data to be displayed on the graphs.
 - Click the Apply button.
The vertical blue line on graphs will indicate the selected date and time (in the center of the graph).
- To select a new date and time (point) on the graph, click the location icon (
 ) on the left of the time axis and select the relevant point on the time axis.
The selected point will become the new center of the graph. The vertical blue dashed line will indicate the new date and time.
To select a time interval for displaying historical data:
- In the main menu, select the History section.
- On the opened page, do one of the following:
- If you need to display data for a fixed time interval, select the relevant time interval from the drop-down list. The following time intervals are available by default:
- 1, 5, 10, 15, and 30 minutes
- 1, 3, 6, and 12 hours
- 1, 2, 15, and 30 days
- 3 and 6 months
- 1, 2, and 3 years
If necessary, the system administrator can create, edit, or delete time intervals.
- If you need to display data for an arbitrary time interval, click the interval selection icon (
 ), which is located to the left of the time axis, select the required interval on the time axis and click on
  . If you need to change the scale again, repeat this step.
- If you need to display data for a fixed time interval, select the relevant time interval from the drop-down list. The following time intervals are available by default:
The graphs of the defined preset will display the tag values for the selected time interval.
Page topNavigating through time in the History section
Kaspersky MLAD provides the capability to navigate through time for convenient viewing of historical data.
To use time navigation when viewing data:
- In the main menu, select the History section.
- On the opened page, select the time interval for the data that you want to view.
- Use the left (
 ) and right arrows (
 ) in the upper part of the page to move left or right along the time axis.
The time axis for viewing historical data on the graph will shift to the selected time interval.

Navigating through time
On graphs, a vertical blue dashed line indicates the midpoint of the selected time interval and matches the selected date and time. If an interval of 1 day is selected, the graph displays historical data for the 12-hour periods before and after the selected date and time relative to the dashed line. If necessary, you can change the time interval.
Page topConfiguring how graphs are displayed in the History section
Kaspersky MLAD lets you configure the settings for displaying preset graphs in the History section.
To configure the display settings for preset graphs:
- In the main menu, select the History section.
- On the opened page, click the settings button in the upper part of the screen.
The Graph display settings pane will appear on the right.
- In the Graph height drop-down list, select one of the following values: 55 px, 110 px, 145 px, 190 px.
By default, the Graph height parameter is set to 55 px.
- If necessary, use the Show observation graphs in selected color toggle switch to enable the display of tag observation graphs in a specific color, and select the color in the Color of observation graphs field.
- If necessary, use the Show prediction graphs in selected color toggle switch to enable the display of tag prediction graphs in a specific color, and select the color in the Color of prediction graphs field.
- If necessary, use the Tag description and name toggle switch to enable display of the tag description and name on graphs.
- If necessary, turn on the Predicted tag value toggle switch to enable the display of the predicted tag value and values obtained as a result of the work of diagnostic rules on graphs.
- If necessary, use the Personal tag error toggle switch to enable display of the personal tag error on graphs.
- If necessary, use the Display indicators for all incidents toggle switch to enable display of the dot indicators for incidents registered by all ML model branches.
If this mode is disabled, only the dot indicators for incidents that were registered by the selected ML model branches will be shown.
- If you need the graphs to display the defined technical limits for a tag:
- Turn on the Blocking threshold toggle switch.
- If you need to always display the defined technical limits, turn on the Always display blocking threshold toggle switch.
If this mode is disabled, the technical limits will be displayed only if the tag value has reached the corresponding limit in the graph area displayed on the screen.
- If necessary, use the Additional threshold lines toggle switch to enable the display of additional threshold lines on the graph.
- Click the Close button to return to viewing graphs in the History section.
The defined settings for displaying preset graphs in the History section will be applied.
Page topViewing data in the Time slice section
In the Time slice section, you can view the values of process parameters received from sensors of the monitored asset at the same point in time. The sensors must be of the same type (have the same dimension) and must be positioned linearly, like pressure sensors in an oil pipeline, for example.
Data is presented in the form of graphs that allow you to see whether an incident was detected at the selected time and where the likely source of the incident is located.
The lower part of the page contains a section displaying the individual errors of tags. The data is presented as a bar graph. The error value for each tag is displayed when the mouse cursor hovers over the relevant column. The MSE graph is located on the right of the preset tag graphs.
In the Time slice section, you can use the drop-down list to select a preset and the date and time when data was received. This list includes special presets that can be created in the Presets section. A special preset should contain only tags of the same type that have defined x-axis coordinates. You can additionally specify expressions dynamically calculated for each tag based on actual and predicted tag values, individual prediction errors, and tag coordinate values and constants defined in expressions.
You can also customize the display of graphs, select a time interval for viewing data, and select a specific element of the ML model to view the personal errors of preset tags obtained as a result of data processing by the selected element of the ML model.
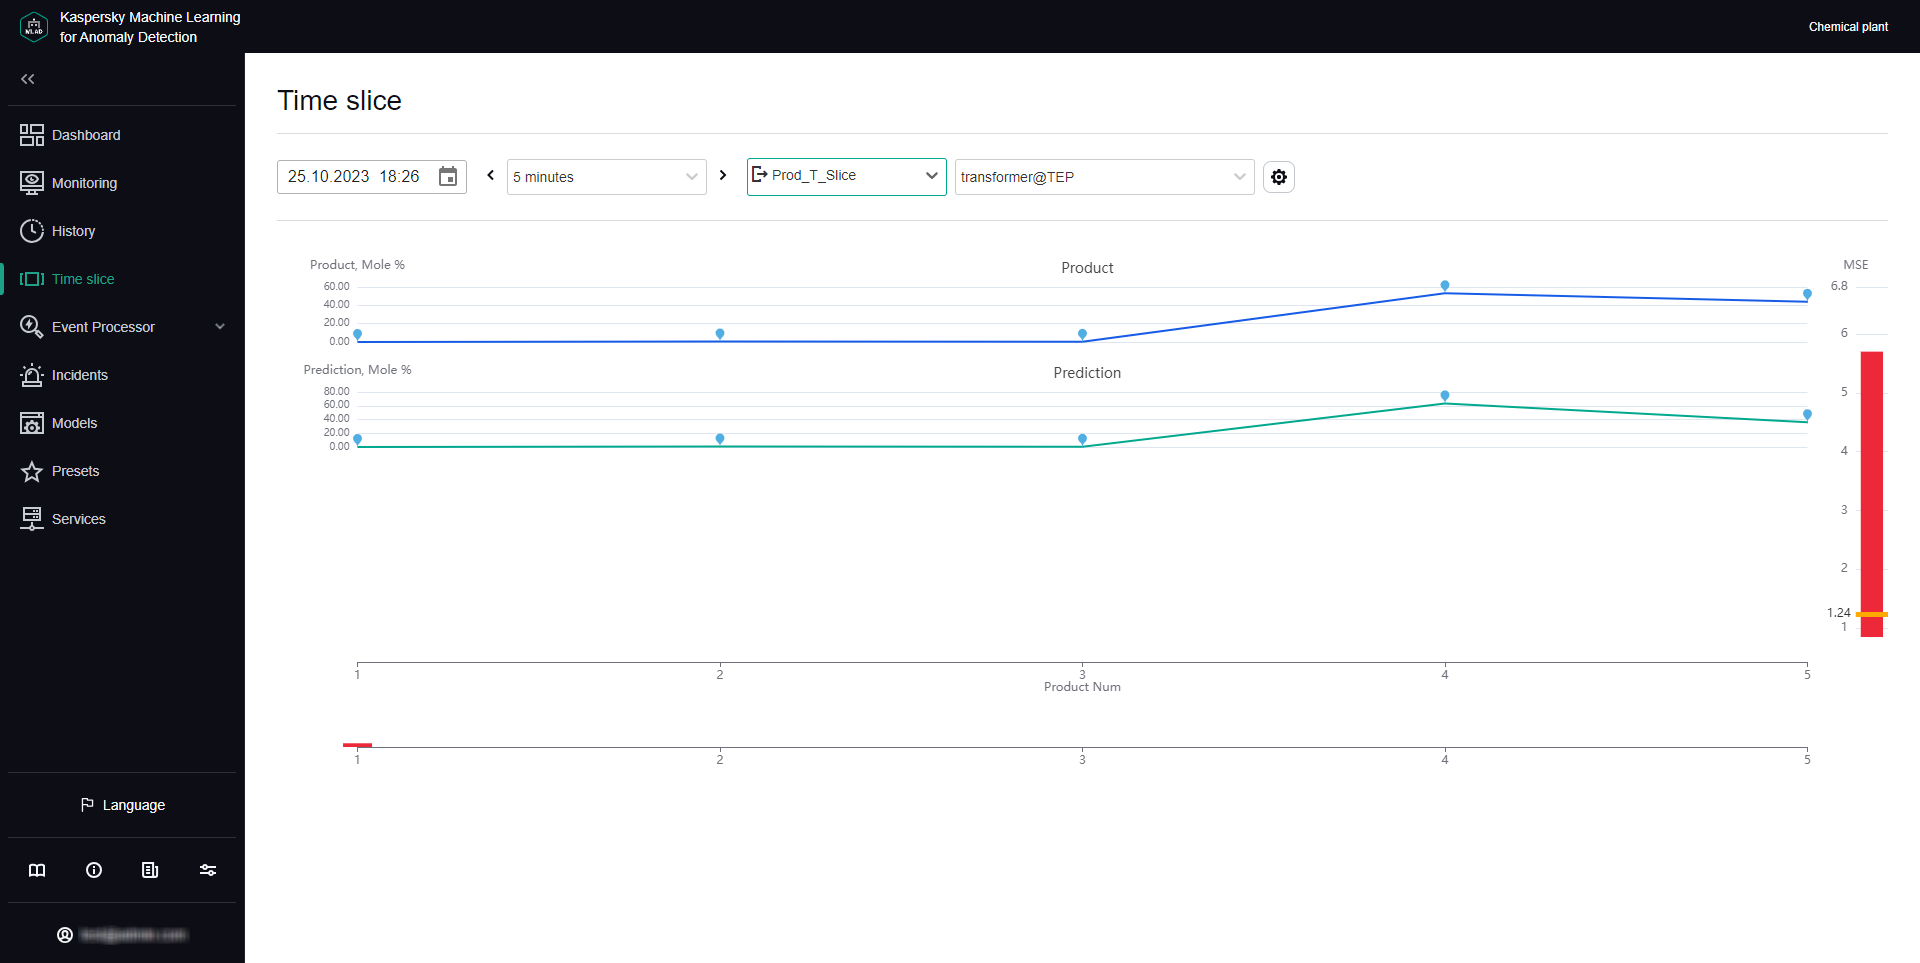
Time slice section
Viewing data for a specific preset in the Time slice section
To view data for a specific preset:
- In the main menu, select the Time slice section.
- On the opened page, select the relevant preset from the Preset drop-down list.
The page displays graphs for tags that are included in the selected preset.
If necessary, you can change the time interval for displaying data, customize the display of a graph, or select a specific branch of the ML model. You can also change which tags are displayed by editing the preset.
Page topSelecting a specific branch of the ML model in the Time slice section
If the ML model used for a monitored asset has several branches for processing and predicting data, Kaspersky MLAD lets you select a specific branch of the ML model to display the personal tag errors obtained as a result of this branch in the Time slice section.
To view the personal tag errors resulting from data processing by a specific ML model branch:
- In the main menu, select the Time slice section.
- On the opened page, select the relevant branch of the ML model from the Model branch drop-down list.
The name of the selected branch will be displayed in the field.
The tag graphs of the selected preset will display the personal tag errors resulting from data processing by the selected branch of the ML model.
Page topSelecting a date and time interval in the Time slice section
Kaspersky MLAD lets you select a date and time interval (scale) for displaying incoming data.
To select the date for displaying incoming data:
- In the main menu, select the Time slice section.
- Click the calendar icon () and select the date and time for displaying data on the graphs.
- Click the Apply button.
The graphs will display the tag values for the selected date and time.
To select a time interval for displaying incoming data:
- In the main menu, select the Time slice section.
- Select the required time interval from the drop-down list in the upper part of the opened page. The following time intervals are available by default:
- 1, 5, 10, 15, and 30 minutes
- 1, 3, 6, and 12 hours
- 1, 2, 15, and 30 days
- 3 and 6 months
- 1, 2, and 3 years
If necessary, the system administrator can create, edit, or delete time intervals.
The page will display graphs of the defined preset for the selected time interval.
Page topNavigating through time in the Time slice section
Kaspersky MLAD provides the capability to navigate through time for convenient viewing of data.
To use time navigation when viewing data:
- In the main menu, select the Time slice section.
- On the opened page, select the time interval for the data that you want to view.
- Use the left () and right arrows () in the upper part of the page to move left or right along the time axis.
The time axis for viewing data on the graph will shift to the selected time interval.
Navigating through time
Page topConfiguring how graphs are displayed in the Time slice section
Kaspersky MLAD lets you configure the settings for displaying preset graphs in the Time slice section.
To configure the display settings for preset graphs:
- In the main menu, select the Time slice section.
- On the opened page, click the settings button in the upper part of the screen.
The Graph display settings pane will appear on the right.
- In the Graph height drop-down list, select one of the following values: 55 px, 110 px, 145 px, 190 px.
By default, the Graph height parameter is set to 55 px.
- Click the Close button to return to viewing the graphs.
The configured graph display settings will be applied.
Page topWorking with events and patterns
The Event Processor section provides data on
and the structure of detected by the Event Processor service in the event stream received from external sources or from the Anomaly Detector service.
In the Event Processor section, you can view the history of received events and the registration history of new and/or persistently recurring patterns. You can also configure the display of event parameters and can configure pattern registration settings. On the Monitoring tab, you can monitor specific events, patterns, or values of event parameters received by the Event Processor within the data stream from monitored assets.
If restarted, Kaspersky MLAD restores the state of the Event Processor service and pauses the processing of data received from the CEF Connector. This data is temporarily stored in the internal queue of the application message broker. Until the Event Processor service is restored, the Event Processor section tabs will display a notification informing you that the Event Processor service has stopped. This service restoration process may take several minutes if there is a significantly large number of processed events or registered patterns.
Event Processor section
Configuring settings in the Event Processor section
Before events are processed by the Event Processor service, attention settings and display of event parameters must be configured.
System administrators can manage the attention settings and display of event parameters.
A large number of attention directions can slow down the operation of Kaspersky MLAD main services (data reception, anomaly detection, web interface). To clarify the number of attention directions, it is recommended to consult with Kaspersky experts or a certified integrator.
To configure attention settings and display of event parameters:
- In the main menu, select the Event Processor → Monitoring section.
- On the opened page, click the Settings button.
The Event Processor settings pane will appear on the right.
- In the Configure attention section, do one of the following for each event parameter:
- If you need to register patterns for all values of an event parameter, use the drop-down list to select All parameter values.
- To register patterns for a specific event parameter value, select the event parameter value in the drop-down list. As you start typing a value, all matching parameter values are displayed in the list.
If the parameter value is not listed, enter the required value and select Create Value: <event parameter value>.
- If you need to register patterns based on an event parameter value template, turn on the Regular expression toggle switch for the relevant event parameter, use the drop-down list to enter the value template with a regular expression, and select Regular expression: <value template>.
You can use special characters of regular expressions to search for patterns based on regular expressions.
Each attention direction is defined by the parameter value that must be present in all events of this direction. When configuring attention directions, you can indicate specific values or templates of values of one or more parameters or define attention directions for all possible values of one or more parameters.
- To configure the display of filters for the event parameters, in the Filters section on the Event history and Patterns history tabs, in the Configure display of event parameter filters section, select the check boxes next to the names of the desired event parameters.
By default, the Configure display of event parameter filters section displays the event parameters from the Anomaly Detector service. To display custom event parameters, load the Event Processor service configuration file. All available event parameters are selected by default.
If necessary, in the Filters section you can change the display order for the event parameters. For this purpose, drag the required event parameter up or down in the Configure display of event parameter filters section.
- To save your changes, click the Apply button.
Working with monitors
Monitor management is available to system administrators.
In the Event Processor → Monitoring section, you can create monitors for monitoring specific events, patterns, or values of event parameters.
The Monitoring tab displays all monitors created in the application, including the following brief information:
- Monitor name.
- Monitor threshold.
- Sliding window used to track the number of monitor activations.
- Number of monitor activations on the sliding window.
If necessary, you can view detailed information about each monitor by clicking the Information button located next to the name of the relevant monitor in the table.
On the Histogram tab, you can also view brief statistics on the number of registered activations for each created monitor.
Creating a monitor
Monitor management is available to system administrators.
To create a monitor:
- In the main menu, select the Event Processor → Monitoring section.
- Click the Create monitor button.
The Create monitor pane appears on the right.
- Specify the monitor name in the Name field.
- In the Sliding window (sec.) field, specify the interval (in seconds) from the current point in time back to the time sequence for which the monitor will process incoming values of parameters, events or patterns.
- In the Threshold field, specify the number of monitor activations in the sliding window after which the monitor sends an alert to the external system.
- In the Stack limit field, specify the number of monitor activations that must be displayed when viewing information about the monitor.
- In the Subscription type drop-down list, select one of the following values:
- If you need to process data on the values of event parameters, select Parameter values.
- If you need to process data on events, select Events.
- If you need to process data on detected patterns, select Patterns.
- If you need to track new events, patterns, or values of event parameters, turn on the Only new toggle switch in the Filters section.
- To focus the attention of the model on specific directions of events, do one of the following:
- If you selected Events from the Subscription type drop-down list, select Attention for the relevant event parameter. If you need to track events without specifying the attention direction, clear the Attention check box.
- If you selected Patterns from the Subscription type drop-down list, select the Attention check box for the relevant event parameter.
You can select only one attention direction.
- For each event parameter, do one of the following:
- If you need to process data on all values of an event parameter, use the drop-down list to select All parameter values.
This option is displayed if you specified the attention direction for the current event parameter.
- To process data only on the new values of an event parameter, in the drop-down list select New parameter values.
This option is displayed only when the Only new function is enabled for event-based data processing.
- To process data for a specific value of an event parameter, in the drop-down list select the event parameter value. As you start typing a value, all matching parameter values are displayed in the list.
If the parameter value is not listed, enter the required value and select Create Value: <event parameter value>.
- If you need to process data based on an event parameter value template, turn on the Regular expression toggle switch for the relevant event parameter, use the drop-down list to enter the value template with a regular expression, and select Regular expression: <value template>.
You can use special characters of regular expressions to search patterns using regular expressions.
- If you need to process data on all values of an event parameter, use the drop-down list to select All parameter values.
- Click the Create button.
The new monitor is created and displayed on the Monitoring tab.
Page topDeleting a monitor
Monitor management is available to system administrators.
To delete a monitor:
- In the main menu, select the Event Processor → Monitoring section.
- Click the Delete button in the cell of the monitor whose information you want to delete and confirm your selection.
The monitor will be deleted.
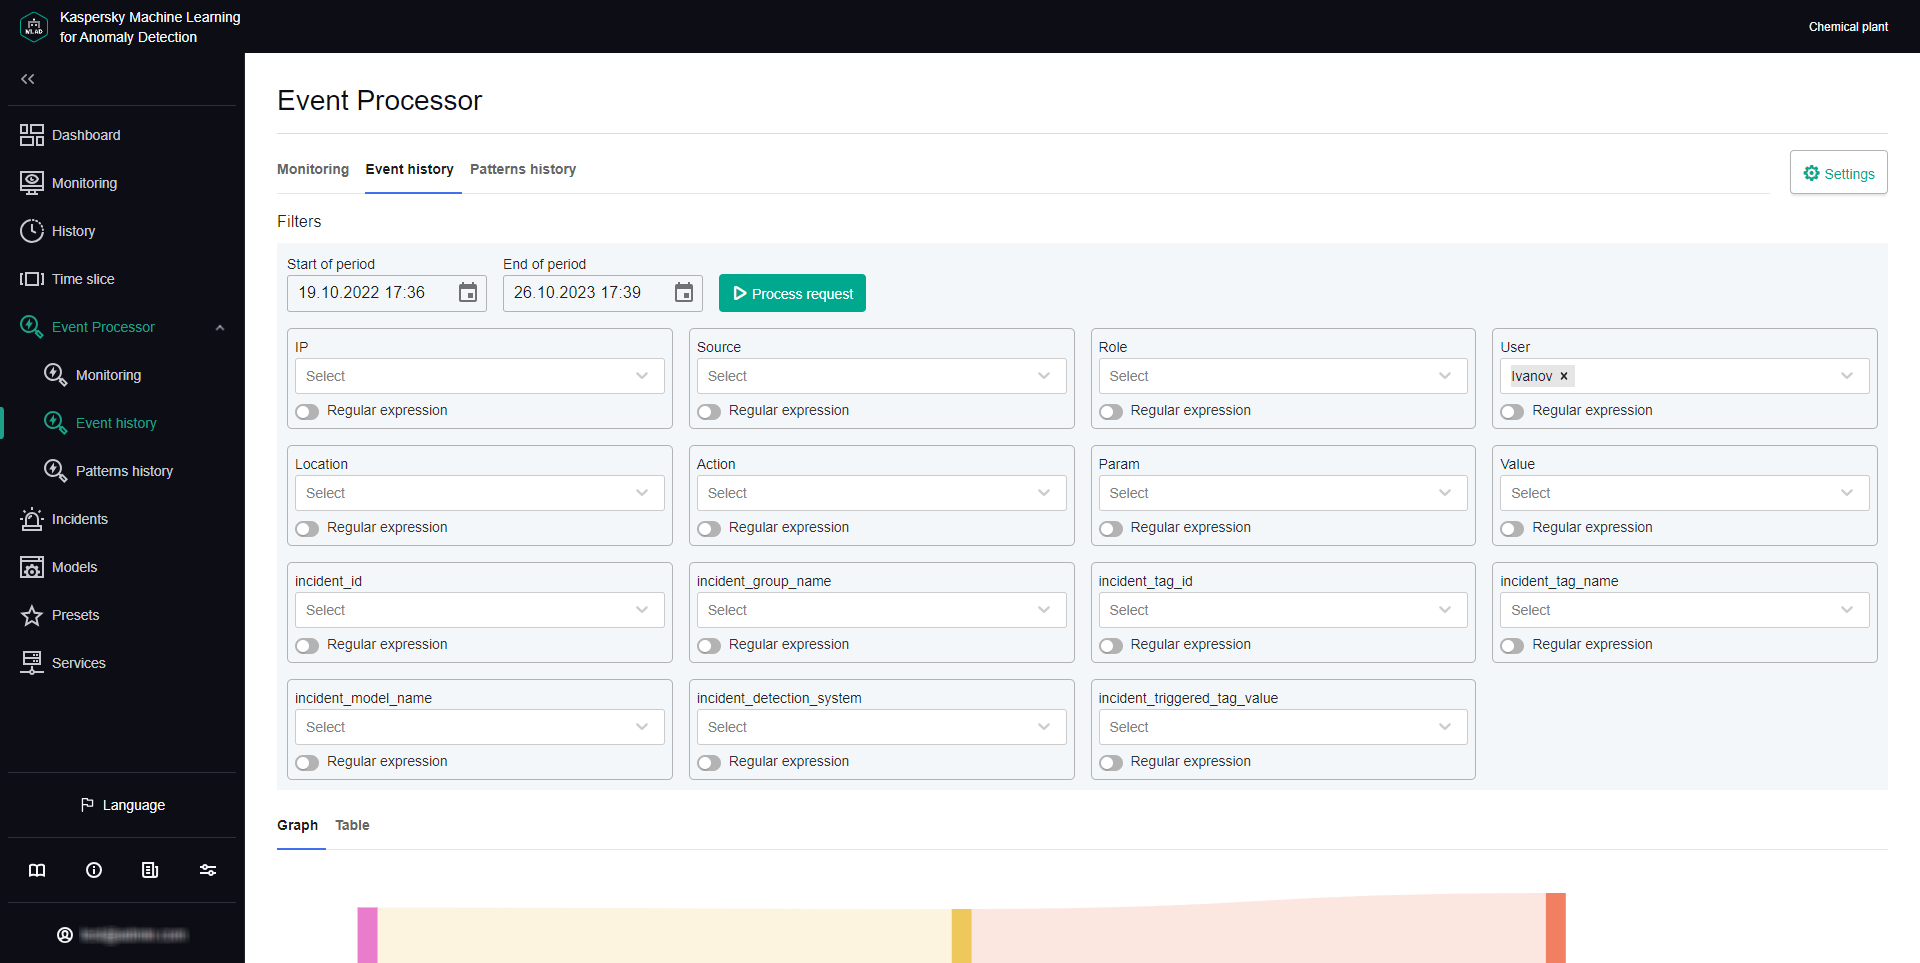
Page topViewing the events history
Kaspersky MLAD lets you view the events that were received from external sources of events. To view events, you need to upload them to Event Processor → Event history.
Viewing the event history is available to system administrators.
Kaspersky MLAD displays incoming events as a graph of relations between event parameters. The graph nodes correspond to the values of the event parameters, and the arcs between the nodes correspond to the links between the parameter values of incoming events. You can hover the mouse pointer over the event graph and view information about the event parameters and their values. You can also hover the mouse pointer over the event graph arc and view information about the number of links between the values of event parameters.
You can also view information about the detected events as a table.
Each monitored asset has its own specific incoming events and event parameters. The list of event parameters is defined in the configuration file for the Event Processor service. The configuration file is created and uploaded by a system administrator during configuration of the Event Processor service.
To upload data for viewing incoming events:
- In the main menu, select the Event Processor → Event history section.
- In the Filters section, click the calendar icon () to select the start and end date and time of the period for which you want to load and view events. To configure event parameters, do one of the following:
- To load events based on the specific values of the event parameters, select the event parameter value in the drop-down lists. As you start typing a value, all matching parameter values are displayed in the lists.
- To load events based on a value template, enable the Regular expression option for the relevant event parameters, in the drop-down lists, specify the value template using a regular expression, and select Regular expression: <value template>.
You can use special characters of regular expressions to perform a search based on regular expressions.
Each monitored asset has its own specific set and names of event parameters.
- Click the Process request button.
Data on the events found by the application will be displayed as a graph in the central part of the page.
- To view the received events as a table, select the Table tab.
The central part of the page displays a table that contains information on the detected events.
Viewing the pattern history
In the section Event Processor → Patterns history, you can find and view the structure of the new and/or persistently recurring patterns. The Event Processor generates patterns only for specific directions that are defined in the attention configuration by the system administrator.
Viewing the pattern history is available to system administrators.
You can also view the structure of the detected patterns down to the event level. The Event Processor represents patterns, events, and values of event parameters as a layered hierarchy of nested elements. For example, a fourth-layer pattern consists of subpatterns of the third layer. A third-layer pattern consists of second-layer patterns, and a second-layer pattern consists of events, which are first-layer elements. Event parameter values are elements of the null terminal layer.
Each monitored asset has its own specific incoming events and event parameters. The list of event parameters is defined in the configuration file for the Event Processor service. The configuration file is created and uploaded by a system administrator during configuration of the Event Processor service.
To view the registered patterns:
- In the main menu, select the Event Processor → Patterns history section.
- In the Filters section, configure the following settings for displaying patterns on the page:
- In the Start of period field, click the calendar icon () and select the starting date and time of the period for which you want to view the patterns.
- In the End of period field, click the calendar icon () and select the end date and time of the period for which you want to view the patterns.
- In the Pattern type drop-down list, select one of the following values:
- Stable refers to patterns that were registered by the Event Processor service two or more times.
- New refers to new patterns registered by the Event Processor service for the first time.
- All includes all patterns that were registered by the Event Processor service.
- To view patterns for a specific attention direction, select Attention for the relevant event parameter.
You must select one of the attention directions that were defined when configuring the attention settings.
- To configure event parameters, do one of the following:
- To view patterns based on specific values of the event parameters, select the event parameter values in the drop-down lists. As you start typing a value, all matching parameter values are displayed in the lists.
- If you need to view patterns based on a value template, turn on the Regular expression toggle switch for the relevant event parameters, use the drop-down lists to enter the value template with a regular expression, and select Regular expression: <value template>.
You can use special characters of regular expressions to perform a search based on regular expressions.
For the request to be processed correctly, enter the values for the event parameter that is receiving focused attention from the model. If an event parameter that is receiving focused attention has multiple values defined, the Event Processor will generate patterns for each value of the parameter.
- In the Start of period field, click the calendar icon (
- Click the Process request button.
The central part of the page displays a table containing data on the registered patterns.
- To view the pattern structure, click the desired pattern row.
The page with detailed information on the pattern opens.
- To view the structure of a pattern, do one of the following:
- To view the structure of a particular subpattern, on the Patterns tab in the Nested elements section, click the desired pattern.
You can return to viewing the top-level pattern structure by clicking the ID of the desired pattern above the Pattern info section.
- To view the table of subpatterns at a certain nesting level, select the desired layer on the Patterns tab of the Nested elements section.
- To view the events included in the pattern at the current nesting level, click the Events tab.
Kaspersky MLAD displays the pattern structure from the top nesting level.
- To view the structure of a particular subpattern, on the Patterns tab in the Nested elements section, click the desired pattern.
Working with incidents and groups of incidents
In Kaspersky MLAD, an ML model can simultaneously use multiple types of detectors that analyze incoming telemetry data and detect incidents independent of each other. The Kaspersky MLAD web interface provides the capability to investigate detected incidents. Depending on the type of detector that registered an incident, information about the incident and the methods you can use to investigate it may differ.
You can perform the following actions for any incident:
- Analyze the incident details.
- Find out if any similar incidents were detected previously.
- Study the behavior of the monitored asset at the moment when the incident was detected.
- Leave a note or expert opinion for a registered incident or incident group.
The Incidents section displays a column graph showing the incidents that match the filtering criteria specified under the graph. The graph displays statistics on the registered incidents for the period specified above the graph.
The graph can display up to 60 bars. If the specified period does not exceed 60 days, incidents on the graph are grouped by days. If the specified period is between 60 days and 60 weeks, incidents on the graph are grouped by weeks. If the specified period is longer than 60 weeks, incidents on the graph are grouped by months.
Hovering the mouse pointer over a bar of the graph displays a window showing the number of registered incidents per corresponding time period. Upon clicking a bar, the graph and in the table below display information about the incidents registered during the corresponding time period.
In this section, you can view individual incidents as well as groups of incidents.
Incidents tab
The Incidents tab shows a table of registered incidents. Incidents are sorted by date in descending order, with the newest incidents shown first.
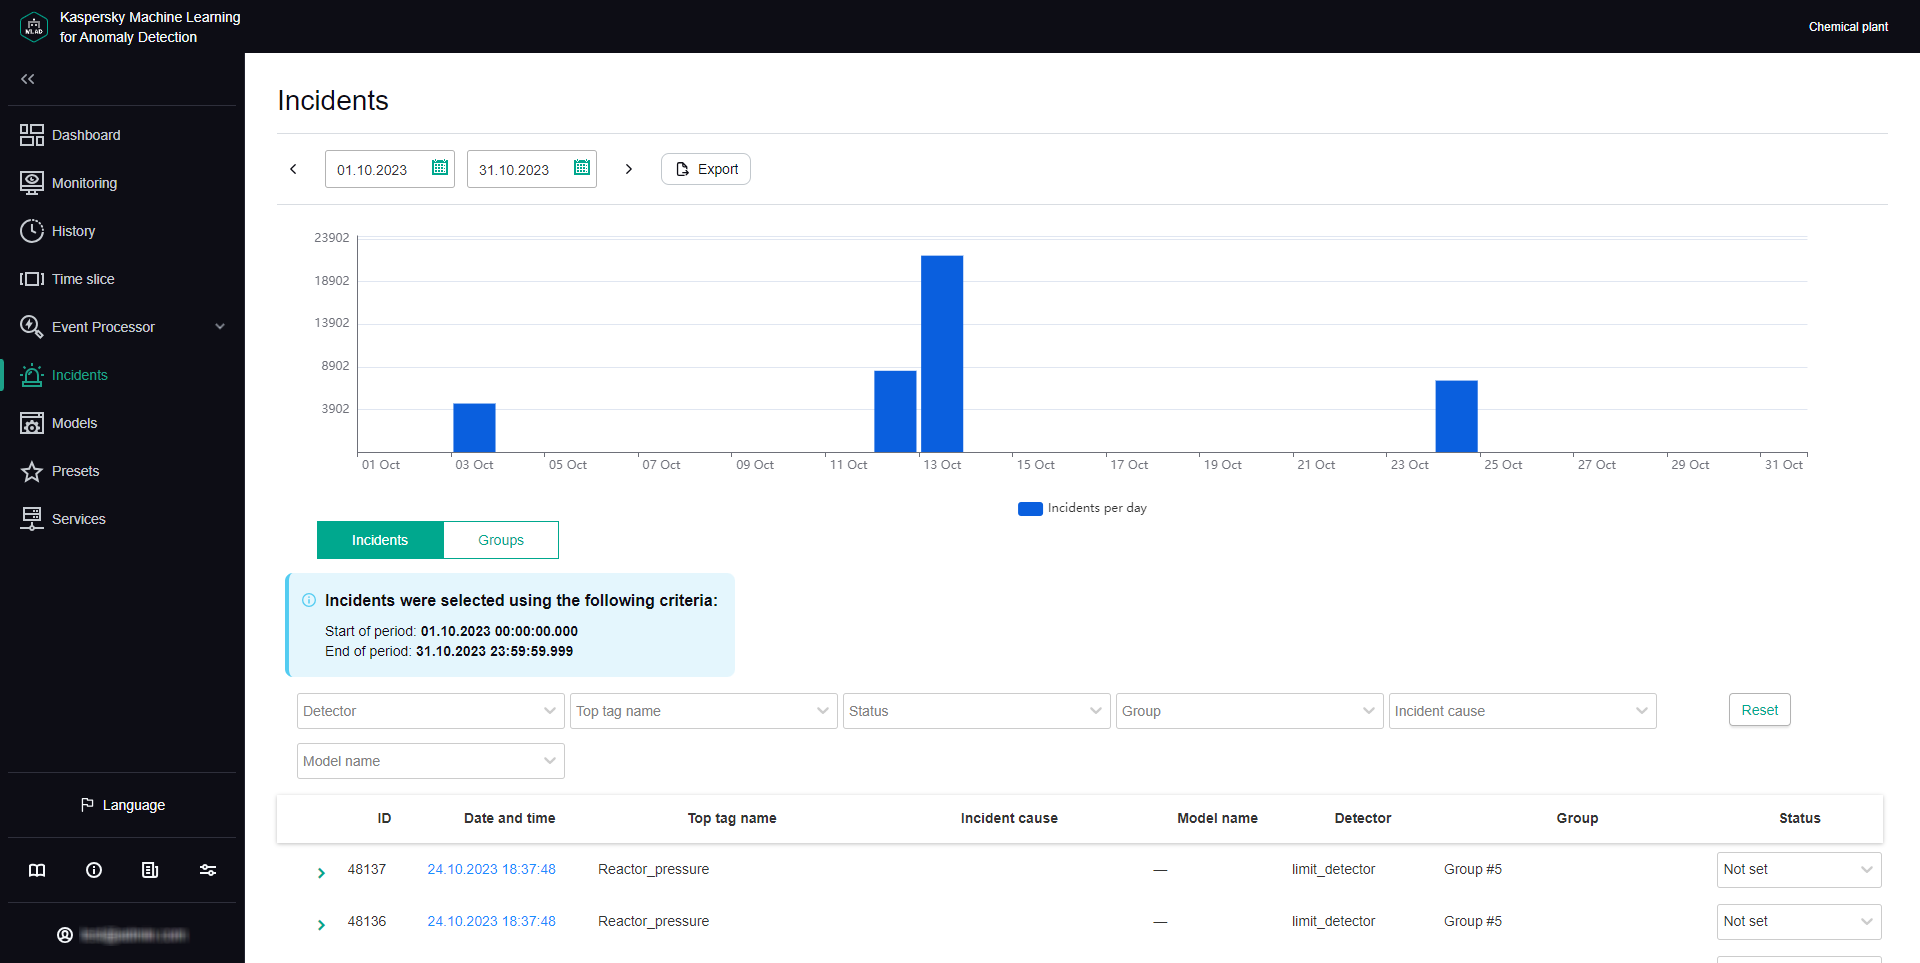
Incidents tab
You can go to the History section by clicking the date and time of the incident.
Groups tab
The Groups tab shows a table of incident groups. Kaspersky MLAD automatically generates groups of similar incidents.
You can change the group name that was assigned automatically and set the status of incidents that belong to this group. You can also provide an expert opinion that contains the recommended actions to take in response to new incidents in this group, for example.
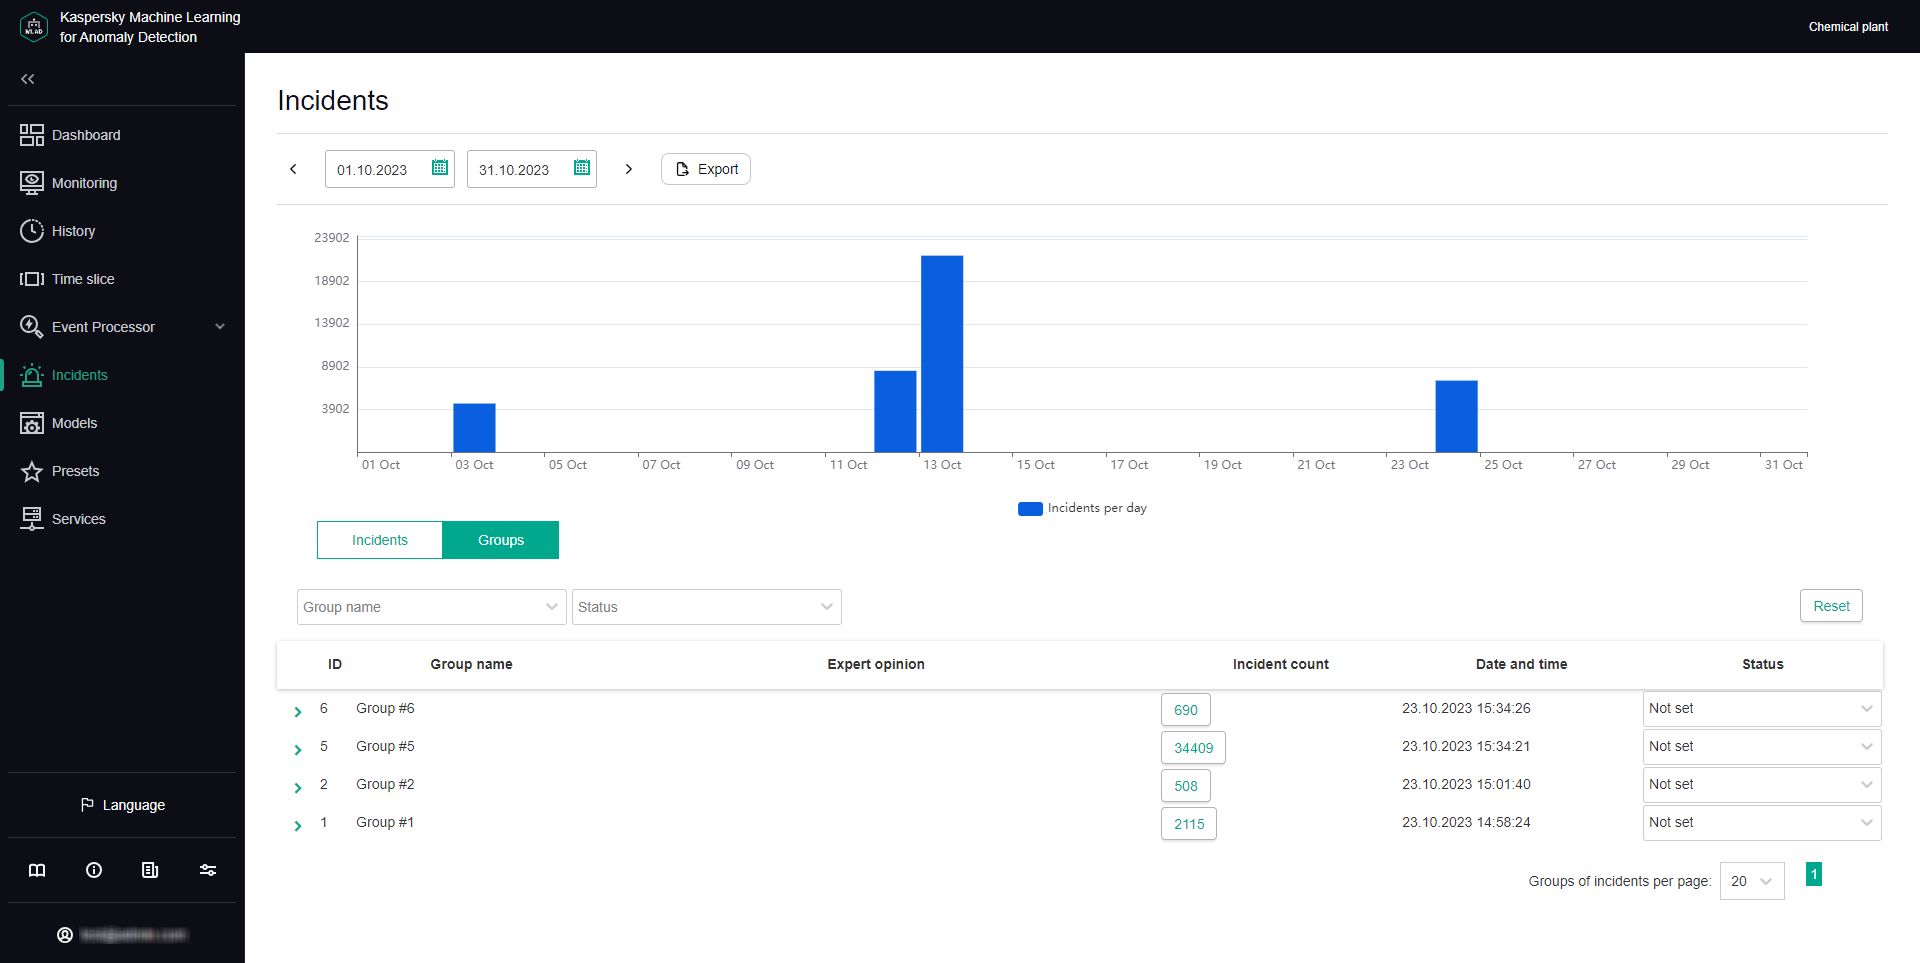
Groups tab
Scenario: analysis of incidents
This section describes the sequence of actions required when analyzing incidents registered by Kaspersky MLAD.
The incident analysis scenario described in this section is not a precisely regulated procedure. The specific scope and sequence of actions taken to investigate an incident and identify its cause depend on the particular subject area, the knowledge level of the process engineer or ICS expert investigating the incident, and the availability of additional information on the monitored asset.
The incident analysis scenario consists of the following steps:
- Viewing information about a registered incident
The Incidents section displays all incidents registered by Kaspersky MLAD, and provides detailed information about their registration time, the detector that registered the incident, and an expert opinion if one was added. You can proceed to view incident information in one of the following ways:
- Viewing the latest incidents in the Dashboard section
If you want to view a recently detected incident, in the Dashboard section, click the date and time of the relevant incident in the Latest incidents table. In the History section that opens, in the lower part of the page, click the dot indicator in the MSE section to view a specific incident. The Incidents section opens showing only the incidents that were registered in the specific time interval represented by the selected dot indicator (the interval is displayed above the incidents table).
- Viewing incidents in the Incidents section
If you know the date and time when an incident was registered, select the corresponding incident in the Incidents section. You can change the time interval for the displayed incidents by using the bar graph or the date selection field in the upper part of the page.
- Navigating from an incident notification received by email
If an incident notification was created for you, you will receive the notification by email when an incident is registered. The email message contains the time when the incident began, the most anomalous tag, and a link to proceed to the History section in the Kaspersky MLAD web interface. You can use this link to proceed to the start of the incident in the History section. At the bottom of the History page, click on the dot indicator in the MSE section according to the incident start time. The Incidents section opens showing only the incidents that were registered in the specific time interval represented by the selected dot indicator (the interval is displayed above the incidents table).
When you find a record about the required incident, click the right arrow (
 ) to view detailed information about the incident.
 - Viewing the latest incidents in the Dashboard section
- Viewing information about similar incidents
When two or more similar incidents are detected, Kaspersky MLAD automatically combines them into a group. In the incidents table in the Incidents section, the group associated with the incident is displayed in the Group column. If nothing is indicated for the selected incident in this column, this means that Kaspersky MLAD has not yet detected incidents similar to this particular incident.
To view all incidents in a group, select the Groups tab and click the right arrow (
) next to the relevant group. The table displays information about the incidents assigned to the selected group, as well as an expert opinion if it was added. Read the expert opinions for individual incidents and for the group. - Studying the behavior of the monitored asset at the moment when an incident was detected
Study the behavior of the monitored asset at the moment when the incident was detected.
- Analyzing the incident
Analyze the incident while considering the specific details of incident registration depending on the type of detector that registered the incident:
- Forecaster. The neural network element of the ML model registers incidents when deviations in the behavior of the monitored asset are detected. Based on information obtained when viewing the automatically generated Tags for event #N preset and considering the available expert knowledge on the monitored asset, form a hypothesis regarding which tags could have caused the incident and select the appropriate preset after studying their behavior. Analyze the MSE graph, move back in time from the moment the MSE threshold was reached, and examine the behavior of tags at the moment when the MSE values started to grow.
- Rule Detector. For each incident registered by elements of the ML model on the basis of a diagnostic rule, the Tags for event #N preset is automatically generated, which includes the value obtained as a result of the diagnostic rule operation and which caused the incident registration.
- Limit Detector. For each incident that was registered by the Limit Detector, the application automatically creates the Tags for event #N preset, which includes a single causal tag for the incident.
- Stream Processor. The Stream Processor service registers incidents up until telemetry data is transmitted to the ML model for processing. Incidents are registered if data loss is detected or if observations are received by Kaspersky MLAD too early or too late.
- Adding a status, cause, expert opinion or note to an incident or its incident group
For each incident, add an expert opinion or note in which you can specify whether the incident is an anomaly. An expert opinion and note for an incident are displayed only when viewing a specific incident. If necessary, you can specify the status and cause of an incident. The cause of an incident is displayed in the incidents table and when viewing a specific incident. You can also add or edit the status and expert opinion for a group of incidents.
Viewing incidents
To view incidents that were registered on a specific date:
- In the main menu, select the Incidents section.
- In the upper part of the opened page, on the bar graph, click the graph column for the relevant date.
- If necessary, filter incidents by detector, top tag, status, group, or incident cause by selecting relevant values in the corresponding drop-down list.
The table located in the central area of the page shows the incidents registered on that day according to the specified filtering criteria. When you click the Reset button, the table and the bar graph show all registered incidents.
The following information is displayed for each incident in the table:
- ID refers to the ID of the registered incident.
- Date and time refers to the date and time when the incident was registered.
Clicking the incident registration date opens the History section, where you can view information about the "Tags for event #N" preset generated for the registered incident.
- Top tag name refers to the name of the process parameter for which the largest deviation from the prediction was recorded at the time of incident registration.
- Incident cause refers to the cause of a logged incident added by the expert (process engineer or ICS specialist) after incident analysis or defined by the ML model.
- Model name refers to the name of the ML model whose element registered the incident.
- Detector refers to the name of the detector that identified an anomaly and registered the incident: Forecaster, Limit Detector, Rule Detector, Stream Processor.
- Group refers to the name of the incident group to which the registered incident belongs.
If two or more similar incidents are detected, they are combined into a group that is created automatically by using the Similar Anomaly service. You can view only those incidents included in the group by selecting the group name from the drop-down list.
- Status refers to the status of a logged incident specified by the expert (process engineer or ICS specialist) after incident analysis or defined by the ML model.
You can set the incident status based on analysis results by selecting the appropriate value from the drop-down list. After installation of Kaspersky MLAD, the following statuses of incidents and incident groups are available by default: Under review, Decision pending, Instructions issued, Problem closed, Cause unknown, Ignore and False positive. If necessary, the system administrator can create, edit, or delete statuses of incidents.
Viewing the technical specifications of a registered incident
In the Incidents section, you can view the technical specifications of registered incidents. To do so, click the right arrow (![]() ) next to the relevant incident in the incidents table. The following technical specifications will be displayed for the selected incident:
) next to the relevant incident in the incidents table. The following technical specifications will be displayed for the selected incident:
- Incident is the section containing information about the incident.
- Top tag is the section containing information about the tag for which the incident was registered.
- Stream Processor service incident parameters is a section containing information about the parameters of the incident registered by the Stream Processor service. This group of parameters is displayed if the current incident is registered by the Stream Processor service.
- Incident cause is the field for selecting the cause of the incident. This field is completed by an expert (process engineer or ICS specialist). If necessary, the system administrator can create, edit, or delete causes of incidents.
- Expert opinion is the field for adding an expert opinion based on an analysis of the registered incident. This field is completed by an expert (process engineer or ICS specialist).
- Note is the field for entering a comment for the selected incident. If necessary, you can provide a comment for the incident.
Viewing incident groups
When two or more similar incidents are detected, Kaspersky MLAD automatically combines them into a group (using the Similar Anomaly service). This lets you analyze incidents with consideration of prior history and expert opinions that were generated for similar incidents. In the incidents table in the Incidents section, the group associated with the incident is displayed in the Group column. If nothing is indicated for the incident in this column, this means that Kaspersky MLAD has not yet detected incidents similar to this particular incident. Incidents can be regrouped, and the expert opinions that were added to these incidents are migrated to the new group. The group name is automatically assigned in the format Group #N (N is replaced by the sequence number of the group). If necessary, you can edit a group name.
To view incident groups:
In the main menu, select the Incidents section and click Groups.
All incident groups for your monitored asset are displayed in the table located in the central part of the page.
The following information is displayed for each incident group in the table:
- ID is the incident group identifier.
- Group name refers to the name of the incident group.
- Expert opinion is a conclusion added by an expert (process engineer or ICS specialist) based on an analysis of the group of registered incidents.
- Incident count refers to the number of registered incidents included in the group.
You can proceed to view incidents of the group by clicking Incident count.
- Date and time refers to the date and time when the incident group was created.
- Status refers to the status of registered incidents in a group specified by an expert (process engineer or ICS specialist) based on the results of the incident analysis.
You can set the incident group status based on analysis results by selecting the appropriate value from the drop-down list. After installation of Kaspersky MLAD, the following statuses of incidents and incident groups are available by default: Under review, Decision pending, Instructions issued, Problem closed, Cause unknown, Ignore and False positive. If necessary, the system administrator can create, edit, or delete statuses of incidents.
To view detailed information about an incident group:
- Click the right arrow () next to the incident group.
A list of incidents in this group is displayed. The following technical specifications are displayed for each incident of the group:
- Incident date is the date and time when the incident was registered.
You can go to the History section by clicking the incident registration date.
- Top tag name is the name of the process parameter that had the largest impact when the incident occurred.
- Top tag value is the registered value of the tag that had the largest impact when the incident occurred.
- Relevant tags refers to a table that contains the identifiers of tags that influenced the identification of similar incidents and merging of these incidents into a group.
- Incident date is the date and time when the incident was registered.
- If you need to view the degree of influence a tag had on the formation of similar incidents, click the Relevant tags table cell containing the identifier of the relevant tag.
All table cells containing the selected tag ID are highlighted in green. The closer the green-highlighted cells containing the ID of the selected tag are to the first table column, the more impact that tag has when identifying and grouping similar incidents.
You can also add a status and expert opinion for the incident group.
Page topStudying the behavior of the monitored asset at the moment when an incident was detected
This section describes the sequence of actions required when studying the behavior of a monitored asset at the moment when an incident was detected.
Studying the behavior of a monitored asset consists of the following steps:
- Viewing the history of tags received for a monitored asset in the History section
You can proceed to view incident information in one of the following ways:
- If you want to view a recently detected incident, in the Dashboard section, click the date and time of the relevant incident in the Latest incidents table.
- In the Incidents section, click the date and time of the relevant incident in the incidents table.
- If an incident notification was created for you, you can proceed to view the incident by clicking the link from the email notification. The email message contains the time when the incident began, the most anomalous tag, and a link to proceed to the History section in the Kaspersky MLAD web interface.
In the History section, Kaspersky MLAD displays a graph of tags received from the monitored asset for which the selected incident was registered. The graph displays data on the preset named Tags for event #N (N represents the incident number in the Incidents section), which is generated for the date and time when the selected incident was registered. This preset includes the tags that led to incident registration. Depending on the type of detector that registered an incident, this may involve the following tags:
- Tags whose actual values were deemed the most anomalous by the ML model, if the incident was registered by the Forecaster Detector.
- Tags included in a diagnostic rule and the value obtained as a result of the operation of this rule, if the incident was registered by the Rule Detector.
- A tag whose value was outside of the set blocking thresholds, if the incident was registered by the Limit Detector.
If necessary, you can select a different preset for displaying data received from the monitored asset at the moment when the incident was registered. The graph uses a vertical blue dashed line to indicate the date and time when the incident was registered.
Example tag graph in the History section.
The tag graph is displayed in the upper part of the History section. The MSE graph is displayed in the lower part of the History section.
Tag graph in the History section
- Configuring how data is displayed on a graph in the History section
In the History section, you can enable the display of predicted tag values. This lets you assess the difference between actual tag values and predicted tag values. Enabling the display of predicted values will also let you view values obtained as a result of the work of diagnostic rules. Tag information (name, numerical ID, description, unit of measurement, time, and tag value) is displayed whenever you move your mouse cursor over a tag graph. You can also enable display of the tag name and description for each tag graph.
- Configuring the time settings for displaying data in the History section
When studying the behavior of tags, you can change the scale of the time axis or move forward or backward in time through graphs. When displaying shorter time intervals on tag graphs, the History section may show more details of the behavior of tags that had been averaged when a tag graph for a longer period was displayed.
- Changing the vertical boundaries for displaying data in the History section
The vertical scale of each graph is selected by default based on the minimum and maximum values of a tag in the displayed area. You can control the scale of graphs according to the scale of values on the vertical axis by using one of the following methods:
- If minimum and maximum permissible values (blocking thresholds) are defined for a tag, enable the Always display blocking threshold function.
If a tag value is within the permissible range, the vertical scale of the graph will be fixed by limit lines derived from the lower and upper thresholds of the tag graph. If the tag values go beyond the specified blocking thresholds, the vertical scale will be automatically changed to display the tag values exceeding the thresholds.
- In the tag properties, set the permissible boundaries for displaying tag values on graphs.
If tag values go beyond the defined boundaries, they will not be displayed on the tag graph. The permissible boundaries for displaying tag values take priority over the display of blocking thresholds, even if the Always display blocking threshold function is enabled.
- If minimum and maximum permissible values (blocking thresholds) are defined for a tag, enable the Always display blocking threshold function.
Adding a status, cause, expert opinion or note to an incident or incident group
Kaspersky MLAD lets you add an expert opinion or note to a registered incident.
An expert opinion is normally added by an expert (process engineer or ICS specialist) and may contain an incident analysis or recommendations on resolving a problem that is indicated by an identified incident. An expert opinion can be added to an individual incident or to a group of incidents. If expert opinions were previously added to incidents that are later put into a group, these opinions will also be displayed in the group (linked to each specific incident). When incidents are regrouped, the expert opinion for an incident migrates together with the incident to the new group.
Notes are intended to aid discussions between experts or operators of facilities regarding recommended actions for analysis, investigation, and remediation of an incident. Each note includes information stating who added the note and when it was added.
You can also add the cause of the incident and the incident status determined by the expert based on the incident analysis results. A status can be assigned to an individual incident or to a group of incidents. When changing the status of a group of incidents, Kaspersky MLAD changes the status of the incidents that are part of this group.
Before adding a cause, status, note or expert opinion, you must conduct an analysis of the registered incident.
To add an expert opinion, status, cause, or note to an incident:
- In the main menu, select the Incidents section.
- If necessary, change the incident status by selecting one of the following statuses from the Status drop-down list: Under review, Decision pending, Instructions issued, Problem closed, Cause unknown, Ignore, or False positive.
By default, an incident is assigned the Unknown status. If necessary, the system administrator can create, edit, or delete statuses of incidents.
- To display detailed technical specifications, click the right arrow () next to the relevant incident. In the details area that opens, you can do the following:
- If you need to add the cause of an incident, use the Incident cause field to select the cause of the incident.
If necessary, the system administrator can create, edit, or delete causes of incidents.
- If you want to add an expert opinion based on an analysis of a registered incident, click the Edit expert opinion (
 ) icon on the right of the Expert opinion field. In the field that opens, enter the opinion, and press ENTER.
The expert opinion will be added to the selected incident and will appear in the incidents table in the Incidents section.
- If you need to add a note to an incident, enter your message in the Note field and click the Add note button.
You can provide a message up to 512 characters long.
- If you need to add the cause of an incident, use the Incident cause field to select the cause of the incident.
The status, cause, expert opinion, and note will be added to the incident and will be available to other users when viewing this incident.
When two or more similar incidents are detected, Kaspersky MLAD automatically combines them into a group. The group name is also automatically assigned in the format Group #N (N is replaced by the sequence number of the group). You can edit the group name, change the status of an incident group, and edit the expert opinion containing recommendations for analyzing similar events, for example.
To add a status and expert opinion to a group of incidents:
- In the main menu, select the Incidents section and click Groups.
- If necessary, change the incident group status by selecting one of the following statuses from the Status drop-down list: Under review, Decision pending, Instructions issued, Problem closed, Cause unknown, Ignore, or False positive.
When changing the status of a group of incidents, Kaspersky MLAD changes the status of the incidents that are part of this group. By default, a group of incidents is assigned the Unknown status.
If necessary, the system administrator can create, edit, or delete statuses of incidents.
- In the incident groups table, double-click the row of the incident group.
The Edit group window opens.
You can also change the group on the Incidents tab. To do so, select the required group in the Group filter, and in the expert opinion section for the group, which is displayed above the incidents table, click the Edit button.
- To change the name of the incident group, enter a new name for the group in the Group name field.
- In the Expert opinion field, enter the text of the expert opinion (for example, recommendations for analyzing similar incidents).
- Click the Save button.
The status and expert opinion will be changed for the incident group and can now be viewed by other users in the Groups table in the Incidents section.
Page topExporting incidents to a file
Incidents registered for a specific period in Kaspersky MLAD can be exported to an XLSX file.
To save incidents registered for a specific period to a file:
- In the main menu, select the Incidents section.
- In the upper part of the opened page, select the start and end dates of the period.
- Click the Export button.
- Select a directory to save on your local drive, and save the file.
Incidents registered for the selected period in Kaspersky MLAD will be saved to an XLSX file on the local drive. The XLSX file can be opened in Microsoft Excel.
Page topManaging ML models
This section provides instructions on working with ML models, ML model templates and markups.
ML models, templates of ML models and markups are functional elements of the monitored asset hierarchical structure. The hierarchical structure is displayed as an
.In Kaspersky MLAD, ML models can be imported, created manually, copied, or created based on a template. After adding and training an ML model in Kaspersky MLAD, you can publish it. You can also run a historical or stream inference for the trained or published ML model, and view the data flow graph in the ML model.
In the Models section, you can create markups for generating
or . If necessary, you can edit or delete markups.Scenario: working with ML models
This section describes the sequence of actions required to work with ML models.
The scenario for working with ML models consists of the following steps:
- Adding an ML model
You can add an ML model to Kaspersky MLAD in one of the following ways:
- Upload an ML model created by Kaspersky specialists or by a certified integrator as part of the Kaspersky MLAD Model-building and Deployment Service. After an ML model is uploaded, it must be activated.
- Manually create an ML model. Add neural network elements and/or elements based on diagnostic rules to the created ML model.
- Create an ML model from a template. Create a template based on the relevant ML model in advance. If the original ML model used for the template was manually created, you can add neural network elements and/or elements based on diagnostic rules to the new ML model.
- Clone a previously added ML model. When cloning an ML model that was created manually or from a template based on a manually created ML model, you can add neural network elements and/or the elements based on diagnostic rules to the cloned ML model.
- Adding markups
If you need to define specific time intervals for the data that an ML model can use for training or inference, create markups. To generate an inference indicator, specify the created markup in the settings of the corresponding ML model.
- Training ML model elements
The ML model needs to be trained before you can run inference on it. To do this, all neural network elements within the ML model need to be pretrained. ML model elements based on diagnostic rules are considered to be already trained.
An ML model uploaded to Kaspersky MLAD has been previously trained by Kaspersky Lab experts or a certified integrator. ML models that are created from a template of an imported ML model or by cloning an imported ML model are also considered to be already trained. If necessary, you can change their training parameters and retrain the neural network elements.
To generate a learning indicator, specify the created markup in the learning parameters of the neural network element.
- Preparing an ML model for publication
After its training is finished, prepare the ML model for publication. An ML model ready for publishing cannot be modified.
- Publishing an ML model
After preparing the ML model for publication, notify the officer responsible for publishing the ML model that the ML model is ready, or publish the ML model if you have the required permissions. If necessary, the system administrator can create a role that has the right to publish ML models and assign this role to the relevant employee.
- Starting ML model inference
Start inference of the ML model. During the inference process, the ML model analyzes telemetry data and registers incidents.
ML model inference can be run on a published ML model as well as on a trained ML model.
Working with markups
This section provides information on working with markups.
In the Models section, you can create, modify, and delete markups. If required, you can view the graph to see the data time intervals that the ML model will use for training and/or inference.
Markups are used as training or inference indicators to point to data time intervals that the ML model can use for training or inference. To generate an inference indicator, you can select previously created markups when creating or modifying ML model settings. To generate a learning indicator, you can select previously created markups when configuring the training settings of neural network elements of the ML model.
Creating markup
You can use markup to generate learning indicators or inference of the ML model.
To create markup:
- In the main menu, select the Models section.
- In the asset tree, next to the name of the asset for which you want to create a markup, open the vertical menu
 and select Create markup.
A list of options appears on the right.
- Specify the name of the markup in the Name field.
- Enter a description for the markup in the Description field.
- In the Grid step (sec) field, specify a UTG period for markup in seconds expressed as a decimal.
- In the Markup color field, select a color that will be used to highlight data intervals selected by the markup.
- If necessary, use the toggle switch to turn on the Treat inconclusive result as positive option.
If Kaspersky MLAD cannot unequivocally evaluate the fulfillment of criteria specified in the Time filter and Tag conditions settings blocks, for example, due to the absence of observations for tags, the application will consider specified criteria to be fulfilled when this option is enabled.
- In the Time filter settings block, do the following:
- Click the Add interval button.
- In the Interval type drop-down list, select one of the following time interval types:
- Fixed. If you select this type of interval, specify the days of the week and the time interval during which the input data must be validated according to the specified criteria.
You can specify only the beginning or the end of a single interval.
- Recurrent. If you select this type of interval, specify the years, dates, days of the week, and daily time interval for periodically validating input data according to the specified criteria.
- Fixed. If you select this type of interval, specify the days of the week and the time interval during which the input data must be validated according to the specified criteria.
You can add one or more time intervals.
- To add tag behavior criteria, do the following:
- In the Tag conditions settings block, click the Condition button.
- In the Tag drop-down list, select the tag for which to add a tag behavior criterion.
If you want to exclude the selected criterion from the condition block that you are adding, click NOT to the left of the selected tag. The NOT caption in the button will be highlighted in bold.
For example, click NOT to add a condition that contains no steps with the specified settings.
- In the Behavior drop-down list, select one of the following tag behaviors that must be tracked:
- Over: the tag value exceeds the specified threshold.
- Below: the tag value falls below the specified threshold.
- Rising: the trendline of tag values is increasing.
- Falling: the trendline of tag values is decreasing.
- Level: there are no pronounced changes in the trendline of tag values.
- Step change: the trendline of the selected tag is displaying abrupt upward or downward shifts.
- Flat: the selected tag is transmitting the same value.
- Spread: abrupt changes in the spread of values are being observed around the trendline of the selected tag.
- In the Window field, specify an interval for analyzing the behavior of tags in the UTG steps.
- Depending on the value selected for Behavior, do one of the following:
- If you selected Over or Below, use the Threshold field to specify the tag threshold value, and specify the minimum number of times the threshold value can be breached in a separate window in the Minimum violations field.
- If you selected Rising, Falling, or Level, use the Threshold slope field to specify the trend slope percentage value that must be exceeded for the trend to be considered as growing or falling, and specify the time interval between adjacent trend estimates in the Evaluation period field.
By default, the Threshold slope setting is not defined. If the setting is not defined, Kaspersky MLAD will determine the trend direction automatically.
By default, the Evaluation period setting has a value of
1. With this value, the trend is estimated at each UTG node. - If you selected Step change, use the Minimum change field to specify the minimum shift value for the tag trendline, and select one of the following tag value change directions from the Direction drop-down list: Any, Up or Down.
By default, the Minimum change setting is not defined. If the setting is not defined, Kaspersky MLAD will determine it automatically.
- If you selected Flat, use the Value field to specify the value that the tag should transmit, and specify the maximum tag value spread in the Spread field.
By default, the Value setting is not defined. If the setting is not defined, any repeating tag value triggers the criterion.
- If you selected Spread, use the Minimum change field to specify the minimum value by which the tag value spread around the trendline can change, and select one of the following spread change directions in the Direction drop-down list: Any, Flare, or Shrink.
By default, the Minimum change setting is not defined. If the setting is not defined, Kaspersky MLAD will determine it automatically.
The tag behavior criterion is met when the tag spread around the trendline increases and/or decreases.
- To add a tag behavior criterion to a condition block, click the plus sign at the bottom of the condition block and repeat steps 9b through 9e.
- If the block contains more than one tag behavior criterion, select one of the following logical operators between the criterion rows:
- AND if you need to track both criteria in the markup.
- OR if you need to track one of the defined criteria in the markup.
- If you need to check whether the fulfillment of a pre-condition triggered the fulfillment of a post-condition, do the following:
- Add one of the following temporal operators:
- Wait if you need to generate the result of the criteria check in the last node of the maximum waiting interval.
- If ahead if you need to generate the result of the criteria check at the time of a pre-condition check.
The Wait and If ahead buttons are available after adding at least one condition.
A precondition is a block of conditions preceding the temporal operator. A postcondition is a block of conditions following a temporal operator.
The precondition block is checked in the current UTG node.
Markup with an If ahead temporal operator can be used in learning indicators only.
- In the Recess (steps) field, specify the following time intervals:
- from: the interval between the current UTG node and the first future UTG node, in which the post-condition block is checked (minimum waiting interval).
- to: the interval between the current UTG node and the last future UTG node, in which the post-condition block is checked (maximum waiting interval).
The post-condition block is checked in the UTG nodes between the minimum and maximum waiting intervals.
- In the Check drop-down list, select one of the following group operators:
- To check the fulfillment of tag behavior criteria from the post-conditions block in all UTG nodes between the minimum and maximum waiting intervals, select the All steps group operator.
- To check the fulfillment of tag behavior criteria from the post-conditions block in at least one UTG node between the minimum and maximum waiting intervals, select the Any step group operator.
If the Wait temporal operator is added, the criteria check result is determined in the last node of the maximum waiting interval. If the check of the precondition block in the current UTG node gave a negative result (FALSE) or an undefined result (UNDEFINED), the same value will be the result of the check of the post-condition block. If the check of the precondition block in the current UTG node gave a positive result (TRUE), then the check of the post-condition block is performed in each UTG node between the minimum and maximum waiting interval. The result of the check is determined by the fulfillment of the condition depending on the selected group operator: All steps or Any step. If more than one condition check is performed using the Wait temporal operator, the result of the previous temporal condition check is the precondition for each subsequent check of the Wait temporal condition.
If the If ahead temporal operator is added, the criteria check result is generated at the time of the precondition check.
- Add one of the following temporal operators:
- Select one of the following logical operators between markup blocks:
- AND if you need to track the tag behavior criteria in both blocks of conditions.
- OR if you need to track the tag behavior criteria in only one of the blocks of conditions.
- In the upper-right corner of the window, click the Save button.
The new markup will be displayed in the Markups group of the asset tree. The Markups group is created automatically and displayed as part of the selected section of the asset tree.
Page topViewing the markup chart
After creating markup, you can view data time intervals selected by the markup on the graph.
To view the markup chart:
- In the main menu, select the Models section.
- In the asset tree, select the markup whose chart you want to view.
A list of options appears on the right.
- Click the On graph button.
A panel with the markup chart appears on the right.
- Select the relevant preset from the Preset drop-down list.
- If necessary, in the Markups field, select the markups for displaying data intervals.
- If you need to select a date and time for displaying the data, do one of the following:
- In the Graph center field, select the date and time for which you want to display data in the chart.
The vertical black dotted line will indicate the selected date and time (in the center of the chart).
- Click the New graph center icon (
 ), which is located to the left of the time axis, and select the necessary point on the time axis.
The selected point will become the new center of the graph. The vertical black dashed line will indicate the new date and time.
- In the Graph center field, select the date and time for which you want to display data in the chart.
- If you need to select a time interval for displaying data on the chart, do one of the following:
- If you need to display data for a fixed time interval, select the relevant time interval from the Scale drop-down list. The following time intervals are available by default:
- 1, 5, 10, 15, and 30 minutes
- 1, 3, 6, and 12 hours
- 1, 2, 15, and 30 days
- 3 and 6 months
- 1, 2, and 3 years
If necessary, the system administrator can create, edit, or delete time intervals.
- To display data for a custom time interval, click the New interval (
 ) icon to the left of the time axis, select the required interval on the time axis, and click the Apply button. If you need to change the scale again, repeat this step.
- If you need to display data for a fixed time interval, select the relevant time interval from the Scale drop-down list. The following time intervals are available by default:
The chart will show the data intervals in the colors specified for the selected markups.
Page topModifying the markup
You can edit the markup settings.
To edit markup:
- In the main menu, select the Models section.
- In the asset tree, select the markup that you want to edit.
A list of options appears on the right.
- Click the Edit button.
- In the Name field, specify a new name for the markup.
- Enter a new description for the markup in the Description field.
- In the Grid step (sec) field, specify a UTG period for markup in seconds expressed as a decimal.
- In the Markup color field, select a color that will be used to highlight data intervals selected by the markup.
- If necessary, use the toggle switch to turn on the Treat inconclusive result as positive option.
If Kaspersky MLAD cannot unequivocally evaluate the fulfillment of criteria specified in the Time filter and Tag conditions settings blocks, for example, due to the absence of observations for tags, the application will consider specified criteria to be fulfilled when this option is enabled.
- If you want to edit the markup time intervals in the Time filter settings block, do the following:
- In the Interval type drop-down list, select one of the following time interval types:
- Fixed. If you select this type of interval, specify the days of the week and the time interval during which the input data must be validated according to the specified criteria.
You can specify only the beginning or the end of a single interval.
- Recurrent. If you select this type of interval, specify the years, dates, days of the week, and daily time interval for periodically validating input data according to the specified criteria.
- Fixed. If you select this type of interval, specify the days of the week and the time interval during which the input data must be validated according to the specified criteria.
- If you want to add an interval, click the Add interval button and complete step 9a.
- If you want to delete an interval, move the mouse cursor over the row with the required interval and click the Delete interval (
 ) icon.
You can add one or more time intervals.
- In the Interval type drop-down list, select one of the following time interval types:
- To edit a tag behavior condition, do the following:
- In the Tag drop-down list, select the tag for which to add a tag behavior criterion.
If you want to exclude the selected criterion from the condition block that you are adding, click NOT to the left of the selected tag. The NOT caption in the button will be highlighted in bold.
For example, click NOT to add a condition that contains no steps with the specified settings.
- In the Behavior drop-down list, select one of the following tag behaviors that must be tracked:
- Over: the tag value exceeds the specified threshold.
- Below: the tag value falls below the specified threshold.
- Rising: the trendline of tag values is increasing.
- Falling: the trendline of tag values is decreasing.
- Level: there are no pronounced changes in the trendline of tag values.
- Step change: the trendline of the selected tag is displaying abrupt upward or downward shifts.
- Flat: the selected tag is transmitting the same value.
- Spread: abrupt changes in the spread of values are being observed around the trendline of the selected tag.
- In the Window field, specify the number of UTG steps.
- Depending on the value selected for Behavior, do one of the following:
- If you selected Over or Below, use the Threshold field to specify the tag threshold value, and specify the minimum number of times the threshold value can be breached in a separate window in the Minimum violations field.
- If you selected Rising, Falling, or Level, use the Threshold slope field to specify the trend slope percentage value that must be exceeded for the trend to be considered as growing or falling, and specify the time interval between adjacent trend estimates in the Evaluation period field.
By default, the Threshold slope setting is not defined. If the setting is not defined, Kaspersky MLAD will determine the trend direction automatically.
By default, the Evaluation period setting has a value of
1. With this value, the trend is estimated at each UTG node. - If you selected Step change, use the Minimum change field to specify the minimum shift value for the tag trendline, and select one of the following tag value change directions from the Direction drop-down list: Any, Up or Down.
By default, the Minimum change setting is not defined. If the setting is not defined, Kaspersky MLAD will determine it automatically.
- If you selected Flat, use the Value field to specify the value that the tag should transmit, and specify the maximum tag value spread in the Spread field.
By default, the Value setting is not defined. If the setting is not defined, any repeating tag value triggers the criterion.
- If you selected Spread, use the Minimum change field to specify the minimum value by which the tag value spread around the trendline can change, and select one of the following spread change directions in the Direction drop-down list: Any, Flare, or Shrink.
By default, the Minimum change setting is not defined. If the setting is not defined, Kaspersky MLAD will determine it automatically.
The tag behavior criterion is met when the tag spread around the trendline increases and/or decreases.
- To add a tag behavior criterion to a condition block, click the plus sign at the bottom of the condition block and repeat steps 10a through 10d.
- If the block contains more than one tag behavior criterion, select one of the following logical operators between the criterion rows:
- AND if you need to track both criteria in the markup.
- OR if you need to track one of the defined criteria in the markup.
- To delete a tag behavior criterion from a condition block, hover over the row with the required condition and click the cross icon ().
- In the Tag drop-down list, select the tag for which to add a tag behavior criterion.
- If you want to edit the conditions of the temporal operator Wait and/or If ahead, do the following:
- In the Recess (steps) field, specify the following time intervals:
- from: the interval between the current UTG node and the first future UTG node, in which the post-condition block is checked (minimum waiting interval).
- to: the interval between the current UTG node and the last future UTG node, in which the post-condition block is checked (maximum waiting interval).
The post-condition block is checked in the UTG nodes between the minimum and maximum waiting intervals.
- In the Check drop-down list, select one of the following group operators:
- To check the fulfillment of tag behavior criteria from the post-conditions block in all UTG nodes between the minimum and maximum waiting intervals, select the All steps group operator.
- To check the fulfillment of tag behavior criteria from the post-conditions block in at least one UTG node between the minimum and maximum waiting intervals, select the Any step group operator.
If the Wait temporal operator is added, the criteria check result is determined in the last node of the maximum waiting interval. If the check of the precondition block in the current UTG node gave a negative result (FALSE) or an undefined result (UNDEFINED), the same value will be the result of the check of the post-condition block. If the check of the precondition block in the current UTG node gave a positive result (TRUE), then the check of the post-condition block is performed in each UTG node between the minimum and maximum waiting interval. The result of the check is determined by the fulfillment of the condition depending on the selected group operator: All steps or Any step. If more than one condition check is performed using the Wait temporal operator, the result of the previous temporal condition check is the precondition for each subsequent check of the Wait temporal condition.
If the If ahead temporal operator is added, the criteria check result is generated at the time of the precondition check.
- In the Recess (steps) field, specify the following time intervals:
- Select one of the following logical operators between markup blocks:
- AND if you need to track the tag behavior criteria in both blocks of conditions.
- OR if you need to track the tag behavior criteria in only one of the blocks of conditions.
- In the upper-right corner of the window, click the Save button.
Removing markup
You can delete markup if it is not used for training or inference of any ML model.
To delete markup:
- In the main menu, select the Models section.
- In the asset tree, select the markup that you want to delete.
A list of options appears on the right.
- In the upper-right corner of the window, click the trash bin icon (
 ).
). - In the window that opens, confirm the deletion of the markup.
Working with imported ML models
This section provides information about working with imported ML models and their elements.
ML models can be provided by Kaspersky specialists or certified integrators within the Kaspersky MLAD Model-building and Deployment Service. Such ML models must be uploaded to Kaspersky MLAD and activated. You cannot create new elements for an imported ML model, or delete existing elements.
Upon uploading into Kaspersky MLAD the ML model is already trained. If necessary, you can additionally train the neural network elements as part of the uploaded ML model before publishing it and/or executing its inference.
Uploading an ML model
If the ML model was created by Kaspersky specialists or a certified integrator, you can load this ML model into Kaspersky MLAD.
Kaspersky MLAD may slow down its operation when uploading an ML model whose size exceeds 1 GB.
System administrators and users who have the Upload models permission from the Manage ML models group of rights can upload ML models.
To upload an ML model:
- In the main menu, select the Models section.
- In the asset tree, next to the name of the asset for which the ML model is to be imported, open the vertical menu and select Import model.
- In the opened window, select the ML model file.
An ML model file is provided as a TAR archive with a maximum size of 1.5 GB.
The ML model will be uploaded to Kaspersky MLAD. The new ML model displays in the Models group of the asset tree. The Models group is created automatically and displayed as part of the selected section of the asset tree. The Models group contains the Neural networks and Rules subgroups for storing ML model elements based on neural networks and diagnostic rules.
After being uploaded, the ML model is assigned the Not activated status. The ML model must be activated. If you upload an ML model that was previously activated and then deleted, you do not need to reactivate the ML model.
Page topActivating an imported ML model
After an ML model prepared by Kaspersky specialists or a certified integrator has been uploaded into Kaspersky MLAD, it must be activated.
If the ML model activation code is lost, send a request to Kaspersky to receive a new code.
System administrators and users who have the Activate models permission from the Manage ML models group of rights can activate imported ML models.
To activate an imported ML model:
- In the main menu, select the Models section.
- In the asset tree, select the imported ML model.
The details area appears on the right.
- In the Model activation code field, enter the code received from Kaspersky personnel, and click the Activate button in the upper right part of the window.
ML model is activated. It will be assigned the Trained status. You can to start ML model inference to begin the analysis of telemetry data received from the monitored asset.
Page topChanging the parameters of an element of an imported ML model
You can change some parameters of an element of an imported ML model.
System administrators and users who have the Edit model drafts permission from the Manage ML models group of rights can edit the settings of elements of imported ML models.
To change the parameters of an imported ML model element:
- In the main menu, select the Models section.
- In the asset tree, select the ML model element that you want to change.
A list of options appears on the right.
- In the upper-right corner of the window, click the Edit button.
- In the Name field, specify the name of the ML model element.
- Enter a description for the ML model element in the Description field.
- If necessary, in the General element settings settings block, do the following:
- In the Reminder period (sec) field, specify the period in seconds, upon reaching which the ML model will generate a repeated incident if anomalous behavior is retained in each UTG node.
The default value of this setting is
0, which corresponds to no reminders. - In the Period of recurring alert suppression (sec) field, specify the period in seconds during which the ML model does not log repeated incidents for the same element.
The default value of this setting is
0(repeat incidents not suppressed). - In the Incident status drop-down list, select a status to be automatically assigned to incidents logged by the ML model element.
- In the Incident cause drop-down list, select the cause to be automatically set for incidents logged by the ML model element.
- In the Color of incident dot indicators field, select the color of the indicator points of the incidents logged by the ML model element on the graphs in the Monitoring and History sections.
- In the Detection threshold field, specify a prediction error threshold value upon reaching which an incident is logged.
The detection threshold value was set after training an element of the imported ML model. Modifying this setting changes detector sensitivity.
- In the Expert opinion field, specify the expert opinion to be automatically created for incidents logged by the ML model element.
- In the Reminder period (sec) field, specify the period in seconds, upon reaching which the ML model will generate a repeated incident if anomalous behavior is retained in each UTG node.
- In the upper-right corner of the window, click the Save button.
Working with manually created ML models
This section provides information about working with manually created ML models and their elements.
If you create an ML model manually, you can add elements of ML models based on neural networks and/or diagnostic rules, modify or delete them.
The ML model needs to be trained before you can run inference on it. To do this, all neural network elements within the ML model need to be pretrained. If necessary, you can view the training results of the neural network elements. Elements based on diagnostic rules are considered as trained.
You can also start inference after publishing the ML model. After inference is started, Kaspersky MLAD will register incidents.
Creating an ML model
System administrators and users who have the Create models permission from the Manage ML models group of rights can create ML models.
To create an ML model:
- In the main menu, select the Models section.
- In the asset tree, next to the name of the asset for which you want to create an ML model, open the vertical menu and select Create model.
A list of options appears on the right.
- In the Name field, specify the ML model name.
The ML model name must not be longer than 100 characters.
- In the Description field, specify the ML model description.
- If you need to apply markups when selecting data for ML model inference, select the required markups under Inference indicator.
- To view the data that will be selected by the markups, click On graph.
Markups are displayed in the colors selected when they were created.
- In the upper-right corner of the window, click the Save button.
The new ML model displays in the Models group of the asset tree. The Models group is created automatically and displayed as part of the selected section of the asset tree. The Models group contains the Neural networks and Rules subgroups for storing ML model elements based on neural networks and diagnostic rules.
The ML model is assigned the Draft status.
Page topAdding a neural network element to an ML model
System administrators and users who have the Create models permission from the Manage ML models group of rights can add ML model elements.
To add a neural network element to an ML model:
- In the main menu, select the Models section.
- In the asset tree, next to the Neural networks group within the ML model to which you want to add a neural network element, open the vertical menu and select Create element.
A list of options appears on the right.
- In the Name field, specify the name of the ML model element.
- Enter a description for the ML model element in the Description field.
- In the General element settings settings block, do the following:
- In the Reminder period (sec) field, specify the period in seconds, upon reaching which the ML model will generate a repeated incident if anomalous behavior is retained in each UTG node.
The default value of this setting is
0, which corresponds to no reminders. - In the Period of recurring alert suppression (sec) field, specify the period in seconds during which the ML model does not log repeated incidents for the same element.
The default value of this setting is
0(repeat incidents not suppressed). - In the Grid step (sec) field, specify the element's UTG period in seconds expressed as a decimal.
- In the Incident status drop-down list, select a status to be automatically assigned to incidents logged by the ML model element.
- In the Incident cause drop-down list, select the cause to be automatically set for incidents logged by the ML model element.
- In the Color of incident dot indicators field, select the color of the indicator points of the incidents logged by the ML model element on the graphs in the Monitoring and History sections.
- In the Detection threshold field, specify a prediction error threshold value upon reaching which an incident is logged.
- In the Expert opinion field, specify the expert opinion to be automatically created for incidents logged by the ML model element.
- In the Reminder period (sec) field, specify the period in seconds, upon reaching which the ML model will generate a repeated incident if anomalous behavior is retained in each UTG node.
- Select one of the following ML model neural network element architectures: Dense, RNN, CNN, TCN, or Transformer.
- If you need to specify the architecture parameters of a neural network element and the power exponent and smoothing value of the cumulative prediction error, use the toggle switch to enable Advanced neural network settings.
- In the Main settings block, do the following:
- In the Input tags drop-down list, select one or more tags that serve as the source data for predicting the values of the output tags.
- In the Output tags drop-down list, select one or several tags whose behavior is predicted by the model element.
- If extended setup mode is enabled, use the MSE power exponent field to specify the cumulative prediction error power exponent in decimal format.
- If extended setup mode is enabled, use the Smoothing factor field to specify the cumulative prediction error smoothing value in decimal format.
- In the Window settings settings block, do the following:
- In the Input window (steps) field, specify the size of the input value window, from which the ML model element predicts the output values.
- In the Output window offset field, specify the number of steps by which the beginning of the output window will be shifted relative to the beginning of the input window.
- In the Output window (steps) field, specify an output tag prediction length calculated from the input tags on the input window.
- If you are adding a neural network element with a dense architecture, do the following:
- In the Multipliers for calculating number of neurons per layer field, provide the factors, separated by a comma without spaces, by which to multiply the number of input tags to calculate the number of neurons per layer of the ML model element.
- In the Activation function per layer field, specify one of the following activation functions on each layer of an ML model element separated by a comma without spaces:
relu: A non-linear activation function that converts an input value to a value between0and positive infinity.selu: A monotonically increasing function that enables normalization based on the central limit theorem.linear: A linear function that is a straight line proportional to the input data.sigmoid: A non-linear function that converts input values to values between0and1.tanh: A hyperbolic tangent function that converts input values to values between-1and1.softmax: A function that converts a vector of values to a probability distribution that adds up to1.
The default value of this setting is
relu,relu,relu.
- If you are adding a neural network element with an RNN architecture, do the following:
- In the GRU neurons per layer field, specify the number of GRU neurons on layers separated by a comma without spaces.
The default value of this parameter is
40,40. - In the Number of neurons in TimeDistributed layer field, specify the number of neurons distributed in time on the layers of the decoder separated by a comma without spaces.
The default value of this parameter is
40,20.
- In the GRU neurons per layer field, specify the number of GRU neurons on layers separated by a comma without spaces.
- If you are adding a neural network element with an CNN architecture, do the following:
- In the Filter size per layer field, specify the size of the filters for each layer of the element separated by a comma without spaces.
The default value of this parameter is
2,2,2. - In the Filters per layer field, specify the number of filters for each layer of the ML model element separated by a comma without spaces.
The default value of this parameter is
50,50,50. - In the MaxPooling window size per layer field, specify the maximum sampling window size on each layer separated by a comma without spaces.
The default value of this parameter is
2,2,2. - In the Number of neurons in decoder field, specify the number of neurons on the layers of the decoder.
- In the Filter size per layer field, specify the size of the filters for each layer of the element separated by a comma without spaces.
- If you are adding a neural network element with an TCN architecture, do the following:
- In the Regularization field, specify the regularization coefficient in decimal format to prevent overfitting of the ML model element.
The default value of this parameter is
0.1. - In the Size of filters field, specify the size of the filters for the ML model element.
The default value of this parameter is
2. - In the Dilation per layer field, specify the exponential expansion values of the output data on the layers as a comma-separated list.
The default value of this parameter is
1,2,4. - In the Activation function drop-down list, select one of the following activation functions:
- linear: A linear activation function whose result is proportional to the input value.
- relu: A non-linear activation function that converts an input value to a value between zero and positive infinity. If the input value is less than or equal to zero, the function returns a value of zero; otherwise, the function returns the input value.
The default value of this parameter is linear.
- In the Number of stacks of residual blocks field, specify the number of encoders.
The default value of this parameter is
1. - In the Decoder layer type field, select one of the following types of layer to precede the output layer:
- TimeDistributedDense (default): A fully connected architecture layer.
- GRU: A layer with a recurrent architecture.
- In the Regularization field, specify the regularization coefficient in decimal format to prevent overfitting of the ML model element.
- If you are adding a neural network element with a transformer architecture, do the following:
- In the Encoder regularization field, specify the regularization coefficient in the encoder in decimal format.
The default value of this parameter is
0.01. - In the Number of attention heads field, specify the number of attention heads.
The default value of this parameter is
1. - In the Number of encoders field, specify the number of encoders.
The default value of this parameter is
1. - In the Multipliers for calculating number of neurons per layer field, provide the factors, separated by a comma without spaces, by which to multiply the number of input tags to calculate the number of neurons in the decoding layers.
- In the Encoder regularization field, specify the regularization coefficient in the encoder in decimal format.
- In the upper-right corner of the window, click the Save button.
The new ML model element will be displayed in the Neural networks group within the selected ML model in the asset tree.
The ML model is assigned the Draft status. Before running inference of an ML model, you must train all of its neural network elements.
Page topModifying a neural network element of the ML model
You can edit the settings of a neural network element of the ML model.
System administrators and users who have the Edit model drafts permission from the Manage ML models group of rights can edit elements of ML models.
To edit a neural network element of an ML model:
- In the main menu, select the Models section.
- In the asset tree, select the neural network element that you want to edit.
A list of options appears on the right.
- In the upper-right corner of the window, click the Edit button.
- In the Name field, specify a new name for the ML model element.
- In the Description field, specify a new description for the ML model.
- If necessary, in the General element settings settings block, do the following:
- In the Reminder period (sec) field, specify the period in seconds, upon reaching which the ML model will generate a repeated incident if anomalous behavior is retained in each UTG node.
The default value of this setting is
0, which corresponds to no reminders. - In the Period of recurring alert suppression (sec) field, specify the period in seconds during which the ML model does not log repeated incidents for the same element.
The default value of this setting is
0(repeat incidents not suppressed). - In the Grid step (sec) field, specify the element's UTG period in seconds expressed as a decimal.
- In the Incident status drop-down list, select a status to be automatically assigned to incidents logged by the ML model element.
- In the Incident cause drop-down list, select the cause to be automatically set for incidents logged by the ML model element.
- In the Color of incident dot indicators field, select the color of the indicator points of the incidents logged by the ML model element on the graphs in the Monitoring and History sections.
- In the Detection threshold field, specify a prediction error threshold value upon reaching which an incident is logged.
- In the Expert opinion field, specify the expert opinion to be automatically created for incidents logged by the ML model element.
- In the Reminder period (sec) field, specify the period in seconds, upon reaching which the ML model will generate a repeated incident if anomalous behavior is retained in each UTG node.
- If necessary, edit the architecture of the neural network element.
Kaspersky MLAD supports the following ML model neural network element architectures: Dense, RNN, CNN, TCN, or Transformer.
- If you need to change the architecture parameters of a neural network element and the power exponent and smoothing value of the cumulative prediction error, use the toggle switch to enable Advanced neural network settings.
- If necessary, in the Main settings settings block, do the following:
- In the Input tags drop-down list, select one or more tags that serve as the source data for predicting the values of the output tags.
- In the Output tags drop-down list, select one or several tags whose behavior is predicted by the model element.
- If extended setup mode is enabled, use the MSE power exponent field to specify the cumulative prediction error power exponent in decimal format.
- If extended setup mode is enabled, use the Smoothing factor field to specify the cumulative prediction error smoothing value in decimal format.
- If necessary, in the Window settings settings block, do the following:
- In the Input window (steps) field, specify the size of the input value window, from which the ML model element predicts the output values.
- In the Output window offset field, specify the number of steps by which the beginning of the output window will be shifted relative to the beginning of the input window.
- In the Output window (steps) field, specify an output tag prediction length calculated from the input tags on the input window.
- If you have selected a neural network element with a dense architecture, do the following:
- In the Multipliers for calculating number of neurons per layer field, provide the multipliers, separated by a comma without spaces, by which to multiply the number of input tags to calculate the number of neurons in the ML model element layers.
- In the Activation function per layer field, specify one of the following activation functions on each layer of an ML model element separated by a comma without spaces:
relu: A non-linear activation function that converts an input value to a value between0and positive infinity.selu: A monotonically increasing function that enables normalization based on the central limit theorem.linear: A linear function that is a straight line proportional to the input data.sigmoid: A non-linear function that converts input values to values between0and1.tanh: A hyperbolic tangent function that converts input values to values between-1and1.softmax: A function that converts a vector of values to a probability distribution that adds up to1.
The default value of this setting is
relu,relu,relu.
- If you are adding a neural network element with an RNN architecture, do the following:
- In the GRU neurons per layer field, specify the number of GRU neurons on layers separated by a comma without spaces.
The default value of this parameter is
40,40. - In the Number of neurons in TimeDistributed layer field, specify the number of neurons distributed in time on the layers of the decoder separated by a comma without spaces.
The default value of this parameter is
40,20.
- In the GRU neurons per layer field, specify the number of GRU neurons on layers separated by a comma without spaces.
- If you have selected a neural network element with a CNN architecture, do the following in the CNN architecture settings settings block:
- In the Filter size per layer field, specify the size of the filters for each layer of the element separated by a comma without spaces.
The default value of this parameter is
2,2,2. - In the Filters per layer field, specify the number of filters for each layer of the ML model element separated by a comma without spaces.
The default value of this parameter is
50,50,50. - In the MaxPooling window size per layer field, specify the maximum sampling window size values separated by a comma without spaces.
The default value of this parameter is
2,2,2. - In the Number of neurons in decoder field, specify the number of neurons on the layers of the decoder.
- In the Filter size per layer field, specify the size of the filters for each layer of the element separated by a comma without spaces.
- If you have selected a neural network element with a TCN architecture, do the following:
- In the Regularization field, specify the regularization coefficient in decimal format to prevent overfitting of the ML model element.
The default value of this parameter is
0.1. - In the Size of filters field, specify the sizes of the filters for the ML model element.
The default value of this parameter is
2. - In the Dilation per layer field, specify the exponential expansion values of the output data on the layers separated by a comma without spaces.
The default value of this parameter is
1,2,4. - In the Activation function drop-down list, select one of the following activation functions:
- linear: A linear activation function whose result is proportional to the input value.
- relu: A non-linear activation function that converts an input value to a value between zero and positive infinity. If the input value is less than or equal to zero, the function returns a value of zero; otherwise, the function returns the input value.
The default value of this parameter is linear.
- In the Number of stacks of residual blocks field, specify the number of encoders.
The default value of this parameter is
1. - In the Decoder layer type field, select one of the following types of layer to precede the output layer:
- TimeDistributedDense (default): A fully connected architecture layer.
- GRU: A layer with a recurrent architecture.
- In the Regularization field, specify the regularization coefficient in decimal format to prevent overfitting of the ML model element.
- If you have selected a neural network element with a transformer architecture, do the following:
- In the Encoder regularization field, specify the regularization coefficient in the encoder in decimal format.
The default value of this parameter is
0.01. - In the Number of attention heads field, specify the number of attention heads.
The default value of this parameter is
1. - In the Number of encoders field, specify the number of encoders.
The default value of this parameter is
1. - In the Multipliers for calculating number of neurons per layer field, provide the factors, separated by a comma without spaces, by which to multiply the number of input tags to calculate the number of neurons in the decoding layers.
- In the Encoder regularization field, specify the regularization coefficient in the encoder in decimal format.
- In the upper-right corner of the window, click the Save button.
Adding an ML model element based on a diagnostic rule
System administrators and users who have the Create models permission from the Manage ML models group of rights can add ML model elements.
To add an ML model element based on a diagnostic rule:
- In the main menu, select the Models section.
- In the asset tree, next to the Rules group within an ML model to which you want to add a diagnostic rule, open the vertical menu and select Create element.
A list of options appears on the right.
- In the Name field, specify a name for the diagnostic rule.
- In the Description field, specify the diagnostic rule description.
- In the General element settings settings block, do the following:
- In the Reminder period (sec) field, specify the period in seconds, upon reaching which the ML model will generate a repeated incident if anomalous behavior is retained in each UTG node.
The default value of this setting is
0, which corresponds to no reminders. - In the Period of recurring alert suppression (sec) field, specify the period in seconds during which the ML model does not log repeated incidents for the same element.
The default value of this setting is
0(repeat incidents not suppressed). - In the Grid step (sec) field, specify the element's UTG period in seconds expressed as a decimal.
- In the Incident status drop-down list, select a status to be automatically assigned to incidents logged by the ML model element.
- In the Incident cause drop-down list, select the cause to be automatically set for incidents logged by the ML model element.
- In the Color of incident dot indicators field, select the color of the indicator points of the incidents logged by the ML model element on the graphs in the Monitoring and History sections.
- In the Expert opinion field, specify the expert opinion to be automatically created for incidents logged by the ML model element.
- In the Reminder period (sec) field, specify the period in seconds, upon reaching which the ML model will generate a repeated incident if anomalous behavior is retained in each UTG node.
- If necessary, use the toggle switch to turn on the Treat inconclusive result as positive option.
If Kaspersky MLAD cannot unequivocally evaluate the fulfillment of criteria specified in the Time filter and Tag conditions settings blocks, for example, due to the absence of observations for tags, the application will consider a rule to be triggered when this option is enabled.
- In the Time filter settings block, do the following:
- Click the Add interval button.
- In the Interval type drop-down list, select one of the following time interval types:
- Fixed. If you select this type of interval, specify the days of the week and the time interval during which the input data must be validated according to the specified criteria.
You can specify only the beginning or the end of a single interval.
- Recurrent. If you select this type of interval, specify the years, dates, days of the week, and daily time interval for periodically validating input data according to the specified criteria.
- Fixed. If you select this type of interval, specify the days of the week and the time interval during which the input data must be validated according to the specified criteria.
- If you want to add one more interval, click the Add interval button and complete step 7b.
- If you want to delete an interval, move the mouse cursor over the row with the required interval and click the Delete interval ( ) icon.
You can add one or more time intervals. If no time interval is specified, the diagnostic rule is applied in each UTG node.
- To add tag behavior criteria, do the following:
- In the Tag conditions settings block, click the Condition button.
- In the Tag drop-down list, select the tag for which to add a tag behavior criterion.
If you want to exclude the selected criterion from the condition block that you are adding, click NOT to the left of the selected tag. The NOT caption in the button will be highlighted in bold.
For example, click NOT to add a condition that contains no steps with the specified settings.
- In the Behavior drop-down list, select one of the following tag behaviors that must be tracked:
- Over: the tag value exceeds the specified threshold.
- Below: the tag value falls below the specified threshold.
- Rising: the trendline of tag values is increasing.
- Falling: the trendline of tag values is decreasing.
- Level: there are no pronounced changes in the trendline of tag values.
- Step change: the trendline of the selected tag is displaying abrupt upward or downward shifts.
- Flat: the selected tag is transmitting the same value.
- Spread: abrupt changes in the spread of values are being observed around the trendline of the selected tag.
- In the Window field, specify the number of UTG steps.
- Depending on the value selected for Behavior, do one of the following:
- If you selected Over or Below, use the Threshold field to specify the tag threshold value, and specify the minimum number of times the threshold value can be breached in a separate window in the Minimum violations field.
- If you selected Rising, Falling, or Level, use the Threshold slope field to specify the trend slope percentage value that must be exceeded for the trend to be considered as growing or falling, and specify the time interval between adjacent trend estimates in the Evaluation period field.
By default, the Threshold slope setting is not defined. If the setting is not defined, Kaspersky MLAD will determine the trend direction automatically.
By default, the Evaluation period setting has a value of
1. With this value, the trend is estimated at each UTG node. - If you selected Step change, use the Minimum change field to specify the minimum shift value for the tag trendline, and select one of the following tag value change directions from the Direction drop-down list: Any, Up or Down.
By default, the Minimum change setting is not defined. If the setting is not defined, Kaspersky MLAD will determine it automatically.
- If you selected Flat, use the Value field to specify the value that the tag should transmit, and specify the maximum tag value spread in the Spread field.
By default, the Value setting is not defined. If the setting is not defined, any repeating tag value triggers the criterion.
- If you selected Spread, use the Minimum change field to specify the minimum value by which the tag value spread around the trendline can change, and select one of the following spread change directions in the Direction drop-down list: Any, Flare, or Shrink.
By default, the Minimum change setting is not defined. If the setting is not defined, Kaspersky MLAD will determine it automatically.
The tag behavior criterion is met when the tag spread around the trendline increases and/or decreases.
- To add a tag behavior criterion to a condition block, click the plus sign at the bottom of the condition block and repeat steps 8b through 8e.
- If the block contains more than one tag behavior criterion, select one of the following logical operators between the criterion rows:
- AND if you need to track both criteria while a diagnostic rule is active.
- OR if you need to track one of the defined criteria while a diagnostic rule is active.
- If you need to check whether the fulfillment of a pre-condition caused the fulfillment of a post-condition in a future UTG node, add a temporal operator:
- In the Tag conditions settings block, click the Wait button.
The Wait button is available after at least one condition has been added.
A precondition is a block of conditions preceding the temporal operator. A postcondition is a block of conditions following a temporal operator.
The precondition block is checked in the current UTG node.
- In the Recess (steps) field, specify the following time intervals:
- from: the interval between the current UTG node and the first future UTG node, in which the post-condition block is checked (minimum waiting interval).
- to: the interval between the current UTG node and the last future UTG node, in which the post-condition block is checked (maximum waiting interval).
The post-condition block is checked in the UTG nodes between the minimum and maximum waiting intervals.
- In the Check drop-down list, select one of the following group operators:
- To check the fulfillment of tag behavior criteria from the post-conditions block in all UTG nodes between the minimum and maximum waiting intervals, select the All steps group operator.
- To check the fulfillment of tag behavior criteria from the post-conditions block in at least one UTG node between the minimum and maximum waiting intervals, select the Any step group operator.
The criteria check result is determined in the last node of the maximum waiting interval. If the check of the precondition block in the current UTG node gave a negative result (FALSE) or an undefined result (UNDEFINED), the same value will be the result of the check of the post-condition block.
If the check of the precondition block in the current UTG node gave a positive result (TRUE), then the check of the post-condition block is performed in each UTG node between the minimum and maximum waiting interval. The result of the check is determined by the fulfillment of the condition depending on the selected group operator: All steps or Any step.
If more than one condition check is performed using the temporal operator, then the result of the check of the previous temporal condition is a precondition for each subsequent check of the temporal condition.
- In the Tag conditions settings block, click the Wait button.
- Select one of the following logical operators between rule blocks:
- AND if you need to track tag behavior criteria in both blocks while a diagnostic rule is active.
- OR if you need to track tag behavior criteria in one of the blocks while a diagnostic rule is active.
- In the upper-right corner of the window, click the Save button.
The new ML model element will be displayed in the Rules group within the selected ML model in the asset tree.
If an ML model contains only elements based on diagnostic rules, the model is assigned the Trained status. You can start inference for such an ML model. If the ML model contains untrained neural network elements, they must be trained before starting inference.
Page topChanging an ML model element based on a diagnostic rule
You can change the settings of an ML model element based on a diagnostic rule.
System administrators and users who have the Edit model drafts permission from the Manage ML models group of rights can edit elements of ML models.
To change an element of an ML model based on a diagnostic rule:
- In the main menu, select the Models section.
- In the asset tree, select the element based on a diagnostic rule that you want to edit.
A list of options appears on the right.
- In the upper-right corner of the window, click the Edit button.
- In the Name field, specify a new name for the diagnostic rule.
- In the Description field, specify a new description for the diagnostic rule.
- If necessary, in the General element settings settings block, do the following:
- In the Reminder period (sec) field, specify the period in seconds, upon reaching which the ML model will generate a repeated incident if anomalous behavior is retained in each UTG node.
The default value of this setting is
0, which corresponds to no reminders. - In the Period of recurring alert suppression (sec) field, specify the period in seconds during which the ML model does not log repeated incidents for the same element.
The default value of this setting is
0(repeat incidents not suppressed). - In the Grid step (sec) field, specify the UTG period for the element in seconds.
- In the Incident status drop-down list, select a status to be automatically assigned to incidents logged by the ML model element.
- In the Incident cause drop-down list, select the cause to be automatically set for incidents logged by the ML model element.
- In the Color of incident dot indicators field, select the color of the indicator points of the incidents logged by the ML model element on the graphs in the Monitoring and History sections.
- In the Expert opinion field, specify the expert opinion to be automatically created for incidents logged by the ML model element.
- In the Reminder period (sec) field, specify the period in seconds, upon reaching which the ML model will generate a repeated incident if anomalous behavior is retained in each UTG node.
- If necessary, use the toggle switch to turn on the Treat inconclusive result as positive option.
If Kaspersky MLAD cannot unequivocally evaluate the fulfillment of criteria specified in the Time filter and Tag conditions settings blocks, for example, due to the absence of observations for tags, the application will consider a rule to be triggered when this option is enabled.
- If necessary, do the following in the Time filter settings block:
- In the Interval type drop-down list, select one of the following time interval types:
- Fixed. If you select this type of interval, specify the days of the week and the time interval during which the input data must be validated according to the specified criteria.
You can specify only the beginning or the end of a single interval.
- Recurrent. If you select this type of interval, specify the years, dates, days of the week, and daily time interval for periodically validating input data according to the specified criteria.
- Fixed. If you select this type of interval, specify the days of the week and the time interval during which the input data must be validated according to the specified criteria.
- If you want to add one more interval, click the Add interval button and complete step 8a.
- If you want to delete an interval, move the mouse cursor over the row with the required interval and click the Delete interval ( ) icon.
You can add one or more time intervals. If no time interval is specified, the diagnostic rule is applied in each UTG node.
- In the Interval type drop-down list, select one of the following time interval types:
- To edit a tag behavior condition, do the following:
- In the Tag drop-down list, select the tag for which to add a tag behavior criterion.
If you want to exclude the selected criterion from the condition block that you are adding, click NOT to the left of the selected tag. The NOT caption in the button will be highlighted in bold.
For example, click NOT to add a condition that contains no steps with the specified settings.
- In the Behavior drop-down list, select one of the following tag behaviors that must be tracked:
- Over: the tag value exceeds the specified threshold.
- Below: the tag value falls below the specified threshold.
- Rising: the trendline of tag values is increasing.
- Falling: the trendline of tag values is decreasing.
- Level: there are no pronounced changes in the trendline of tag values.
- Step change: the trendline of the selected tag is displaying abrupt upward or downward shifts.
- Flat: the selected tag is transmitting the same value.
- Spread: abrupt changes in the spread of values are being observed around the trendline of the selected tag.
- In the Window field, specify the number of UTG steps.
- Depending on the value selected for Behavior, do one of the following:
- If you selected Over or Below, use the Threshold field to specify the tag threshold value, and specify the minimum number of times the threshold value can be breached in a separate window in the Minimum violations field.
- If you selected Rising, Falling, or Level, use the Threshold slope field to specify the trend slope percentage value that must be exceeded for the trend to be considered as growing or falling, and specify the time interval between adjacent trend estimates in the Evaluation period field.
By default, the Threshold slope setting is not defined. If the setting is not defined, Kaspersky MLAD will determine the trend direction automatically.
By default, the Evaluation period setting has a value of
1. With this value, the trend is estimated at each UTG node. - If you selected Step change, use the Minimum change field to specify the minimum shift value for the tag trendline, and select one of the following tag value change directions from the Direction drop-down list: Any, Up or Down.
By default, the Minimum change setting is not defined. If the setting is not defined, Kaspersky MLAD will determine it automatically.
- If you selected Flat, use the Value field to specify the value that the tag should transmit, and specify the maximum tag value spread in the Spread field.
By default, the Value setting is not defined. If the setting is not defined, any repeating tag value triggers the criterion.
- If you selected Spread, use the Minimum change field to specify the minimum value by which the tag value spread around the trendline can change, and select one of the following spread change directions in the Direction drop-down list: Any, Flare, or Shrink.
By default, the Minimum change setting is not defined. If the setting is not defined, Kaspersky MLAD will determine it automatically.
The tag behavior criterion is met when the tag spread around the trendline increases and/or decreases.
- To add a tag behavior criterion to a condition block, click the plus sign at the bottom of the condition block and repeat steps 9a through 9d.
- If the block contains more than one tag behavior criterion, select one of the following logical operators between the criterion rows:
- AND if you need to track both criteria while a diagnostic rule is active.
- OR if you need to track one of the defined criteria while a diagnostic rule is active.
- In the Tag drop-down list, select the tag for which to add a tag behavior criterion.
- If you need to edit the temporal operator:
- In the Recess (steps) field, specify the following time intervals:
- from: the interval between the current UTG node and the first future UTG node, in which the post-condition block is checked (minimum waiting interval).
- to: the interval between the current UTG node and the last future UTG node, in which the post-condition block is checked (maximum waiting interval).
The post-condition block is checked in the UTG nodes between the minimum and maximum waiting intervals.
- In the Check drop-down list, select one of the following group operators:
- To check the fulfillment of tag behavior criteria from the post-conditions block in all UTG nodes between the minimum and maximum waiting intervals, select the All steps group operator.
- To check the fulfillment of tag behavior criteria from the post-conditions block in at least one UTG node between the minimum and maximum waiting intervals, select the Any step group operator.
The criteria check result is determined in the last node of the maximum waiting interval. If the check of the precondition block in the current UTG node gave a negative result (FALSE) or an undefined result (UNDEFINED), the same value will be the result of the check of the post-condition block.
If the check of the precondition block in the current UTG node gave a positive result (TRUE), then the check of the post-condition block is performed in each UTG node between the minimum and maximum waiting interval. The result of the check is determined by the fulfillment of the condition depending on the selected group operator: All steps or Any step.
If more than one condition check is performed using the temporal operator, then the result of the check of the previous temporal condition is a precondition for each subsequent check of the temporal condition.
- In the Recess (steps) field, specify the following time intervals:
- Select one of the following logical operators between rule blocks:
- AND if you need to track tag behavior criteria in both blocks while a diagnostic rule is active.
- OR if you need to track tag behavior criteria in one of the blocks while a diagnostic rule is active.
- In the upper-right corner of the window, click the Save button.
Removing an ML model element
When removing an ML model element, Kaspersky MLAD also deletes the results of the work of the selected element of the ML model.
System administrators and users who have the Remove models permission from the Manage ML models group of rights can remove elements of ML models.
To remove an ML model element:
- In the main menu, select the Models section.
- In the asset tree, select the ML model element that you want to delete.
A list of options appears on the right.
- In the upper-right corner of the window, click the trash bin icon ().
- In the window that opens, confirm the deletion of the ML model element.
Cloning an ML model
System administrators and users who have the Copy models permission from the Manage ML models group of rights can clone ML models.
You can create an ML model by cloning a previously added ML model. When cloning, a new ML model is created. The new ML model contains the same elements, parameters of the ML model and its elements, as well as the training state of the neural network elements as the ones of the ML model being cloned at the time of its cloning.
When cloning an ML model that was created manually or from a template based on a manually created ML model, you can add neural network elements and/or the elements based on diagnostic rules to the cloned ML model, as well as modify or delete them.
When cloning an ML model that was imported into the application or created using a template based on an imported ML model, you cannot change the set of elements of the cloned ML model.
Before running inference, you can change the training settings and retrain the neural network elements of the copied ML model. You can also start inference after the ML model has been published.
To clone an ML model:
- In the main menu, select the Models section.
- In the asset tree, select the ML model that you want to copy.
A list of options appears on the right.
- In the upper-right corner of the window, click the Copy model (
 ) icon.
The Model copying pane appears on the right.
- In the Name field, specify the ML model name.
The ML model name must not be longer than 100 characters.
By default, an ML model is assigned a name in the following format:
<name of the original ML model>_Cloned_ <date and time of cloning>. - In the Asset drop-down list, select the asset to which you want to assign the new ML model.
- Click the Save button.
The new ML model displays in the Models group of the asset tree. The Models group is created automatically and displayed as part of the selected section of the asset tree. The Models group contains the Neural networks and Rules subgroups for storing ML model elements based on neural networks and diagnostic rules.
Page topWorking with ML model templates
This section provides instructions on working with ML model templates.
You can create a template of an existing ML model to reuse its algorithm structure, set of elements, and training state at the time of the template creation. You can use a created template to add new ML models.
If the original ML model used as a template was created manually, you can add neural network elements and/or elements based on diagnostic rules to the ML model created based on such template, as well as modify or delete them.
If the original ML model used to create a template was imported to Kaspersky MLAD, the set of elements of the ML model created based on such a template cannot be changed.
Before inference, the ML model needs to train all its neural network elements. You can also start inference if the ML model has been published.
Creating a template based on an ML model
System administrators and users who have the Create model templates permission from the Manage ML models group of rights can create templates based on ML models.
You can create an ML model template based on a previously added ML model. The created templates retain the algorithm structure, set of elements, tag composition, and the training state of the source ML model.
You can create a template based on a previously added ML model if this ML model includes a neural network element for which input and output tags are defined, and/or an element based on a diagnostic rule for which rule conditions have been created.
To create a template based on an ML model:
- In the main menu, select the Models section.
- In the asset tree, next to the name of the ML model based on which you want to create a template, open the vertical menu and select Create template.
A list of options appears on the right.
- Enter the template name in the Name field.
You can enter up to 100 characters.
By default, a template is assigned a name in the format
Template_<ML model name>_<date and time of template creation>. - To change the names of the template tags, in the Template tag name column specify the new names for the relevant tags.
If the tags used in the ML model you are using to create the template were loaded or created in the Assets section of the administrator menu, their names are automatically assigned to the tags in the template. If a tag used in the ML model was not detected in Kaspersky MLAD, this tag will be assigned the default name in the format Tag <Model tag ID>.
You can specify a template tag name different from the tag names in the Assets section of the administrator menu. Template tags and tags in the Assets section are mapped based on the IDs of the ML model tags, which you can specify when creating an ML model from a template.
- Click the Save button.
The new ML model template appears in the Templates group of the asset tree. The Templates group is created automatically and displayed as part of the selected section of the asset tree.
Page topEditing an ML model template
You can edit the settings of a created ML model template.
System administrators and users who have the Edit model templates permission from the Manage ML models group of rights can edit ML model templates.
To edit an ML model template:
- In the main menu, select the Models section.
- In the asset tree, select the template that you want to edit.
A list of options appears on the right.
- In the upper-right corner of the window, click the Edit button.
- In the Name field, enter the new template name.
You can enter up to 100 characters.
By default, a template is assigned a name in the format
Template_<ML model name>_<date and time of template creation>. - To change the names of the template tags, in the Template tag name column specify the new names for the relevant tags.
You can specify a template tag name different from the tag names in the Assets section of the administrator menu. Template tags and tags in the Assets section are mapped based on the IDs of the ML model tags, which you can specify when creating an ML model from a template.
- Click the Save button.
Creating an ML model based on a template
System administrators and users who have the Create models permission from the Manage ML models group of rights can create ML models based on templates.
You can create a new ML model based on available templates. When creating an ML model, you can specify the IDs of tags that should be used in the new ML model.
To create an ML model based on a template:
- In the main menu, select the Models section.
- In the asset tree, next to the name of the template that you want to use to create an ML model, open the vertical menu and select Create model.
The Creating a model pane opens on the right.
- Enter a name for the new ML model in the Model name field.
The ML model name must not be longer than 100 characters.
- In the Model tag name column, select the tag names for each tag of the created ML model.
Template tags and tags in the Assets section in the administrator menu are mapped based on the names of the ML model tags.
- Click the Save button.
The new ML model displays in the Models group of the asset tree. The Models group is created automatically and displayed as part of the selected section of the asset tree. The Models group contains the Neural networks and Rules subgroups for storing ML model elements based on neural networks and diagnostic rules.
The state of the created ML model will match the training state of the source ML model when the template was created.
Page topRemoving an ML model template
System administrators and users who have the Delete model templates permission from the Manage ML models group of rights can remove ML model templates.
You can remove an ML model template from Kaspersky MLAD. Deleting a template does not remove ML models based on this template.
To remove an ML model template:
- In the main menu, select the Models section.
- In the asset tree, select the ML model template that you want to delete.
A list of options appears on the right.
- In the upper-right corner of the window, click the trash bin icon ().
- Confirm deletion of the ML model template.
The selected ML model template will be removed from Kaspersky MLAD.
Page topChanging the parameters of an ML model
You can change the settings of an ML model that was created manually, imported into Kaspersky MLAD, created from a template, or copied.
System administrators and users who have the Edit model drafts permission from the Manage ML models group of rights can edit the settings of ML model elements.
To change the parameters of an ML model:
- In the main menu, select the Models section.
- In the asset tree, select the ML model whose settings you want to edit
A list of options appears on the right.
- In the upper-right corner of the window, click the Edit button.
- In the Name field, specify the ML model name.
The ML model name must not be longer than 100 characters.
- In the Description field, specify the ML model description.
- If the ML model was not imported into the application or was created on the basis of an imported ML model, in the Inference indicator settings block, select the markups for conducting inference.
- To view the data selected by the markups, click On graph.
Markups are displayed in the colors selected when they were created.
- In the upper-right corner of the window, click the Save button.
Training a neural network element of an ML model
With Kaspersky MLAD, you can train a neural network element for an ML model that was created manually, imported into Kaspersky MLAD, created from a template, or copied.
System administrators and users who have the Train models permission from the Manage ML models group of rights can train elements of ML models.
To train an ML model element:
- In the main menu, select the Models section.
- In the asset tree, select the neural network element that you want to train.
A list of options appears on the right.
- Open the Training tab and click the Edit button in the upper-right corner of the window.
- In the Data selection interval field, specify the data time interval on which you want to train the ML model.
- To apply markups when selecting data for training the ML model within a selected interval, select one or several markups in the Markups field.
The selected markups will form a learning indicator.
- To view the data that will be selected by the markups, click On graph.
Markups are displayed in the colors that were specified when they were created.
- If necessary, enable Advanced training settings and do the following:
- In the Maximum training duration (sec) field, specify a maximum time in seconds that the Kaspersky MLAD server can spend for training an ML model.
- In the Validation split field, use a decimal value to specify the share of the validation sample as a percentage of the entire dataset used to train the ML model.
You can specify a value in the range of
0to1.The default value of this parameter is
0.2. - In the Maximum epoch count field, specify the maximum number of epochs for training the ML model.
The default value of this parameter is
500. - In the Patience field, specify the number of epochs with no improvement in training quality to wait before stopping the ML model training process early.
Stopping the ML model training early avoids overfitting of the model. Training in this case is considered to be completed successfully.
The default value of this parameter is
15. - In the Resolution of training results graphs field, use a decimal value to specify the graph resolution for displaying training results on the Training results tab.
You can specify a value in the range of
0to1. - In the Batch size field, specify the number of selection items that must be sent for training within the iteration.
The default value of this parameter is
16. - In the Block count field, specify the number of blocks into which you want to split the dataset for training the ML model.
The default value of this parameter is
4. - In the Inference mode drop-down list, select one of the following values:
- If you want to load all batches into RAM, select Fast inference.
This inference mode allows you to perform inference faster.
- If you want to load data batches into RAM one at a time, select Memory saving mode.
This inference mode allows inference to be performed with minimal expenditure of RAM, but it will take place slower than in Fast inference mode.
The selected inference mode is applied only while training a neural network element of an ML model.
- If you want to load all batches into RAM, select Fast inference.
- In the Training mode drop-down list, select one of the following values:
- If you want to load the entire dataset for training the model into RAM, select Load whole dataset to RAM.
- If you want to load one data block at a time into RAM and generate validation blocks from the end of the dataset, select Validate at the end of the dataset.
- If you want to load one data block at a time into RAM without generating validation blocks, select Run validation in each training data block.
Validation data is generated from each training data block.
- In the Memory allocation mode drop-down list, select one of the following settings:
- Reserve minimum amount of free RAM. If this setting is selected, the Trainer service will make sure that the minimum amount of memory specified in the Amount of RAM, MB field remains free when training the ML model.
- Reserve maximum available amount of RAM for model training. If this setting is selected, the Trainer service will use the maximum amount of RAM specified in the Amount of RAM, MB field when training the ML model.
- To consider previous training results while training an ML model on new data, enable the option to Initialize model weights with values from previous training results.
- If you want to shuffle the data to improve the quality of ML model training, enable the Shuffle data option.
- In the upper-right corner of the window, click the Save button.
- In the information block located above the training settings, click the Train element button.
The information block will show the number of the current training epoch of the ML model element. After the training is complete, you can view the training results of an ML model element in the Training results tab.
After training all the neural network elements within an ML model, the model is assigned the Trained status. If required, you can retrain the ML model element by clicking Restart training.
Page topViewing the training results of an ML model element
You can view the results of training the neural network elements of an ML model.
System administrators and users who have the Train models permission from the Manage ML models group of rights can view the results of training ML model elements.
To view the training results of an ML model element:
- In the main menu, select the Models section.
- In the asset tree, select the ML model element whose training result you want to view.
A panel with the settings of the selected element will appear on the right.
- Select the Training results tab.
If the ML model element has been successfully trained, the following information about the training results is displayed in the Training results tab:
- Message about successful completion of training of an ML model element.
If you want to view the training settings for an element that were specified during its creation, click the Training settings link.
- User: The name of the user who started training the ML model element.
- Training interval: The time spent by the Kaspersky MLAD server for training the ML model element.
- Start of training: The date and time when the Trainer service began training the ML model element.
- End of training: The date and time that training of the ML model element finished. ML model element weights have been updated by the Trainer service.
- Total training duration: The duration of data time intervals considering the markups in the training dataset.
- Number of UTG nodes: The number of UTG nodes included in the training set.
- Training and validation errors: A graph showing the training and validation errors for each training epoch.
- Model prediction: Graphs showing model predictions for the output tags and the overall prediction error.
Preparing an ML model for publication
After training the ML model, you can prepare it for publication. An ML model ready for publishing cannot be modified.
System administrators and users who have the Edit model drafts permission from the Manage ML models group of rights can prepare an ML model for publication.
To prepare an ML model for publication:
- In the main menu, select the Models section.
- In the asset tree, select the ML model you want to prepare for publication.
A list of options appears on the right.
- Click the Prepare to publish button.
The ML model is assigned the Ready for publication status. Notify the officer responsible for publishing the ML model that it is ready, or, if you have the required permissions, publish the ML model.
To make changes to the ML model before publishing, click the Back to edit mode button. The ML model will revert to a status of Trained.
Page topPublishing an ML model
You can publish an ML model for logging incidents based on the operational data from the monitored asset.
System administrators and users who have the Edit model drafts permission from the Manage ML models group of rights can publish ML models.
To publish an ML model:
- In the main menu, select the Models section.
- In the asset tree, select the ML model that you want to publish.
A list of options appears on the right.
- Click Publish.
The ML model is assigned the Published status.
When the inference is started, the ML model will log incidents.
Page topStarting and stopping ML model inference
You can start or stop the inference of an ML model with a status of Trained or Published on historical or newly received telemetry data.
To start the ML model inference:
- In the main menu, select the Models section.
- In the asset tree, select the ML model whose inference you want to run.
A list of options appears on the right.
- Select the Inference tab.
- In the Inference type drop-down list, select one of the following values:
- Historical to run ML model inference on historical telemetry data. If you select this value, specify the data time interval for running the ML model.
- Real-time to run ML model inference on telemetry data that is being received in real time.
- Click the Start button.
If historical inference was started, Kaspersky MLAD will add the ML model to the inference queue.
To stop the ML model inference:
- In the main menu, select the Models section.
- In the asset tree, select the ML model whose inference you want to stop.
A list of options appears on the right.
- Select the Inference tab.
- Click the Stop button.
Kaspersky MLAD will stop inference for the selected ML model.
Page topViewing the data flow graph of an ML model
You can view the data flow graph in ML models.
To view the data flow graph in an ML model:
- In the main menu, select the Models section.
- In the asset tree, select a neural network element, the data flow graph that you want to view.
A list of options appears on the right.
- Select the Data flow graph tab.
The ML model data flow graph is displayed on the right.
- If you need to view the settings of an ML model, move the mouse cursor over it.
A window listing the values of settings of the selected element will be displayed.
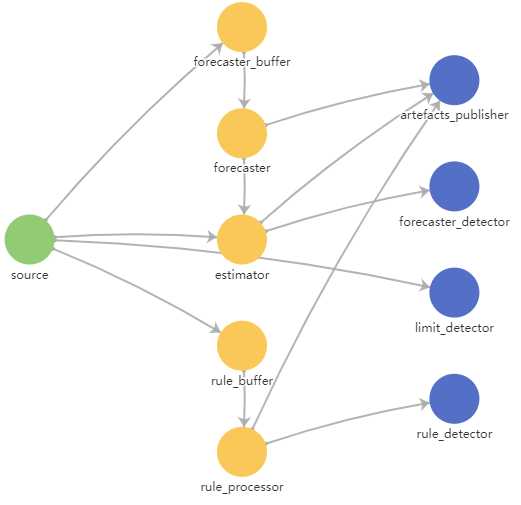
ML model data flow graph
Removing an ML model
You can remove one or more ML models from Kaspersky MLAD.
After the ML model is removed, its artifacts, such as predictions, individual errors, prediction errors, or rule progress indicators, as well as incidents registered by the ML model, will be deleted.
System administrators and users who have the Remove models permission from the Manage ML models group of rights can remove ML models.
To remove an ML model:
- In the main menu, select the Models section.
- In the asset tree, select the ML model to be deleted.
A list of options appears on the right.
- In the upper-right corner of the window, click the trash bin icon ().
- Confirm deletion of the ML model.
The selected ML model will be removed from Kaspersky MLAD.
Page topManaging presets
A preset is a set of tags generated by a user in arbitrary order or created automatically when an incident is registered. A set of tags in a custom preset can correspond to a certain aspect of the technological process or a section of the monitored asset.
In the Presets section, the left side of the window displays a list of available custom presets, and the right side of the window shows a list of tags included in the selected preset.
To view the received data on the graphs in the History and Monitoring sections, upload the preset configuration to Kaspersky MLAD from a JSON file. As part of Kaspersky MLAD deployment, a common preset configuration can be created for all users.
In the Presets section, you can also do the following:
- Create necessary presets that include tags corresponding to the industrial units of the monitored asset. The presets created by you are displayed only for your user account.
- Edit presets (add, group, or delete tags).
- Delete presets.
- Export presets to a JSON file.
You can also specify expressions with simple arithmetic operations (such as addition, subtraction, multiplication, and division) to calculate derived tag values.
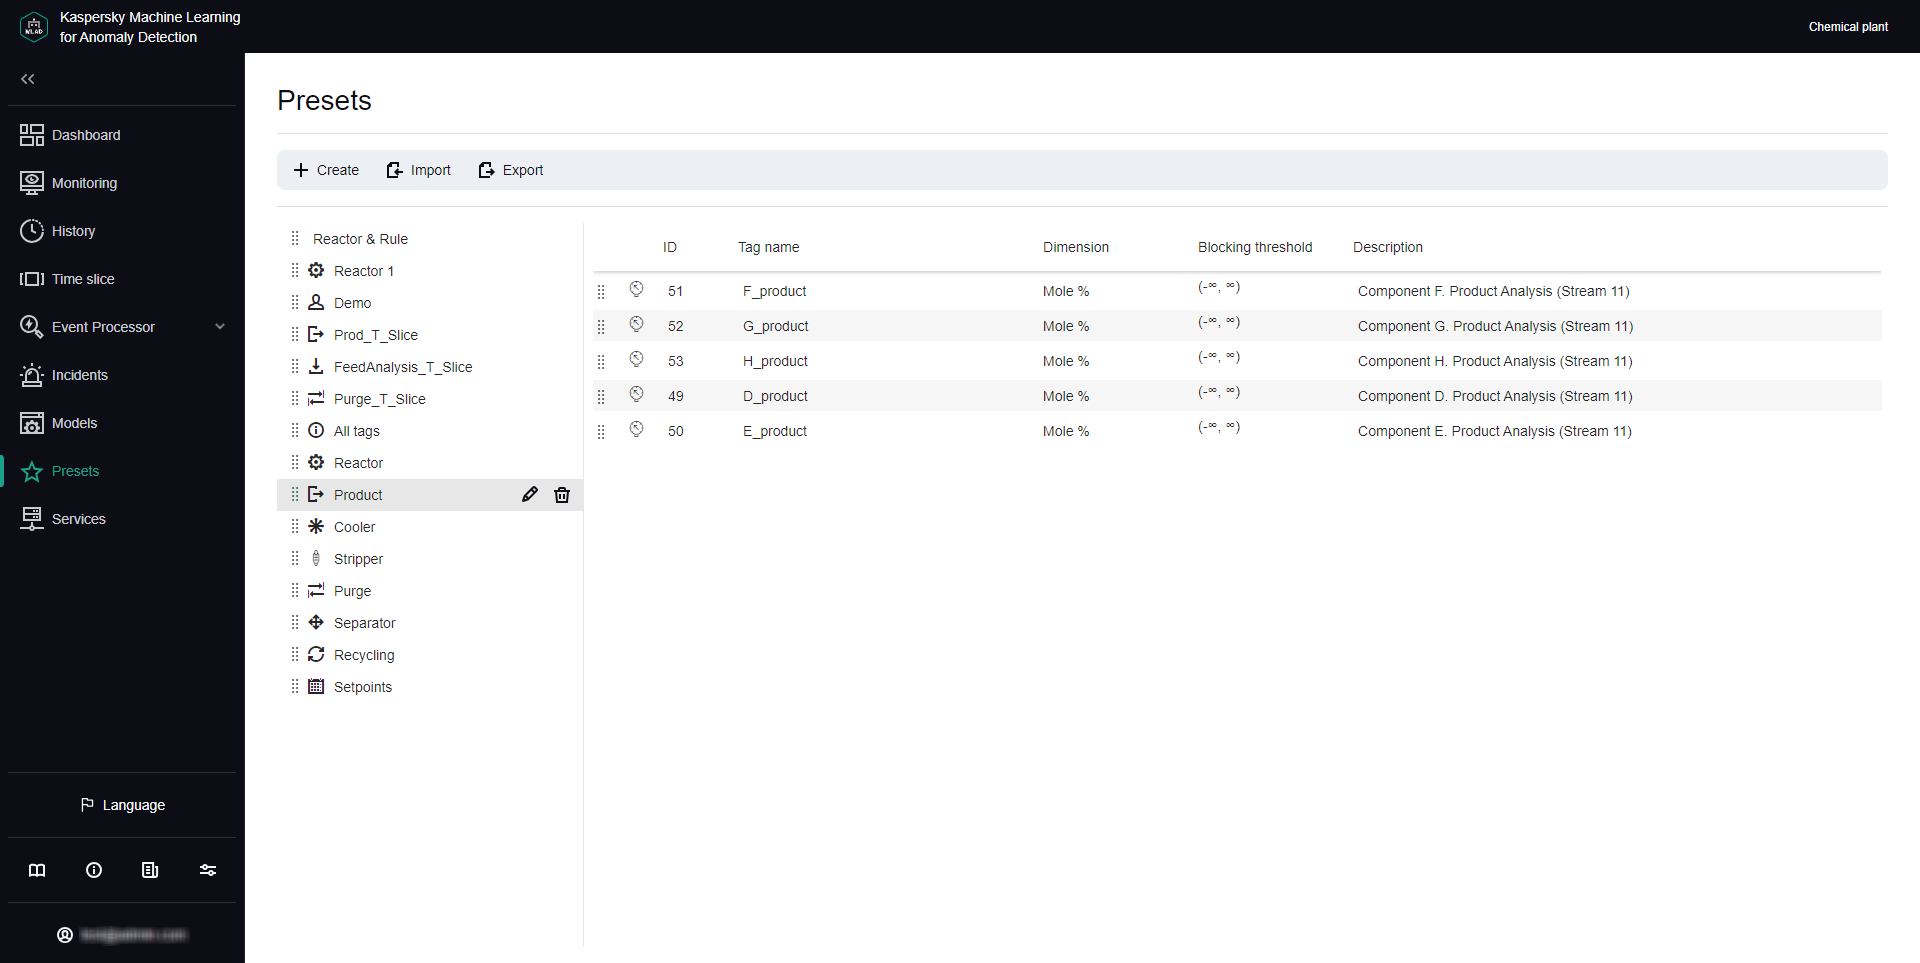
Presets section
Viewing a preset
You can view presets you created or uploaded to Kaspersky MLAD for your monitored asset.
To view a preset:
- In the main menu, select the Presets section.
The list of presets is displayed in the left part of the workspace.
- Click the relevant preset.
The table on the right shows the tags that are included in the selected preset. The following information is displayed for each tag included in the preset:
- ID refers to the tag ID.
- Tag name refers to the tag name.
- Dimension refers to the tag measurement units.
- Blocking threshold refers to the blocking thresholds; when these thresholds are reached, incidents are registered if the Limit Detector is enabled.
- Description refers to a description of the tag.
If necessary, you can change the preset or create a new preset.
Page topCreating a new preset
You can create new presets in Kaspersky MLAD.
When creating a preset, you can specify an expression to use for calculating the values of tags in the preset to display these values on the graph in the Time slice section. For example, you can use the specified expressions to view personal tag errors, predicted tag values, and the values of tags received from the monitored asset's sensors at the same time. You can use the following variables in your expressions:
- $tagValue is the received tag value (based on the results of monitoring).
- $tagError is the personal tag error.
- $tagPrediction is the predicted tag value.
- $tagX is the X coordinate of the monitored asset's sensor location specified when creating the tag.
- $tagY is the Y coordinate of the monitored asset's sensor location specified when creating the tag.
- $tagZ is the Z coordinate of the monitored asset's sensor location specified when creating the tag.
To create a new preset:
- In the main menu, select the Presets section and click the Create button.
The Create preset window opens.
- Specify the name of the preset in the Preset name field.
- If necessary, click the Choose icon button and select an icon for the preset in the opened window.
By default, the preset is assigned a sun icon (
 ).
).You can upload a preset icon by clicking the Load icon button. Images of any format larger than 128x128 pixels are shrunk to 128x128 while maintaining the aspect ratio. The size of the uploaded image in SVG format must not exceed 200 KB.
If you want to delete the preset icon, click the preset icon and then click Delete in the opened window.
- If you want to add an expression for calculating tag values to display them on a graph in the Time slice section, do the following:
- Turn on the Configure expressions for Time slice toggle switch.
- In the X-axis caption field, enter the caption to be displayed on the x-axis.
- Click the Add expression button and specify the following values in the drop-down section:
- In the Expression name field, enter the name of the expression.
- In the Y-axis caption field, enter the caption to be displayed on the y-axis.
- In the Expression for calculation field, enter an expression for calculating tag values.
You can define expressions with simple arithmetic operations (such as addition, subtraction, multiplication, and division). For example, if the sensors are reporting temperature in Fahrenheit, you can use the following expression to display the temperature in Celsius:
5/9 * ($tagValue - 32)
If necessary, you can add multiple expressions for the Time slice section.
- In the Graph color field, select the color of the graph that will be displayed for the preset in the Time slice section.
- If you want to delete an expression from a preset for the Time slice section, click the trash bin icon (
 ) in the lower-right corner of the expression section.
- If you need to add tags that are part of another preset, select this preset from the Copy tags from selected preset drop-down list.
- Add tags to the preset by selecting the check boxes next to the relevant tags in the asset tree below. You can search for tags by entering the tag name in the Search by tag name field.
- If you need to delete tags from a preset, clear the check boxes next to the tags you want to delete in the asset tree.
- Click the Save button.
The new preset is displayed in the Presets section in the list of presets on the left and in the drop-down list of presets in the History and Monitoring sections. The preset for which step 4 of these instructions was performed will also be displayed in the drop-down list of presets in the Time slice section.
If necessary, you can change the position of presets in the list of presets. To do this, drag the preset up or down in the list by the dots ( ) to the left of its icon.
Editing a preset
You can edit the presets you created or uploaded.
To edit a preset:
- In the main menu, select the Presets section.
- On the opened page, select the relevant preset from the list of presets on the left.
The table on the right shows all tags that are included in the selected preset.
If necessary, change the position of the tags in the table. To do this, drag the desired tag up or down in the asset tree by the dots (
) to the left of its icon. - Click the Change preset (
 ) button next to the selected preset.
The Edit preset window opens.
- If required, enter the new name of the preset in the Preset name field.
You can also modify the preset name in the preset list. To do this, double-click the preset name, in the opened field enter a new preset name, and press ENTER.
- If you need to change the preset icon, click the Choose icon button and select the appropriate icon in the opened window.
You can upload a preset icon by clicking the Load icon button. Images of any format larger than 128x128 pixels are shrunk to 128x128 while maintaining the aspect ratio. The size of the uploaded image in SVG format must not exceed 200 KB.
If you want to delete the preset icon, click the preset icon and then click Delete in the opened window.
- If you want to add an expression for calculating tag values to display them on a graph in the Time slice section, do the following:
- Turn on the Configure expressions for Time slice toggle switch.
- In the X-axis caption field, enter the caption to be displayed on the x-axis.
- Click the Add expression button and specify the following values in the drop-down section:
- In the Expression name field, enter the name of the expression.
- In the Y-axis caption field, enter the caption to be displayed on the y-axis.
- In the Expression for calculation field, enter an expression for calculating tag values.
You can define expressions with simple arithmetic operations (such as addition, subtraction, multiplication, and division). For example, if the sensors are reporting temperature in Fahrenheit, you can use the following expression to display the temperature in Celsius:
5/9 * ($tagValue - 32)
If necessary, you can add multiple expressions for the Time slice section.
- In the Graph color field, select the color of the graph that will be displayed for the preset in the Time slice section.
- To delete an expression from a preset for the Time slice section, click the trash bin icon () in the lower-right corner of the expression section.
- If necessary, add tags to the preset by selecting the check boxes next to the relevant tags in the list of tags below. You can search for tags by entering the tag name in the Search by tag name field.
- If necessary, clear the check boxes next to the names of the tags that you want to remove from the preset.
- Click the Save button.
The changed preset will be updated in the list of presets in the Presets section and in the drop-down list of presets in the History and Monitoring sections. The changed preset for which step 6 of these instructions was performed will also be displayed in the drop-down list of presets in the Time slice section.
If necessary, you can change the position of presets in the list of presets. To do this, drag the preset up or down in the list by the dots () to the left of its icon.
Deleting a preset
You can delete the presets you created or uploaded.
To delete a preset:
- In the main menu, select the Presets section.
- On the opened page, select the relevant preset from the list of presets on the left.
- Click the Delete preset () button next to the selected preset.
- In the opened Delete preset window, click Yes to confirm deletion of the preset.
The preset will be deleted from the list of presets.
Page topLoading a preset configuration from a file
You can load a preset configuration to Kaspersky MLAD from a JSON file.
To upload a preset configuration to Kaspersky MLAD:
- In the main menu, select the Presets section.
- In the upper part of the opened page, click the Import button.
- Select the JSON file containing the preset configuration on your local drive.
The selected file will be loaded into Kaspersky MLAD, and new presets will be displayed in the list of presets.
Page topSaving a preset configuration to a file
You can save the presets you created and uploaded to Kaspersky MLAD as a JSON file.
To save the presets you created and uploaded to Kaspersky MLAD to a file:
- In the main menu, select the Presets section.
- In the upper part of the opened page, click the Export button.
The presets you created and uploaded to Kaspersky MLAD will be saved to a JSON file on the local drive.
Page topManaging services
The Services section displays a table containing information about services and their statuses. In the Kaspersky MLAD web interface, services are grouped by their functionality, and the following information is displayed for each service:
- Name is the name of the service.
- Status refers to the current status of the service (Started, Stopped, Starting, Unavailable).
- Actions are the available actions (start, stop, and restart).
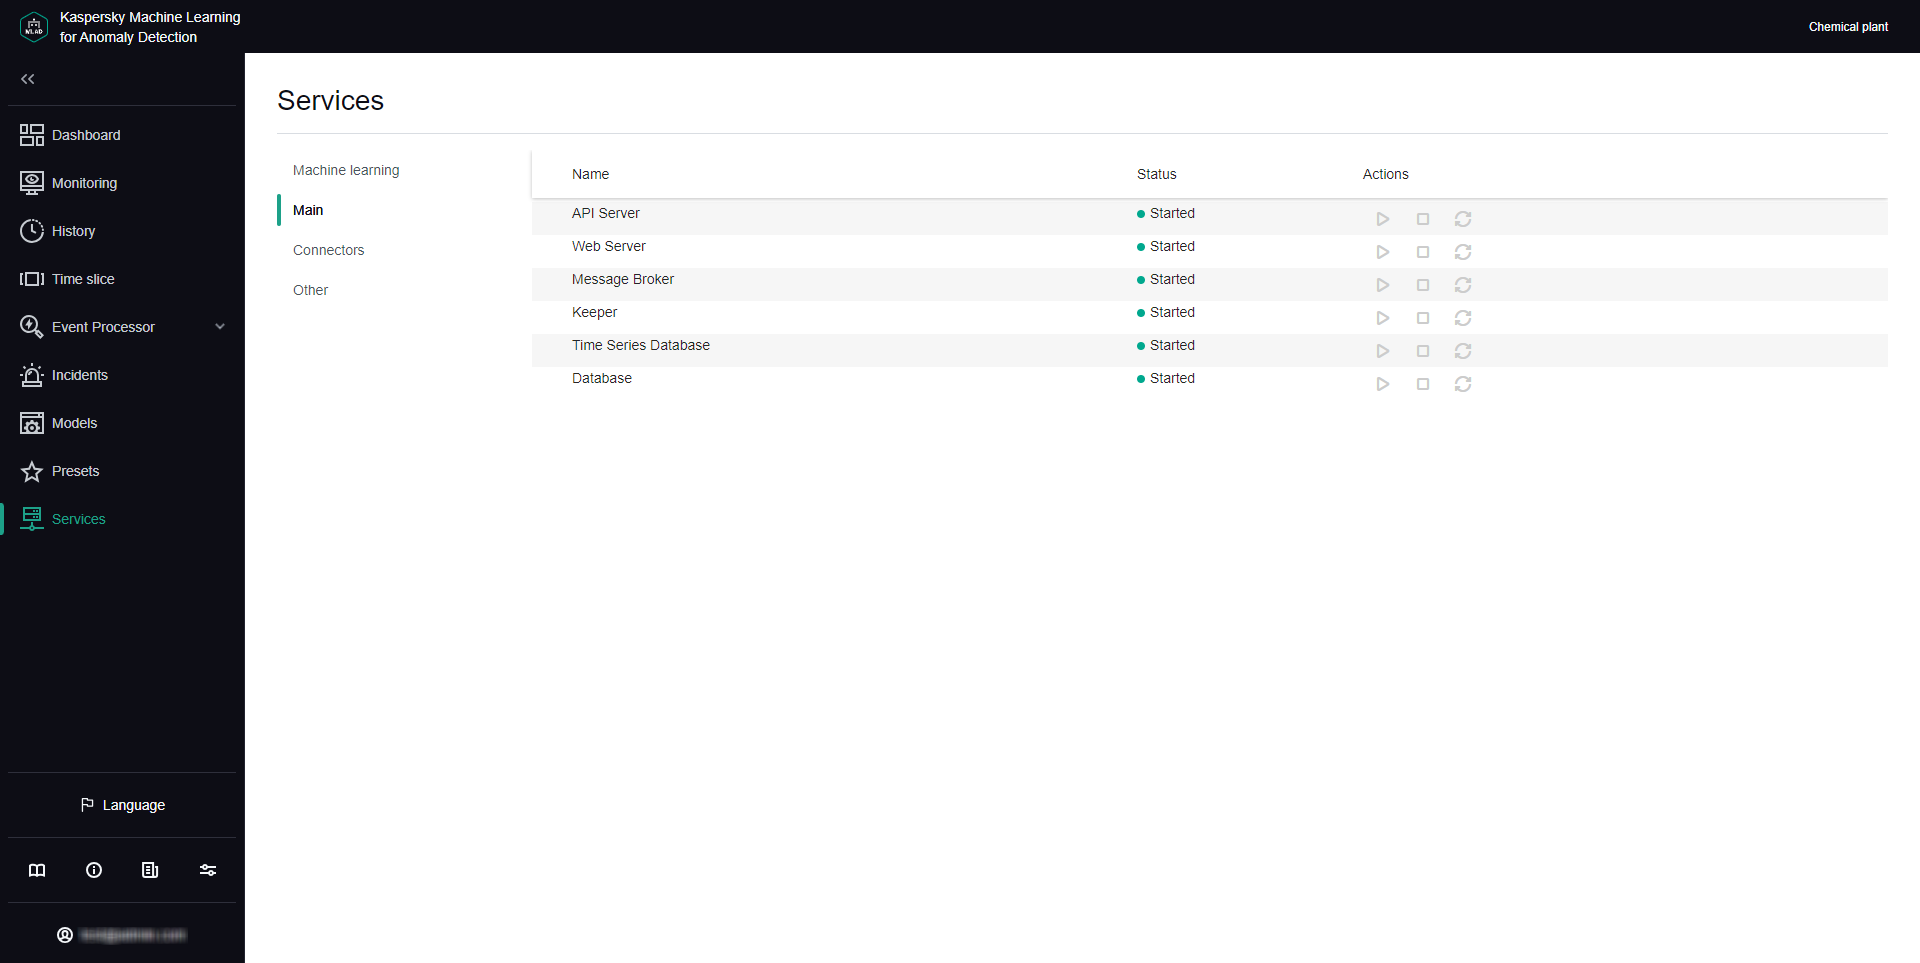
Services section
Viewing the status of a service
You can view the status of a service to make sure that the service was successfully started or stopped.
System administrators and users who have the View statuses of application services permission from the Working with application services group of rights can view the status of a service.
Kaspersky MLAD checks the statuses of services every 30 seconds.
To view the status of a service:
In the main menu, select the Services section.
The Services section opens to display a table listing all available services, their statuses, and available actions (start, stop, and restart).
Page topStarting, stopping, and restarting services
Kaspersky MLAD lets you start, stop and restart services.
System administrators and users who have the Manage statuses of application services permission from the Working with application services group of rights can start, stop, and restart services.
To start, stop, or restart a service:
- In the main menu, select the Services section.
- On the opened page, select one of the following subsections: Machine learning, Main, Connectors or Other.
- Do one of the following for the relevant service:
- To start a service, click Start service (
 ).
). - To stop a service, click Stop service (
 ).
). - To restart a service, click Restart service (
 ).
).
The new status of the service is displayed in the Status column.
- To start a service, click Start service (