Contents
- Working with the main menu
- Scenario: working with Kaspersky MLAD
- Viewing summary data in the Dashboard section
- Viewing incoming data in the Monitoring section
- Viewing data in the History section
- Viewing data in the Time slice section
- Viewing data for a specific preset in the Time slice section
- Selecting a specific element of the ML model in the Time slice section
- Selecting a date and time interval in the Time slice section
- Navigating through time in the Time slice section
- Configuring how graphs are displayed in the Time slice section
- Working with events and patterns
- Working with incidents and groups of incidents
- About incidents
- About incidents detected by a predictive element of an ML model
- About incidents detected by an ML model element based on a diagnostic rule
- About incidents detected by an ML model element based on an elliptic envelope
- About incidents detected by the Limit Detector
- About incidents detected by the Stream Processor service
- About anomalies
- Scenario: analysis of incidents
- Viewing incidents
- Viewing the technical specifications of a registered incident
- Viewing incident groups
- Studying the behavior of the monitored asset at the moment when an incident was detected
- Adding a status, cause, expert opinion or note to an incident or incident group
- Exporting incidents to a file
- About incidents
- Managing ML models
- About ML models
- About statuses and states of ML models and their elements
- About ML model templates
- About markups
- About conditions included in markups and diagnostic rules
- Scenario: working with ML models
- Search and filter objects in the Models section
- Working with markups
- Working with imported ML models
- Working with manually created ML models
- Creating an ML model
- Adding a predictive element to an ML model
- Modifying an ML model predictive element
- Adding an ML model element based on a diagnostic rule
- Changing an ML model element based on a diagnostic rule
- Adding an elliptic envelope-based ML model element
- Editing an elliptic envelope-based ML model element
- Cloning of the ML model element
- Removing an ML model element
- Cloning an ML model
- Working with ML model templates
- Changing the parameters of an ML model
- Training an ML model predictive element
- Training an elliptic envelope-based ML model element
- Viewing the training results of an ML model element
- Starting and stopping ML model inference
- Viewing the data flow graph of an ML model
- Preparing an ML model for publication
- Publishing an ML model
- Removing an ML model
- Managing presets
- Managing services
Working with the main menu
This section contains a description of user tasks performed in the main menu of the application.
Access to application functions in the main menu depends on the role assigned to the user account. Users with the system administrator role have access to all functions of the application.
Scenario: working with Kaspersky MLAD
This section describes the actions that can be taken by a user when working in the main menu of Kaspersky MLAD.
The scenario for working with the application consists of the following steps:
- Creating presets to monitor the section of the protected facility
For quick access to data, upload a preset configuration to Kaspersky MLAD. A preset configuration is created by a Kaspersky employee or certified integrator. A preset configuration is described in a JSON file. For an example of a preset configuration description, see the Appendix.
You can create presets that include tags corresponding to industrial units, in the application web interface. If necessary, you can modify existing presets.
- Preparing an ML model
To analyze the telemetry on the monitoring object and detect anomalies, prepare ML models. Add ML models and markups to Kaspersky MLAD. Train the ML model elements and check the training results. Should adjustments be required, modify the training parameters and retrain the relevant elements. Start ML model inference to register incidents. If required, deploy the ML model to register incidents.
- Viewing historical data
Go to the History section. Choose the appropriate preset and define the date and time range to view historical data on process parameters and the results of their processing by ML models: generated artifacts and/or registered incidents. You can use navigation when viewing the historical data.
- Monitoring in online mode
To view the received values of process parameters and the results of their processing by ML models, go to Monitoring. Select the relevant preset and time interval to display the incoming data.
- Viewing data in the Time slice section
To view the values of the process parameters received from the monitored asset's sensors at a certain point in time, go to the Time slice section. Select the relevant preset and specify the date and time interval for viewing the data. You can use navigation when viewing the data.
- Working with incidents
Go to the Incidents section and view information about the registered incidents. Analyze the incidents and add expert opinions or comments where you can indicate if the registered incidents are anomalies.
If you are subscribed to incident notifications, you will receive an email message when an abnormal situation arises. The message will indicate the date and time when the incident began and will provide a link you can use to go to the History section.
- Working with events and patterns
To work with events and patterns, configure attention settings and display of event parameters. Navigate to Event Processor and create monitors to track specific events, patterns, or event parameters. View the events and patterns detected by the Event Processor.
Viewing summary data in the Dashboard section
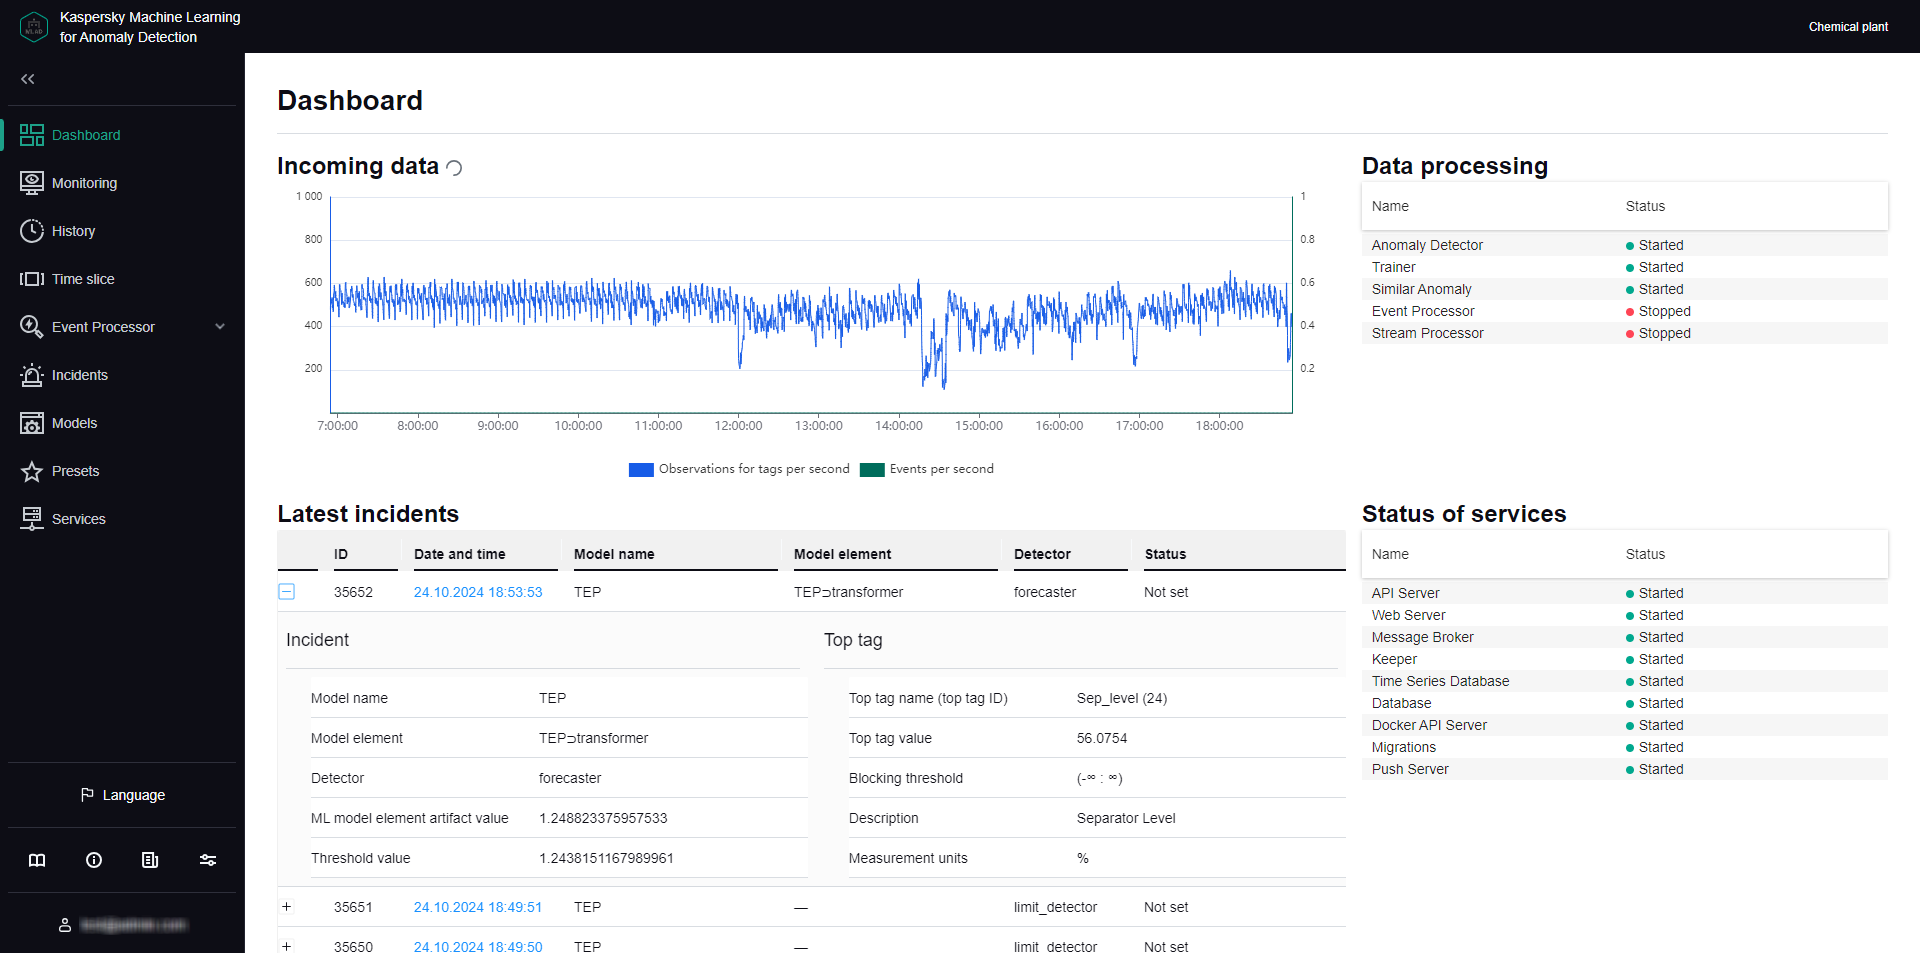
The Dashboard section provides summary information on the number of events and observations for tags received by Kaspersky MLAD, registered incidents, and the status of services.
The information on the page is divided into the following blocks:
- Incoming data is a graph that displays the number of events and observations for tags received by Kaspersky MLAD. You can enable or disable the display of incoming events and observations for tags on the graph by clicking the corresponding data signature legend under the graph. The left scale of the graph displays the range for the number of observations for tags per second. The right scale of the graph displays the range for the number of incoming events per second.
- Latest incidents is a table that contains information about the latest registered incidents.
- ID refers to the ID of the registered incident.
- Date and time refers to the date and time when the incident occurred.
- Model name refers to the name of the ML model whose element registered the incident.
- Model element refers to the name of the ML model element that registered the incident.
- Detector refers to the type of incident registered.
- Status refers to the status of the registered incident as entered by an expert following an incident analysis or assigned automatically according to the incident status defined for the ML model element that registered the incident
Clicking the
 button near an incident in the incidents table opens a window containing the technical attributes of the selected incident and tag:
- Incident is a section containing information about the incident:
- Model name refers to the name of the ML model whose element registered the incident.
- Model element refers to the name of the ML model element that registered the incident.
- Detector refers to the type of incident registered.
- ML model element artifact value refers to deviation of the monitored asset's behavior from normal at the time of incident registration. This is absent if the incident is registered by Limit Detector or Stream Processor.
- Threshold value refers to the threshold value for registering an incident by an ML model element. For any incident detected by Limit Detector, the specific threshold (upper or lower) reached by the tag is recorded.
- Top tag is a section that contains information about the tag that had the greatest impact on incident registration:
- Top tag name (top tag ID) is the name and ID of the tag that had the greatest impact on incident registration.
- Top tag value is the value of the top tag registered when the incident occurred.
- Blocking threshold refers to maximum permissible top tag values. Limit Detector requires these settings to function correctly. Whenever the tag value reaches its upper or lower blocking threshold, the Limit Detector registers an incident.
- Description refers to a description of the top tag.
- Measurement units refer to the units for measuring the top tag values.
- Data processing refers to a table that displays the statuses of services used for processing events and observations according to tags received by Kaspersky MLAD, training and inferencing ML models, and registering incidents.
- Status of services is a table that displays the status of each service.
You can proceed to the History section from the Dashboard section by clicking the date and time of an incident in the Latest incidents table. The History section displays detailed information about the incidents registered by Kaspersky MLAD.
Dashboard section
Page topViewing incoming data in the Monitoring section
In the Monitoring section, you can view the real-time values of the tags included in the preset and their predicted values.
The central part of the Monitoring section consists of a set of horizontal segments designed to display graphs. Each such segment is called a graphic area. The graphic areas for the selected preset are displayed first. A single graphic area of a preset can display a graph of one tag or graphs of multiple tags superimposed over each other. The composition of tags whose data is shown in the graphic area can be determined when you create a preset. The graphs display the values of preset tags received by Kaspersky MLAD from the monitored object. You can choose ML model elements and customize graph display for the graphs for individual graphic areas to show artifacts linked to the tags associated with those areas and generated by the ML model elements that use these tags.
Graphic areas for each selected ML model element are displayed after the preset graphic areas. These graphical areas display graphs of ML model element artifacts. The value of an ML model element artifact depends on the analytical algorithms used by the element. It is displayed as a colored line. The color of the line corresponds to the color selected for the Color of incident dot indicators setting when the corresponding element was created. Graphs also display an orange line that represents the threshold. When a value exceeds this threshold, the ML model element registers an incident.
At the bottom of the section, there is a graphic area that displays a graph of the ML model element artifact selected in the ML model element artifact graph display settings panel. The red line on the graph corresponds to the value of the ML model element artifact, while the orange line represents a threshold. When the value crosses this threshold, Kaspersky MLAD registers an incident. The area on the graph where the value of the ML model element artifact exceeds the specified threshold is colored red. Below the graph, color-coded dots that represent recorded incidents are displayed.
Depending on the selected time scale and the density of incidents, one dot indicator may correspond to one or multiple closely-spaced incidents that were registered by one or multiple ML model elements. The color of the indicator points relating to incidents recorded by a single ML model element is assigned when that element is created. Purple is reserved for indicator points that correspond to a group of incidents recorded by different elements. Red is reserved for indicator points that correspond to incidents recorded by Limit Detector.
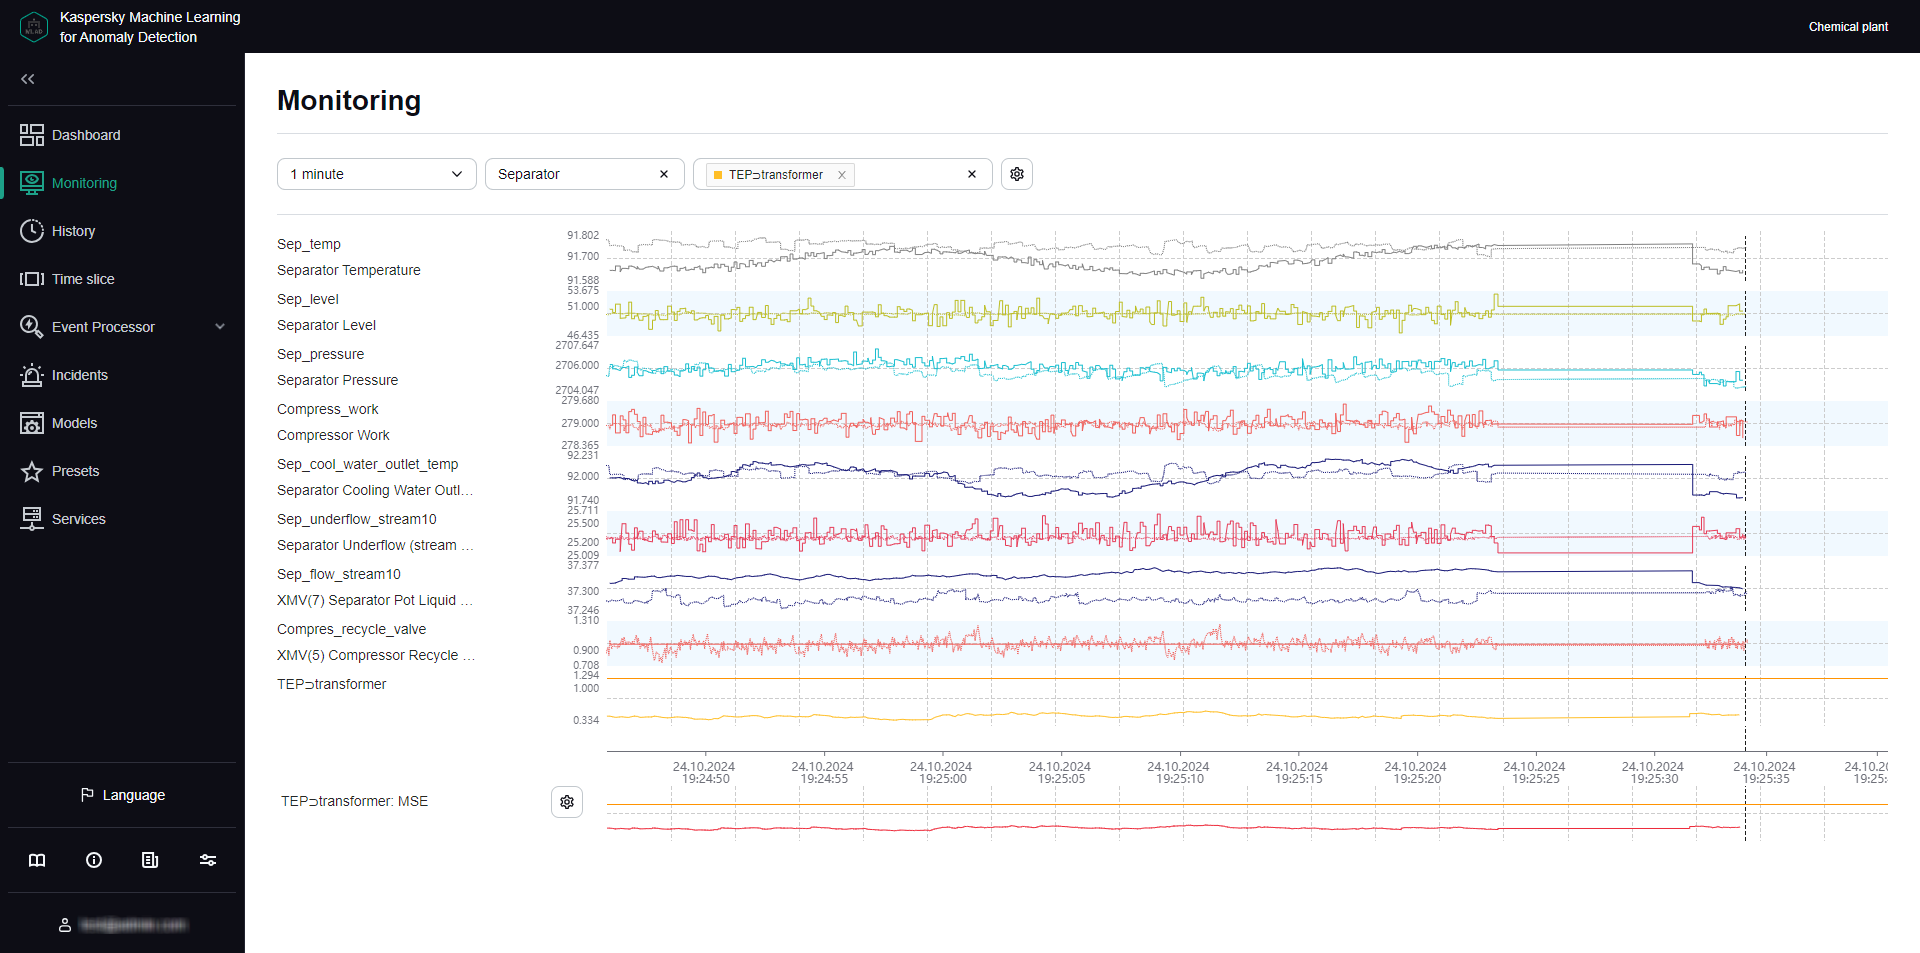
Monitoring section
Viewing data for a specific preset in the Monitoring section
Kaspersky MLAD allows you to select presets for which real-time data is displayed.
To view incoming data for a specific preset in real time:
- In the main menu, select the Monitoring section.
- On the opened page, select the relevant preset from the Preset drop-down list.
The page will display graphs for the tags included in the selected preset, according to the graphic area settings specified when that preset was created.
You can change the time interval for data display, customize graph display, or select a specific ML model element to view their output. You can also change which tags are displayed by editing the preset.
Page topSelecting elements of the ML models in the Monitoring section
Under Monitoring, you can view real-time values of tags included in the preset, artifacts generated by selected ML model elements, and the number of registered incidents.
When multiple ML models are applied to processing data for a monitored object, Kaspersky MLAD gives you the option to select several components of these models to visualize their inference results: An ML model element is not created for the Limit Detector. The dot indicators of incidents registered using this detector are displayed if use of the Limit Detector is enabled and the display of indicators for all incidents is enabled.
The functionality is available after a license key is added.
To view the inference results of an ML model element:
- In the main menu, select the Monitoring section.
- On the opened page, select one or several elements of the ML model from the Model element drop-down list.
Element names are displayed as
<ML model name>
<element name>.Graphic areas for the selected preset will display the values of tags received by Kaspersky MLAD within the selected time interval. When you customize graph display, graphs for individual graphic areas will show artifacts linked to the tags associated with those areas and generated by the ML model elements that use these tags.
The central part of the section will display graphs for artifacts from the selected ML model elements. The values shown on the graphs depend on the analytical algorithms used by the elements to identify anomalies.
To hide the artifacts for a selected ML model element, click
 next to the element.
 - To display a graph of a specific ML model element's artifact at the bottom of the section, do the following:
- Click the
 button below the tag graphs on the left side of the page.
The ML model element artifact graph display settings pane appears on the right.
- From the Model element drop-down list, select the ML model element. You can select only one ML model element from the list.
- Click the Close button.
The graph will show the value of the ML model element's artifact as a red line. The graph area above the orange threshold line is highlighted in red to indicate above-threshold artifact values.
- Click the
The lower part of the graph displays the dot indicators of incidents that were registered by the selected ML model elements. If the display of indicators for all incidents is enabled, dot indicators for incidents that were registered by all ML models and Limit Detector will be displayed.
Page topSelecting a time interval in the Monitoring section
Kaspersky MLAD lets you select the time interval (scale) for displaying incoming data.
To select a time interval:
- In the main menu, select the Monitoring section.
- On the opened page, select the necessary time interval from the drop-down list. The following values are available by default:
- 1, 5, 10, 15, and 30 minutes
- 1, 3, 6, and 12 hours
- 1, 2, 15, and 30 days
- 3 and 6 months
- 1, 2, and 3 years
If necessary, the system administrator can create, edit, or delete time intervals.
The graphs for the selected preset will display the tag values and inference results for the selected ML model elements, for the chosen time interval.
Page topConfiguring how graphs are displayed in the Monitoring section
Kaspersky MLAD lets you configure how the graphic areas of presets are displayed in the Monitoring section.
To customize the appearance of preset graphic areas:
- In the main menu, select the Monitoring section.
- On the opened page, click the button in the upper part of the screen.
The Graph display settings pane appears on the right.
- In the Graph height drop-down list, select one of the following values: 55 px, 110 px, 145 px, 190 px.
By default, the Graph height parameter is set to 55 px.
- In the To go to the History section, use drop-down list, select the preset whose graphs should be displayed by default when you navigate to the History section.
- Turn on the Show observation graphs in selected color toggle switch, and select a color in the Color of observation graphs field as needed.
- Turn on the Show prediction graphs in selected color toggle switch, and select a color in the Prediction graph color field as needed.
- Use the Tag name and description toggle switch to enable or disable display of the tags descriptions and names on the left of the graphs.
- Use the Predicted tag value toggle switch to enable or disable display of the predicted tags values on graphs.
- Use the Individual tag error toggle switch to turn on or off the display of individual tag value prediction errors on graphs.
- Use the Display indicators for all incidents toggle switch to enable or disable display of the dot indicators for incidents registered by all ML models or Limit Detector.
If this switch is disabled, only the dot indicators for incidents that were registered by the selected ML model elements will be shown.
- If you need the graphs to display the defined technical limits for tags:
- Turn on the Blocking threshold toggle switch.
- If you need to always display the defined technical limits, turn on the Always display blocking threshold toggle switch.
If this switch is disabled, the technical limits will be displayed only if a tag value is approaching the corresponding limit in the graph area displayed on the screen.
- Use the Additional threshold lines toggle switch to enable or disable the display of additional threshold lines on the graph.
- Click the Close button to return to viewing graphs in the Monitoring section.
The defined settings for displaying graphic areas of presets in the Monitoring section will be applied.
Page topViewing data in the History section
The History section provides access to the history of incoming data, the results of data processing by Kaspersky MLAD, generated ML model artifacts, and registered incidents information.
The central part of the History section consists of a set of horizontal segments designed to display graphs. Each such segment is called a graphic area. The graphic areas for the selected preset are displayed first. A single graphic area of a preset can display a graph of one tag or graphs of multiple tags superimposed over each other. The composition of tags whose data is shown in the graphic area can be determined when you create a preset. The graphs display the values of preset tags received by Kaspersky MLAD from the monitoring object during the selected time interval. You can choose ML model elements and customize graph display for the graphs for individual graphic areas to show artifacts linked to the tags associated with those areas and generated by the ML model elements that use these tags.
Graphic areas for each selected ML model element are displayed after the preset graphic areas. These graphic areas display graphs for ML model element artifacts. The value of an ML model element artifact depends on the analytical algorithms used by the element. It is displayed as a colored line. The color of the line corresponds to the color selected for the Color of incident dot indicators setting when the corresponding element was created. Graphs also display an orange line that represents the threshold. When a value exceeds this threshold, the ML model element registers an incident.
At the bottom of the section, there is a graphic area that displays a graph of the ML model element artifact selected in the ML model element artifact graph display settings panel. The red line on the graph corresponds to the value of the ML model element artifact, while the orange line represents a threshold. When the value crosses this threshold, Kaspersky MLAD registers an incident. The area on the graph where the value of the ML model element artifact exceeds the specified threshold is colored red. Below the graph, color-coded dots that represent recorded incidents are displayed.
Depending on the selected time scale and the density of incidents, one dot indicator may correspond to one or multiple closely-spaced incidents that were registered by one or multiple ML model elements. The color of the indicator points relating to incidents recorded by a single ML model element is assigned when that element is created. Purple is reserved for indicator points that correspond to a group of incidents recorded by different elements. Red is reserved for indicator points that correspond to incidents recorded by Limit Detector.
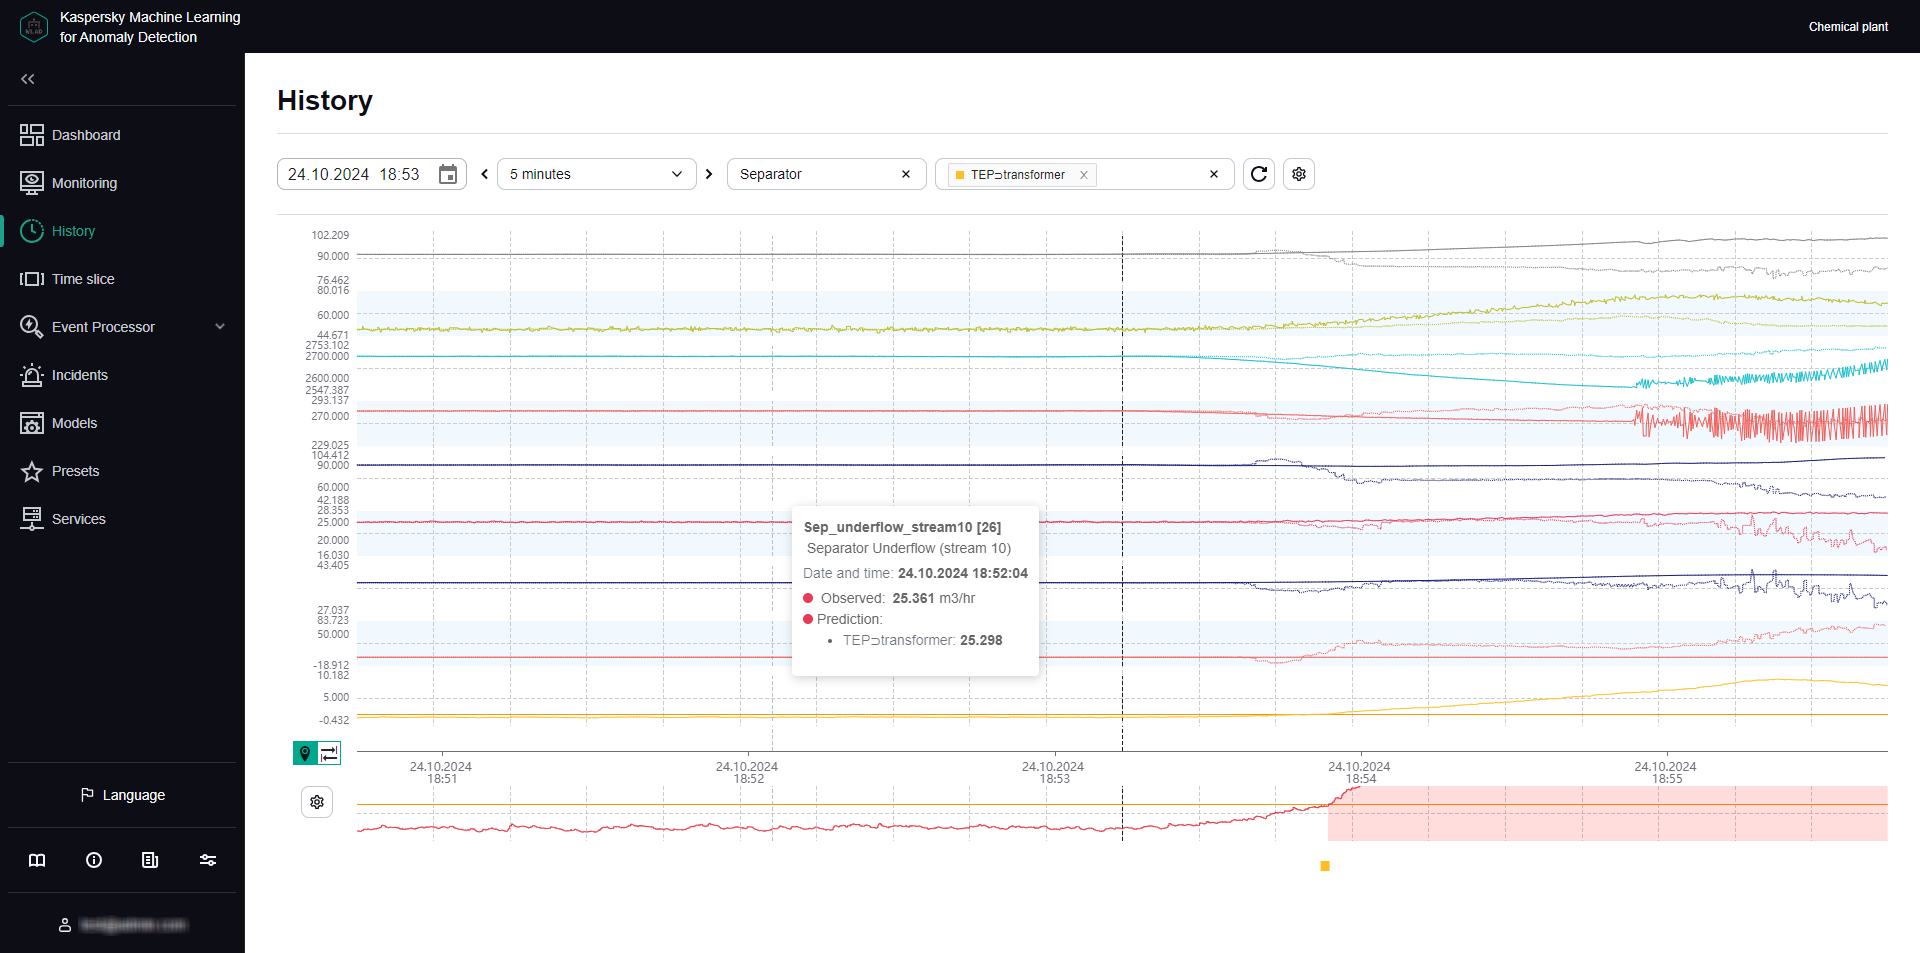
History section
Viewing historical data for a specific preset
Kaspersky MLAD allows you to select custom presets for which historical data is displayed. If you want to view historical data for tags in the Tags for incident #<incident ID> dynamic preset, click the incident registration date under Incidents. The Tags for incident #<incident ID> dynamic preset contains tags that had the greatest influence on the generation of a registered incident.
To view historical data for a specific preset:
- In the main menu, select the History section.
- On the opened page, select the relevant preset from the Preset drop-down list.
The page will display graphs for the tags included in the selected preset, according to the graphic areas settings specified when that preset was created.
You can use the time navigation function to view the entire history of data. You can edit the date and time interval or select ML model elements to view their output, if needed. You can also change which tags are displayed by editing the preset.
Page topSelecting elements of the ML model in the History section
History provides the history of incoming data, the results of its processing by Kaspersky MLAD, artifacts generated by selected ML model elements, and registered incidents.
When multiple ML models are applied to processing data for a monitored object, Kaspersky MLAD gives you the option to select several components of these models to visualize their inference results: An ML model element is not created for the Limit Detector. The dot indicators of incidents registered using this detector are displayed if use of the Limit Detector is enabled and the display of indicators for all incidents is enabled.
The functionality is available after a license key is added.
To view the inference results of an ML model element:
- In the main menu, select the History section.
- On the opened page, select one or several elements of the ML model from the Model element drop-down list.
Element names are displayed as
<ML model name> <element name>.Graphic areas for the selected preset will display the values of tags received by Kaspersky MLAD for the selected time interval. When you customize graph display, graphs for individual graphic areas will show artifacts linked to the tags associated with those areas and generated by the ML model elements that use these tags.
The central part of the section will display graphs for artifacts from the selected ML model elements. The values shown on the graphs depend on the analytical algorithms used by the elements to identify anomalies.
To hide the artifacts for a selected ML model element, click
next to the element. - To display a graph of a specific ML model element's artifact at the bottom of the section, do the following:
- Click the button below the tag graphs on the left side of the page.
The ML model element artifact graph display settings pane appears on the right.
- From the Model element drop-down list, select the ML model element. You can select only one ML model element from the list.
- Click the Close button.
The graph will show the value of the selected ML model element's artifact as a red line. The graph area above the orange threshold line is highlighted in red to indicate above-threshold artifact values.
- Click the
The lower part of the graph displays the dot indicators of incidents that were registered by the selected ML model elements. If the display of indicators for all incidents is enabled, dot indicators for incidents that were registered by all ML models and Limit Detector will be displayed.
Page topSelecting a date and time interval in the History section
Kaspersky MLAD lets you choose the date and a fixed time interval (scale) for displaying historical data or a user-defined time interval (for example, when an incident was detected).
To select the date for displaying historical data:
- In the main menu, select the History section.
- Click the
 button. In the opened window, select the date and time for which you need to display historical data on graphs.
 - Click the Apply button.
The vertical blue line on graphs will indicate the selected date and time (in the center of the graph).
- If you need to select other date and time (point) on the graph, click the
 button on the left of the time axis and select the relevant point.
The selected point will become the new center of the graph. The vertical blue dashed line will indicate the selected date and time.
To select a time interval for displaying historical data:
- In the main menu, select the History section.
- On the opened page, do one of the following:
- If you need to display data for a fixed time interval, select the relevant time interval from the drop-down list. The following time intervals are available by default:
- 1, 5, 10, 15, and 30 minutes
- 1, 3, 6, and 12 hours
- 1, 2, 15, and 30 days
- 3 and 6 months
- 1, 2, and 3 years
If necessary, the system administrator can create, edit, or delete time intervals.
- To display data for a custom time interval, click
 on the left of the time axis, select an interval on the time axis, and click
  . If you need to change the scale again, repeat this step.
- If you need to display data for a fixed time interval, select the relevant time interval from the drop-down list. The following time intervals are available by default:
The graphs for the selected preset will display the tag values and inference results for the selected ML model elements, for the chosen time interval.
Page topNavigating through time in the History section
Kaspersky MLAD provides the capability to navigate through time for convenient viewing of historical data.
To use time navigation when viewing data:
- In the main menu, select the History section.
- On the opened page, select the time interval for the data that you want to view.
- Use the
 and
and  buttons in the upper part of the page to move along the time axis to the right or left.
The time axis for viewing historical data on the graph will shift to the selected time interval.
Navigating through time
On graphs, a vertical blue dashed line indicates the midpoint of the selected time interval and matches the selected date and time. If an interval of 1 day is selected, the graph displays historical data for the 12-hour periods before and after the selected date and time relative to the dashed line. If necessary, you can change the time interval.
Page topConfiguring how graphs are displayed in the History section
Kaspersky MLAD lets you configure the settings for displaying graphic areas of presets in the History section.
To customize the appearance of graphic areas:
- In the main menu, select the History section.
- On the opened page, click the button in the upper part of the screen.
The Graph display settings pane appears on the right.
- In the Graph height drop-down list, select one of the following values: 55 px, 110 px, 145 px, 190 px.
By default, the Graph height parameter is set to 55 px.
- Turn on the Show observation graphs in selected color toggle switch, and select a color in the Color of observation graphs field as needed.
- Turn on the Show prediction graphs in selected color toggle switch, and select a color in the Prediction graph color field as needed.
- Use the Tag name and description toggle switch to enable or disable display of the tags descriptions and names on the left of the graphs.
- Use the Predicted tag value toggle switch to enable or disable display of the predicted tags values on graphs.
- Use the Individual tag error toggle switch to turn on or off the display of individual tag value prediction errors on graphs.
- Use the Display indicators for all incidents toggle switch to enable or disable display of the dot indicators for incidents registered by all ML models or Limit Detector.
If this switch is disabled, only the dot indicators for incidents that were registered by the selected ML model elements will be shown.
- If you need the graphs to display the defined technical limits for tags:
- Turn on the Blocking threshold toggle switch.
- If you need to always display the defined technical limits, turn on the Always display blocking threshold toggle switch.
If this switch is disabled, the technical limits will be displayed only if a tag value is approaching the corresponding limit in the graph area displayed on the screen.
- Use the Additional threshold lines toggle switch to enable or disable the display of additional threshold lines on the graph.
- Click the Close button to return to viewing graphs in the History section.
The defined settings for displaying graphic areas of presets in the History section will be applied.
Page topViewing data in the Time slice section
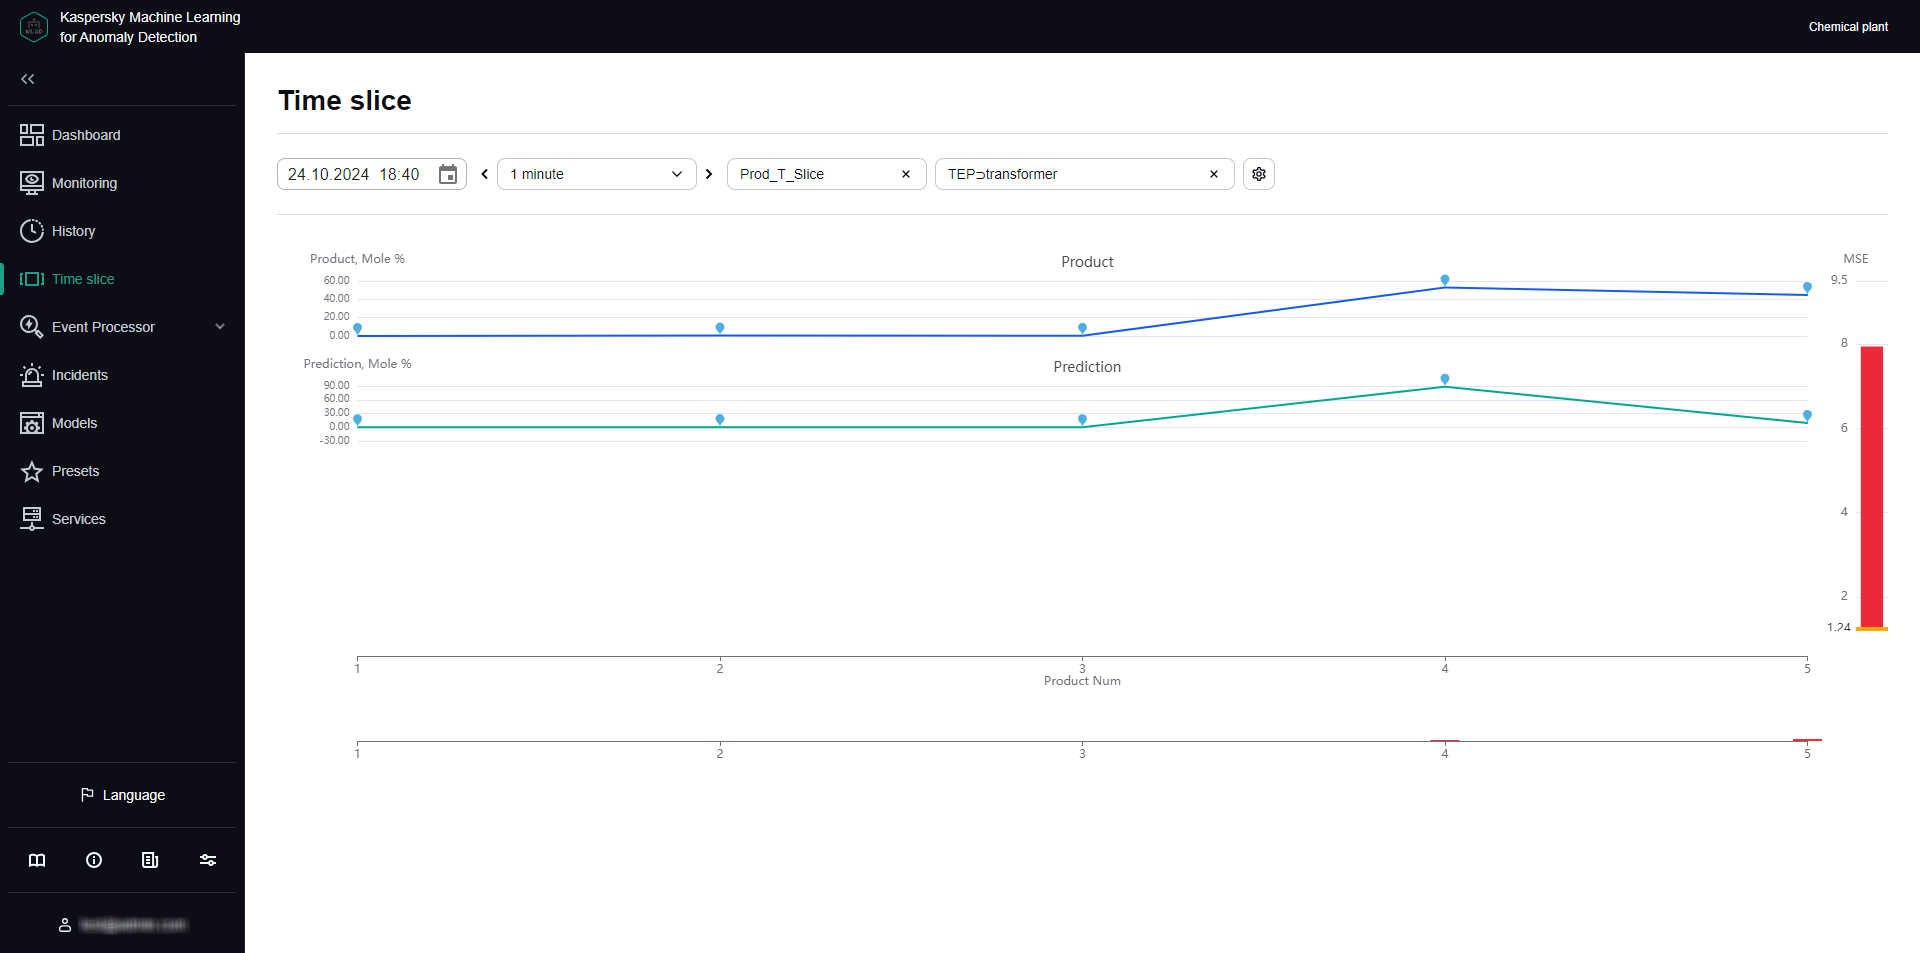
In the Time slice section, you can view the values of process parameters received from sensors of the monitored asset at the same point in time. The sensors must be of the same type (have the same dimension) and must be positioned linearly, like pressure sensors in an oil pipeline, for example.
Data is presented in the form of graphs that display whether an incident was detected at the selected time and where the likely source of the incident is located.
The lower part of the page contains a section displaying the individual errors of tags. The data is presented as a bar graph. The error value for each tag is displayed when the mouse cursor hovers over the relevant column. The prediction error graph is located on the right of the preset tag graphs.
In the Time slice section, you can use the drop-down list to select a preset and the date and time when data was received. This list includes special presets that can be created in the Presets section. A special preset should contain only tags of the same type that have defined x-axis coordinates. You can additionally specify expressions dynamically calculated for each tag based on actual and predicted tag values, individual prediction errors, and tag coordinate values and constants defined in expressions.
You can also customize the display of graphs, select a time interval for viewing data, and select a specific element of the ML model to view the individual errors of preset tags obtained as a result of data processing by the selected element of the ML model.
Data processing results can be displayed only for predictive ML model elements.
Time slice section
Viewing data for a specific preset in the Time slice section
To view data for a specific preset:
- In the main menu, select the Time slice section.
- On the opened page, select the relevant preset from the Preset drop-down list.
The page displays graphs for tags that are included in the selected preset.
If necessary, you can change the time interval for displaying data, customize the display of a graph, or select a specific element of the ML model. You can also change which tags are displayed by editing the preset.
Page topSelecting a specific element of the ML model in the Time slice section
If the ML model used for a monitored asset has several elements for processing and predicting data, Kaspersky MLAD lets you select a specific element of the ML model to display the individual tag errors obtained as a result of this element in the Time slice section.
The functionality is available after a license key is added.
Data processing results can be displayed only for predictive ML model elements.
To view the individual tag errors resulting from data processing by a specific ML model element:
- In the main menu, select the Time slice section.
- On the opened page, select the relevant element of the ML model from the Model element drop-down list.
Element names are displayed as
<ML model name> <element name>.
The bottom of the section displays the individual tag errors resulting from data processing by the selected element of the ML model.
Page topSelecting a date and time interval in the Time slice section
Kaspersky MLAD lets you select a date and time interval (scale) for displaying incoming data.
To select the date for displaying incoming data:
- In the main menu, select the Time slice section.
- Click the button. In the opened window, select the date and time for which you need to display data.
- Click the Apply button.
The graphs will display the tag values for the selected date and time.
To select a time interval for displaying incoming data:
- In the main menu, select the Time slice section.
- Select the required time interval from the drop-down list in the upper part of the opened page. The following time intervals are available by default:
- 1, 5, 10, 15, and 30 minutes
- 1, 3, 6, and 12 hours
- 1, 2, 15, and 30 days
- 3 and 6 months
- 1, 2, and 3 years
If necessary, the system administrator can create, edit, or delete time intervals.
The page will display graphs of the defined preset for the selected time interval.
Page topNavigating through time in the Time slice section
Kaspersky MLAD provides the capability to navigate through time for convenient viewing of data.
To use time navigation when viewing data:
- In the main menu, select the Time slice section.
- On the opened page, select the time interval for the data that you want to view.
- Use the and buttons in the upper part of the page to move along the time axis to the right or left.
The time axis for viewing data on the graph will shift to the selected time interval.
Navigating through time
Page topConfiguring how graphs are displayed in the Time slice section
Kaspersky MLAD lets you configure the settings for displaying preset graphs in the Time slice section.
To configure the display settings for preset graphs:
- In the main menu, select the Time slice section.
- On the opened page, click the button located in the upper part of the screen.
The Graph display settings pane appears on the right.
- In the Graph height drop-down list, select one of the following values: 55 px, 110 px, 145 px, 190 px.
By default, the Graph height parameter is set to 55 px.
- Click the Close button to return to viewing the graphs.
The graph display settings will be applied.
Page topWorking with events and patterns
The Event Processor section provides data on
and the structure of detected by the Event Processor service in the event stream received from external sources or from the Anomaly Detector service.
In the Event Processor section, you can view the history of received events and the registration history of new and/or persistently recurring patterns. You can also configure the display of event parameters and can configure pattern registration settings. On the Monitoring tab, you can monitor specific events, patterns, or values of event parameters, and generalized events and patterns received by the Event Processor within the data stream from monitored assets.
The functionality is available after a license key is added.
If restarted, Kaspersky MLAD restores the state of the Event Processor service and pauses the processing of data received from the CEF Connector. This data is temporarily stored in the internal queue of the application message broker. Until the Event Processor service is restored, the Event Processor section tabs will display a notification informing you that the Event Processor service has stopped. This service restoration process may take several minutes if there is a significantly large number of processed events or registered patterns.
Event Processor section
About Event Processor
The Kaspersky MLAD Event Processor is designed to detect regularities in the form of recurring events and patterns in the stream of events received from monitored assets and to detect new events and patterns. New events and patterns may indicate an anomaly in the monitored asset operation.
You can also focus the event processor attention on the overall behavior of the monitored asset. The event processor will register generalized events and patterns that lack generalized event parameters.
About events
Data received from monitored assets and from the Anomaly Detector service are processed as events by the Event Processor service. Event is a set of values taken from a predetermined list of parameters and indicating what happened on a monitored asset at a given moment. The set of event parameters depends on the monitored asset and is defined in the configuration file for the Event Processor service.
The Event Processor is designed to work only with categorical values of the event parameters. Event parameter values are converted to string type. Kaspersky MLAD uses the Anomaly Detector service to work with numeric values of telemetry data when processing the event stream. The system administrator can enable the processing of incidents received from the Anomaly Detector service when configuring the Event Processor service settings.
An event is a phenomenon distinct from other events. There may also be intervals of time during which no events have occurred. Event registration may be affected by such factors as the actions of personnel, changes in the asset operating mode at the facility, or the execution of ICS commands by a specialist.
Examples of situations that may lead to event registration in Kaspersky MLAD
An event is registered once by the Event Processor service. When an event stream is received, the Event Processor recognizes previously detected events. If events are found that do not match those previously detected, the Event Processor registers new events.
You can view the received events as a graph or a table. To view events, you need to upload them to Event Processor → Event history. Event parameters specified in the configuration file for the Event Processor service may not appear in all events received from the monitored asset. Thus, some parameters may be missing when you view the received events.
About patterns
The Event Processor detects regularities in the stream of events arriving from the monitored asset. These regularities are detected as a hierarchy of stable (persistently recurring) patterns, which can be either simple patterns (sequences of events) or composite patterns (sequences of patterns). The patterns that form a composite pattern are called subpatterns.
A sequence of events or patterns is considered recurrent if its constituent elements follow the same order, and the time intervals between similar elements in different sequences differ from each other by no more than a specific maximum range. The allowable range of intervals between the pattern elements is calculated considering the value of the Coefficient defining the permitted dispersion of the pattern duration parameter. Patterns are the result of the specific facility's adopted practices, prescribed procedures, or technical specifics of the industrial process.
The Event Processor presents the detected regularities as a layered hierarchy of nested elements (pattern structure) down to the event level. Events are the first layer elements, simple patterns are the second layer elements, and composite patterns are the third and higher layer elements. Event parameter values are elements of the null layer.
A pattern is registered once by the Event Processor service. When an event stream is received, the Event Processor recognizes previously detected patterns. If patterns are found that do not match previously detected regularities, the Event Processor registers new patterns.
New patterns also include the sequences of events or patterns with a deviation in the order or composition of subpatterns (for example, turning on an industrial unit before the operator has arrived at the workstation) or with significant changes in the intervals between events or subpatterns even though their sequence is preserved (for example, turning on an industrial unit immediately after or a lot later than the operator arrived at the workstation). Thus, the Event Processor registers patterns with a new structure.
New patterns may indicate an anomaly in the monitored asset operation. You can view the structure of the new pattern and examine its deviations from the structure of previously detected patterns.
If a newly identified sequence of events or patterns begins to repeat in a persistent manner, this sequence is converted to a stable pattern.
Event Processor can register patterns where the values of one or more event parameters, such as the name of the employee who turned on the machine, are irrelevant. These patterns are referred to as generalized. To register generalized patterns, set Generalized attention as the attention type when configuring attention. You can also specify Generalized parameter as the condition type when configuring attention subject conditions. Generalized attention subject and condition parameters will not be displayed when viewing the structure of generalized patterns on the Patterns history tab.
Page topAbout attention
The event stream from the monitored asset usually contains many unrelated events. The Event Processor service supports an attention mechanism to detect patterns based on a specific subset of events from the entire stream.
Attention is a special event processor configuration intended to track events and patterns for specific subsets of event history, and to detect commonalities in the behavior of the monitored asset.
Attention heads form the foundation of attention configuration. They define the attention subject parameter and attention subject condition parameters. The attention subject corresponds to the main event parameter that the event processor will use to register events and patterns. The conditions correspond to additional criteria for registering events and patterns for other event parameters. An attention head processes only those events in the entire incoming event stream that satisfy the specified attention subject and conditions. The event processor can process event streams for multiple attention heads simultaneously.
The event processor can register generalized events and patterns to track general behavior for different attention subject values. To do this, set Generalized attention as the attention type when configuring the attention subject. You can also specify Generalized parameter as the condition type when configuring attention subject conditions. Generalized attention subject and condition parameters will not be displayed when viewing generalized events or patterns. They will, however, influence the rules for extracting these generalized events and patterns from the stream.
You can configure attention in the Event Processor section.
Page topAbout Event Processor operating modes
Kaspersky MLAD has the following operating modes of the Event Processor service:
- Online mode. In the online mode, the Event Processor processes the incoming stream as episodes. An episode is a sequence of events from the entire stream that is limited by a specific time period and/or the number of events. An episode is formed when one of the following conditions is fulfilled:
- The episode accumulation time reached the limit defined by the Interval for receiving batch events (sec.) parameter of the Event Processor service.
- The number of accumulated events reached the limit defined by the Batch size in online mode (number of events) parameter of the Event Processor service.
Based on an episode received in the event stream, the Event Processor service detects new and/or repeated (stable) events and patterns for each of the defined attention heads. You can configure attention heads in the Event Processor section.
When an event with the timestamp belonging to a previously processed episode is received, the Event Processor service does not revise the structure of patterns detected during the processing of that episode. The Event Processor service takes into account the events received by Kaspersky MLAD with a delay when detecting patterns during the event history reprocessing in the sleep mode.
- Sleep mode. To improve the quality and structure of the identified patterns, the Event Processor can switch to sleep mode according to the specified schedule. Processing of the event stream in the online mode is paused, and Kaspersky MLAD accumulates incoming events in the internal limited buffer on the server for subsequent processing after the application switches from the sleep mode back to online mode.
In sleep mode, the Event Processor re-analyzes sequences of events that were previously processed in online mode. To detect more complex pattern structures in the sleep mode, the Event Processor processes sequences of events during longer time intervals than the episode accumulation time in the online mode.
In the Event Processor service settings, you can configure a schedule for the sleep mode (for example, at the time when the event stream is least intense) and define a time interval for the events analyzed in the online mode to be forwarded for reprocessing in the sleep mode.
About monitors
A monitor is the source of notifications about patterns, events, or values of event parameters detected by the Event Processor according to the defined monitoring criteria. The monitoring criteria define the attention head, additional filters for event parameter values, a sliding time window, and the number of consecutive monitor activations within that window.
You can create monitors for alerts about the following detections in the event stream:
- Values of event parameters. You can create a monitor for alerts about the identification of new or previously encountered values of a specific event parameter. For example, to track new users on a monitored asset, create a monitor with the Parameter values subscription type and configure it to detect new values for the User parameter.
- Events. You can create a monitor for alerts about the identification of new or previously encountered events. You can also focus the attention of the Event Processor on a specific parameter of events. For example, to track new actions of a specific user at the monitored asset, you need to create a monitor with the Events subscription type and specify the name of the user whose actions you want to track in the User event parameter.
- Patterns. You can create a monitor for alerts about the identification of new or previously encountered patterns. For example, to track regularities in the actions of a specific user at the monitored asset, create a monitor with the Patterns subscription type, focus the attention of the Event Processor on the User parameter, and set this parameter to the name of the user whose actions you want to track.
- Similar generalized events or patterns. You can create a monitor to receive alerts about similar generalized events or patterns. If you want to track overall patterns in the actions of different users on a monitored asset, then when creating a monitor, you need to select the Similar generalized subscription type, choose the generalized attention head for User, and select Subscription to patterns for Subscription to events or patterns.
- Unique generalized events or patterns. You can create a monitor to receive alerts about unique generalized events or patterns. For example, to track new overall patterns in the actions of any user, select the Unique generalized subscription type when creating a monitor. For User, select a generalized attention head with conditions for additional parameters that match your expectations of different users' behavior. Select Subscription to patterns for Subscription to events or patterns. For Sliding window (sec.), specify a time interval for the event processor to wait for a similar generalized pattern for other users. If the event processor does not detect such a pattern, the monitor will send an activation alert.
You can set fuzzy filters in the monitoring criteria. For example, you can create a monitor to track situations when a user (monitoring all values of the User parameter) accessed the accounting server (the value of the Server parameter) more than ten times (the value of the Activation threshold field) in the last five minutes (the value of the sliding time interval).
When events, patterns and event parameter values matching the monitoring criteria are detected in the stream of incoming data, the Event Processor activates the monitor. Kaspersky MLAD displays information about the number of monitor activations when viewing a monitor, and sends to the external system alerts about the activation of monitors when the specified threshold is reached for a sliding window using the CEF Connector.
The custom monitors are displayed in the Event Processor section on the Monitoring tab.
Configure display of event parameters
Before the Event Processor service can process events, you need to configure the way event parameters are displayed.
The functionality is available after a license key is added.
To configure how event settings are displayed:
- In the main menu, select the Event Processor → Monitoring section.
- On the page that opens, click Configure filter display.
The Configure display of event parameter filters panel will appear on the right.
- To configure the display of filters for the event parameters, in the Filters section on the Event history and Patterns history tabs, select the check boxes next to the names of the desired event parameters.
By default, the pane displays the event parameters from the Anomaly Detector service. To display custom event parameters, load the Event Processor service configuration file. All available event parameters are selected by default.
If necessary, in the Filters section you can change the display order for the event parameters. To do so, drag the event parameter to the required place in the Configure display of event parameter filters panel by holding the dots (
 ) on the left of the event parameter name.
 - Click the Save button.
Configure attention settings
Before events are processed by the Event Processor service, attention settings must be configured.
Attention heads form the foundation of attention configuration. They define the attention subject parameter and attention subject condition parameters. The attention subject corresponds to the main event parameter that the event processor will use to register events and patterns. The conditions correspond to criteria for registering events and patterns for other event parameters. An attention head processes only those events in the entire incoming event stream that satisfy the specified attention subject and conditions.
The event processor can register generalized events and patterns to track general behavior for different attention subject values. To do this, set Generalized attention as the attention type when configuring the attention subject. You can also specify Generalized parameter as the condition type when configuring attention subject conditions. Generalized attention subject and condition parameters will not be displayed within registered events or patterns. They will, however, influence the rules for extracting these generalized events and patterns from the stream.
All created attention heads and information about these are displayed in the Attention heads panel. To view information about attention heads in the Attention heads panel, click Configure attention.
Adding an attention head
You can create multiple attention heads and use different attention heads for different monitors simultaneously.
The functionality is available after a license key is added.
A large number of attention heads can lead to reduced event processor performance and slow down the core Kaspersky MLAD services, such as data reception, anomaly detection, and the web interface. To clarify the number of attention heads, it is recommended to consult with Kaspersky experts or a certified integrator.
To add an attention head:
- In the main menu, select the Event Processor → Monitoring section.
- On the page that opens, click Configure attention.
The Attention heads panel appears on the right.
- To add an attention head, click Add attention head.
The Add attention head panel appears on the right.
- In the Name field, specify the attention head name.
- To use the attention head when processing an event flow, set the State toggle switch to Active.
- Under Attention subject, do the following:
- From the Event parameter drop-down list, select the primary event parameter you want to register events and patterns for.
- In the Attention type drop-down list, select one of the following values:
- Attention. When registering events and patterns, the event processor's attention will be directed to the selected event parameter based on selected value.
- Generalized attention. When registering events and patterns, the event processor will aggregate the selected values by selected event parameter.
When this attention type is selected, the event processor will register generic patterns that will not display the selected event parameter with the selected value when viewed. The Event Processor will track each specified event parameter value separately.
- Perform one of the following actions:
- To include or generalize all values of an event parameter in attention, select All values from the Value type drop-down list.
Selecting All values causes the event processor to track events and patterns for each specific event parameter value separately. To ensure stable event processor performance, we recommend defining specific values for the event subject.
- To include or generalize specific event parameter values in attention, select Specific values from the Value type drop-down list and enter the relevant value in the Value field. As you start typing a value, all matching parameter values are displayed in the list.
If you selected Generalized attention as the attention type, select at least two values for the event parameter.
- To include or generalize event parameter values according to a template in attention, from the Value type drop-down list, select Regular expression and enter the value template using a regular expression in Value.
You can use special characters of regular expressions to search for events and patterns based on regular expressions.
- To include or generalize all values of an event parameter in attention, select All values from the Value type drop-down list.
- If you need to generalize other event parameters, set the Generalize condition parameters toggle switch to Enabled.
If generalized attention was selected as the attention type, then, when the switch is on, the event processor will generalize the remaining event parameters across all their values. In this case, the event processor will not register any event or pattern. To enable the Event Processor to generate events or patterns, you must define at least one event parameter in the Conditions block without generalization based on its values.
- To refine the criteria for registering patterns using additional event parameters, do the following under Conditions:
- Click the Add condition button.
- From the Event parameter drop-down list, select an additional event parameter to refine the data sample for events and patterns registration.
- In the Condition type drop-down list, select one of the following values:
- Parameter. When registering events and patterns, the event processor will consider the values of the selected event parameter while taking into account the data sample obtained for the main event parameter.
- Generalized parameter. When registering events and patterns, the event processor will aggregate the values of the selected parameter while considering the data sample obtained for the primary event parameter.
When this condition type is selected, the event processor will register patterns that, when viewed, will not display the selected event parameter with the selected value.
This value is available if the Generalized attention type is selected for the attention subject.
- Perform one of the following actions:
- To include or generalize the new values of an event parameter in attention, select New values from the Value type drop-down list.
New values is available in the following cases:
- The condition type is set to Parameter.
- The attention type is set to Attention, the Generalize condition parameters toggle switch is off, and the condition type is set to Generalized parameter.
- To include or generalize all values of an event parameter in attention, select All values from the Value type drop-down list.
All values is available in the following cases:
- The Generalize condition parameters toggle switch is on, and the condition type is set to Parameter.
- The Generalize condition parameters toggle switch is off, and the condition type is set to Generalized parameter.
- To include or generalize specific event parameter values in attention, select Specific values from the Value type drop-down list and enter the relevant value in the Value field. As you start typing a value, all matching parameter values are displayed in the list.
- To include or generalize event parameter values according to a template in attention, from the Value type drop-down list, select Regular expression and enter the value template using a regular expression in Value.
You can use special characters of regular expressions to search for events and patterns based on regular expressions.
- To include or generalize the new values of an event parameter in attention, select New values from the Value type drop-down list.
You can set more than one condition for additional event parameters. You can delete a previously added condition by clicking
 next to the condition.
The conditions will be additionally applied to the data sample obtained for the main event parameter set under Attention subject. For example, if the Generalized attention type is selected and the Generalize condition parameters toggle switch is on, the Event Processor will register patterns that will display only those event parameters that were specified under Conditions while considering their selected values. If the toggle switch is off, the event processor will register patterns that will not display the generalized parameter specified under Attention subject. In this case, the values of the event parameters specified under Conditions will be considered.
- Click the Save button.
Information about the new attention head will be displayed in the table, in the Attention heads panel. You can rename the attention head, and enable or disable the use of the attention head for event processing.
Page topEditing an attention head
You can enable or disable the use of the attention head when processing the flow of events.
You cannot modify attention subject or condition parameters. You can remove attention heads or create new ones if needed.
The functionality is available after a license key is added.
To edit an attention head:
- In the main menu, select the Event Processor → Monitoring section.
- On the page that opens, click Configure attention.
The Attention heads panel appears on the right.
- Click
 next to the attention head you want to edit.
The Edit attention head panel appears on the right.
- Rename the attention head as needed.
- Perform one of the following actions:
- To use the attention head when processing an event flow, set State to Active.
- To disable the use of the attention head when processing an event flow, set State to Inactive.
- Click the Save button.
Removing an attention head
The functionality is available after a license key is added.
To delete an attention head:
- In the main menu, select the Event Processor → Monitoring section.
- On the page that opens, click Configure attention.
The Attention heads panel appears on the right.
- Click next to the attention head you want to delete.
- In the window that opens, confirm that you want to delete the attention head.
Information about the attention head will be deleted from the table in the Attention heads panel. Patterns detected according to this attention head will also be removed from Kaspersky MLAD.
Page topManaging monitors
The functionality is available after a license key is added.
Under Event Processor → Monitoring, you can manage monitors to track specific events, patterns, event parameter values, and generalized events or patterns. You can view a summary of registered activations by monitor as a histogram.
You can manage monitors on the Monitors tab. To navigate to the tab, click  in the upper right corner of the section.
The tab displays all monitors created in the application, with the following brief information:
- Monitor name.
- Number of monitor activations on the sliding window.
- Monitor subscription type. The following values can be displayed for each monitor:
- Parameter values. The monitor tracks the occurrence of certain event parameter values.
- Events. The monitor tracks the occurrence of certain events.
- Patterns. The monitor tracks the occurrence of patterns in the behavior of the monitored asset.
- Unique generalized. The monitor tracks the occurrence of unique generalized events or patterns.
- Similar generalized. The monitor tracks the occurrence of similar generalized events or patterns.
- Activation threshold: the number of monitor activations on the sliding window that causes the application to send monitor activation alert to the external system when reached.
- Period: the sliding window during which the number of monitor activations is tracked.
You can view detailed information about each monitor if needed. To do so, click the monitor tile.
You can view the histogram with a summary of activations on the Histogram tab, in the upper right corner of the section.
Creating a monitor
The functionality is available after a license key is added.
To create a monitor:
- In the main menu, select the Event Processor → Monitoring section.
- Click the Create monitor button.
The Create monitor pane appears on the right.
- Specify the name of the monitor in the Name field.
- To use the monitor to track parameter values, events, or patterns, set State to Active.
- In the Sliding window (sec.) field, specify the interval (in seconds) from the current point in time back to the time sequence for which the monitor will process incoming values of parameters, events or patterns.
- In the Activation stack size field, specify the number of monitor activations that must be displayed when viewing information about the monitor.
- Under Subscription type, select one of the following options:
- To track the occurrence of certain event parameter values, select Parameter values.
- To track the occurrence of certain events, select Events.
- To track the occurrence of patterns in the behavior of the monitored asset, select Patterns.
- To track unique generalized events or patterns, select Unique generalized.
- To track similar generalized events or patterns, select Similar generalized.
- In the Activation parameters block, do the following:
- In the Activation threshold field, specify the number of monitor activations in the sliding window after which the monitor sends an alert to the external system.
This parameter is displayed if Subscription type, Parameter values, or Events is selected in the Patterns settings block.
- To track new events, patterns, or event parameter values, set Activation type to Track only new.
This parameter is displayed if Subscription type, Parameter values, or Events is selected in the Patterns settings block.
- In the Attention head drop-down list, select the attention head to focus the monitor's attention on the required directions in the behavior of the monitored asset.
This parameter is displayed if Patterns, Unique generalized, or Similar generalized is selected under Subscription type.
- In the Subscription to events or patterns field, select one of the following options:
- To track generalized events, select Subscription to events.
- To track generalized patterns, select Subscription to patterns.
This parameter is displayed if Unique generalized or Similar generalized is selected under Subscription type.
- In the Activation threshold field, specify the number of monitor activations in the sliding window after which the monitor sends an alert to the external system.
- To specify the conditions for activating the monitor when tracking event parameter values, events, or patterns, do the following under Filters:
- Perform one of the following actions:
- To track events for all specified values within a single monitor, set the toggle switch to Track for all values simultaneously.
- To create child monitors for each specified event parameter value selected from the Event parameter drop-down list, and track their occurrence separately, set the toggle switch to Track for each value.
The check box is displayed if Events is selected under Subscription type.
- In the Event parameter drop-down list, select an event parameter to refine monitor activation conditions for.
- In the Filter type drop-down list, select one of the following values:
- Parameter: to activate the monitor when tracking specific event parameter values.
- Generalized parameter: to activate the monitor when tracking generalized event parameter values.
This value can be selected if the monitor is tracking the occurrence of patterns.
- Attention: to focus the attention of the event processor on a specific event parameter.
This value can be selected if the monitor is tracking the occurrence of patterns.
- Generalized attention: to focus the generalized attention of the event processor on the selected parameter.
This value can be selected if the monitor is tracking the occurrence of patterns.
- Perform one of the following actions:
- To include or generalize all values of an event parameter in attention, select All values from the Value type drop-down list.
- To include or generalize a specific event parameter value in attention, select Specific values from the Value type drop-down list and enter the relevant value in the Value field. As you start typing a value, all matching parameter values are displayed in the list.
- To include or generalize event parameter values according to a template in attention, from the Value type drop-down list, select Regular expression and enter the value template using a regular expression in Value.
You can use special characters of regular expressions to search for events and patterns based on regular expressions.
- To include or generalize the new values of an event parameter in attention, select New values from the Value type drop-down list.
This value type is available if the Activation type toggle switch is set to Track only new.
If necessary, you can specify more than one monitor activation condition. You can delete a previously added condition by clicking
next to the condition.
- Perform one of the following actions:
- Click the Save button.
The new monitor is created and displayed on the Monitoring tab.
Page topEditing a monitor
You can enable or disable the use of the monitor to track event parameter values, events, or patterns.
The functionality is available after a license key is added.
To edit monitor:
- In the main menu, select the Event Processor → Monitoring section.
- In the vertical menu
 of the monitor tile, select Edit.
The Edit monitor panel appears on the right.
- Enter a new name for the monitor as needed.
- Perform one of the following actions:
- To start using the monitor to track event parameter values, events, or patterns, set State to Active.
- To stop using the monitor to track event parameter values, events, or patterns, set State to Inactive.
- Click the Save button.
Deleting a monitor
The functionality is available after a license key is added.
To delete a monitor:
- In the main menu, select the Event Processor → Monitoring section.
- In the vertical menu of the monitor tile, select Delete.
- Confirm monitor deletion.
The monitor will be deleted.
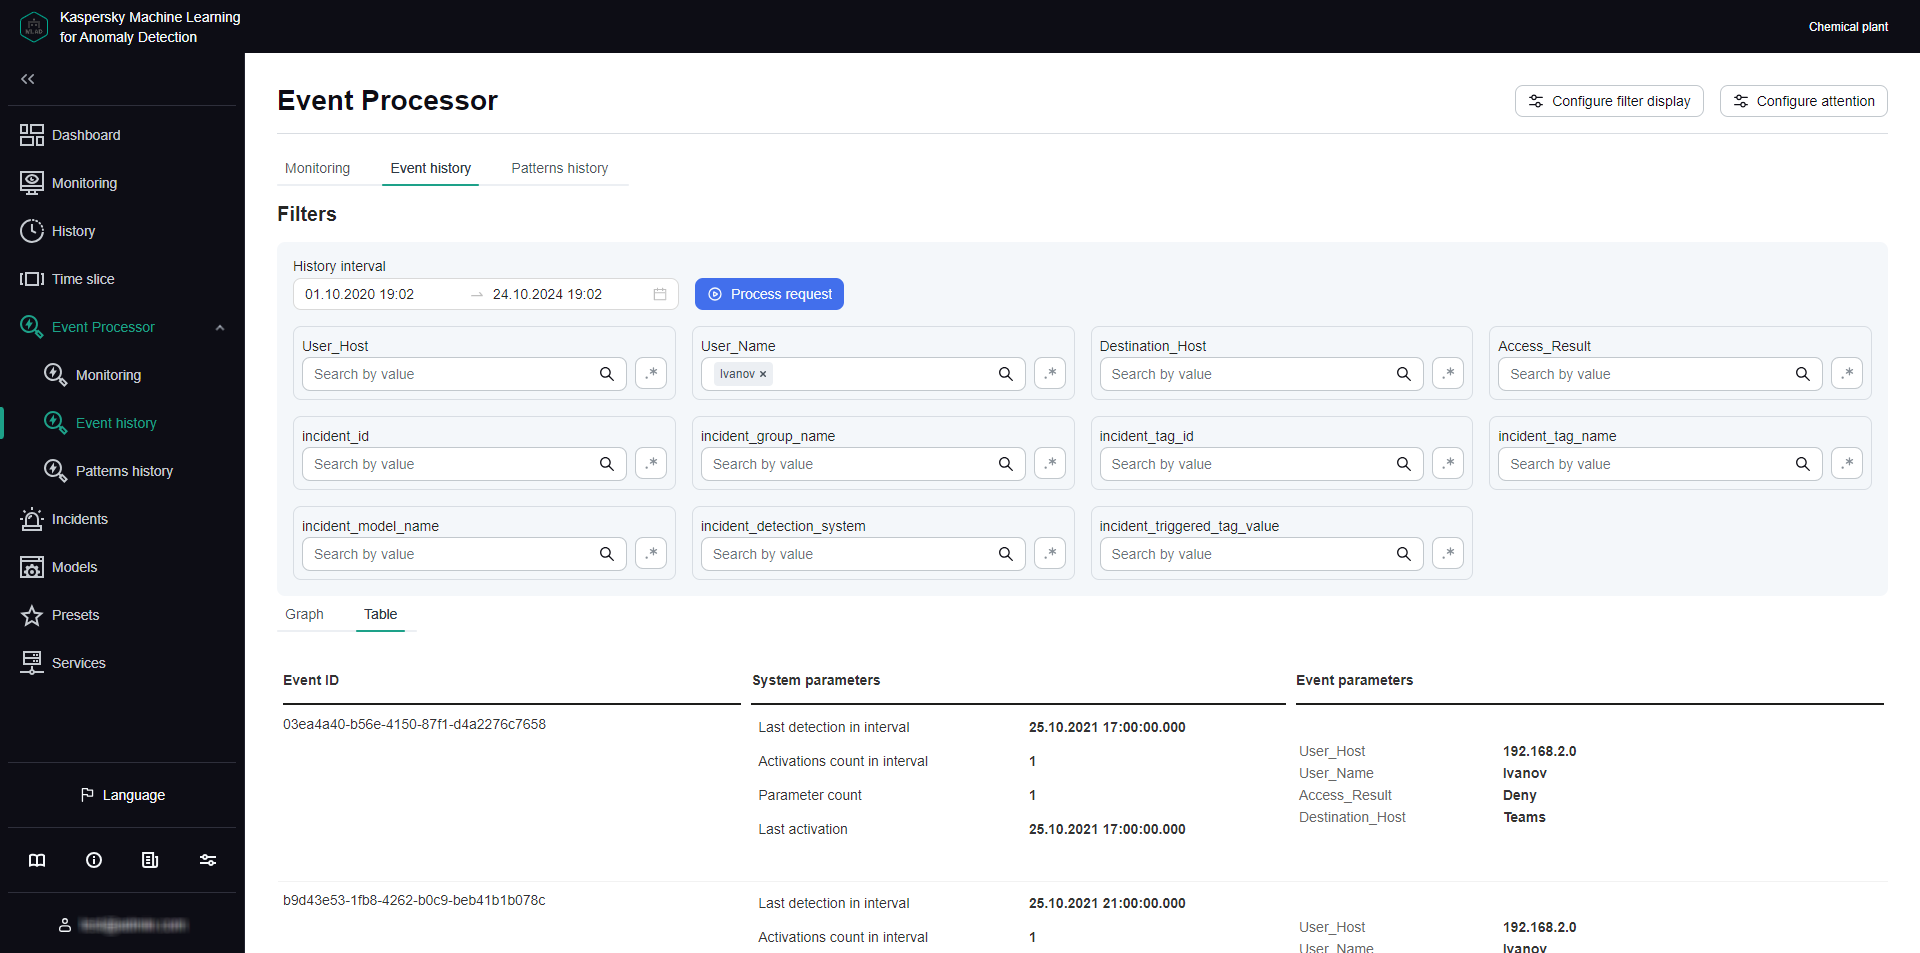
Page topViewing the events history
Kaspersky MLAD lets you view the events that were received from external sources of events. To view events, you need to upload them to Event Processor → Event history.
The functionality is available after a license key is added.
Kaspersky MLAD displays incoming events as a graph of relations between event parameters. The graph nodes correspond to the values of the event parameters, and the arcs between the nodes correspond to the links between the parameter values of incoming events. You can hover the mouse pointer over the event graph and view information about the event parameters and their values. You can also hover the mouse pointer over the event graph arc and view information about the number of links between the values of event parameters. The graph of event parameter relations is displayed on the Graph tab.
You can also view information about the detected events as a table.
Each monitored asset has its own specific incoming events and event parameters. The list of event parameters is defined in the configuration file for the Event Processor service. The configuration file is created and uploaded by a system administrator during configuration of the Event Processor service.
To upload data for viewing incoming events:
- In the main menu, select the Event Processor → Event history section.
- In the Filters section, click the
 button to select the start and end date and time of the period for which you want to load and view events. To configure event parameters, do one of the following:
- To load events based on the specific values of the event parameters, select the relevant event parameter value in the drop-down lists. As you start typing a value, all matching parameter values are displayed in the lists.
- To load events based on a value template, click
 in the event parameter cells, use the drop-down lists to enter the value template with the help of a regular expression, and select specified value template.
You can use special characters of regular expressions to perform a search based on regular expressions.
Each monitored asset has its own specific set and names of event parameters.
- Click the Process request button.
Data on the events found by the application will be displayed as a graph in the central part of the page.
- To view the received events as a table, select the Table tab.
The central part of the page displays a table that contains information on the detected events.
Viewing the pattern history
In the section Event Processor → Patterns history, you can find and view the structure of the new and/or persistently recurring patterns. The Event Processor generates patterns only for specific directions according to attention heads that are defined in the attention configuration.
The functionality is available after a license key is added.
You can also view the structure of the detected patterns down to the event level. The Event Processor represents patterns, events, and values of event parameters as a layered hierarchy of nested elements. For example, a fourth-layer pattern consists of subpatterns of the third layer. A third-layer pattern consists of second-layer patterns, and a second-layer pattern consists of events, which are first-layer elements. Event parameter values are elements of the null terminal layer.
Each monitored asset has its own specific incoming events and event parameters. The list of event parameters is defined in the configuration file for the Event Processor service. The configuration file is created and uploaded by a system administrator during configuration of the Event Processor service.
To view the registered patterns:
- In the main menu, select the Event Processor → Patterns history section.
- In the Filters section, configure the following settings for displaying patterns on the page:
- In the History interval drop-down list, click the button to select the start and end date and time of the period for which you want to load and view patterns.
- In the Pattern type drop-down list, select one of the following values:
- Stable refers to patterns that were registered by the Event Processor service two or more times.
- New refers to new patterns registered by the Event Processor service for the first time.
- All includes all patterns that were registered by the Event Processor service.
- From the Attention head drop-down list, select the specific attention head to examine for registered patterns.
You must select one of the attention heads that were defined when configuring the attention settings.
- To configure event parameters, do one of the following:
- To view patterns based on specific values of the event parameters, select the event parameter values in the drop-down lists. As you start typing a value, all matching parameter values are displayed in the lists.
- To view patterns based on a value template, click in the event parameter cells, use the drop-down lists to enter the value template with the help of a regular expression, and select specified value template.
You can use special characters of regular expressions to perform a search based on regular expressions.
For the request to be processed correctly, enter the values for the event parameter that is receiving focused attention from the model. If an event parameter that is receiving focused attention has multiple values defined, the Event Processor will generate patterns for each value of the parameter.
Event parameters set as generalized in the selected attention head cannot be customized.
- In the History interval drop-down list, click the
- Click the Process request button.
The central part of the page displays a table containing data on the registered patterns.
- To view the pattern structure, click the desired pattern row.
The page with detailed information on the pattern opens.
- To view the structure of a pattern, do one of the following:
- To view the structure of a particular subpattern, on the Patterns tab in the Nested elements section, click the desired pattern.
You can return to viewing the top-level pattern structure by clicking the ID of the desired pattern above the Pattern info section.
- To view the events included in the pattern at the second nesting level, click the Events tab.
Kaspersky MLAD displays the pattern structure from the top nesting level.
- To view the structure of a particular subpattern, on the Patterns tab in the Nested elements section, click the desired pattern.
Working with incidents and groups of incidents
The Kaspersky MLAD web interface provides the capability to investigate registered incidents. Depending on the type of the registered incident source, information about the incident and the methods you can use to investigate it may differ.
The functionality is available after a license key is added.
You can perform the following actions for any incident:
- Analyze the incident details.
- Find out if any similar incidents were detected previously.
- Study the behavior of the monitored asset at the moment when the incident was detected.
- Leave a note or expert opinion for a registered incident or incident group.
The Incidents section displays a column graph showing the incidents that match the filtering criteria specified under the graph. The graph displays statistics on the registered incidents for the period specified above the graph.
The graph can display up to 60 bars. If the specified period does not exceed 60 days, incidents on the graph are grouped by days. If the specified period is between 60 days and 60 weeks, incidents on the graph are grouped by weeks. If the specified period is longer than 60 weeks, incidents on the graph are grouped by months.
Hovering the mouse pointer over a bar of the graph displays a window showing the number of registered incidents per corresponding time period. Upon clicking a bar, the graph and in the table below display information about the incidents registered during the corresponding time period.
In this section, you can view individual incidents as well as groups of incidents.
Incidents tab
The Incidents tab shows a table of registered incidents. Incidents are sorted by date in descending order, with the newest incidents shown first.
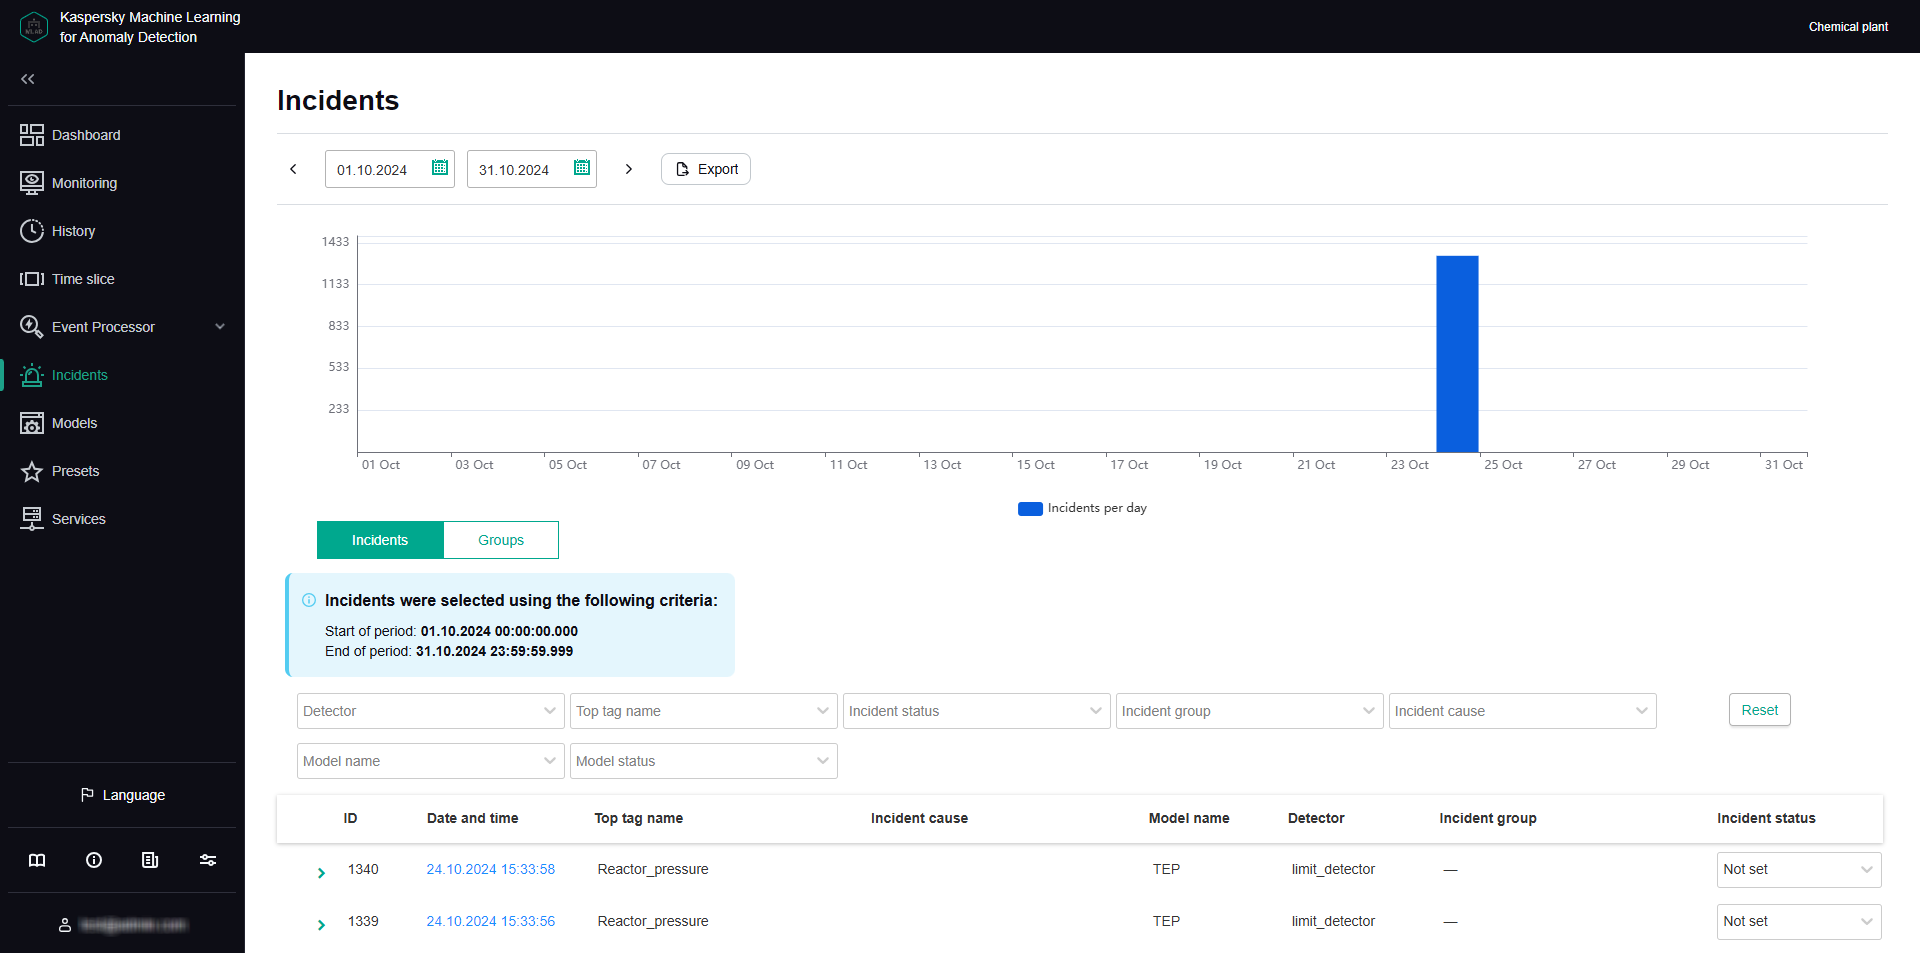
Incidents tab
You can go to the History section by clicking the date and time of the incident.
Groups tab
The Groups tab shows a table of incident groups. Kaspersky MLAD automatically generates groups of similar incidents.
You can change the group name that was assigned automatically and set the status of incidents that belong to this group. You can also provide an expert opinion that contains the recommended actions to take in response to new incidents in this group, for example.
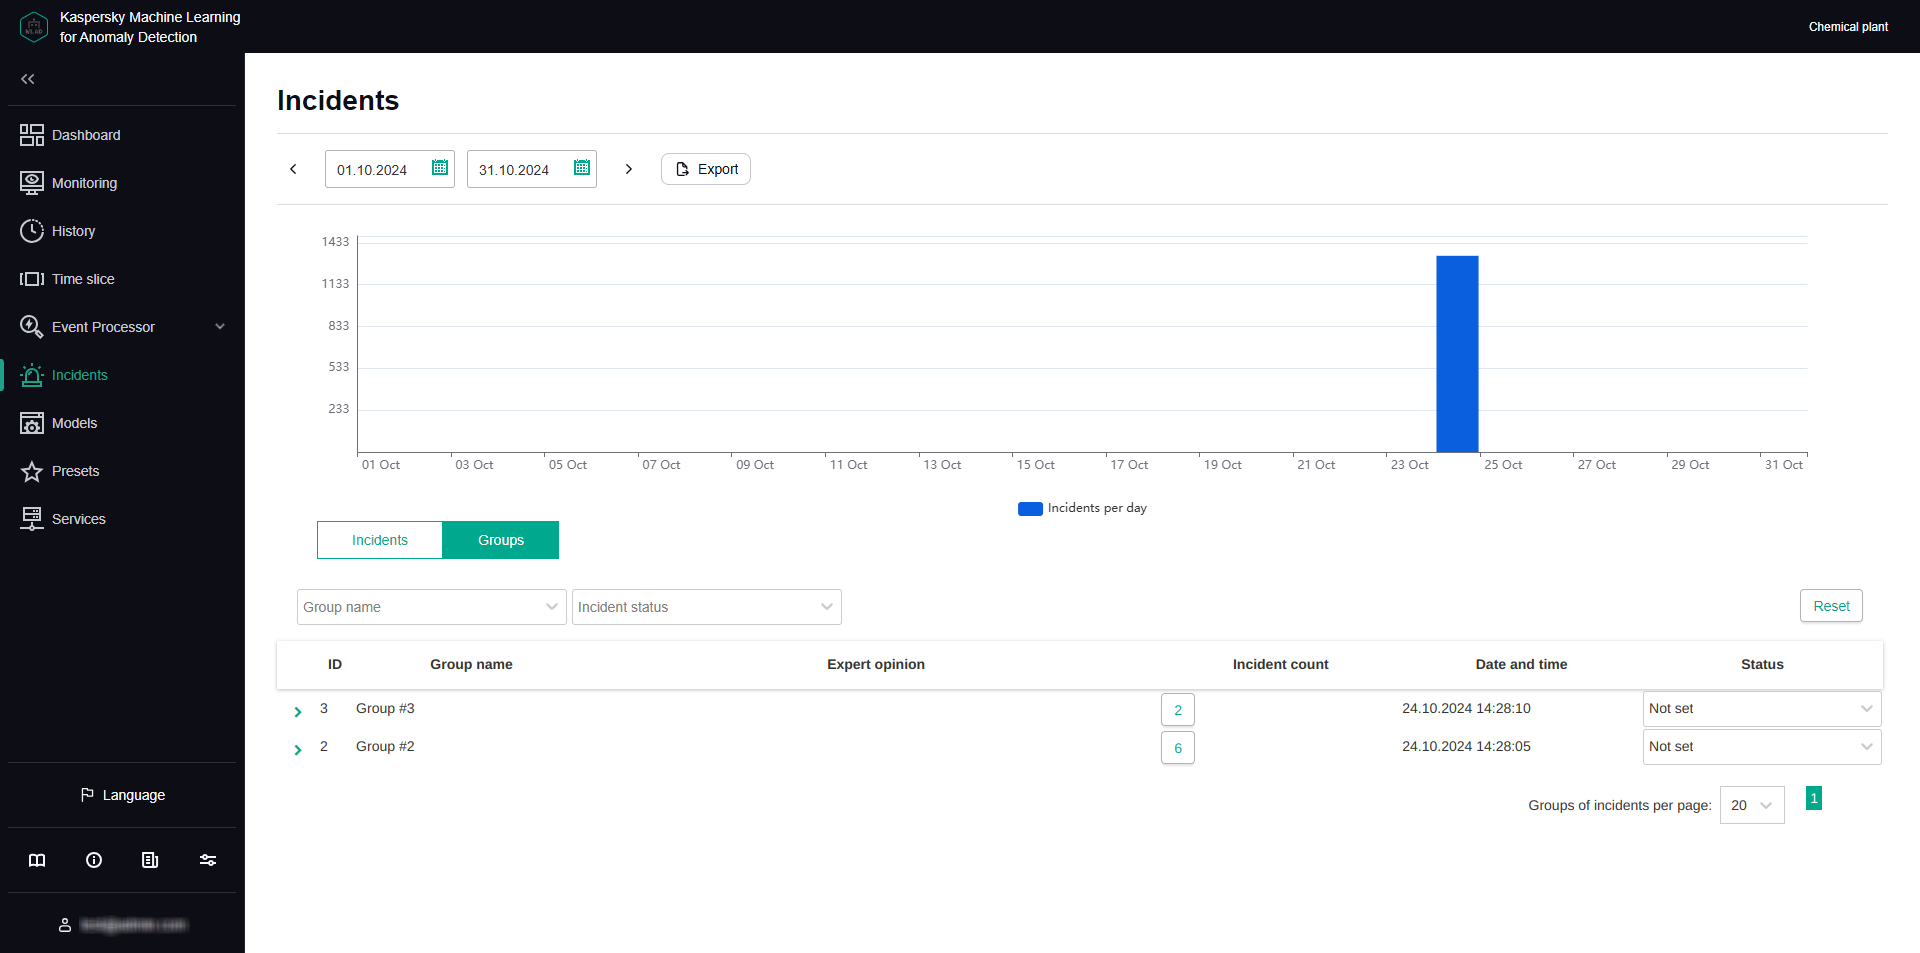
Groups tab
About incidents
An incident is an identified deviation from the expected (normal) behavior of a monitored asset.
Kaspersky MLAD supports incident registration for the following sources:
- ML model elements. An incident is recorded when the value of an ML model element artifact reaches the incident registration threshold set for that specific element. Incidents can be detected by predictive, diagnostic rule-based, and elliptic envelope-based ML model elements.
The registration of an incident may be delayed after the specified threshold is reached, depending on the configuration of the ML model element. When a certain threshold for registering an incident is met, the ML model element starts watching for unusual activity in the monitored asset for a specific period defined in the element settings. If the monitored asset exhibits anomalous behavior for a certain specified proportion of this interval, the ML model element registers an incident.
Kaspersky MLAD can suppress the registration of consecutive incidents from the same ML model element if these occur shortly after the first incident in the series. This uses Period of recurring alert suppression (sec), which you can define in the element settings.
An ML model element may continue to flag the same incident multiple times until the abnormal activity stops. You can control how often repeated incidents are recorded by adjusting the Reminder period (sec) and editing the element.
- Limit Detector. The system will record an incident whenever a tag value reaches the upper or lower limit.
- Stream Processor. An incident is recorded when the system notices that telemetry data is missing or when Kaspersky MLAD receives observations too early or too late.
When a deviation is detected, the corresponding source records the date, time and relevant deviation parameters, and saves this data as an entry in the Incidents section. If incident notifications for users or external systems are created in Kaspersky MLAD, information about an incident is sent to the intended recipients via the corresponding services of Kaspersky MLAD.
About incidents detected by a predictive element of an ML model
An ML model predictive element has been trained on a particular subset of tags, and it can anticipate current tag behavior. In this case, an incident is any substantial discrepancy between the observed (actual) values of tags and the predicted values of tags resulting from operations of the ML model element. In the model element settings, you can view which tags are analyzed by the ML model element (Input tags parameter) and which tags' behavior is predicted (Output tags parameter).
An ML model can include one or more elements running in parallel. In the History and Monitoring sections, you can select a specific element of the ML model to display the incidents registered as a result of a specific model element operation. The graph of the ML model element artifact shows registered incidents as colored dots at the bottom.
The artifact graph also displays cumulative prediction error value for the selected ML model element. Cumulative prediction error is an indicator of the difference between predicted values from actual values, calculated cumulatively for all tags included in the selected element of the ML model. The higher the prediction error value, the more the behavior of tags will differ from the expected (normal) behavior. The prediction error threshold is the critical cumulative prediction error value that, when reached, causes the ML model predictive element to register an incident. The artifact graph displays the cumulative prediction error as a red line, and the prediction error threshold, as an orange line. The area on the graph where the forecast error exceeds the specified threshold is colored red.
The ML model artifact graph is displayed at the bottom of the History section (see figure below).
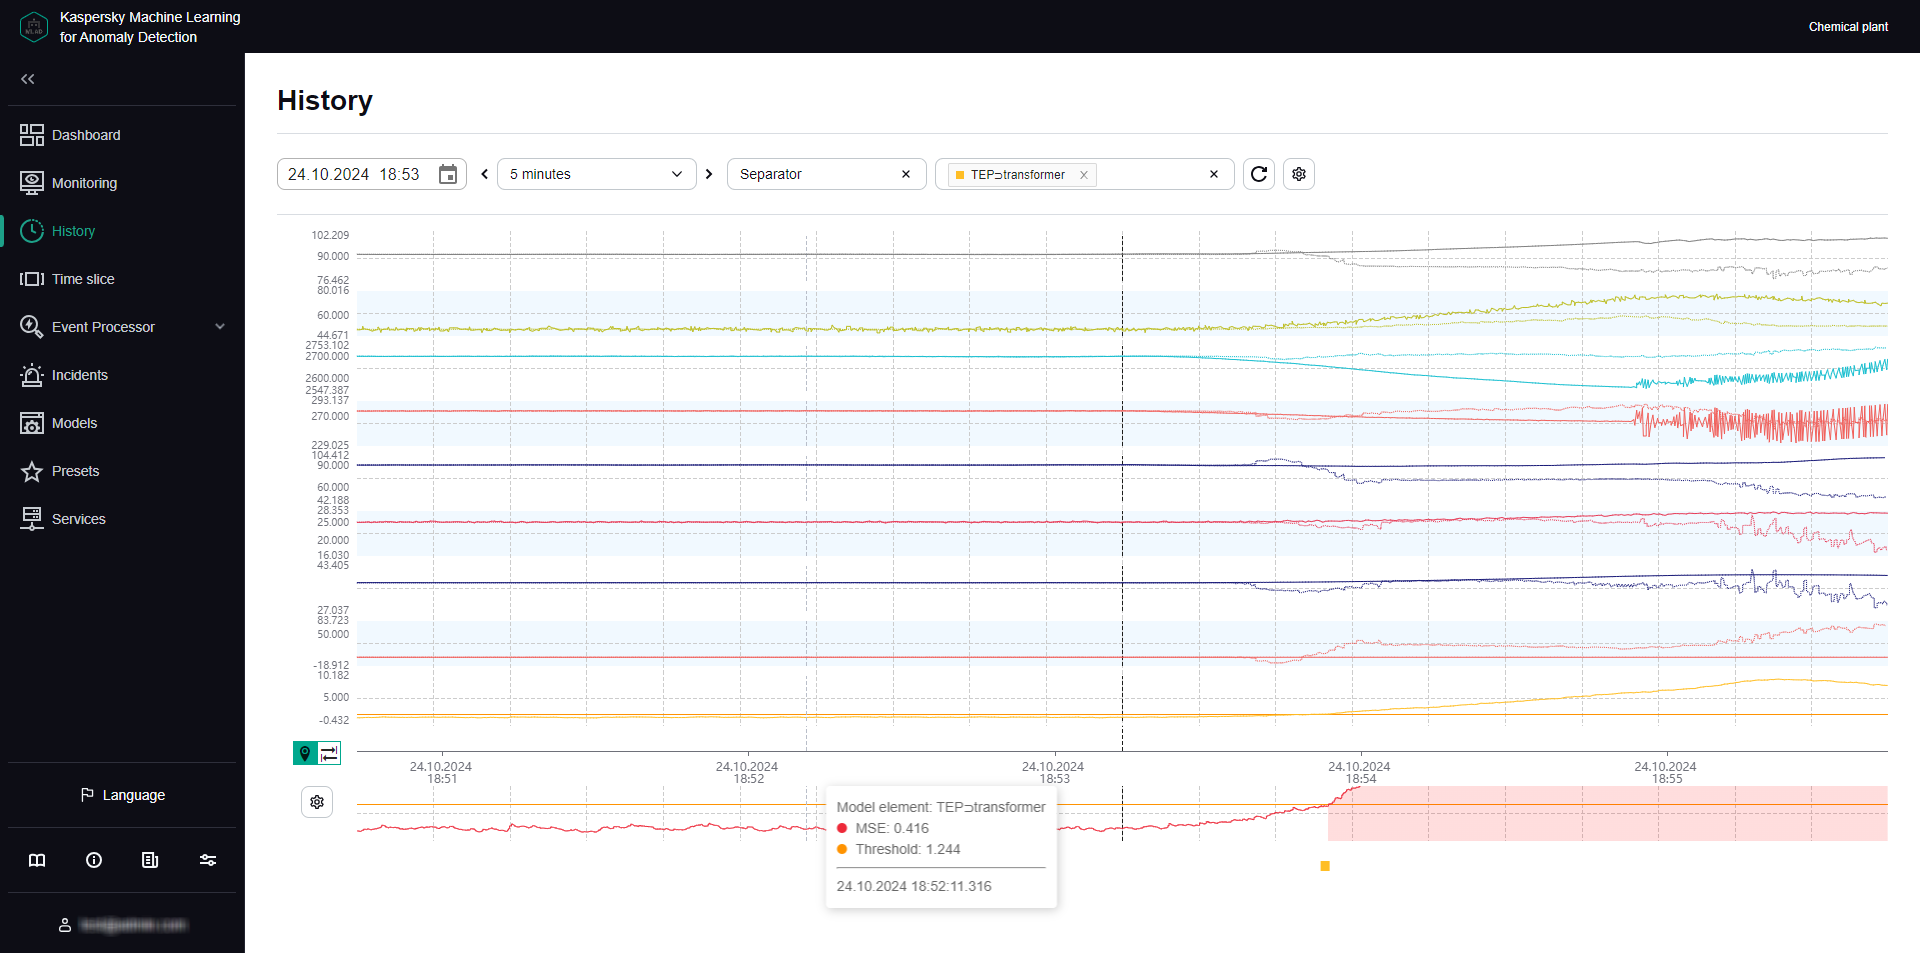
ML model element artifact graph under History
For each incident, the application automatically identifies tags with the greatest actual value deviations from those predicted by the ML model. These tags generate a Tags for incident #<incident ID> preset. This preset is displayed under History when you click the incident date and time in the incidents table. Tags that are included in the Tags for incident #<incident ID> preset are sorted in descending order of their deviation from expected (normal) behavior. The tag with the greatest deviation from the predicted value is displayed in the incidents table under Incidents. The incidents table also indicates the prediction error threshold and the actual prediction error value at the moment when the incident was registered.
Information obtained when viewing the Tags for incident #<incident ID> preset is not actually diagnostic information for the purposes of identifying the causes of an incident, but you can still use this information when analyzing the values of tags with the largest deviations in behavior. The tag whose behavior was the first to deviate from the norm and caused subsequent deviations in other tags is referred to as the causal tag. In some cases, the causal tag may not be at the top of the list in the Tags for incident #<incident ID> preset and may even be entirely absent from this preset. This could happen due to the following reasons:
- Minor amplitude changes in the behavior of the causal tag had a multiplier effect and caused significant deviations in other tags that were included in the Tags for incident #<incident ID> preset.
- The causal tag is not analyzed by the ML model, and Kaspersky MLAD registers derivative changes in the behavior of tags caused by the deviation of the causal tag.
- Changes in the behavior of the causal tag had a delayed effect, and by the time an anomaly occurred in the operation of the monitored asset, the behavior of the causal tag returned to normal.
About incidents detected by an ML model element based on a diagnostic rule
An ML model can include one or more elements based on diagnostic rules. Each diagnostic rule results in the following values being obtained that are calculated at each point in time:
- Value
0. The diagnostic rule was not triggered or applied at this moment. - Value
1. The diagnostic rule was triggered at this moment. - Intermediate values from
0to1are possible in individual cases. The diagnostic rule was partially triggered at this moment.
Once the result surpasses the threshold set for the diagnostic rule, which is generally equal to one, the element based on the diagnostic rule records an event. For each incident registered by the diagnostic rule, Kaspersky MLAD automatically creates a Tags for incident #<incident ID> preset. This preset can be selected under History when you click the incident date and time in the incidents table. This preset contains the value obtained as a result of the work of the diagnostic rule, as well as the tags included in this rule.
Page topAbout incidents detected by an ML model element based on an elliptic envelope
An ML model elliptic envelope is trained on a specific subset of tags, and it can detect outliers (anomalies) in a dataset. The training of the ML model creates an elliptical region within the phase space. Any data points that fall within this ellipse are considered normal. When states are detected that are a distance from the center of the elliptical region equal to or greater than the predetermined threshold, the element based on the elliptic envelope registers an incident. In the model element parameters, you can view which tags are parsed by the element (Input tags).
The most relevant tags are automatically defined for every incident registered by an element based on an elliptic envelope. These are tags whose removal from the ML model causes the least deviation from the normal state. These tags generate a Tags for incident #<incident ID> preset. The preset can be selected under History when you click the incident date and time in the incidents table. Tags that are included in the Tags for incident #<incident ID> preset are sorted in descending order of their deviation from expected (normal) behavior. The tag with the greatest impact on incident registration is displayed in the incidents table under Incidents.
An ML model may include one or more elements running in parallel. In the History and Monitoring sections, you can select a specific element of the ML model to display the incidents registered as a result of a specific model element operation. The graph of the ML model element artifact shows registered incidents as colored dots at the bottom.
Page topAbout incidents detected by the Limit Detector
If the Limit Detector is enabled, Kaspersky MLAD automatically monitors all tags having blocking thresholds specified for the tag when using any ML model. Blocking thresholds can be defined in a tag configuration imported into Kaspersky MLAD at the start of operations. You can edit the tag blocking thresholds in the application's web interface.
To visually monitor the position of a tag graph relative to the blocking thresholds in individual graphic areas under History and Monitoring, you can turn on Blocking threshold and Always display blocking threshold. If Always display blocking threshold is disabled, the upper or lower threshold line is displayed only if the tag values have reached the corresponding threshold during the time interval displayed on the screen. The Limit Detector identifies and registers events regardless of whether or not the Always display blocking threshold option is enabled.
When the tag value reaches its upper or lower technical limit, the Limit Detector registers an incident. This tag is displayed in the incidents table in the Incidents section. The incidents table also shows the blocking thresholds of the tag and the actual value of a tag that violated one of these limits. For each incident registered by Limit Detector, Kaspersky MLAD automatically creates a Tags for incident #<incident ID>. This preset can be selected under History when you click the incident date and time in the incidents table. This preset includes the only causal tag of the incident.
Page topAbout incidents detected by the Stream Processor service
The Stream Processor service gathers real-time telemetry data received from the monitored asset at arbitrary points in time and converts this data to a uniform temporal grid (UTG). When analyzing incoming data, the Stream Processor service can detect losses of telemetry data and observations that were received by Kaspersky MLAD too early or too late. The Stream Processor service registers an incident in such cases.
Incidents detected by the Stream Processor service are displayed in the incidents table of the Incidents section. Each incident registered by the Stream Processor service is automatically assigned one of the following incident types:
- No data – input data stream for a specific tag was terminated or interrupted.
- Clock malfunction – observations received by Kaspersky MLAD too early are detected.
- Late receipt of observation – observations received by Kaspersky MLAD too late are detected.
The Stream Processor service transfers the UTG-converted data to the ML model of the Anomaly Detector service.
Page topAbout anomalies
An anomaly is any deviation in a monitored asset's behavior that is abnormal, not provided for by the current work procedure, and not normally caused by the industrial process.
Kaspersky MLAD registers only incidents. A specific incident can be identified as an anomaly only by an ICS specialist after conducting an analysis of incidents registered by the application. An incident analysis may result in one of the following conclusions:
- The incident is an anomaly that requires certain actions from a responding ICS specialist.
- The incident is not actually an anomaly, but instead was a false positive by the ML model.
If an ML model consistently produces false positive results, you need to find out what is causing the decline in performance, adjust the settings of the ML model and/or its elements, or further train the elements.
- The ML model worked correctly, but the incident is not an anomaly.
The incident was a result of temporarily switching the monitored asset to a non-standard operating mode (preventative maintenance or testing) or was caused by short-term impacts from non-standard external factors (unusual weather conditions or startup of a neighboring unit). The ICS operator does not need to take any response action.
Incidents are analyzed and assessed by a subject-matter expert. In some cases, like when registering incidents detected by diagnostic rules or incidents that occur repeatedly, similar incidents can be automatically grouped and assessed.
The ML model might miss a real anomaly. In this case, the anomaly will not be correlated to any registered incidents and will not be reflected in the Kaspersky MLAD history. If observations from an expert, an ICS operator, or external sources reveal repeated instances of an ML model failing to activate, you need to identify the cause of the decline in performance, adjust the settings of the ML model and/or its elements, and further train the elements of the ML model.
New events, patterns, and values of the event parameters detected by the Event Processor service in the stream of incoming events can also indicate an anomaly in the operation of a monitored asset. When new events, patterns or values of event parameters are detected, the Event Processor service does not register incidents. To view new detections in the Event Processor section, you can view the history of registered patterns, filtering them by the New type. You can also create a monitor for tracking new events, patterns, or values of event parameters. The Event Processor service activates the monitor when it detects events, patterns, or event parameter values that match the specified search criteria. When the specified threshold for the number of monitor activations in a sliding window is reached, the Event Processor service sends an alert about the monitor activation to the external system using the CEF Connector.
Page topScenario: analysis of incidents
This section describes the sequence of actions required when analyzing incidents registered by Kaspersky MLAD.
The functionality is available after a license key is added.
The incident analysis scenario described in this section is not a precisely regulated procedure. The specific scope and sequence of actions taken to investigate an incident and identify its cause depend on the particular subject area, the knowledge level of the process engineer or ICS expert investigating the incident, and the availability of additional information on the monitored asset.
The incident analysis scenario consists of the following steps:
- Viewing information about a registered incident
The Incidents section displays all incidents registered by Kaspersky MLAD, and provides detailed information about their registration time, the ML model that registered the incident, and an expert opinion if one was added. You can proceed to view incident information in one of the following ways:
- Viewing the latest incidents in the Dashboard section
If you want to view a recently detected incident, in the Dashboard section, click the date and time of the relevant incident in the Latest incidents table. In the History section that opens, in the lower part of the page, click the dot indicator in the artifact graph section to view a specific incident. The Incidents section opens showing only the incidents that were registered in the specific time interval represented by the selected dot indicator (the interval is displayed above the incidents table).
- Viewing incidents in the Incidents section
If you know the date and time when an incident was registered, select the corresponding incident in the Incidents section. You can change the time interval for the displayed incidents by using the bar graph or the date selection field in the upper part of the page.
- Navigating from an incident notification received by email
If an incident notification was created for you, you will receive the notification by email when an incident is registered. The email message contains the time when the incident began, the top tag, and a link to proceed to the History section in the Kaspersky MLAD web interface. You can use this link to proceed to the start of the incident in the History section. At the bottom of the History page, click the dot indicator that corresponds to the incident start time. The Incidents section opens showing only the incidents that were registered in the specific time interval represented by the selected dot indicator (the interval is displayed above the incidents table).
When you find a record about the required incident, click the
 button to view detailed information about the incident.
 - Viewing the latest incidents in the Dashboard section
- Viewing information about similar incidents
When two or more similar incidents are detected, Kaspersky MLAD automatically combines them into a group. In the incidents table in the Incidents section, the group associated with the incident is displayed in the Incident group column. If nothing is indicated for the selected incident in this column, this means that Kaspersky MLAD has not yet detected incidents similar to this particular incident.
To view all incidents in a group, select the Groups tab and click the
button next to the relevant group. The table displays information about the incidents assigned to the selected group, as well as an expert opinion if it was added. Read the expert opinions for individual incidents and for the group. - Studying the behavior of the monitored asset at the moment when an incident was detected
Study the behavior of the monitored asset at the moment when the incident was detected.
- Analyzing the incident
Analyze the incident while considering the specific details of incident registration depending on the type of the source that registered the incident:
- Forecaster. A predictive element of the ML model registers incidents when there is a significant discrepancy between observed (actual) tag values and predicted tag values. Based on information obtained when viewing the automatically generated Tags for incident #<incident ID> preset and considering the available expert knowledge on the monitored object, form a hypothesis regarding which tags could have caused the anomaly and select the appropriate preset after studying their behavior. Analyze the graph of the ML model element artifact, move back in time from the moment the prediction error threshold was reached, and examine the behavior of tags at the moment when the prediction error values started to grow.
- Rule Detector. For each incident registered by an ML model element based on a diagnostic rule, the application automatically creates the Tags for incident #<incident ID> preset, which includes the value obtained as a result of the diagnostic rule operation and which caused the incident registration.
- Elliptic envelope. An ML model elliptic envelope records incidents whenever it detects states that are a distance from the center of the normal state cluster equal to or greater than a predefined threshold. When registering an incident, the application generates a Tags for incident #<incident ID> preset that includes the tags whose exclusion from the ML model results in the smallest deviation of observations from the normal state. Analyze the graph of the ML model element artifact, move back in time from the moment the threshold was reached, and examine the behavior of tags at the moment when the deviation started to grow.
- Limit Detector. For each incident that was registered by the Limit Detector, the application automatically creates the Tags for incident #<incident ID> preset, which includes a single causal tag for the incident.
- Stream Processor. The Stream Processor service registers incidents up until telemetry data is transmitted to the ML model for processing. Incidents are registered if data loss is detected or if observations are received by Kaspersky MLAD too early or too late.
- Adding a status, cause, expert opinion or note to an incident or its incident group
For each incident, add an expert opinion or note in which you can specify whether the incident is an anomaly. An expert opinion and note for an incident are displayed only when viewing a specific incident. If necessary, you can specify the status and cause of an incident. The cause of an incident is displayed in the incidents table and when viewing a specific incident. You can also add or edit the status and expert opinion for a group of incidents.
If you know in advance the expert opinion, cause, and/or status of incidents registered by a specific ML model element, you can enter that information in the element parameters. The expert opinion, reason, and/or status will be automatically assigned to incidents at the time of their registration by the element.
Viewing incidents
The functionality is available after a license key is added.
To view incidents that were registered during a specific period:
- In the main menu, select the Incidents section.
- In the upper part of the opened page, select the start and end dates of the period.
By clicking a bar in the bar chart, you can also refine the time period for which incidents are displayed. The column can represent a month, week, or day, depending on the length of the period set above the chart.
- If necessary, filter incidents according to the top tag names, incident groups, statuses as well as causes, names and statuses of the ML models that registered the incidents by selecting the values from the appropriate drop-down lists.
The table located in the central area of the page shows the incidents registered during a specific period according to the specified filtering criteria. When you click the Reset button, the table and the bar graph show all registered incidents.
The following information is displayed for each incident in the table:
- ID refers to the ID of the registered incident.
- Date and time refers to the date and time when the incident was registered.
Clicking the incident registration date and time opens the History section, where you can view information about the Tags for incident #<incident ID> preset generated for the registered incident.
- Top tag name is the name of the process parameter that had the greatest impact on incident registration.
- Incident cause refers to the cause of the registered incident as entered by an expert (ICS process engineer or operator) as a result of an incident analysis or assigned automatically according to the incident cause specified for the ML model element that registered the incident.
- Model name refers to the name of the ML model whose element registered the incident. This is absent if the incident was registered by Stream Processor.
- Detector refers to the type of the registered incident: Elliptic Envelope, Forecaster, Limit Detector, Rule Detector, or Stream Processor.
- Incident group refers to the name of the incident group to which the registered incident belongs.
If two or more similar incidents are detected, they are combined into a group that is created automatically by using the Similar Anomaly service. You can view incidents that belong to a particular group by selecting the group name from the Incident group drop-down list above the incidents table.
- Incident status refers to the status of the registered incident as entered by an expert (ICS process engineer or operator) as a result of an incident analysis or assigned automatically according to the incident status specified for the ML model element that registered the incident.
You can set the incident status based on analysis results by selecting the appropriate value from the drop-down list. After installation of Kaspersky MLAD, the following statuses of incidents and incident groups are available by default: Under review, Decision pending, Instructions issued, Problem closed, Cause unknown, Ignore and False positive. If necessary, the system administrator can create, edit, or delete statuses of incidents.
Viewing the technical specifications of a registered incident
The functionality is available after a license key is added.
In the Incidents section, you can view the technical specifications of registered incidents. To do so, click the ![]() button near the relevant incident in the incidents table. The following technical specifications will be displayed for the selected incident:
button near the relevant incident in the incidents table. The following technical specifications will be displayed for the selected incident:
- Incident is the section containing information about the incident.
- Top tag is a section that contains information about the tag that had the greatest impact on incident registration.
- Stream Processor service incident parameters is a section containing information about the parameters of the incident registered by the Stream Processor service. This group of parameters is displayed if the current incident is registered by the Stream Processor service.
- Incident cause is the field for selecting the cause of the incident. This field is completed by an expert (process engineer or ICS specialist). If necessary, the system administrator can create, edit, or delete causes of incidents.
An incident cause can be assigned automatically if a cause is specified in the parameters of the ML model element that registered the incident.
- Expert opinion is the field for adding an expert opinion based on an analysis of the registered incident. This field is completed by an expert (process engineer or ICS specialist).
An expert opinion can be assigned automatically if an opinion is specified in the parameters of the ML model element that registered the incident.
- Note is the field for entering a comment for the selected incident. If necessary, you can provide a comment for the incident.
Viewing incident groups
When two or more similar incidents are detected, Kaspersky MLAD automatically combines them into a group (using the Similar Anomaly service). This lets you analyze incidents with consideration of prior history and expert opinions that were generated for similar incidents. In the incidents table in the Incidents section, the group associated with the incident is displayed in the Incident group column. If nothing is indicated for the incident in this column, this means that Kaspersky MLAD has not yet detected incidents similar to this particular incident. Incidents can be regrouped, and the expert opinions that were added to these incidents are migrated to the new group. The group name is automatically assigned in the format Group #N (N is replaced by the sequence number of the group). If necessary, you can edit a group name.
The functionality is available after a license key is added.
To view incident groups:
In the main menu, select the Incidents section and select the Groups tab.
All incident groups for your monitored asset are displayed in the table located in the central part of the page.
The following information is displayed for each incident group in the table:
- ID is the incident group identifier.
- Group name refers to the name of the incident group.
- Expert opinion is a conclusion added by an expert (process engineer or ICS specialist) based on an analysis of the group of registered incidents.
- Incident count refers to the number of registered incidents included in the group.
You can proceed to view incidents of the group by clicking its incidents count.
- Date and time refers to the date and time when the incident group was created.
- Status refers to the status of the registered incidents in the group as entered by an expert (ICS process engineer or operator) as a result of an incident analysis or assigned to the incidents automatically according to the incident status specified for the ML model elements that registered the incidents.
You can set the incident group status based on analysis results by selecting the appropriate value from the drop-down list. After installation of Kaspersky MLAD, the following statuses of incidents and incident groups are available by default: Under review, Decision pending, Instructions issued, Problem closed, Cause unknown, Ignore and False positive. If necessary, the system administrator can create, edit, or delete statuses of incidents.
To view detailed information about an incident group:
- Click the button near the incident group.
A list of incidents in this group is displayed. The following technical specifications are displayed for each incident of the group:
- Incident date is the date and time when the incident was registered.
You can go to the History section by clicking the incident registration date.
- Top tag name is the name of the tag that had the greatest impact on incident registration.
- Top tag value is the value of the tag that had the greatest impact on incident registration.
- Relevant tags refers to a table that contains the identifiers of tags that influenced the identification of similar incidents and merging of these incidents into a group.
- Incident date is the date and time when the incident was registered.
- If you need to view the degree of influence a tag had on the formation of similar incidents, click the Relevant tags table cell containing the identifier of the relevant tag.
All table cells containing the selected tag ID are highlighted in green. The closer the green-highlighted cells containing the ID of the selected tag are to the first table column, the more impact that tag has when identifying and grouping similar incidents.
You can also add a status and expert opinion for the incident group.
Page topStudying the behavior of the monitored asset at the moment when an incident was detected
This section describes the sequence of actions required when studying the behavior of a monitored asset at the moment when an incident was detected.
The functionality is available after a license key is added.
Studying the behavior of a monitored asset consists of the following steps:
- Viewing the history of tags received for a monitored asset in the History section
You can proceed to view incident information in one of the following ways:
- If you want to view a recently detected incident, in the Dashboard section, click the date and time of the relevant incident in the Latest incidents table.
- In the Incidents section, click the date and time of the relevant incident in the incidents table.
- If an incident notification was created for you, you can proceed to view the incident by clicking the link from the email notification. The email message contains the time when the incident began, the top tag, and a link to proceed to the History section in the Kaspersky MLAD web interface.
In the History section, Kaspersky MLAD displays graphs of tags received from the monitored asset for which the selected incident was registered. The graphs display data for the Tags for incident #<incident identifier> preset, generated for the date and time when the selected incident was registered. This preset includes the tags whose behavior led to incident registration. Depending on the type of the source that registered an incident, this may involve the following tags:
- The tags for which the actual values showed the greatest deviations from the ML model's forecast, given that the incident was registered by the ML model predictive element.
- Tags included in a diagnostic rule and the value obtained as a result of the operation of this rule, if the incident was registered by the ML model element based on the diagnostic rule
- The tags whose removal from the ML model results in the least deviations of observations from the normal state, given that the incident was detected by the ML model element based on the elliptic envelope.
- A tag whose value was outside of the set blocking thresholds, if the incident was registered by the Limit Detector.
If necessary, you can select a different preset for displaying data received from the monitored asset at the moment when the incident was registered. The graph uses a vertical blue dashed line to indicate the date and time when the incident was registered.
Example tag graphs for a registered incident under History.
The tag graphs are displayed in the upper part of the History section. The graph of the ML model element artifact is displayed in the lower part of the History section.
Tag graphs in the History section
- Configuring how data is displayed on graphs in the History section
Under History, you can turn on the display of predicted tag values generated by the predictive elements of the ML model. This lets you assess the difference between actual tag values and predicted tag values. Hovering over a tag graph displays tag details, such as the name, description, date and time when it was observed, value, and unit of measurement. You can also enable display of the tag name and description on the left of each tag graph.
- Configuring the time settings for displaying data in the History section
When studying the behavior of tags, you can change the scale of the time axis or move forward or backward in time through graphs. When displaying shorter time intervals on tag graphs, the History section may show more details of the behavior of tags that had been averaged when tag graphs for a longer period were displayed.
- Changing the vertical boundaries for displaying data in the History section
When displaying single graphic areas, the default vertical scale of the graph is automatically determined according to the minimum and maximum tag values within the displayed area. If minimum and maximum permissible values (blocking thresholds) are defined for a tag, you can control graph scale along the vertical axis by enabling Always display blocking threshold. If a tag value is within the permissible range, the vertical scale of the graph will be fixed by limit lines derived from the lower and upper thresholds of the tag graph. If the tag values go beyond the specified blocking thresholds, the vertical scale will be automatically changed to display the tag values exceeding the thresholds.
If graphic areas are displayed for several tags, you can adjust their vertical scale by using the parameters of the corresponding graphic area, which you can set when editing the selected preset.
Adding a status, cause, expert opinion or note to an incident or incident group
Kaspersky MLAD lets you add an expert opinion or note to a registered incident.
The functionality is available after a license key is added.
An expert opinion is normally added by an expert (process engineer or ICS specialist) and may contain an incident analysis or recommendations on resolving a problem that is indicated by an identified incident. An expert opinion can be added to an individual incident or to a group of incidents. If expert opinions were previously added to incidents that are later put into a group, these opinions will also be displayed in the group (linked to each specific incident). When incidents are regrouped, the expert opinion for an incident migrates together with the incident to the new group.
Notes are intended to aid discussions between experts or operators of facilities regarding recommended actions for analysis, investigation, and remediation of an incident. Each note includes information stating who added the note and when it was added.
You can also add the cause of the incident and the incident status determined by the expert based on the incident analysis results. A status can be assigned to an individual incident or to a group of incidents. When changing the status of a group of incidents, Kaspersky MLAD changes the status of the incidents that are part of this group. The status of an incident also affects whether a dot indicator for it will be displayed under Monitoring and History and whether an incident notification with this status will be sent. If the Notify about an incident check box is cleared for the incident status, the incident dot indicators to which this status was assigned automatically will not be displayed under Monitoring or History, and no email notifications about incidents will be sent. An incident status can be assigned automatically in one of the following cases:
- If the incident was automatically assigned to a group with that status.
- If the incident is registered by an ML model element that sets that incident status by default.
For the Problem closed and Ignore statuses, the Notify about an incident check box is cleared by default. If during registration, incidents are automatically assigned one of these statuses in accordance with the status specified for the ML model element that registered this incident, notifications about these incidents will not be sent.
If you know in advance the expert opinion, cause, and/or status of incidents registered by a specific ML model element, you can enter that information in the element parameters. The expert opinion, reason, and/or status will be automatically assigned to incidents at the time of their registration by the element.
Before adding a cause, status, note or expert opinion, you must conduct an analysis of the registered incident.
To add an expert opinion, status, cause, or note to an incident:
- In the main menu, select the Incidents section.
- If necessary, change the incident status by selecting one of the following statuses from the Incident status drop-down list: Under review, Decision pending, Instructions issued, Problem closed, Cause unknown, Ignore, or False positive.
By default, an incident is assigned the Unknown status. If necessary, the system administrator can create, edit, or delete statuses of incidents.
- To display detailed technical specifications of an incident, click the button near the relevant incident. In the details area that opens, you can do the following:
- If you need to add the cause of an incident, use the Incident cause field to select the cause of the incident.
If necessary, the system administrator can create, edit, or delete causes of incidents.
- If you need to add an expert opinion based on an analysis of a registered incident, click the
 button on the right of the Expert opinion field, enter the opinion in the opened field and press ENTER.
The expert opinion will be added to the selected incident and will appear in the incidents table in the Incidents section.
- If you need to add a note to an incident, enter your message in the Note field and click the Add note button.
You can provide a message up to 512 characters long.
- If you need to add the cause of an incident, use the Incident cause field to select the cause of the incident.
The status, cause, expert opinion, and note will be added to the incident and will be available to other users when viewing this incident.
When two or more similar incidents are detected, Kaspersky MLAD automatically combines them into a group. The group name is also automatically assigned in the format Group #N (N is replaced by the sequence number of the group). You can edit the group name, change the status of an incident group, and edit the expert opinion containing recommendations for analyzing similar events, for example.
To add a status and expert opinion to a group of incidents:
- In the main menu, select the Incidents section and click Groups.
- If necessary, change the incident group status by selecting one of the following statuses from the Status drop-down list: Under review, Decision pending, Instructions issued, Problem closed, Cause unknown, Ignore, or False positive.
When changing the status of a group of incidents, Kaspersky MLAD changes the status of the incidents that are part of this group. By default, a group of incidents is assigned the Unknown status.
If necessary, the system administrator can create, edit, or delete statuses of incidents.
- In the incident groups table, double-click the row of the incident group.
The Edit group window opens.
- To change the name of the incident group, enter a new name for the group in the Group name field.
- In the Expert opinion field, enter the text of the expert opinion (for example, recommendations for analyzing similar incidents).
- Click the Save button.
The status and expert opinion will be changed for the incident group and can now be viewed by other users in the Groups table in the Incidents section.
Page topExporting incidents to a file
Incidents registered for a specific period in Kaspersky MLAD can be exported to an XLSX file.
The functionality is available after a license key is added.
To save incidents registered for a specific period to a file:
- In the main menu, select the Incidents section.
- In the upper part of the opened page, select the start and end dates of the period.
- Click the Export button.
- Select a directory to save on your local drive, and save the file.
Incidents registered for the selected period in Kaspersky MLAD will be saved to an XLSX file on the local drive. The XLSX file can be opened in Microsoft Excel.
Page topManaging ML models
This section provides instructions on working with ML models, ML model templates and markups.
The functionality is available after a license key is added.
ML models, templates of ML models and markups are functional elements of the monitored asset hierarchical structure. The hierarchical structure is displayed as an
.In Kaspersky MLAD, ML models can be imported, created manually, copied, or created based on a template. If you created the ML model manually, cloned a manually created model, or created the model from a template based on a manually created model, you can add predictive elements, elliptic envelope-based elements, and/or diagnostic rule-based elements to the new model.
After training the ML model elements and checking the results of their training, you can run historical or streaming inference on the ML model. As a result of inference, ML model elements register incidents and also generate artifacts that can be viewed under Monitoring and History.
You can publish the ML model if needed. You can run historical or streaming inference on a published ML model.
In the Models section, you can create markups for generating
or . If necessary, you can edit, clone, or delete markups.About ML-models
An ML model is an algorithm based on machine learning methods tasked with analyzing the telemetry of the monitored asset and detecting anomalies.
An ML model is created for a specific monitored asset while taking into account the specifications of the asset and the characteristics of telemetry data. The general structure of the algorithm (architecture) is formed during creation of the ML model. Then the ML model is trained based on historical telemetry data and is thereby adjusted to the behavior of a specific object.
An ML model consists of one or more elements, with each separately analyzing telemetry data to detect anomalies. Normally, the more complex the industrial processes of the monitored asset are, the more elements the ML model will contain. An ML model can include the following elements operating in parallel:
Predictive elements and elements based on elliptic envelopes need to be trained on a dataset. A predictive element learning process may consist of one or several epochs. An epoch is a cycle during which an element is trained on the entire training dataset. The number of training epochs is specified in the element training settings. Elements based on a diagnostic rule do not need to be trained, so they are considered to be pretrained.
The process of using an ML model to analyze telemetry data and detect anomalies is known as inference. In Kaspersky MLAD, ML model inference can be performed on historical data (historical inference) and on telemetry data received in real time (streaming inference). If historical inference is started for multiple ML models, Kaspersky MLAD runs the inference of these ML models in the order of their startup queue. The duration of historical inference is determined by the time interval of the data analyzed by the ML model. If streaming inference is started for multiple ML models, Kaspersky MLAD runs the inference of these ML models simultaneously. Historical inference and streaming inference run in parallel and independently of each other. During the inference process, the ML model registers incidents that can be viewed in the Incidents section.
In addition to incidents, an ML model inference process also generates artifacts. An artifact is a time series of numerical data. An ML model can generate the following artifacts:
- Artifacts associated with tags. An ML model element generates these artifacts for each of its output tags. These artifacts are generated only by the predictive elements of the ML model and represent a predicted tag value and prediction error.
- Artifacts of ML model elements. Each ML model element generates this type of artifact as its primary output. The mathematical nature of an artifact is determined by the analytical algorithms employed by the element. In this context, an artifact for an ML model of any type is uniformly interpreted as the degree to which the behavior of the monitored asset deviates from the expected (normal) behavior. Every artifact has a critical threshold. If this threshold is reached, an incident is recorded.
Any user can view generated artifacts under Monitoring and History.
ML models can be created by Kaspersky specialists or by a certified integrator as part of the Kaspersky MLAD Model-building and Deployment Service. To use such ML models, you must import them to Kaspersky MLAD. You can also create ML models independently and add the necessary elements to them using the model builder.
About predictive ML model elements
Predictive ML model elements predict the behavior of an object from data on its recent behavior. Predictive ML model elements include neural network elements and linear regression-based elements.
Kaspersky MLAD model builder supports the following architectures for ML model predictive elements:
- Dense. Neural network element of an ML model with a fully connected architecture. When creating an ML model element, you must specify the multipliers for calculating the number of neurons on inner layers and the activation functions on them.
- TCN. Neural network element of an ML model with a hierarchical time-based convolutional architecture. When creating an ML model element, you must specify the filter size and number, extensions on layers, activation functions on them and the number of layers in the residual block.
- CNN. Neural network element of an ML model with a convolutional architecture. When creating an ML model element, you must specify the number of neurons on the layers of encoder, the size and number of filters on layers, and the size of the maximum sampling window (MaxPooling).
- RNN. Neural network element of an ML model with a recurrent architecture. When creating an ML model element, you must specify the number of GRU neurons on layers and the number of time-distributed neurons on the layers of the decoder.
- Transformer. Neural network element of an ML model with a transformer architecture. When creating an element of the ML model, the number of attention heads and the number of transformer encoders are specified.
- Linear regression. Element of an ML model based on linear regression.
A predictive element of an ML model generates the following artifacts as a result of inference:
- Predicted tag values. These are displayed in the central part of the Monitoring and History sections on individual graphic areas of the selected preset.
- Individual prediction errors are the differences between the predicted and actual values for each tag. These are displayed in the central part of the Monitoring and History sections on individual graphic areas of the selected preset.
- The total prediction error (cumulative prediction error) is the total discrepancy between the predicted and actual values. Cumulative prediction error and the cumulative prediction error threshold are displayed in the graphic area in the central part of the Monitoring and History sections after the graphic areas of the selected preset and on the ML model element artifact graph located at the bottom of the sections.
If the cumulative prediction error exceeds the cumulative prediction error threshold, predictive element of the ML model considers this a deviation in the behavior of the monitored asset and registers an incident.
About elements of an ML model based on a diagnostic rule
Diagnostic rules describe previously known behavioral traits of the monitored asset that are considered anomalies. Diagnostic rules must be formalized and calculated based on available telemetry data for the object.
Examples of diagnostic rules:
- The level of tag A has changed abruptly (criterion for the behavior of the Step change tag).
- Over the past 12 hours, tag B has trended upward, tag C has trended downward, and tag D has not shown any clear dynamics.
- The value of tag X fell below 2800 after it previously rose higher than 2900.
About elliptic envelope-based ML model elements
Elliptic envelopes are used to detect abnormal states of a monitored asset.
Unlike a predictive element, an elliptic envelope does not attempt to determine how the behavior of the ML model's input tags affects the behavior of its output tags. An elliptic envelope uses the assumption that the set of tags included in the ML model describes the state of the monitored asset at any given moment, and the observable states have a normal distribution (also known as a Gaussian distribution) in the phase space.
During training, the elliptic envelope adjusts the parameters of this normal distribution while considering that the training sample may contain a certain percentage of anomalous states. During the training of an ML model, an elliptical region is formed in the phase space. States that fall within this region are classified as normal, while all other states are categorized as outliers (anomalies). The farther a state is from the boundaries of the ellipse, the more anomalous it is. The tag whose value as part of the anomalous state contributed the most to the deviation from the ellipse is considered the top tag.
An elliptic envelope is simpler to construct than a predictive element, learns more quickly, and requires fewer resources for inference. However, an elliptic envelope only demonstrates good performance when applied to stationary equipment operating modes that do not involve multiple operating ranges or abrupt changes in tag values.
Page topAbout statuses and states of ML models and their elements
The statuses and states of ML models and their elements signify sequences of steps completed by the user under Models.
ML model elements can take the following statuses:
- Not trained. This status is assigned to an ML model element if training has not started or completed with an error. This status is also displayed for elements that were trained previously, but whose settings have been changed. The asset tree displays the
 icon to the left of the untrained element names.
 - Trained. This status is assigned to an ML model element if training has been successfully completed or if the element is not subject to training. The asset tree displays the
 icon to the left of the trained element names.
An ML model can be assigned one of the following statuses:
- Not activated. The ML model is imported but is not activated. The asset tree displays the
 icon to the left of the ML model name.
 - Not trained. The ML model activated or created manually. The ML model contains untrained elements. The asset tree displays the
 icon to the left of the ML model name.
 - Trained. All the elements in the ML model have been trained or no training is required. Inference can be run on a trained ML model. The asset tree displays the
 icon to the left of the ML model name.
 - Ready for publication. The ML model is ready for publishing and cannot be modified. The asset tree displays the
 icon to the left of the ML model name.
 - Published. The ML model is published. Inference can be run on a published ML model. The asset tree displays the
 icon to the left of the ML model name.
The states of ML models and their elements are displayed to the right of the ML model name when viewing a specific ML model, and in the asset tree. The table below lists the states of ML models and their elements in Kaspersky MLAD.
Statuses of ML models and elements of ML models
Name of the state when viewing the ML model |
Symbol of the state in the asset tree |
ML model |
ML model element |
Description |
Not used |
|
|
|
This state is assigned to an ML model unless inferenced or trained earlier, or if the model was viewed after inference or training finished. The asset tree does not display this status. |
Training completed with error |
TRN ERR |
|
|
This state is assigned to ML model elements whose training finished with an error. An ML model is also assigned this state if containing at least one element whose training finished with an error. After viewing the training results, the ML model is assigned a state of Not used. |
Training in progress |
TRN |
|
|
This status is assigned to an ML model element that is currently undergoing training. The model itself is assigned this status if it contains elements that are undergoing training and unless it contains any elements whose training completed with an error. |
Queued for training |
TRN Q |
|
|
An ML model element is assigned this state if the model has started learning, but the training is running for a different element. An ML model is assigned this state if all of its elements are queued for training. |
Training successfully completed |
TRN DONE |
|
|
This state is assigned to a successfully trained ML model element. An ML model is assigned this state if all of its elements have been successfully trained. After viewing the training results, the ML model is assigned a state of Not used. |
Historical inference in progress |
INFR HIST |
|
|
This state is assigned to an ML model running historical inference. You can view the inference results under History. Incidents logged during inference are displayed under Incidents. |
Queued for inference |
INFR Q |
|
|
This status is assigned to an ML model currently running historical inference, while a different model is currently running historical inference. |
Historical inference completed |
INFR DONE |
|
|
This state is assigned to an ML model that has finished historical inference. You can view the inference results under History. Incidents logged during inference are displayed under Incidents. An ML model is assigned a state of Not used after being viewed. |
Streaming inference in progress |
INFR STRM |
|
|
This state is assigned to the ML model running streaming inference. You can view the inference results under Monitoring. Incidents logged during inference are displayed under Incidents. |

About ML model templates
ML model templates are created on the basis of ML models previously added to Kaspersky MLAD or created using the model builder functionality. ML model templates preserve the algorithm structure, set of elements, and the state of the ML model used to create the template. The training state of the created ML model will match the training state of the source ML model when the template was created.
Using templates, you can add ML models of the same type to Kaspersky MLAD. These models will analyze data received from equipment of the same type with a similar set of tags. When creating an ML model from a template, you can configure the use of other tags in the ML model by specifying tag IDs that differ from the ones in the source ML model.
Page topAbout markups
Markup is the tool for selecting time intervals. Markups are used to generate learning indicators and
of the ML model. Markups that form part of learning indicators define the data time intervals from which the ML model takes data for training. Markups that form part of inference indicators define the time intervals during which the ML model performs the inference.A markup may utilize two types of criteria: conditions on the behavior of specific tags (time intervals are selected where these conditions are met) and a time filter (time intervals are selected independently of tag behavior).
Markup is a functional element of the hierarchical structure. Markups can be created manually or imported into Kaspersky MLAD together with an ML model.
Page topAbout conditions included in markups and diagnostic rules
The selection of data time intervals for learning or inference indicators in the markup, and the execution of a diagnostic rule in the ML model are governed by the conditions that are set when creating a markup and/or ML model element based on a diagnostic rule. While creating a markup or an ML model element based on a diagnostic rule, you can specify the following condition types:
- Time filter.
The time filter defines a sequence of recurring calendar intervals, such as an interval that considers the number of business days in a week and work hours, or a set of intervals with precisely defined start and end times.
In the absence of defined tag behavior conditions, the filtered intervals will be a product of the markup or a diagnostic rule. The rule will be considered fulfilled at all UTG nodes within the selected intervals.
- Tag behavior conditions.
The tag behavior conditions are checked at the UTG nodes that fall within the time intervals selected by the filter. Without time filtering enabled, tag behavior conditions are evaluated at all UTG nodes.
Tag behavior criteria are described in condition blocks and linked by the logical operators AND and/or OR. The operator AND tracks the simultaneous fulfillment of all related criteria, and the operator OR tracks the fulfillment of at least one linked criterion. The negation operator NOT can be applied individually to the criteria in the condition block to track behavior opposite to that described in the criterion. Condition blocks themselves can also be linked with the logical operators AND and/or OR.
Evaluating any condition yields one of three possible outcomes:
- Positive (TRUE) if the condition is met. If the criteria are linked by the logical operator OR and the evaluation of the criteria resulted in TRUE and UNDEFINED, then the evaluation of the entire condition block will yield a positive result.
- Negative (FALSE) if the condition is not met.
- Undefined (UNDEFINED) if it is impossible to check if the condition was met (for example, when there is not enough data). Evaluation of the entire block of conditions produces an undefined result in the following cases:
- If the criteria within the block of conditions are connected by the logical operator OR and the evaluation of individual criteria produced FALSE and UNDEFINED.
- If the criteria within the block of conditions are connected by the logical operator AND and the evaluation of individual criteria produced UNDEFINED and/or FALSE.
You can link two condition blocks with the temporal operators Wait or If ahead if required. The condition block that precedes the temporal operator is called a precondition. The condition block that follows the temporal operator is called a post-condition. Unlike the logical operators AND and OR, which require simultaneous evaluation of conditions, the temporal operator connects blocks of conditions that are evaluated at different points in time.
A precondition is evaluated at one UTG node. A postcondition is evaluated at one or more consecutive UTG nodes. The interval between the pre-condition check node and the node where the post-condition is checked corresponds to the waiting interval. The post-condition check is controlled with the following settings:
- Minimum waiting interval is the interval between the pre-condition check node and the UTG node where the post-condition check will start.
- Maximum waiting interval is the interval between the pre-condition check node and the UTG node where the post-condition check will finish.
- A group operator that specifies whether the postcondition needs to hold at every postcondition check node or at just one.
A FALSE or UNDEFINED result of a precondition check causes the entire temporal operator to return the same value. If the pre-condition check evaluates to TRUE, then the post-condition check is performed at each UTG node between the minimum and maximum wait intervals. The result of applying the temporal operator is determined by the results of the post-condition checks and considers the value of the group operator.
If more than one condition check is performed with the temporal operator, then the output of the previous temporal operator is a precondition for each subsequent temporal operator.
The result of applying the temporal operator If ahead is generated at the precondition check node. The temporal operator If ahead can only serve as a training indicator component, as it requires future data, which is not yet available during the inference process.
The result of applying the temporal operator Wait is generated in the last UTG node of the post-condition check. Since all nodes involved in the operator are in the past at this point, the Wait operator can be used as part of both a training indicator and an inference indicator.
The overall result of evaluating all markup conditions or a diagnostic rule can be either TRUE or FALSE. If a UTG node produces an UNDEFINED result when evaluating all specified tag behavior conditions, the overall outcome of applying markup or diagnostic rule for that node is determined by the Treat inconclusive result as positive setting.
Scenario: working with ML models
This section describes the sequence of actions required to work with ML models.
The functionality is available after a license key is added.
The scenario for working with ML models consists of the following steps:
- Adding markups
If you need to select specific time intervals for the data that ML models must use for training or inference, create markups.
- Adding an ML model
You can add an ML model to Kaspersky MLAD in one of the following ways:
- Import an ML model created by Kaspersky specialists or by a certified integrator as part of the Kaspersky MLAD Model-building and Deployment Service. If the ML model uses markups, they will be incorporated into the same asset as the model itself. After an ML model is imported, it must be activated.
- Manually create an ML model. Add predictive elements, elliptic envelope-based elements, and/or diagnostic rules-based elements to the new ML model.
- Create an ML model from a template. Create a template based on the relevant ML model in advance. If the original ML model used for the template was created manually, you can add predictive elements, elliptic envelope-based elements, and/or diagnostic rule-based elements to the new ML model.
- Clone a previously added ML model. After cloning an ML model that was created manually or from a template based on a manually created ML model, you can add predictive elements, elliptic envelope-based elements, and/or diagnostic rule-based elements to the new ML model.
- Training ML model elements
The ML model needs to be trained before you can run inference on it. To do this, all predictive elements and elliptic envelope-based elements within the ML model must be pretrained. ML model elements based on diagnostic rules do not need to be trained, so they are considered to be pretrained.
An ML model imported to Kaspersky MLAD has been previously trained by Kaspersky Lab experts or a certified integrator. ML models that are created from a template of an imported ML model or by cloning an imported ML model are also considered to be already trained. If necessary, you can change their training settings and retrain the elements.
To generate a learning indicator, specify the created markup in the element training settings.
After training the elements, examine the training results, adjust the training settings and retrain the elements, if necessary.
- ML model inference
Run a historical or streaming inference on the ML model. Examine the artifacts under History and Monitoring, and incidents inferenced by the ML model.
For better ML model performance, adjust the parameters of the model and/or markups. Re-train the elements of the ML model as needed. Run a repeat inference on the ML model. When restarting an inference on previously inferenced data, previous inference results will be deleted.
- Preparing an ML model for publication
If you need to save the parameters of an ML model and its elements, prepare the ML model for publication after completing training and checking the inference results.
- Publishing an ML model
After preparing the ML model for publication, notify the officer responsible for publishing the ML model that the ML model is ready, or publish the ML model if you have the required permissions. If necessary, the system administrator can create a role that has the right to publish ML models and assign this role to the relevant employee.
- Inferencing a published ML model
Start inference of the ML model. During the inference process, published ML model analyzes telemetry data and log incidents. Recorded incidents, unlike those inferred by unpublished ML models, necessitate actions and reporting in production.
Search and filter objects in the Models section
In the Models section of the asset tree, you can search for and filter the following objects:
- ML models
- ML model templates
- ML model elements
- Markups
- Assets
- Tags
The search is done by object name.
To find objects in the asset tree,
under Models, enter your search query into the Search field. The search is performed as you type characters in the search field.
Matching objects will be displayed in the tree, along with the asset tree sections where they were found.
To reset the search query, click ![]() in the search bar.
in the search bar.
You can filter objects within the asset tree. You can select object statuses and states for ML models and their elements.
Filtering is applied to objects that are found according to the search query. If no search query is defined, filtering is applied to all objects in the asset tree.
To filter objects within the asset tree:
- Under Models, click
 above the asset tree.
 The filter options will be displayed on the right.
- From the Section type drop-down list, select one or more asset tree section types.
You can select the following section types: Models, Model templates, Model elements, Markups, Assets, and Tags.
- If you have selected Models, do the following as needed:
- From the Model status drop-down list, select ML model statuses.
- From the Model state drop-down list, select the ML model states.
- If you have selected the Model elements section type, do the following as needed:
- From the Model element type drop-down list, select one or more ML model element types.
You can choose the following types of ML model elements: Predictive element, Rule, and Elliptic envelope.
- From the Model element status drop-down list, select ML model element statuses.
- In the Model state drop-down list, select the states of ML model elements.
- From the Model element type drop-down list, select one or more ML model element types.
- To reset the filter settings, do one of the following:
- To reset a specific filter setting, click next to the setting.
- To reset all filter settings, click Clear filters in the upper right corner of the window.
- To reset a specific filter setting, click
- To hide the filter settings, click
 next to the Search field.
Object filtering is performed as you select the filter criteria. If any objects match your filter criteria, the tree view will display those items, along with the corresponding categories where they were found.
If any filters are applied to the asset tree,  will appear above.
Working with markups
This section provides information on working with markups.
The functionality is available after a license key is added.
In the Models section, you can create, modify, and delete markups. If required, you can view the graph to see the data time intervals that the ML model will use for training and/or inference.
Markups are used as training or inference indicators to point to data time intervals that the ML model can use for training or inference. When creating or changing the parameters of an ML model, you can generate an inference indicator by selecting one or several previously created markups. When configuring the training parameters for ML model elements, you can generate a learning indicator by selecting one or more previously created markups.
Creating markup
You can use markup to generate learning indicators or inference of the ML model.
The functionality is available after a license key is added.
To create markup:
- In the main menu, select the Models section.
- In the asset tree, next to the name of the asset for which you want to create a markup, open the vertical menu
 and select Create markup.
A list of options appears on the right.
- Specify the name of the markup in the Name field.
- Enter a description for the markup in the Description field.
- In the Grid step (sec) field, specify a UTG period for markup in seconds expressed as a decimal.
- In the Markup color field, select a color that will be used to highlight data intervals selected by the markup.
- If necessary, turn on the Treat inconclusive result as positive toggle switch.
If Kaspersky MLAD cannot unequivocally evaluate the fulfillment of criteria specified in the Time filter and Tag conditions settings blocks, for example, due to the absence of observations for tags, the application will consider specified criteria to be fulfilled when this option is enabled.
- In the Time filter settings block, do one the following:
- To add an interval, click Add interval and select one of the following time interval types from the Interval type drop-down list:
- Fixed. If you select this type of interval, specify the days of the week and the time interval during which the input data must be validated according to the specified criteria.
- Recurrent. If you select this type of interval, specify the years, dates, days of the week, and daily time interval for periodically validating input data according to the specified criteria.
- To delete an interval, click to the right of the interval.
You can add one or more time intervals.
- To add an interval, click Add interval and select one of the following time interval types from the Interval type drop-down list:
- To add tag behavior criteria, do the following:
- In the Tag conditions settings block, click the Condition button.
- In the Tag drop-down list, select the tag for which to add a tag behavior criterion.
If you need to check the behavior directly opposite of the selected behavior criterion from the condition block, click the NOT button on the left of the selected tag. The NOT caption in the button will be highlighted in bold.
For example, click the NOT button if you need to add a condition that contains no steps with the specified settings.
- In the Behavior drop-down list, select one of the following tag behaviors that must be tracked:
- Over: the tag value exceeds the specified threshold.
- Below: the tag value falls below the specified threshold.
- Rising: the trendline of tag values is increasing.
- Falling: the trendline of tag values is decreasing.
- Level: there are no pronounced changes in the trendline of tag values.
- Step change: the trendline of the selected tag is displaying abrupt upward or downward shifts.
- Flat: the selected tag is transmitting the same value.
- Spread: abrupt changes in the spread of values are being observed around the trendline of the selected tag.
- In the Window field, specify an interval for analyzing the behavior of tags in the UTG steps.
- Depending on the value selected for Behavior, do one of the following:
- If you selected Over or Below, specify a tag threshold value in the Threshold field and specify the minimum number of times the threshold value can be breached within a window in the Minimum violations field.
- If you selected Rising, Falling, or Level, use the Threshold slope field to specify the trend slope percentage value that must be exceeded for the trend to be considered as growing or falling, and specify the time interval between adjacent trend estimates in the Evaluation period field.
By default, the Threshold slope setting is not defined. If the setting is not defined, Kaspersky MLAD will determine the trend direction automatically.
By default, the Evaluation period setting has a value of
1. With this value, the trend is estimated at each UTG node. - If you selected Spread, use the Minimum change field to specify the minimum value by which the tag value spread around the trendline can change, and select one of the following spread change directions in the Direction drop-down list: Any, Flare, or Shrink.
By default, the Minimum change setting is not defined. If the setting is not defined, Kaspersky MLAD will determine it automatically.
The tag behavior criterion is met when the tag spread around the trendline increases and/or decreases.
- If you selected Step change, use the Minimum change field to specify the minimum shift value for the tag trendline, and select one of the following tag value change directions from the Direction drop-down list: Any, Up or Down.
By default, the Minimum change setting is not defined. If the setting is not defined, Kaspersky MLAD will determine it automatically.
- If you selected Flat, use the Value field to specify the value that the tag should transmit, and specify the maximum tag value spread in the Spread field.
The Spread parameter is set to zero by default. With this value, any repeating tag value triggers the criterion.
- To add a tag behavior criterion to a condition block, click the plus sign at the bottom of the condition block and repeat steps 9b through 9e.
- If the block contains more than one tag behavior criterion, select one of the following logical operators between the criterion rows by clicking logical operator button:
- AND if you require all of the block criteria to be fulfilled at the same time.
- OR if at least one of the block criteria must be fulfilled.
- To delete a tag behavior criterion from a condition block, click in the row that contains the criterion.
- If you need to check whether the fulfillment of a pre-condition triggered the fulfillment of a post-condition, do the following:
- Add one of the following temporal operators:
- Wait if you need to generate the result of the criteria check in the last node of the maximum waiting interval.
- If ahead if you need to generate the result of the criteria check at the time of a pre-condition check.
The Wait and If ahead buttons are available after adding at least one condition.
Markup with an If ahead temporal operator can be used in learning indicators only.
- In the Recess (steps) field, specify the following time intervals:
- from is the interval between the pre-condition check node and the UTG node where the post-condition check will start (minimum waiting interval).
- to is the interval between the pre-condition check node and the UTG node where the post-condition check will finish (maximum waiting interval).
The post-condition is checked in the UTG nodes between the minimum and maximum waiting intervals.
- In the Check drop-down list, select one of the following group operators:
- If you require fulfillment of tag behavior criteria from the post-conditions in all UTG nodes between the minimum and maximum waiting intervals, select the All steps group operator.
- To require fulfillment of tag behavior criteria from the post-conditions in at least one UTG node between the minimum and maximum waiting intervals, select the Any step group operator.
If the Wait temporal operator is added, the criteria check result is determined in the last node of the maximum waiting interval. If more than one condition check is performed using the Wait temporal operator, the result of the previous temporal condition check is the precondition for each subsequent check of the Wait temporal condition.
If the If ahead temporal operator is added, the criteria check result is generated at the time of the precondition check.
- Add one of the following temporal operators:
- Select one of the following logical operators between markup blocks by clicking the logical operator button:
- AND if you require the criteria of both condition blocks to be fulfilled.
- OR if the criterion of at least one of the condition blocks must be fulfilled.
- In the upper-right corner of the window, click the Save button.
The new markup will be displayed in the Markups group of the asset tree. The Markups group is created automatically and displayed as part of the selected section of the asset tree.
Page topViewing the markup chart
After creating markup, you can view data time intervals selected by the markup on the graph.
The functionality is available after a license key is added.
To view the markup chart:
- In the main menu, select the Models section.
- In the asset tree, select the markup whose chart you want to view.
A list of options appears on the right.
- Click the On graph button.
A pane with the markup chart appears on the right.
- Select the relevant preset from the Preset drop-down list.
- If necessary, in the Markups field, select the markups for displaying data intervals.
- If you need to select a date and time for displaying the data, do one of the following:
- In the Graph center field, select the date and time for which you want to display data in the chart.
The vertical black dotted line will indicate the selected date and time (in the center of the chart).
- Click
 to the left of the time axis, and select the point on the time axis.
The selected point will become the new center of the graph. The vertical black dashed line will indicate the new date and time.
- In the Graph center field, select the date and time for which you want to display data in the chart.
- If you need to select a time interval for displaying data on the chart, do one of the following:
- If you need to display data for a fixed time interval, select the relevant time interval from the Scale drop-down list. The following time intervals are available by default:
- 1, 5, 10, 15, and 30 minutes
- 1, 3, 6, and 12 hours
- 1, 2, 15, and 30 days
- 3 and 6 months
- 1, 2, and 3 years
If necessary, the system administrator can create, edit, or delete time intervals.
- To display data for a custom time interval, click the
 button icon to the left of the time axis, select the required interval on the time axis, and click the Apply button. If you need to change the scale again, repeat this step.
- If you need to display data for a fixed time interval, select the relevant time interval from the Scale drop-down list. The following time intervals are available by default:
The chart will show the data intervals in the colors specified for the selected markups.
Page topCopying a markup
You can create a markup by copying a previously created one. Copying will create a markup whose settings match those of the original at the time of copying.
The functionality is available after a license key is added.
To copy a markup:
- In the main menu, select the Models section.
- In the asset tree, next to the name of markup that you want to copy, open the vertical menu and select Copy markup.
The Copy markup pane appears on the right.
- Specify the name of the markup in the Name field.
By default, the markup is assigned a name in the following format:
<name of the original markup>_Cloned_<date and time of cloning>. - In the Asset drop-down list, select the asset to which you want to assign the markup.
- Click the Save button.
The new markup will be displayed in the Markups group of the asset tree. The Markups group is created automatically and displayed as part of the selected section of the asset tree.
Page topModifying the markup
You can edit the markup settings.
Markup settings cannot be edited for imported ML models and ML models that were created by cloning imported ML models or based on a template of imported ML models.
The functionality is available after a license key is added.
To edit markup:
- In the main menu, select the Models section.
- In the asset tree, select the markup that you want to edit.
A list of options appears on the right.
- Click the Edit button.
- Adjust the markup settings, if needed. For a description of the settings, see the instructions on creating markup.
- In the upper-right corner of the window, click the Save button.
Removing markup
You can delete markup if it is not used for training or inference of any ML model.
The functionality is available after a license key is added.
To delete markup:
- In the main menu, select the Models section.
- In the asset tree, select the markup that you want to delete.
A list of options appears on the right.
- In the upper-right corner of the window, click
 .
. - In the window that opens, confirm the deletion of the markup.
Working with imported ML models
This section provides information about working with imported ML models and their elements.
The functionality is available after a license key is added.
ML models can be provided by Kaspersky specialists or certified integrators within the Kaspersky MLAD Model-building and Deployment Service. Such ML model must be imported to Kaspersky MLAD and activated. You cannot create new elements for an imported ML model, or delete existing elements.
Upon importing into Kaspersky MLAD the ML model is already trained. You can train the predictive elements and elliptic envelope-based elements as part of the imported ML model before running inference and/or publishing it.
ML model importing
If the ML model was created by Kaspersky specialists or a certified integrator, you can import this ML model into Kaspersky MLAD.
Kaspersky MLAD may slow down its operation when importing an ML model whose size exceeds 1 GB.
System administrators and users who have the Upload models permission from the Manage ML models group of rights can import ML models. The functionality is available after a license key is added.
To import an ML model:
- In the main menu, select the Models section.
- In the asset tree, next to the name of the asset for which the ML model is to be imported, open the vertical menu and select Import model.
- In the opened window, select the ML model file.
An ML model file is provided as a TAR archive with a maximum size of 1.5 GB.
The ML model will be imported to Kaspersky MLAD. The new ML model displays in the Models group of the asset tree. The Models group is created automatically and displayed as part of the selected section of the asset tree. If the imported ML model contains predictive elements, elliptic envelope-based elements, and/or diagnostic rule-based elements, the Models group will display the Predictive elements, Elliptic envelopes, and/or Rules subgroups, respectively.
After being imported, the ML model is assigned the Not activated status. The ML model must be activated. If you import an ML model that was previously activated and then deleted, you do not need to reactivate the ML model.
Page topActivating an imported ML model
After an ML model prepared by Kaspersky specialists or a certified integrator has been imported into Kaspersky MLAD, it must be activated.
If the ML model activation code is lost, send a request to Kaspersky to receive a new code.
System administrators and users who have the Activate models permission from the Manage ML models group of rights can activate imported ML models. The functionality is available after a license key is added.
To activate an imported ML model:
- In the main menu, select the Models section.
- In the asset tree, select the imported ML model.
The details area appears on the right.
- In the Model activation code field, enter the code received from Kaspersky personnel, and click the Activate button in the upper right part of the window.
ML model is activated. It will be assigned the Trained status. If necessary, you can train the ML model again. For example, you can train it again on new data.
You can to start ML model inference to begin the analysis of telemetry data received from the monitored asset.
Page topChanging the parameters of an element of an imported ML model
You can change some parameters of an element of an imported ML model.
Parameters cannot be changed if the ML model is assigned the Ready for publication or Published status.
System administrators and users who have the Edit untrained models permission from the Manage ML models group of rights can edit the settings of elements of imported ML models. The functionality is available after a license key is added.
To change the parameters of an imported ML model element:
- In the main menu, select the Models section.
- In the asset tree, select the ML model element that you want to change.
A list of options appears on the right.
- In the upper-right corner of the window, click the Edit button.
- Adjust the following element settings, if needed:
- Name and description of the ML model element
- Reminder period
This parameter is unavailable for editing if the ML model is in the Historical inference in progress or Streaming inference in progress state.
Modifying this setting changes anomaly detection sensitivity.
- Period of recurring alert suppression
This parameter is unavailable for editing if the ML model is in the Historical inference in progress or Streaming inference in progress state.
Modifying this setting changes anomaly detection sensitivity.
- Anomaly observation period
This parameter is unavailable for editing if the ML model is in the Historical inference in progress or Streaming inference in progress state.
Modifying this setting changes anomaly detection sensitivity.
- Anomaly duration share in interval
This parameter is unavailable for editing if the ML model is in the Historical inference in progress or Streaming inference in progress state.
Modifying this setting changes anomaly detection sensitivity.
- Color of incident dot indicators
- Incident status and cause
- Detection threshold
This parameter is unavailable for editing if the ML model is in the Historical inference in progress or Streaming inference in progress state.
The detection threshold value was set after training an element of the imported ML model. Modifying this setting changes anomaly detection sensitivity.
- Expert opinion
- In the upper-right corner of the window, click the Save button.
Working with manually created ML models
This section provides information about working with manually created ML models and their elements.
The functionality is available after a license key is added.
When creating an ML model manually, you can add predictive ML model elements, elliptic envelope-based elements, and/or diagnostic rule-based elements, and edit or delete these.
The ML model needs to be trained before you can run inference on it. To do this, all predictive elements and elliptic envelope-based elements within the ML model must be pretrained. If necessary, you can view the training results of the elements. Elements based on diagnostic rules do not need to be trained, so they are considered to be pretrained.
Creating an ML model
System administrators and users who have the Create models permission from the Manage ML models group of rights can create ML models. The functionality is available after a license key is added.
To create an ML model:
- In the main menu, select the Models section.
- In the asset tree, next to the name of the asset for which you want to create an ML model, open the vertical menu and select Create model.
A list of options appears on the right.
- In the Name field, specify the ML model name.
The ML model name must not be longer than 100 characters.
- In the Description field, specify the ML model description.
- If you need to apply markups when selecting data for ML model inference, select the required markups under Inference indicator.
- To view the data that will be selected by the markups, click On graph.
Markups are displayed in the colors selected when they were created.
- In the upper-right corner of the window, click the Save button.
The new ML model displays in the Models group of the asset tree. The Models group is created automatically and displayed as part of the selected section of the asset tree.
Page topAdding a predictive element to an ML model
System administrators and users who have the Create models permission from the Manage ML models group of rights can add ML model elements. The functionality is available after a license key is added.
To add a predictive element to an ML model:
- In the main menu, select the Models section.
- To add a predictive element, do the following:
- In the asset tree, next to the name of the ML model to which you want to add a predictive element, open the vertical menu and select Create element.
- In the window that opens, select the element type Predictive element.
- Click the Create button.
A list of options appears on the right.
- In the asset tree, next to the name of the ML model to which you want to add a predictive element, open the vertical menu
- In the Name field, specify the name of the ML model element.
- Enter a description for the ML model element in the Description field.
- In the General element settings block, do the following:
- In the Reminder period (sec) field, specify the period in seconds, upon reaching which the ML model will generate a repeated incident if anomalous behavior is retained in each UTG node.
The default value of this setting is
0, which corresponds to no reminders. - In the Period of recurring alert suppression (sec) field, specify the period in seconds during which the ML model does not log repeated incidents for the same element.
The default value of this setting is
0(repeat incidents not suppressed). - In the Anomaly observation interval (sec) field, enter the period (in seconds) during which the anomalous behavior of the tag is monitored to make a decision regarding incident registration.
- In Anomaly duration share in interval, enter as a decimal fraction the proportion of the period in Anomaly observation interval (sec) that must elapse for the ML model element to register an incident.
You can specify a value in the range of
0to1. - In the Color of incident dot indicators field, select the color of the indicator points of the incidents logged by the ML model element on the graphs in the Monitoring and History sections. This color will also be used to display the graph of the artifact generated by this element.
- If necessary, in the Incident status drop-down list, select a status to be automatically assigned to incidents logged by the ML model element.
- If necessary, in the Incident cause drop-down list, select the cause to be automatically set for incidents logged by the ML model element if this cause is known in advance.
- In the Detection threshold field, specify a prediction error threshold value upon reaching which an incident is logged.
The value of this parameter will be automatically adjusted after training the ML model element. If necessary, you can change the value of this parameter.
- If required, in the Expert opinion field, specify the expert opinion that will be automatically generated for incidents registered by the ML model element if the contents of this opinion are known in advance.
- In the Reminder period (sec) field, specify the period in seconds, upon reaching which the ML model will generate a repeated incident if anomalous behavior is retained in each UTG node.
- Select one of the following ML model predictive element architectures: Dense, RNN, CNN, TCN, Transformer, or LR.
- If necessary, turn on the Advanced neural network settings toggle switch.
The toggle switch is only available for elements with a Dense, RNN, CNN, TCN, or Transformer architecture.
- In the Main settings block, do the following:
- In the Grid step (sec) field, specify the element's UTG period (in seconds) expressed as an integer or decimal.
- In the Input tags drop-down list, select one or more tags that serve as the source data for predicting the values of the output tags.
- In the Output tags drop-down list, select one or several tags whose behavior is predicted by the model element.
- In the Smoothing factor field, specify the cumulative prediction error smoothing factor in decimal format.
The higher the coefficient, the less smoothing is applied to the data.
- In the Prediction error power exponent field, specify the power to which the prediction error value is raised at each UTG node before calculating the cumulative error.
- In the Window settings block, do the following:
- In the Input window (steps) field, specify the size of the input value window, from which the ML model element predicts the output values.
The window size is indicated in the number of UTG steps.
- In the Output window offset field, specify the number of UTG steps by which the beginning of the output window will be shifted relative to the beginning of the input window.
- In the Output window (steps) field, specify an output tag prediction length calculated from the input tags on the input window.
- In the Input window (steps) field, specify the size of the input value window, from which the ML model element predicts the output values.
- If extended setup mode is enabled and you are adding an element with a Dense architecture, do the following:
- In the Multipliers for calculating number of neurons per layer field, provide the multipliers, separated by a comma without spaces, by which to multiply the number of input tags to calculate the number of neurons in the ML model element layers.
The default value of this parameter is
8,4,8. - In the Activation function per layer field, specify one of the following activation functions on each layer of an ML model element separated by a comma without spaces:
relu: A non-linear activation function that converts an input value to a value between0and positive infinity.selu: A monotonically increasing function that enables normalization based on the central limit theorem.linear: A linear function that is a straight line proportional to the input data.sigmoid: A non-linear function that converts input values to values between0and1.tanh: A hyperbolic tangent function that converts input values to values between-1and1.softmax: A function that converts a vector of values to a probability distribution that adds up to1.
The default value of this setting is
relu,relu,relu. - In the Regularization field, specify the regularization coefficient in decimal format to prevent overfitting of the ML model element.
The default value of this parameter is
0.
- In the Multipliers for calculating number of neurons per layer field, provide the multipliers, separated by a comma without spaces, by which to multiply the number of input tags to calculate the number of neurons in the ML model element layers.
- If extended setup mode is enabled and you are adding an element with an RNN architecture, do the following:
- In the GRU neurons per layer field, specify the number of GRU neurons on layers separated by a comma without spaces.
The default value of this parameter is
40,40. - In the Number of neurons in TimeDistributed layer field, specify the number of neurons distributed in time on the layers of the decoder separated by a comma without spaces.
The default value of this parameter is
40,20. - If you need to restore data received as input to the network, turn on Use autoencoder toggle switch.
- In the Regularization field, specify the regularization coefficient in decimal format to prevent overfitting of the ML model element.
The default value of this parameter is
0.
- In the GRU neurons per layer field, specify the number of GRU neurons on layers separated by a comma without spaces.
- If extended setup mode is enabled and you are adding an element with an CNN architecture, do the following:
- In the Filter size per layer field, specify the size of the filters for each layer of the element separated by a comma without spaces.
The default value of this parameter is
2,2,2. - In the Number of filters per layer field, specify the number of filters for each layer of the ML model element separated by a comma without spaces.
The default value of this parameter is
50,50,50. - In the Regularization field, specify the regularization coefficient in decimal format to prevent overfitting of the ML model element.
The default value of this parameter is
0. - In the MaxPooling window size per layer field, specify the maximum sampling window size on each layer separated by a comma without spaces.
The default value of this parameter is
2,2,2. - In the Number of neurons in decoder field, specify the number of neurons on the layers of the decoder.
- If you need to restore data received as input to the network, turn on Use autoencoder toggle switch.
- In the Filter size per layer field, specify the size of the filters for each layer of the element separated by a comma without spaces.
- If extended setup mode is enabled and you are adding an element with an TCN architecture, do the following:
- In the Regularization field, specify the regularization coefficient in decimal format to prevent overfitting of the ML model element.
The default value of this parameter is
0. - In the Size of filters field, specify the size of the filters for the ML model element.
The default value of this parameter is
3. - In the Number of layers in residual block field, specify the number of residual block layers.
The default value of this parameter is
1. - In the Number of filters per layer field, specify the number of filters for each ML model element layer.
The default value of this parameter is
64. - In the Dilation per layer field, specify the exponential expansion values of the output data on the layers as a comma-separated list.
The default value of this parameter is
1,2,4,8,16. - In the Decoder layer type field, select one of the following types of layer to precede the output layer:
- TimeDistributedDense (default): A fully connected architecture layer.
- GRU: A layer with a recurrent architecture.
- In the Activation function drop-down list, select one of the following activation functions:
- linear: A linear activation function whose result is proportional to the input value.
- relu: A non-linear activation function that converts an input value to a value between zero and positive infinity. If the input value is less than or equal to zero, the function returns a value of zero; otherwise, the function returns the input value.
The default value of this parameter is
linear.
- In the Regularization field, specify the regularization coefficient in decimal format to prevent overfitting of the ML model element.
- If extended setup mode is enabled and you are adding an element with a Transformer architecture, do the following:
- In the Encoder regularization field, specify the regularization coefficient in the encoder in decimal format.
The default value of this parameter is
0.01. - In the Number of attention heads field, specify the number of attention heads.
The default value of this parameter is
1. - In the Number of encoders field, specify the number of encoders.
The default value of this parameter is
1. - In the Multipliers for calculating number of neurons per layer field, provide the factors, separated by a comma without spaces, by which to multiply the number of input tags to calculate the number of neurons in the decoding layers.
The default value of this parameter is
10,5,10.
- In the Encoder regularization field, specify the regularization coefficient in the encoder in decimal format.
- In the upper-right corner of the window, click the Save button.
When the first item in the ML model is created, a Predictive elements group will be automatically created in the asset tree. The newly created element appears in this group.
The ML model element will be assigned the Not trained status, and the ML model to which the added element belongs will be assigned the Not trained status. To run inference on the ML model, all of its predictive elements and elliptic envelope-based elements must be trained.
Page topModifying an ML model predictive element
You can edit the settings of an ML model predictive element.
Parameters cannot be changed if the ML model is assigned the Ready for publication or Published status.
System administrators and users who have the Edit untrained models permission from the Manage ML models group of rights can edit elements of ML models. The functionality is available after a license key is added.
To edit an ML model predictive element:
- In the main menu, select the Models section.
- In the asset tree, select the predictive element that you want to edit.
A list of options appears on the right.
- In the upper-right corner of the window, click the Edit button.
- Adjust the settings of the predictive ML model element, if needed. For a description of the settings, see the instructions on adding a predictive ML model element.
Editing the Reminder period (sec), Period of recurring alert suppression (sec), Anomaly observation interval (sec), Anomaly duration share in interval, Detection threshold, and/or Smoothing factor settings changes anomaly detection sensitivity. These parameters are unavailable for editing if the ML model is in the Historical inference in progress or Streaming inference in progress state.
- In the upper-right corner of the window, click the Save button.
- If you have edited the neural network element architecture settings, and the options in Main settings and/or Window settings, confirm that you want to save the changes.
After changes are made to these parameters, the ML model element must be retrained.
The element will be assigned the Not trained status.
Page topAdding an ML model element based on a diagnostic rule
System administrators and users who have the Create models permission from the Manage ML models group of rights can add ML model elements. The functionality is available after a license key is added.
To add an ML model element based on a diagnostic rule:
- In the main menu, select the Models section.
- To add a diagnostic rule, do the following:
- In the asset tree, next to the name of the ML model to which you want to add a diagnostic rule, open the vertical menu and select Create element.
- In the window that opens, select the Rule element type.
- Click the Create button.
A list of options appears on the right.
- In the asset tree, next to the name of the ML model to which you want to add a diagnostic rule, open the vertical menu
- In the Name field, specify a name for the diagnostic rule.
- In the Description field, specify the diagnostic rule description.
- In the General element settings block, do the following:
- In the Reminder period (sec) field, specify the period in seconds, upon reaching which the ML model will generate a repeated incident if anomalous behavior is retained in each UTG node.
The default value of this setting is
0, which corresponds to no reminders. - In the Period of recurring alert suppression (sec) field, specify the period in seconds during which the ML model does not log repeated incidents for the same element.
The default value of this setting is
0(repeat incidents not suppressed). - In the Anomaly observation interval (sec) field, enter the period (in seconds) during which the anomalous behavior of the tag is monitored to make a decision regarding incident registration.
- In Anomaly duration share in interval, enter as a decimal fraction the proportion of the period in Anomaly observation interval (sec) that must elapse for the ML model element to register an incident.
You can specify a value in the range of
0to1. - In the Color of incident dot indicators field, select the color of the indicator points of the incidents logged by the ML model element on the graphs in the Monitoring and History sections. This color will also be used to display the graph of the artifact generated by this element.
- If necessary, in the Incident status drop-down list, select a status to be automatically assigned to incidents logged by the ML model element.
- If necessary, in the Incident cause drop-down list, select the cause to be automatically set for incidents logged by the ML model element if this cause is known in advance.
- If required, in the Expert opinion field, specify the expert opinion that will be automatically generated for incidents registered by the ML model element if the contents of this opinion are known in advance.
- In the Reminder period (sec) field, specify the period in seconds, upon reaching which the ML model will generate a repeated incident if anomalous behavior is retained in each UTG node.
- In the Rule settings block, do the following:
- In the Grid step (sec) field, specify the element's UTG period (in seconds) expressed as an integer or in decimal format.
- If necessary, turn on the Treat inconclusive result as positive toggle switch.
If Kaspersky MLAD cannot unequivocally evaluate the fulfillment of criteria specified in the Time filter and Tag conditions settings blocks, for example, due to the absence of observations for tags, the application will consider a rule to be triggered when this option is enabled.
- In the Time filter settings block, do the following:
- Click the Add interval button.
- In the Interval type drop-down list, select one of the following time interval types:
- Fixed. If you select this type of interval, specify the days of the week and the time interval during which the input data must be validated according to the specified criteria.
- Recurrent. If you select this type of interval, specify the years, dates, days of the week, and daily time interval for periodically validating input data according to the specified criteria.
- If you want to add one more interval, click the Add interval button and complete step 7b.
- To delete an interval, click to the right of the interval.
You can add one or more time intervals. If no time interval is specified, the diagnostic rule is applied in each UTG node.
- To add tag behavior criteria, do the following:
- In the Tag conditions settings block, click the Condition button.
- In the Tag drop-down list, select the tag for which to add a tag behavior criterion.
If you need to check the behavior directly opposite of the selected behavior criterion from the condition block, click the NOT button on the left of the selected tag. The NOT caption in the button will be highlighted in bold.
For example, click the NOT button if you need to add a condition that contains no steps with the specified settings.
- In the Behavior drop-down list, select one of the following tag behaviors that must be tracked:
- Over: the tag value exceeds the specified threshold.
- Below: the tag value falls below the specified threshold.
- Rising: the trendline of tag values is increasing.
- Falling: the trendline of tag values is decreasing.
- Level: there are no pronounced changes in the trendline of tag values.
- Step change: the trendline of the selected tag is displaying abrupt upward or downward shifts.
- Flat: the selected tag is transmitting the same value.
- Spread: abrupt changes in the spread of values are being observed around the trendline of the selected tag.
- In the Window field, specify the number of UTG steps.
- Depending on the value selected for Behavior, do one of the following:
- If you selected Over or Below, specify a tag threshold value in the Threshold field and specify the minimum number of times the threshold value can be breached within a window in the Minimum violations field.
- If you selected Rising, Falling, or Level, use the Threshold slope field to specify the trend slope percentage value that must be exceeded for the trend to be considered as growing or falling, and specify the time interval between adjacent trend estimates in the Evaluation period field.
By default, the Threshold slope setting is not defined. If the setting is not defined, Kaspersky MLAD will determine the trend direction automatically.
By default, the Evaluation period setting has a value of
1. With this value, the trend is estimated at each UTG node. - If you selected Spread, use the Minimum change field to specify the minimum value by which the tag value spread around the trendline can change, and select one of the following spread change directions in the Direction drop-down list: Any, Flare, or Shrink.
By default, the Minimum change setting is not defined. If the setting is not defined, Kaspersky MLAD will determine it automatically.
The tag behavior criterion is met when the tag spread around the trendline increases and/or decreases.
- If you selected Step change, use the Minimum change field to specify the minimum shift value for the tag trendline, and select one of the following tag value change directions from the Direction drop-down list: Any, Up or Down.
By default, the Minimum change setting is not defined. If the setting is not defined, Kaspersky MLAD will determine it automatically.
- If you selected Flat, use the Value field to specify the value that the tag should transmit, and specify the maximum tag value spread in the Spread field.
The Spread parameter is set to zero by default. With this value, any repeating tag value triggers the criterion.
- To add a tag behavior criterion to a condition block, click the plus sign at the bottom of the condition block and repeat steps 8b through 8e.
- If the block contains more than one tag behavior criterion, select one of the following logical operators between the criterion rows by clicking logical operator button:
- AND if you require all of the block criteria to be fulfilled at the same time.
- OR if at least one of the block criteria must be fulfilled.
- If you need to check whether the fulfillment of a pre-condition caused the fulfillment of a post-condition in a future UTG node, add a temporal operator:
- In the Tag conditions settings block, click the Wait button.
The Wait button is available after at least one condition has been added.
- In the Recess (steps) field, specify the following time intervals:
- from is the interval between the pre-condition check node and the UTG node where the post-condition check will start (minimum waiting interval).
- to is the interval between the pre-condition check node and the UTG node where the post-condition check will finish (maximum waiting interval).
The post-condition is checked in the UTG nodes between the minimum and maximum waiting intervals.
- In the Check drop-down list, select one of the following group operators:
- If you require fulfillment of tag behavior criteria from the post-conditions in all UTG nodes between the minimum and maximum waiting intervals, select the All steps group operator.
- To require fulfillment of tag behavior criteria from the post-conditions in at least one UTG node between the minimum and maximum waiting intervals, select the Any step group operator.
The criteria check result is determined in the last node of the maximum waiting interval.
If more than one condition check is performed using the temporal operator, then the result of the check of the previous temporal condition is a precondition for each subsequent check of the temporal condition.
- In the Tag conditions settings block, click the Wait button.
- Select one of the following logical operators between rule blocks by clicking the logical operator button:
- AND if you require the criteria of both condition blocks to be fulfilled.
- OR if the criterion of at least one of the condition blocks must be fulfilled.
- In the upper-right corner of the window, click the Save button.
When the first ML model element is created, a Rules group will be automatically created in the asset tree. The newly created element appears in this group.
If an ML model contains only elements based on diagnostic rules, the model is assigned the Trained status. You can start inference for such an ML model. If the ML model contains untrained predictive elements and/or elliptic envelope-based elements, these must be trained before starting the inference.
Page topChanging an ML model element based on a diagnostic rule
You can change the settings of an ML model element based on a diagnostic rule.
Parameters cannot be changed if the ML model is assigned the Ready for publication or Published status.
System administrators and users who have the Edit untrained models permission from the Manage ML models group of rights can edit elements of ML models. The functionality is available after a license key is added.
To change an element of an ML model based on a diagnostic rule:
- In the main menu, select the Models section.
- In the asset tree, select the element based on a diagnostic rule that you want to edit.
A list of options appears on the right.
- In the upper-right corner of the window, click the Edit button.
- Adjust the diagnostic rule settings, if needed. For a description of the settings, see the instructions on adding a diagnostic rule-based ML model element.
Editing the Reminder period (sec), Period of recurring alert suppression (sec), Anomaly observation interval (sec), and/or Anomaly duration share in interval settings changes anomaly detection sensitivity. These parameters are unavailable for editing if the ML model is in the Historical inference in progress or Streaming inference in progress state.
- In the upper-right corner of the window, click the Save button.
- If Grid step (sec) has been edited, confirm the changes.
Adding an elliptic envelope-based ML model element
System administrators and users who have the Create models permission from the Manage ML models group of rights can add ML model elements. The functionality is available after a license key is added.
To add an elliptic envelope-based ML model element:
- In the main menu, select the Models section.
- To add an elliptic envelope, do the following:
- In the asset tree, next to the name of the ML model you want to add an elliptic envelope to, open the vertical menu and select Create element.
- In the window that opens, select the Elliptic envelope item type.
- Click the Create button.
A list of options appears on the right.
- In the asset tree, next to the name of the ML model you want to add an elliptic envelope to, open the vertical menu
- In the Name field, specify the name of the ML model element.
- Enter a description for the ML model element in the Description field.
- In the General element settings block, do the following:
- In the Reminder period (sec) field, specify the period in seconds, upon reaching which the ML model will generate a repeated incident if anomalous behavior is retained in each UTG node.
The default value of this setting is
0, which corresponds to no reminders. - In the Period of recurring alert suppression (sec) field, specify the period in seconds during which the ML model does not log repeated incidents for the same element.
The default value of this setting is
0(repeat incidents not suppressed). - In the Anomaly observation interval (sec) field, enter the period (in seconds) during which the anomalous behavior of the tag is monitored to make a decision regarding incident registration.
- In Anomaly duration share in interval, enter as a decimal fraction the proportion of the period in Anomaly observation interval (sec) that must elapse for the ML model element to register an incident.
You can specify a value in the range of
0to1. - In the Color of incident dot indicators field, select the color of the indicator points of the incidents logged by the ML model element on the graphs in the Monitoring and History sections. This color will also be used to display the graph of the artifact generated by this element.
- If necessary, in the Incident status drop-down list, select a status to be automatically assigned to incidents logged by the ML model element.
- If necessary, in the Incident cause drop-down list, select the cause to be automatically set for incidents logged by the ML model element if this cause is known in advance.
- In the Detection threshold field, specify the threshold value upon reaching which an incident is registered.
The value of this parameter will be automatically adjusted after training the ML model element. If necessary, you can change the value of this parameter.
- If required, in the Expert opinion field, specify the expert opinion that will be automatically generated for incidents registered by the ML model element if the contents of this opinion are known in advance.
- In the Reminder period (sec) field, specify the period in seconds, upon reaching which the ML model will generate a repeated incident if anomalous behavior is retained in each UTG node.
- In the Grid step (sec) field, specify the element's UTG period (in seconds) expressed as an integer or decimal.
- In the Input tags drop-down list, select one or several tags to include in the ML model.
- In the upper-right corner of the window, click the Save button.
When creating the first ML model element, an Elliptic envelopes group will be automatically created in the asset tree. The newly created element appears in this group.
The ML model element will be assigned the Not trained status, and the ML model to which the added element belongs will be assigned the Not trained status. To run inference on the ML model, all of its predictive elements and elliptic envelope-based elements must be trained.
Page topEditing an elliptic envelope-based ML model element
You can edit the settings of an elliptic envelope-based ML model element.
Parameters cannot be changed if the ML model is assigned the Ready for publication or Published status.
System administrators and users who have the Edit untrained models permission from the Manage ML models group of rights can edit elements of ML models. The functionality is available after a license key is added.
To edit an elliptic envelope-based ML model element:
- In the main menu, select the Models section.
- In the asset tree, select the elliptic envelope-based element that you want to edit.
A list of options appears on the right.
- In the upper-right corner of the window, click the Edit button.
- Adjust the elliptic envelope settings, if needed. For a description of the settings, see the instructions on adding an elliptic envelope-based ML model element.
Editing the Reminder period (sec), Period of recurring alert suppression (sec), Anomaly observation interval (sec), Anomaly duration share in interval, and/or Detection threshold settings changes anomaly detection sensitivity. These parameters are unavailable for editing if the ML model is in the Historical inference in progress or Streaming inference in progress state.
- In the upper-right corner of the window, click the Save button.
- If you have edited Grid step (sec) and/or Input tags, confirm that you want to save the changes.
After changes are made to these parameters, the ML model element must be retrained.
The element will be assigned the Not trained status.
Page topCloning of the ML model element
You can create an ML model element by cloning an element of any ML model. Copying creates an ML model element whose status and state, architecture settings, and learning settings match those of the original at the time of copying. If the original element of the ML model is trained at the time of its copying, the new element of the ML model will display the learning results of the original element.
The functionality is available after a license key is added.
An element used in an imported ML model cannot be copied.
To copy an ML model element:
- In the main menu, select the Models section.
- In the asset tree, next to the name of the ML model element that you want to copy, open the vertical menu and select Copy element.
The Copy element pane appears on the right.
- Specify the name of the element in the Name field.
By default, an ML model element is assigned a name in the following format:
<name of the original ML model element>_Cloned_ <date and time of cloning>. - In the Model drop-down list, select the ML model to copy the selected item to.
- Click the Save button.
The new ML model element will be displayed within the corresponding group of elements of the selected ML model.
Page topRemoving an ML model element
When removing an ML model element, Kaspersky MLAD also deletes the inference results of the selected ML model element.
System administrators and users who have the Remove models permission from the Manage ML models group of rights can remove elements of ML models. The functionality becomes available after adding a license key.
You cannot delete an element used in an imported ML model.
To remove an ML model element:
- In the main menu, select the Models section.
- In the asset tree, select the ML model element that you want to delete.
A list of options appears on the right.
- In the upper-right corner of the window, click .
- In the window that opens, confirm the deletion of the ML model element.
Cloning an ML model
System administrators and users who have the Copy models permission from the Manage ML models group of rights can clone ML models.
The functionality is available after a license key is added.
You can create an ML model by cloning a previously added ML model. When cloning, a new ML model is created. The new ML model contains the same elements, statuses and settings of the ML model and its elements, as well as the training state of the elements as the ones of the ML model being cloned at the time of its cloning.
After cloning an ML model that was created manually or from a template based on a manually created ML model, you can add predictive elements, elliptic envelope-based elements, and/or diagnostic rule-based elements to the cloned ML model, and edit or delete them.
After cloning an ML model that was imported into the application or created using a template based on an imported ML model, you cannot change the set of elements of the cloned ML model.
Before running inference, you can change the training settings and retrain the elements of the copied ML model.
To clone an ML model:
- In the main menu, select the Models section.
- In the asset tree, select the ML model that you want to copy.
A list of options appears on the right.
- In the upper-right corner of the window, click
 .
.The Model copying pane appears on the right.
- In the Name field, specify the ML model name.
The ML model name must not be longer than 100 characters.
By default, an ML model is assigned a name in the following format:
<name of the original ML model>_Cloned_ <date and time of cloning>. - In the Asset drop-down list, select the asset to which you want to assign the new ML model.
- Click the Save button.
The new ML model displays in the Models group of the asset tree. The Models group is created automatically and displayed as part of the selected section of the asset tree. If the cloned ML model contains predictive elements, elliptic envelope-based elements, and/or diagnostic rule-based elements, the Models group will display the Predictive elements, Elliptic envelopes, and/or Rules subgroups, respectively.
Page topWorking with ML model templates
This section provides instructions on working with ML model templates.
The functionality is available after a license key is added.
You can create a template of an existing ML model to reuse its algorithm structure, set of elements, and training state at the time of the template creation. You can use a created template to add new ML models.
If the original ML model used as a template was created manually, you can add predictive elements, elliptic envelope-based elements, and/or elements based on diagnostic rules to the ML model created based on such template, as well as modify or delete them.
If the original ML model used to create a template was imported to Kaspersky MLAD, the set of elements of the ML model created based on such a template cannot be changed.
Before run inference on the ML model, train all of its predictive and elliptic envelope-based elements.
Creating a template based on an ML model
System administrators and users who have the Create model templates permission from the Manage ML models group of rights can create templates based on ML models. The functionality is available after a license key is added.
You can create an ML model template based on a previously added ML model. The created templates retain the algorithm structure, set of elements, tag composition, and the training state of the source ML model.
You can generate a template from an existing ML model if all predictive and elliptic envelope-based elements have been trained, and conditions have been set for all diagnostic rule-based elements.
To create a template based on an ML model:
- In the main menu, select the Models section.
- In the asset tree, next to the name of the ML model based on which you want to create a template, open the vertical menu and select Create template.
A list of options appears on the right.
- Specify the name of the template in the Name field.
You can enter up to 100 characters.
By default, a template is assigned a name in the format
Template_<ML model name>_<date and time of template creation>. - To change the names of the template tags, in the Template tag name column specify the new names for the relevant tags.
The template tags are automatically assigned the names of the tags employed in the ML model that was used to create the template. You can specify any other names for template tags. For example, you can use the functional descriptions of the tag roles. The names of the template tags do not have to match the names of the tags of the ML model that was used to create the template.
- Click the Save button.
The new ML model template appears in the Templates group of the asset tree. The Templates group is created automatically and displayed as part of the selected section of the asset tree.
Page topEditing an ML model template
You can edit the settings of a created ML model template.
System administrators and users who have the Edit model templates permission from the Manage ML models group of rights can edit ML model templates. The functionality is available after a license key is added.
To edit an ML model template:
- In the main menu, select the Models section.
- In the asset tree, select the template that you want to edit.
A list of options appears on the right.
- In the upper-right corner of the window, click the Edit button.
- Adjust the settings of the ML model template, if needed. For a description of the settings, see instructions on creating an ML model template.
- Click the Save button.
Creating an ML model based on a template
System administrators and users who have the Create models permission from the Manage ML models group of rights can create ML models based on templates. The functionality is available after a license key is added.
You can create a new ML model based on available templates. When creating an ML model, you can specify the IDs of tags that should be used in the new ML model.
To create an ML model based on a template:
- In the main menu, select the Models section.
- In the asset tree, next to the name of the template that you want to use to create an ML model, open the vertical menu and select Create model.
The Creating a model pane opens on the right.
- Enter a name for the new ML model in the Model name field.
The ML model name must not be longer than 100 characters.
- In the Model tag name column, for each template tag, in the asset tree select the tag that will be used by an ML model that is created from the template.
- Click the Save button.
The new ML model displays in the Models group of the asset tree. The Models group is created automatically and displayed as part of the selected section of the asset tree. If the ML model contains predictive elements, elliptic envelope-based elements, and/or diagnostic rule-based elements, the Models group will display the Predictive elements, Elliptic envelopes and/or Rules subgroups, respectively.
The state of the created ML model will match the training state of the source ML model when the template was created.
Page topRemoving an ML model template
System administrators and users who have the Delete model templates permission from the Manage ML models group of rights can remove ML model templates. The functionality is available after a license key is added.
You can remove an ML model template from Kaspersky MLAD. Deleting a template does not remove ML models based on this template.
To remove an ML model template:
- In the main menu, select the Models section.
- In the asset tree, select the ML model template that you want to delete.
A list of options appears on the right.
- In the upper-right corner of the window, click .
- Confirm deletion of the ML model template.
The selected ML model template will be removed from Kaspersky MLAD.
Page topChanging the parameters of an ML model
You can change the settings of an ML model that was created manually, imported into Kaspersky MLAD, created from a template, or copied.
Markup editing is not available for imported ML models and ML models that were created by cloning imported ML models or based on a template of imported ML models.
System administrators and users who have the Edit untrained models permission from the Manage ML models group of rights can edit the settings of ML model elements. The functionality is available after a license key is added.
To change the parameters of an ML model:
- In the main menu, select the Models section.
- In the asset tree, select the ML model whose settings you want to edit
A list of options appears on the right.
- In the upper-right corner of the window, click the Edit button.
- Adjust the ML model settings, if needed. For a description of the settings, see the instructions on creating an ML model.
- In the upper-right corner of the window, click the Save button.
Training an ML model predictive element
With Kaspersky MLAD, you can train a predictive element for an ML model that was created manually, imported into Kaspersky MLAD, created from a template, or copied.
System administrators and users who have the Train models permission from the Manage ML models group of rights can train elements of ML models. The functionality is available after a license key is added.
To train an ML model element:
- In the main menu, select the Models section.
- In the asset tree, select the predictive element that you want to train.
A list of options appears on the right.
- Open the Training tab and click the Edit button in the upper-right corner of the window.
- In the Data selection interval field, specify the data time interval on which you want to train the ML model.
- To apply markups when selecting data for training the ML model within a selected interval, select one or several markups in the Markups field.
The selected markups will form a learning indicator.
- To view the data that will be selected by the markups, click On graph.
Markups are displayed in the colors that were specified when they were created.
You can select a preset when viewing the data on the graph.
- If you need to configure extended training settings, turn on Advanced training settings toggle switch.
- In Maximum training duration (sec), specify a maximum time in seconds the Kaspersky MLAD server can spend training an ML model.
- In the Validation split field, use a decimal value to specify the share of the validation sample as a percentage of the entire dataset used to train the ML model.
You can specify a value in the range of
0to1.The default value of this parameter is
0.2. - In the Maximum epoch count field, specify the maximum number of epochs for training the ML model.
The default value of this parameter is
500. - In the Patience field, specify the number of epochs with no improvement in training quality to wait before stopping the ML model training process early.
Stopping the ML model training early avoids overfitting of the model. Training in this case is considered to be completed successfully.
The default value of this parameter is
15. - In the Resolution of training results graphs field, use a decimal value to specify the graph resolution for displaying training results on the Training results tab.
You can specify a value in the range of
0to1. - In the Batch size field, specify the number of selection items that must be sent for training within the iteration.
The default value of this parameter is
16.This parameter is not available for an element with TCN architecture.
- In Block count, specify the number of blocks to split the ML model training dataset into.
The default value of this parameter is
4. - In the Inference mode drop-down list, select one of the following values:
- If you want to load all datasets for training into RAM, select Fast inference.
This inference mode allows you to perform inference faster.
- If you want to load datasets into RAM one at a time, select Memory saving mode.
This inference mode allows inference to be performed with minimal expenditure of RAM, but it will take place slower than in Fast inference mode.
- If you want to load all datasets for training into RAM, select Fast inference.
- In the Training mode drop-down list, select one of the following values:
- To load the entire training dataset into RAM, select Load all data to RAM.
- If you want to load one data block at a time into RAM and generate validation blocks from the end of the dataset, select Validate at the end of the dataset.
- If you want to load one data block at a time into RAM without generating validation blocks, select Run validation in each training data block.
Validation data is generated from each training data block.
- In the Memory allocation mode drop-down list, select one of the following settings:
- Reserve minimum amount of free RAM. If this setting is selected, the Trainer service will make sure that the minimum amount of memory specified in the Amount of RAM, MB field remains free when training the ML model.
- Reserve maximum available amount of RAM for model training. If this setting is selected, the Trainer service will use the maximum amount of RAM specified in the Amount of RAM, MB field when training the ML model.
- To consider previous training results while training an ML model on new data, enable the option to Initialize model weights with values from previous training results.
- If you want to shuffle the data to improve the quality of ML model training, enable the Shuffle data option.
- In Initialization of pseudorandom number generator, set a value for generating a pseudorandom number sequence.
- In Learning rate coefficient, set the coefficient to be used for adjusting ML model element weights in each training iteration.
The default value of this parameter is
0.0001. - In the Training optimization algorithm drop-down list, select one of the following algorithms:
- Adadelta is an adaptive learning rate-based algorithm for each dimension.
- Adagrad is the algorithm in which the learning rate depends on the update rate of settings during learning.
- Adam is the algorithm based on adaptive computing of the first-order and second-order momentum of setting distribution.
- RMSprop is the algorithm that uses a moving average of the squared gradient to adaptively normalize the learning rate at each step.
- SGD is the Stochastic Gradient Descent algorithm.
- In the Loss function drop-down list, select one of the following functions:
- MSE: for calculating the root mean square error.
- MSLE: for calculating the logarithmic mean error.
- MAE: for calculating the mean absolute error.
- MAPE: for calculating the mean absolute percentage error.
- In the upper-right corner of the window, click the Save button.
If you change the learning parameters for a previously trained element, you have to confirm the changes.
- In the information block located above the training settings, click the Train element button.
The information block will show the number of the current training epoch of the element.
After the training is complete, you can view the training results of an ML model element in the Training results tab.
After all predictive elements and elliptic envelope-based elements that are part of the ML model have been successfully trained, the model will be assigned a status of Trained. If required, you can retrain the ML model element by clicking Restart training.
Page topTraining an elliptic envelope-based ML model element
With Kaspersky MLAD, you can train an elliptic envelope-based element for an ML model that was created manually, imported into Kaspersky MLAD, created from a template, or copied.
System administrators and users who have the Train models permission from the Manage ML models group of rights can train elements of ML models. The functionality is available after a license key is added.
To train an ML model element:
- In the main menu, select the Models section.
- In the asset tree, select the elliptic envelope-based element that you want to train.
A list of options appears on the right.
- Open the Training tab and click the Edit button in the upper-right corner of the window.
- In the Data selection interval field, specify the data time interval on which you want to train the ML model.
- To apply markups when selecting data for training the ML model within a selected interval, select one or several markups in the Markups field.
The selected markups will form a learning indicator.
- To view the data that will be selected by the markups, click On graph.
Markups are displayed in the colors that were specified when they were created.
You can select a preset when viewing the data on the graph.
- If you need to configure extended training settings, turn on Advanced training settings toggle switch.
- In Sample fraction for estimating the mean and covariance, enter as a decimal fraction the proportion of the training sample the covariance and mean are being calculated on.
You can specify a value in the range of
0to0.5inclusive. - In Outliers in sample, enter as a decimal fraction the proportion of outliers (anomalies) in the training sample.
You can specify a value in the range of
0to1. This setting automatically overrides the Detection threshold as set when the element was created. As the percentage of outliers in the training data increases, the threshold for registering an incident decreases. After training the element, you can adjust the incident registration threshold manually. - In Initialization of pseudorandom number generator, set a value for generating a pseudorandom number sequence.
- In the Resolution of training results graphs field, use a decimal value to specify the graph resolution for displaying training results on the Training results tab.
You can specify a value in the range of
0to1. The higher the value, the better the quality of the graphs. - If you assume that the tag values are centered and their mean is equal to zero, turn on Data is centered toggle switch.
- In the upper-right corner of the window, click the Save button.
If you change the learning parameters for a previously trained element, you have to confirm the changes.
- In the information block located above the training settings, click the Train element button.
After the training is complete, you can view the training results of an ML model element in the Training results tab.
After all predictive elements and elliptic envelope-based elements that are part of the ML model have been successfully trained, the model will be assigned a status of Trained. If required, you can retrain the ML model element by clicking Restart training.
Page topViewing the training results of an ML model element
You can view the results of training predictive elements and elliptic envelope-based elements.
System administrators and users who have the Train models permission from the Manage ML models group of rights can view the results of training ML model elements. The functionality is available after a license key is added.
To view the training results of an ML model element:
- In the main menu, select the Models section.
- In the asset tree, select the ML model element whose training result you want to view.
A panel with the settings of the selected element will appear on the right.
- Select the Training results tab.
If the ML model element has been successfully trained, the following information about the training results is displayed in the Training results tab:
- Message about successful completion of training of an ML model element.
If you want to view the training settings for an element that were specified during its creation, click the Training settings button.
- User: The name of the user who started training the ML model element.
- Start of training: The date and time when the Trainer service began training the ML model element.
- End of training: The date and time that training of the ML model element finished. ML model element weights have been updated by the Trainer service.
- Training interval: The time spent by the Kaspersky MLAD server for training the ML model element.
- Total training duration: The duration of data time intervals considering the markups in the training dataset.
- Number of UTG nodes: The number of UTG nodes included in the training set.
- Graphs with learning results for ML model predictive elements:
- Training and validation errors: A graph showing the training and validation errors for each training epoch.
- Model prediction: Graphs showing model predictions for the output tags and the overall prediction error.
- Graphs with learning results for ML model elliptic envelopes:
- Tag deviation—a graph showing the distance of a point, representing the state of a monitored asset at every moment in time within the phase space, from the center of the elliptical region of normal states. The orange horizontal line marks the threshold. It indicates the farthest point at which a condition can still be considered normal.
- Tag values: graphs showing the values of each tag during training.
- Tag value distribution: histograms that show the distribution of values for each tag during training.
- Tag correlation: matrix that shows relationships between tags used when training an ML model element.
Starting and stopping ML model inference
You can start or stop the inference of an ML model in a status of Trained or Published on historical or incoming telemetry data.
The functionality is available after a license key is added.
To start the ML model inference:
- In the main menu, select the Models section.
- In the asset tree, select the ML model whose inference you want to run.
A list of options appears on the right.
- Select the Inference tab.
- In the Inference type drop-down list, select one of the following values:
- Historical to run ML model inference on historical telemetry data. If you select this value, specify the data time interval for running the ML model.
- Real-time to run ML model inference on telemetry data that is being received in real time.
- Click the Start button.
When starting a historical inference on previously inferenced data, previous inference results will be deleted.
If historical inference was started, Kaspersky MLAD will add the ML model to the inference queue.
To stop the ML model inference:
- In the main menu, select the Models section.
- In the asset tree, select the ML model whose inference you want to stop.
A list of options appears on the right.
- Select the Inference tab.
- Click the Stop button.
Kaspersky MLAD will stop inference for the selected ML model.
Page topViewing the data flow graph of an ML model
You can view the data flow graph in ML models.
The functionality is available after a license key is added.
To view the data flow graph in an ML model:
- In the main menu, select the Models section.
- In the asset tree, select an ML model, for which you want to view the data flow graph.
A list of options appears on the right.
- Select the Data flow graph tab.
The ML model data flow graph is displayed on the right.
- If you need to view the settings of a graph element, move the mouse cursor over it.
A window listing the values of settings of the selected element will be displayed.
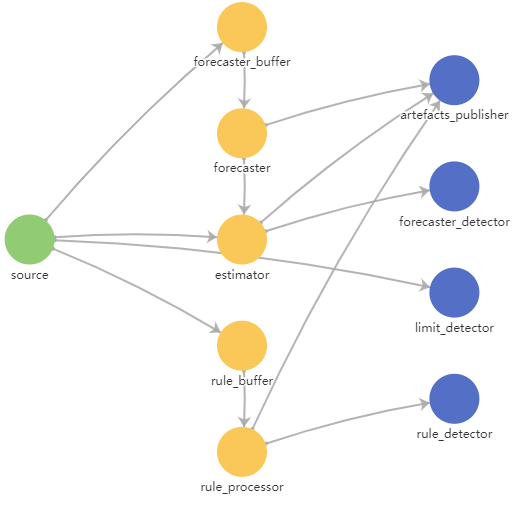
ML model data flow graph
Preparing an ML model for publication
You can prepare the model for publication after training it and checking the inference results. An ML model ready for publishing cannot be modified.
System administrators and users who have the Edit untrained models permission from the Manage ML models group of rights can prepare an ML model for publication. The functionality is available after a license key is added.
To prepare an ML model for publication:
- In the main menu, select the Models section.
- In the asset tree, select the ML model you want to prepare for publication.
A list of options appears on the right.
- Click the Prepare to publish button.
The ML model is assigned the Ready for publication status. Notify the officer responsible for publishing the ML model that it is ready, or, if you have the required permissions, publish the ML model.
To make changes to the ML model before publishing, click the Back to edit mode button. The ML model will revert to a status of Trained.
Page topPublishing an ML model
You can publish an ML model. The ML model will register incidents detected in real-time data from the monitored asset once inference begins. Recorded incidents, unlike those inferred by unpublished ML models, necessitate actions and reporting in production.
System administrators and users who have the Edit untrained models permission from the Manage ML models group of rights can publish ML models. The functionality is available after a license key is added.
To publish an ML model:
- In the main menu, select the Models section.
- In the asset tree, select the ML model that you want to publish.
A list of options appears on the right.
- Click Publish.
The ML model is assigned the Published status.
Page topRemoving an ML model
You can delete previously created and/or imported ML models from Kaspersky MLAD. You can reload a previously imported and subsequently deleted ML model, if needed.
After the ML model is removed, its artifacts, such as predictions, individual errors, prediction errors, or rule progress indicators, as well as incidents registered by the ML model, will be deleted.
System administrators and users who have the Remove models permission from the Manage ML models group of rights can remove ML models. The functionality is available after a license key is added.
To remove an ML model:
- In the main menu, select the Models section.
- In the asset tree, select the ML model to be deleted.
A list of options appears on the right.
- In the upper-right corner of the window, click .
- Confirm deletion of the ML model.
The selected ML model will be removed from Kaspersky MLAD.
Page topManaging presets
A preset is a set of tags generated by a user in arbitrary order or created automatically when an incident is registered. A set of tags in a custom preset can correspond to a certain aspect of the technological process or a section of the monitored asset.
You can create custom presets under Presets. The presets created by you are displayed only for your user account.
When creating presets, you can do the following:
- Select tags whose data to display on the graphs under History and Monitoring.
- Manage graphic areas within a preset. A graphic area is a collection of tags whose data is displayed together by overlapping on a single graph in History and Monitoring sections. A graphic area can display data for one or more tags in a preset.
- Control the display of preset tags in Time slice section. To do this, you can define expressions with basic arithmetic operations, such as addition, subtraction, multiplication, or division, to calculate the values of the tags within the preset.
Custom presets and their tags are displayed as a tree on the left side of the window. You can use the  and
and  buttons to the left of the preset names to display or hide tags included in the presets.
To view incoming data on the graphs under History and Monitoring, upload presets to Kaspersky MLAD from a JSON file.
You can edit presets, save them to JSON, or delete.
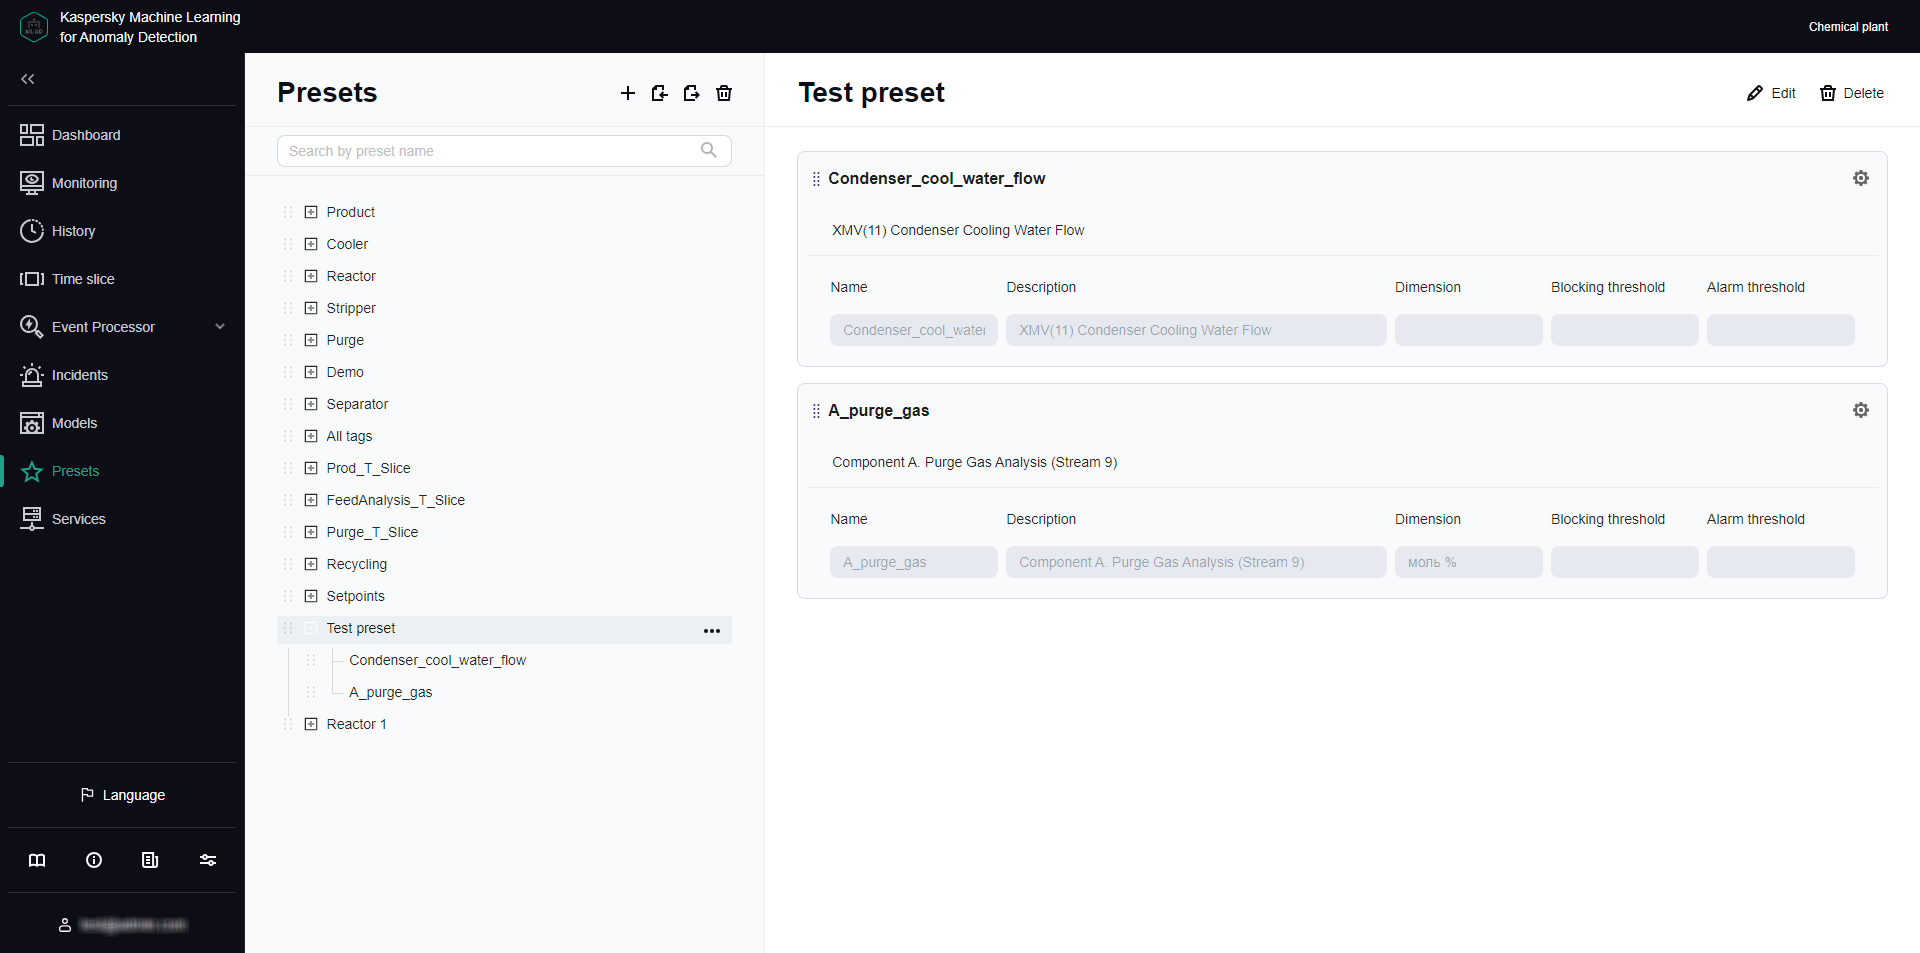
Presets section
Viewing a preset
You can view presets you created and uploaded to Kaspersky MLAD for your monitored asset.
To view a preset:
- In the main menu, select the Presets section.
- On the page that opens, select the relevant preset from the preset tree on the left.
A list of the graphic areas included in the selected preset will appear on the right.
- To view the details of the tags in a preset, do the following:
- Click the button on the left of the preset name.
A list of included tags is displayed under the selected preset.
- To view tag settings, click the tag in the preset.
A list of tag settings defined when the tag was created appears on the right.
- Click the
If necessary, you can change the preset or create a new preset.
Page topCreating a preset
Kaspersky MLAD allows you to create presets and configure how the results are displayed in the Time slice view.
You can define graphic areas. Graphic areas define the composition of tags whose data is displayed on the same graph and the place where the tag graph is displayed under History and Monitoring. Graphic areas that contain a single tag are referred to as single-tag graphic areas. Single-tag graphic areas are created automatically after you select tags for the preset.
If necessary, you can specify an expression to use for calculating the values of tags in the preset to display these values on the graph in the Time slice section. For example, you can use the specified expressions to view individual tag errors, predicted tag values, and the values of tags received from the monitored asset's sensors at the same time. You can use the following variables in your expressions:
- $tagValue is the received tag value (based on the results of monitoring).
- $tagError is the individual tag error.
- $tagPrediction is the predicted tag value.
- $tagX is the X coordinate of the monitored asset's sensor location specified when creating the tag.
- $tagY is the Y coordinate of the monitored asset's sensor location specified when creating the tag.
- $tagZ is the Z coordinate of the monitored asset's sensor location specified when creating the tag.
To create a new preset:
- In the main menu, select the Presets section and click the
 button.
The Create preset pane appears on the right. The asset tree appears on the left side of the pane.
- Specify the name of the preset in the Preset name field.
- In the asset tree, select the check boxes next to the tags that you want added to the preset.
To include all tags associated with a particular preset, choose that preset from Select preset. Find and add a tag by typing its name into the Search by tag name field, then select the relevant tag.
If you need to delete tags from a preset, clear the check boxes next to the tags you want to delete in the asset tree.
- Click Save selection.
Graphic areas automatically generated for each selected tag appear on the right. The number of graphic areas corresponds to the number of tags in the preset.
- To change the preset name, do one of the following:
- Click Delete all areas under Graphic areas to delete all graphic areas associated with the preset.
- Click
 in the upper right corner of the graphic area section and confirm your choice.
Deleting a graphic area does not remove the tags associated with it from the preset. You can add tags from deleted graphic areas to other areas.
- To edit an existing graphic area, do one the following:
- To add a tag to a graphic area, click the plus sign in the graphic area section and select a tag.
To copy the name of a selected tag, click the
button on the right of the relevant name. You can use the copied tag name, for example, as the name of a graphic area. - To remove a tag from a graphic area, click the button next to the tag in the graphic area section.
- To add a tag to a graphic area, click the plus sign in the graphic area section and select a tag.
- To add a graphic area, do the following:
- Click Empty area.
- Select a tag to add to the graphic area.
If the selected tag is used within a single graphic area, the browser window displays a corresponding informational message.
To copy the name of a selected tag, click the
button on the right of the relevant name. You can use the copied tag name, for example, as the name of a graphic area. - To add a further tag or several tags to the graphic area, click the plus sign and select tags.
To copy the name of a selected tag, click the
button on the right of the relevant name. You can use the copied tag name, for example, as the name of a graphic area.
- To add single-tag graphic areas for tags unused in other graphic areas in the preset, click Single-tag graphs.
On the right, single graphical areas will be displayed for tags that were not used in previously created graphic areas.
- If you need to change the position of a graphic area within a preset, drag the graphic area up or down by holding the dots on the left (
 ) of its name.
 - To change the settings for displaying the graphic area under History and Monitoring, do the following:
- Click the
 button in the upper-right corner of the graphic area section.
A panel with the graphic area display settings appears on the right.
- In Graphic area name, provide a name for the graphic area.
- Enter a new graphic area description in Description.
- In the Axis scale mode drop-down list, select one of the following modes:
- Single axis mode: uses one Y-axis to display tag data.
- Cast mode: scales data along the Y-axis for each tag individually, irrespective of data from other tags in the graphic area.
- If you have selected single axis mode, do one of the following:
- Turn on the Automatic toggle button to automatically scale the graph according to the minimum and maximum data values for all tags in the graphic area.
- Turn off the Automatic toggle button and provide an upper and lower display boundary for tags in the graphic area.
If tag values go beyond the defined boundaries, they will not be displayed in the graphic area. The permissible boundaries for displaying tag values take priority over the display of blocking thresholds, even if the Always display blocking threshold function is enabled.
- To add further horizontal threshold lines for tags on the graph, click Add threshold line, and provide a threshold value and line color to display on the graph.
Additional threshold lines help to visualize tag value fluctuations within certain limits. You can add multiple threshold lines.
If you need to delete a previously added threshold line, click the
button next to the specified threshold value and the color of the relevant line. - Click the Save button.
- Click the
- To configure the display of preset in the Time slice section:
- Click Display preset in the Time slice section.
The Display preset in the Time slice section panel appears on the right.
- Turn on the Display preset in the Time slice section toggle button.
- In the X-axis caption field, enter the caption to be displayed on the x-axis.
- To display on the graph the values of preset tags calculated according to the expression, click Add graph and specify the following values:
- In the Name field, enter the name of the expression to be used for calculating the tag values.
- In the Y-axis caption field, enter the caption to be displayed on the y-axis.
- In the Expression for calculation field, enter an expression for calculating tag values.
You can define expressions with simple arithmetic operations (such as addition, subtraction, multiplication, and division). For example, if the sensors are reporting temperature in Fahrenheit, you can use the following expression to display the temperature in Celsius:
5/9 * ($tagValue - 32)
- In the Graph color field, select the color of the graph that will be displayed for the preset in the Time slice section.
If necessary, you can add multiple expressions for the Time slice section.
- If you want to delete an expression from a preset for the Time slice section, click the
 button on the right of the relevant expression.
 - Click the Save button.
- Click Display preset in the Time slice section.
- Click the Save button.
If any preset tags have not been added to at least one graphic area, the browser window displays an informational message. Tags that are not being used in graphic areas will not be displayed on the graphs in the History and Monitoring sections.
The new preset is displayed under Presets in the presets tree on the left and in the presets drop-down list under History and Monitoring. The preset for which step 11 of these instructions was performed will also be displayed in the drop-down list of presets in the Time slice section.
To change the position of presets in the presets tree, drag the preset up or down the tree by clicking and holding the dots () to the left of the preset icon.
Loading presets from a file
You can load presets to Kaspersky MLAD from a JSON file.
To import presets into Kaspersky MLAD from a file:
- In the main menu, select the Presets section.
- In the upper part of the opened page, click the
 button.
 - Select the JSON file containing the preset description on your local drive.
The selected file will be imported into Kaspersky MLAD. The new presets will appear in the preset list in addition to the previously created presets. If the name of the preset imported from a file matches the name of an existing preset, the new preset will be assigned a name set in the JASON file.
Page topEditing a preset
You can edit the presets you created or uploaded.
You can remove tags from a preset using the vertical menu in the preset tree, if needed. To do this, open the vertical menu to the right of the tag, select Delete tag, and confirm your choice.
To edit a preset:
- In the main menu, select the Presets section.
- Perform one of the following actions:
- In the preset tree on the left, select the preset and click Edit in the upper right corner of the page.
- In the vertical menu to the right of the preset, select Edit preset.
The Edit preset pane appears on the right. The asset tree appears on the left side of the pane.
- Edit the following preset settings if needed:
- Preset name.
- The composition of tags in the preset.
When deleting a tag from a preset, Kaspersky MLAD also deletes it from all graphic areas that have used the tag. A single graphic area is automatically created for each tag added to the preset.
- The composition of graphic areas in the preset.
Deleting a graphic area does not remove the tags associated with it from the preset. You can add tags from deleted graphic areas to other areas.
- The composition of tags in the graphic areas.
- The location of the graphic area within the preset.
- Settings for displaying the graphic area in History and Monitoring sections.
- Settings for displaying the preset in the Time slice section
- Click the Save button.
If any preset tags have not been added to at least one graphic area, the browser window displays an informational message. Tags that are not being used in graphic areas will not be displayed on the graphs in the History and Monitoring sections.
The changed preset will be updated in the presets tree under Presets and in the presets drop-down list under History and Monitoring. The modified preset whose display settings in the Time slice section have been defined will also be displayed in the preset drop-down list in Time slice.
To change the position of presets in the presets tree, drag the preset up or down the tree by clicking and holding the dots () to the left of the preset icon.
Saving presets to a file
You can save the presets you created and uploaded to Kaspersky MLAD as a JSON file.
To save the presets you created and uploaded to Kaspersky MLAD to a file:
- In the main menu, select the Presets section.
- In the upper part of the opened page, click the
 button.
The presets that were created and uploaded to Kaspersky MLAD will be saved to a JSON file on the local drive.
Page topDelete presets
You can delete the presets you created or uploaded.
To delete a preset:
- In the main menu, select the Presets section.
- Perform one of the following actions:
- In the preset tree, select the preset and click Delete in the upper right corner of the page.
- In the vertical menu to the right of the preset, select Delete preset.
- Confirm preset deletion.
The preset will be deleted from the list of presets.
To delete all presets:
- In the main menu, select Presets, and click
 above the preset tree.
 - Confirm preset deletion.
All presets will be deleted.
Page topManaging services
The Services section displays a table containing information about services and their statuses. In the Kaspersky MLAD web interface, services are grouped by their functional scope, and the following information is displayed for each service:
- Name is the name of the service.
- Status refers to the current status of the service. Kaspersky MLAD provides the following service statuses:
- Updating: the service has been started, restarted, or stopped with one of the buttons in the Actions column.
- Started: the service is running.
- Starting: the service is starting.
- Error when starting: an error occurred when starting the service.
- Stopped: the service has been stopped.
- Restarting: the service is restarting.
- Not initialized: the service could not be started because Kaspersky MLAD had been started incorrectly.
- Actions are the available actions (start, stop, and restart).
Service statuses cannot be managed under Main in the Kaspersky MLAD web interface.
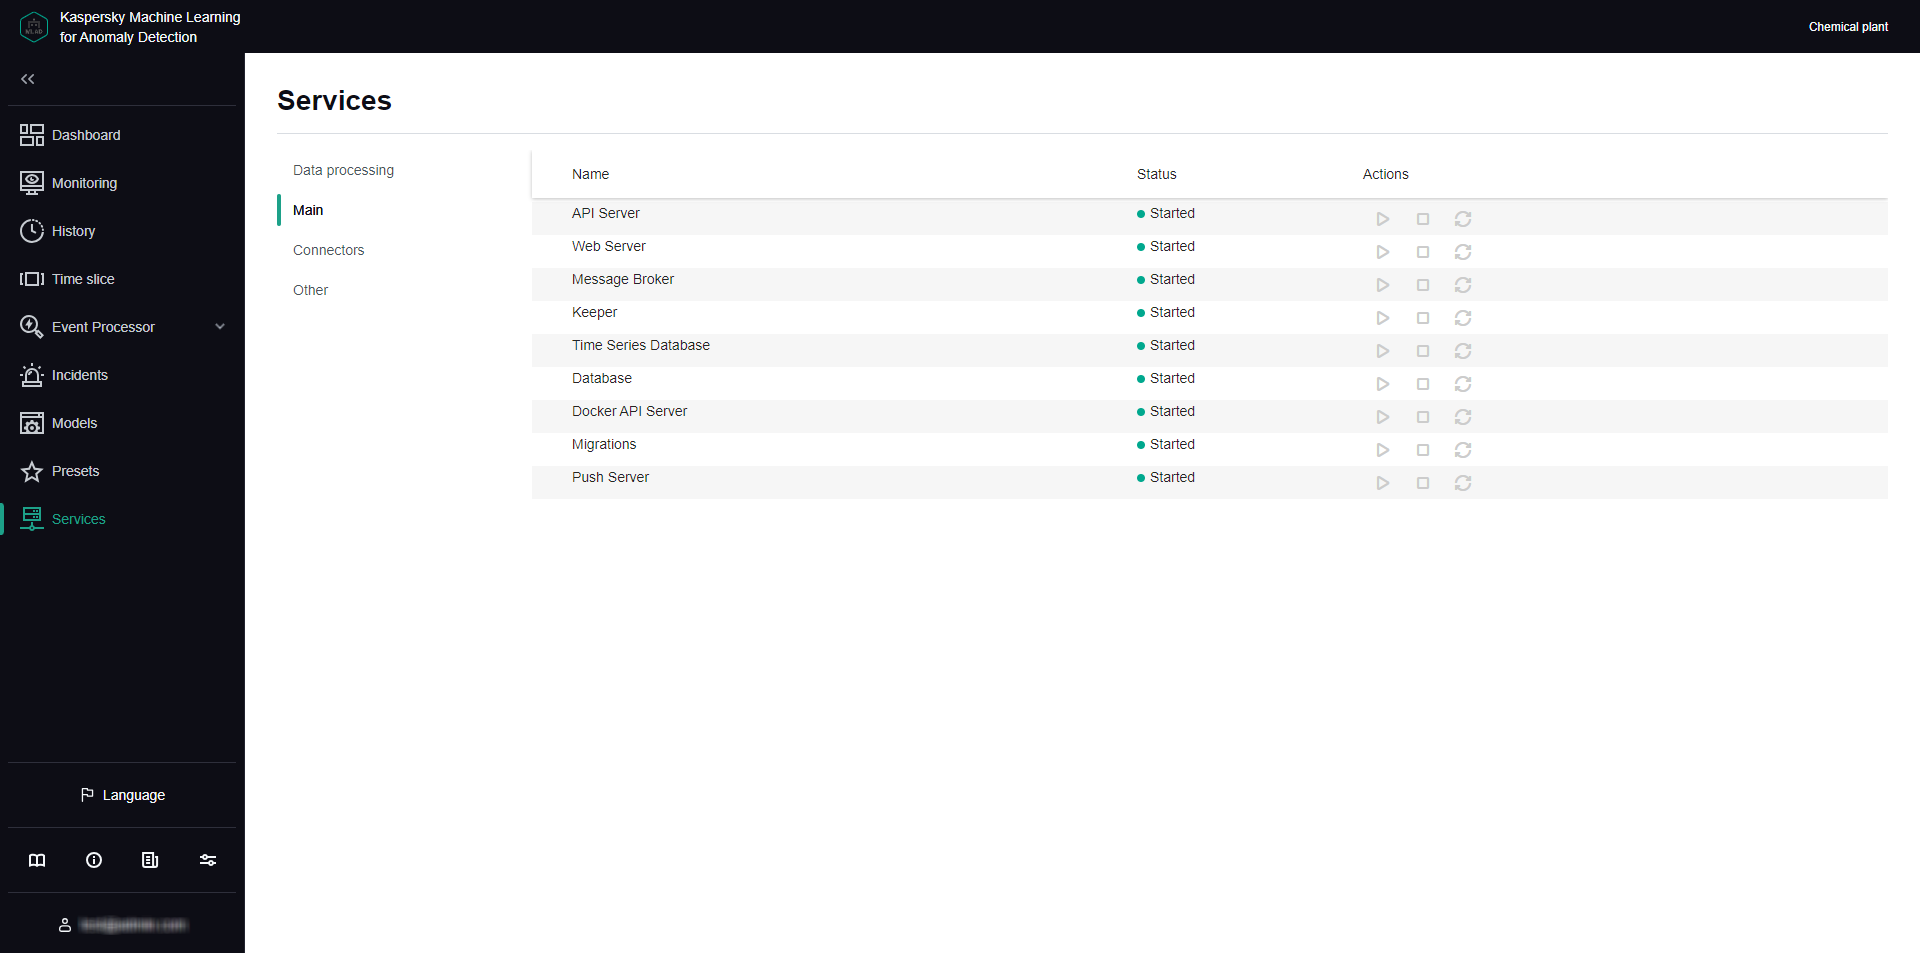
Services section
Viewing the statuses of services
You can view the statuses of services to make sure that the services were successfully started or stopped.
System administrators and users who have the View statuses of application services permission from the Working with application services group of rights can view the statuses of services.
Kaspersky MLAD checks the statuses of services every 30 seconds.
To view the statuses of services:
In the main menu, select the Services section.
The Services section opens, displaying a table with available services, their statuses, and buttons for starting, stopping, and restarting services.
Page topStarting, stopping, and restarting services
Kaspersky MLAD lets you start, stop and restart services.
System administrators and users who have the Manage statuses of application services permission from the Working with application services group of rights can start, stop, and restart services. Management of service statuses under Data processing becomes available after adding a license key.
Service statuses cannot be managed under Main in the Kaspersky MLAD web interface.
Under Services, you can manage the statuses of the following services:
- Anomaly Detector. This service must be enabled and configured if you need to analyze telemetry data and detect anomalies in the behavior of the monitored asset.
- Trainer. This service must be enabled if you need to train ML model elements on telemetry data.
- Similar Anomaly. This service must be enabled and configured if you need to group similar incidents.
- Event Processor. This service must be enabled and configured if you need to detect patterns and abnormal sequences of events.
- Stream Processor. This service must be enabled and configured if you need to convert telemetry data to a uniform temporal grid and log incidents when data loss is detected and data arrives too soon or too late.
- HTTP Connector. This connector must be enabled and configured if you need to receive telemetry data over HTTP or HTTPS.
- OPC UA Connector. This connector must be enabled and configured if you need to receive telemetry data over OPC UA.
- AMQP Connector. This connector must be enabled and configured if you need to receive telemetry data and incident registration messages over AMQP.
- KICS Connector. This connector must be enabled and configured if you need to receive telemetry data from Kaspersky Industrial CyberSecurity for Networks.
- MQTT Connector. This connector must be enabled and configured if you need to receive telemetry data and incident registration messages over MQTT.
- CEF Connector. This connector must be enabled and configured if you need to receive telemetry data and incident registration messages via CEF.
- WebSocket Connector. This connector must be enabled and configured if you need to receive telemetry data and incident registration messages over WebSocket.
- Mail Notifier. This service must be enabled and configured if you need to send registered incident alerts by email.
- Logger. This service must be enabled if you need to maintain and store Kaspersky MLAD logs. This service is enabled by default.
To start, stop, or restart a service:
- In the main menu, select the Services section.
- On the opened page, select one of the following subsections: Data processing, Connectors, or Other.
- Do one of the following for the relevant service:
- If you want to start a service, click
 .
. - If you want to stop a service, click
 .
. - If you want to restart a service, click
 .
.
The new status of the service is displayed in the Status column.
- If you want to start a service, click